Back to Journals » OncoTargets and Therapy » Volume 14
TRPM2-AS Promotes Bladder Cancer by Targeting miR-22-3p and Regulating GINS2 mRNA Expression
Authors Tian Y, Guan Y, Su Y, Yang T, Yu H
Received 15 September 2020
Accepted for publication 19 January 2021
Published 23 February 2021 Volume 2021:14 Pages 1219—1237
DOI https://doi.org/10.2147/OTT.S282151
Checked for plagiarism Yes
Review by Single anonymous peer review
Peer reviewer comments 4
Editor who approved publication: Prof. Dr. Gaetano Romano
Yudong Tian,1 Yanbin Guan,2 Yang Su,1 Tao Yang,1 Haizhou Yu1
1Department of Urology, The First Affiliated Hospital of Zhengzhou University, Zhengzhou, Henan, 450000, People’s Republic of China; 2School of Pharmacy, Henan University of Traditional Chinese Medicine, Zhengzhou, Henan, 450046, People’s Republic of China
Correspondence: Yudong Tian
Department of Urology, The First Affiliated Hospital of Zhengzhou University, No. 1 Longhu Middle Ring Road, Zhengzhou, Henan, 450000, People’s Republic of China
Tel +86 15037183651
Email [email protected]
Background: Bladder cancer (BLCA) refers to the malignancy growth that spreads from the bladder linings to the bladder muscles. However, the impact of miR-22-3p and lncRNA TRPM2-AS on this tumor has generated divergent views in the literature. This research aimed to study the effects of lncRNA TRPM2-AS on BLCA and its interaction with miR-22-3p and GINS2 mRNA.
Methods: qRT-PCR was employed to measure the expression of TRPM2-AS, miR-22-3p and GINS2 mRNA in bladder tissues and cells. The subcellular localization of TRPM2-AS in T24 and 5637 cell lines was identified using a cell fractionation system. Luciferase assay, RIP assay and RNA pull-down assay were later performed to validate the direct binding relationship between TRPM2-AS, miR-22-3p and GINS2 mRNA. Several experiments were conducted to determine the viability, proliferation, colony formation and apoptosis of the cell lines.
Results: Findings indicated that TRPM2-AS was significantly upregulated in BLCA tissues and cell lines. Apart from that, it was observed that TRPM2-AS knockdown significantly inhibited the viability, proliferation and colony formation of BCLA cells, but it promoted the apoptosis of the BCLA cells. A significant downstream target of TRPM2-AS, miR-22-3p was found to show a lower expression level in BLCA tissues and cell lines. However, the inhibition of miR-22-3p considerably enhanced BLCA cell phenotypes. As well as discovering that GINS2 mRNA was a downstream target of miR-22-3p and was significantly upregulated in BLCA, experimental results also indicated that the knockdown of GINS2 suppressed BLCA cell phenotypes.
Conclusion: This research confirmed that TRPM2-AS could promote BCLA by binding to miR-22-3p to increase GINS2 expression. This novel interactome in BLCA cell lines might provide more insights into BLCA therapy.
Keywords: TRPM2-AS, miR-22-3p, GINS2, bladder cancer
Background
Bladder cancer (BLCA) can be described as the malignancy growth that originates from the bladder cells. This cancer is usually associated with males worldwide, and it is ranked ten among all cancer types.1 Although the occurrence and death rate of BLCA is the highest in South Europe, the incidence rate of BLCA in China has skyrocketed in the last 10 years.1,2 Over the years, several clinical methods have been introduced to treat BLCA, such as surgery, chemotherapy and radiation therapy; nonetheless, the survival rate of BLCA patients has not improved with these methods.3,4 To improve the lives of individuals with BLCA, it is imperative that the underlying molecular mechanism of this tumor be properly understood.
Containing more than 200 bp of nucleotides, long non-coding RNA (lncRNA) has been documented to participate actively in cancer development.5–9 The host gene of TRPM2-AS, which belongs to the lncRNA class, consists of three exons. This RNA gene is also located at chromosome 21q22.3 and was first discovered to be upregulated in melanoma in 2008.10 One research discovered TRPM2-AS to be a cancer-promoting gene in several tumors, including reproductive system tumors, digestive system tumors and respiratory system tumors.11–17 Yet, no study has explored the impact of TRPM2-AS on BLCA.
Besides, in the last 10 years, research has demonstrated that small RNAs could participate in the progression of human neoplasms.18 Small RNAs include miRNAs, with a length of 18–29 nucleotides.19,20 Among them, miRNAs play essential roles in cancer progression. While miR-22-3p’s role has been discovered to act as a tumor suppressor in the neoplasms found in the reproductive system, digestive system and respiratory system,21–27 no research has investigated the effect of miR-22-3p in a lncRNA-related interactome complex on BLCA.
Apart from TRPM2-AS and miR-22-3p, GINS2 (GINS complex subunit 2) has been linked to the development of BLCA. Located on chromosome 16q24.1, GINS2 consists of five exons that belong to the GINS complex family.28 The GINS complex is also a member of the DNA replication helicase family, which participates in the initiation of chromosome replication.29,30 Several studies have documented the inability of GINS2 to promote cancer progression.31–39 However, the function of GINS2 in BLCA has not been studied in the literature.
This research aimed to study the regulatory mechanism of TRPM2-AS, miR-22-3p and GINS2 mRNA in BLCA cell lines. It was hypothesized that TRPM2-AS could promote BLCA by binding miR22-3p to increase GINS2 mRNA expression. Our results might provide a better clinical approach to BLCA treatments.
Materials and Methods
Bioinformatic Analysis
Gene Expression Profiling Interactive Analysis (GEPIA), an online gene expression profiling interactive analysis tool, was used to analyze the expression of TRPM2-AS and GINS2 mRNA in bladder tissues with and without BLCA. GSE37815 data, which was downloaded from the GEO database, consisted of the mRNA expression profile of BLCA.
The Encyclopedia of RNA Interactomes (ENCORI) was used to study and predict the miRNAs that could bind to TRPM2-AS. The TargetScan Human v7.2 algorithm was later used to predict the target regulatory miRNAs that could bind to the 3ʹUTR of GINS2 mRNA.
Tissue Samples Collection
A total of 38 BLCA tissues, including their corresponding adjacent tissues, were collected from 38 patients diagnosed with BLCA in the last three years at The First Affiliated Hospital of Zhengzhou University. The clinical tissue samples including 6 non-muscular invasive bladder cancer (NMIBC) and 22 muscular invasive bladder cancer (MIBC) were processed according to the ethical standards set out in the Declaration of Helsinki. Besides, this study was approved by the Ethics Committee of the university, and patients who participated in the study were mandated to sign the informed consent form. The clinical characteristics of participants are summarized in Table 1.
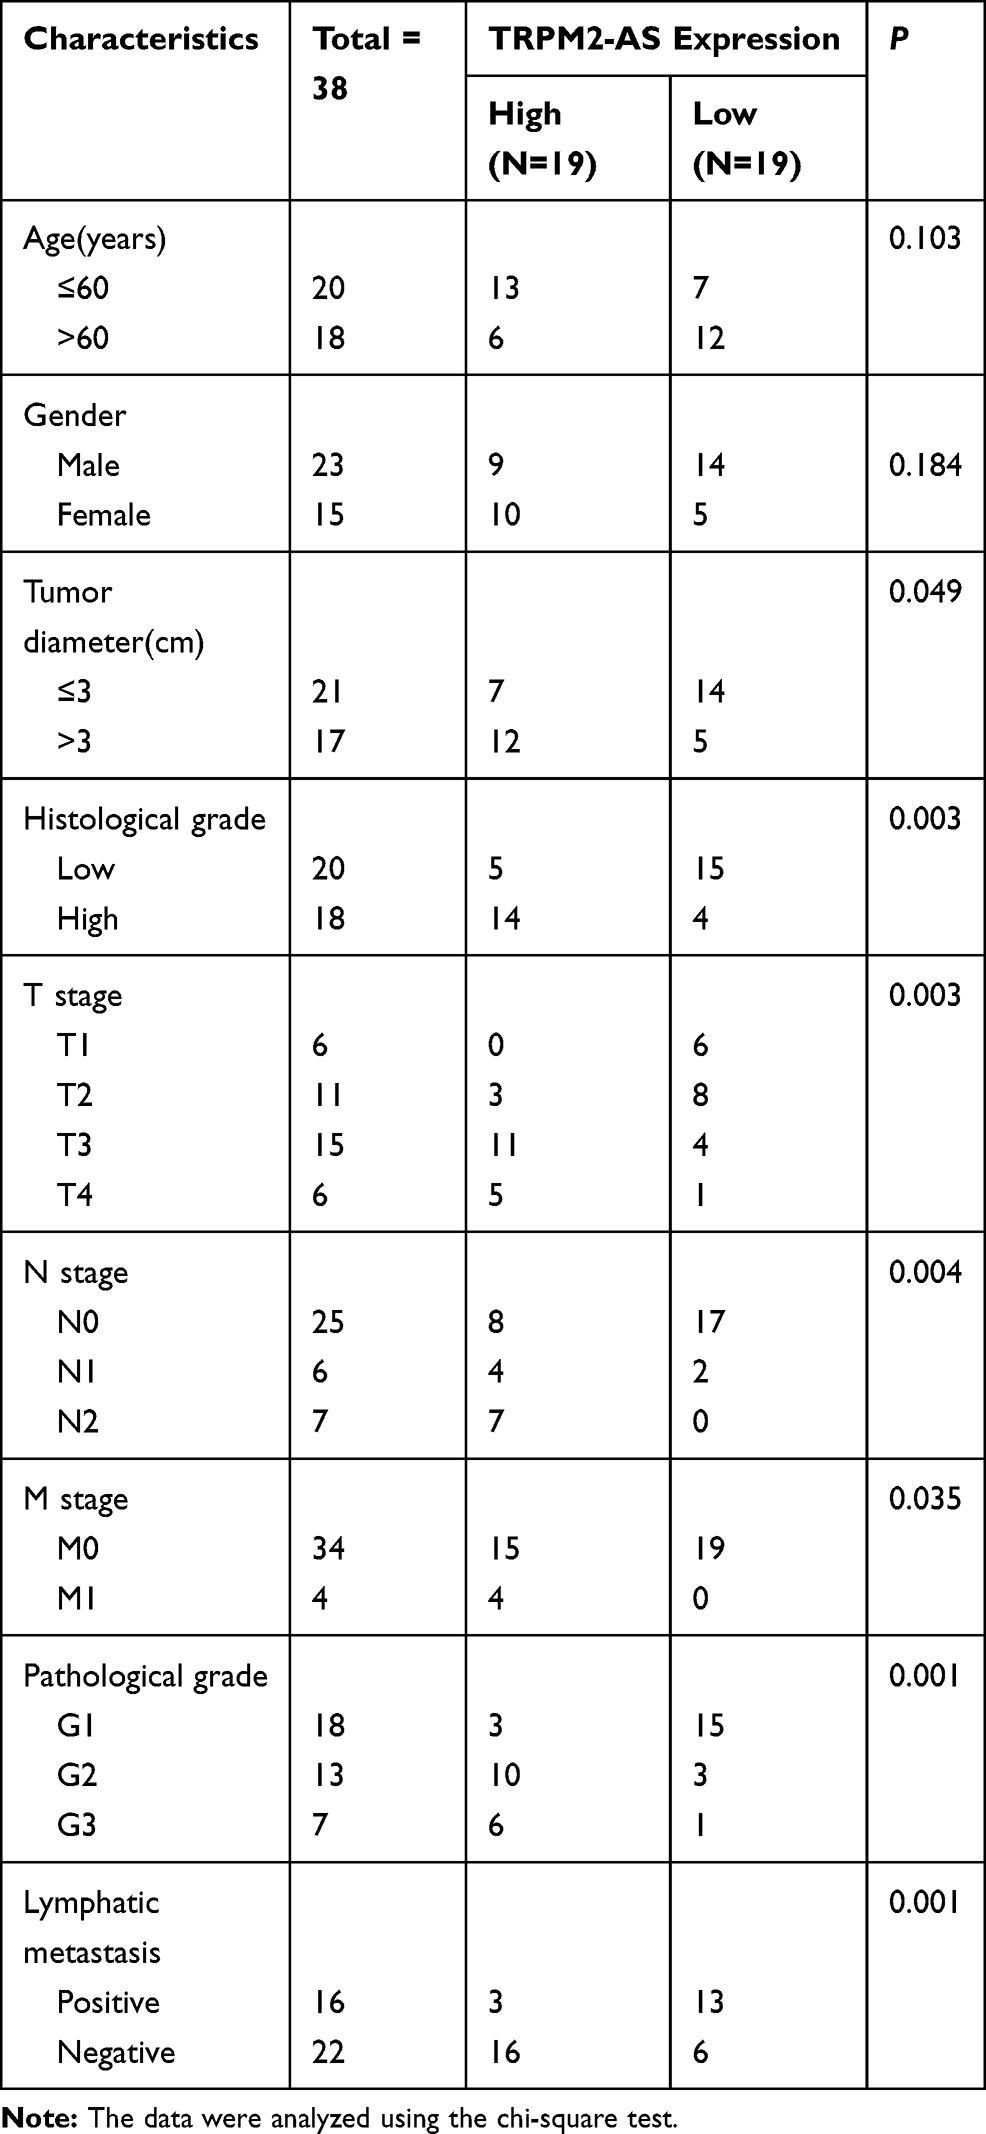 |
Table 1 Correlation Between TRPM2-AS Expression and Clinicopathological Features of Bladder Cancer Patients |
Quantitative Real-Time Reverse Transcription-Polymerase Chain Reaction (qRT-PCR)
The total miRNAs were first isolated from the tissues using the miRcute miRNA Isolation Kit (DP501, Tiangen Biochemical, China) according to the manufacturer’s guideline. Next, the reverse-transcription of miR-22-3p was conducted using the miRcute miRNA First-strand cDNA Synthesis Kit (KR211, Tiangen Biochemical, China), while that of TRPM2-AS and GINS2 was carried out with the PrimeScript RT reagent Kit (RR037A, Takara, Japan). After performing reverse-transcription, qRT-PCR was performed with TB Green Premix Ex Taq II (RR820A, Takara, Japan). The 2−ΔΔCt method was subsequently used to calculate the RNA levels. While GAPDH was utilized as the reference gene for TRPM2-AS and GINS2 mRNA, U6 was used as the reference gene for miR-22-3p. All the primers were provided by GeneCopoeia (Guangzhou, China), and their sequences are shown in Table 2.
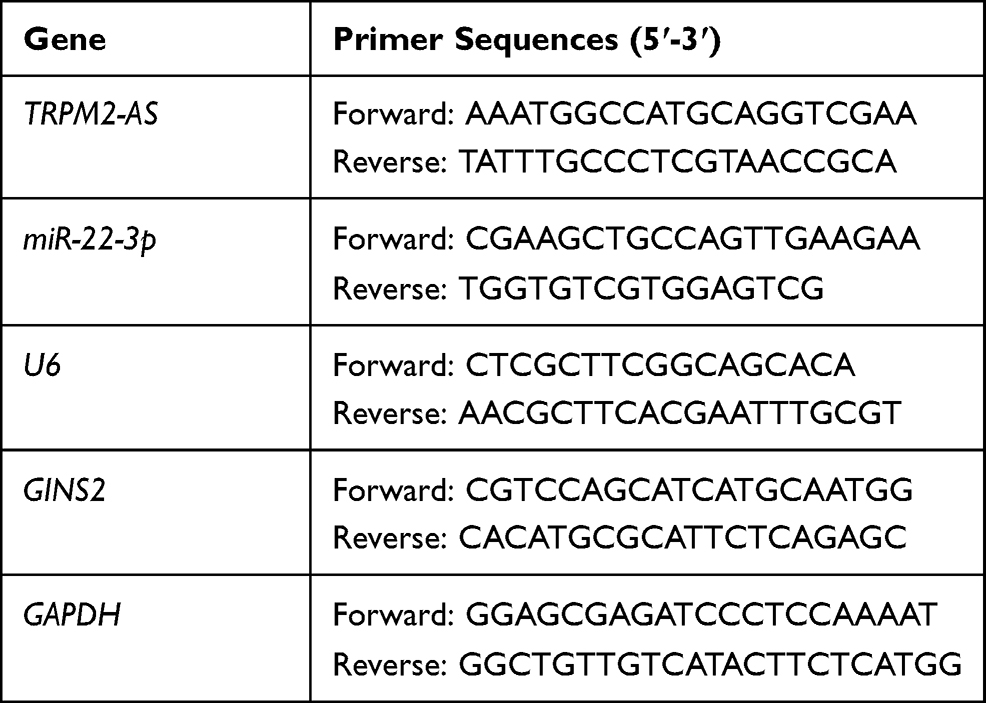 |
Table 2 The Primer Sequences for RT-qPCR |
Cell Line Acquisition and Cell Culture
Both cancerous and normal cell lines were used in this study. The human BLCA cell lines (RT4, T24, J82 and 5637) and the normal urothelial epithelial cell line (SV-HUC-1) were all acquired from the Institute of Basic Medical Sciences (IBMS) of the Chinese Academy of Medical Sciences (CAMS). They were cultured in RPMI 1640 media with 10% serum and then incubated at 37°C in an atmosphere containing 5% CO2.
Subcellular Fractionation Location
The cytoplasmic and nuclear RNAs of T24 and 5637 cells were separated using the Invitrogen PARIS Kit (ThermoFisher, AM1921, USA). During the experiment, GAPDH and U2 served as the cytoplasmic control and nuclear control, respectively. The expression levels of TRPM2-AS, GAPDH, and U2 were later measured using qPCR. Each experimental procedure was processed at least three times.
Cell Transfection
Genomics materials were acquired from GeneCopoeia (Guangzhou, China), such as negative control (NC) plasmids, miR-22-3p inhibitor, and small interfering RNAs for TRPM2-AS (si-TRPM2-AS) and GINS2 (si-GINS2). The transfection of these materials into T24 and 5637 cells (plated in 6-well plates, 3x10⁴/mL) was performed for 48 hours using Lipofectamine 2000 Reagent (Cat#: 11,668,027, ThermoFisher, USA).
Cell Viability Assay
Cell viability was detected with the WST-8 kit. First, 4800 transfected T24 and 5637 cells were seeded into 96-well plates. They were then grown for 24, 48, 72 hours. After that, 10μL cell counting kit-8 reagent (MedChemExpress, HY-K0301, China) was added to the cells, and the mixture was incubated for 4 h. The optical absorbance of every well was finally read at 450 nm with a microplate reader.
BrdU Assay
BrdU assay was performed to evaluate the proliferation ability of the cell lines. First, 3×10⁴/mL T24 and 5637 cells were seeded into 96-well plates for 24 h. After that, 10μL BrdU (5-bromo-2ʹ-deoxyuridine, a thymidine analog, Abcam, ab126556, UK) was added to each well for 4 h. Next, a fixing solution was added to each well to denature the cellular DNA. Each well was then aspirated and washed. After that, the anti-BrdU primary antibody (100 μL/well) was added to the wells to allow the mixture to react for 1 h. Each well was aspirated and washed again. After100 μL/well Peroxidase conjugate Goat Anti-Mouse IgG secondary was added, the cell lines were incubated for 0.5 h. Then, 100 µL/well TMB Peroxidase substrate was added to the cells, and the mixture was incubated in the dark for 0.5 h. To further quantify the proliferation, 100 µL of Stop Solution was added to each well. The optical absorbance of each well was then read at 450 nm with a spectrophotometric microtiter plate reader. All procedures were conducted at room temperature, and experiments in each group were repeated at least three times.
Colony Formation Assay
After 48 hours of transfection, the cells were collected and seeded into a 6-well culture plate with a density of 1×10³ cells per well. The colony formation was observed after 14 days of culture, and the culture was later terminated when the cells formed visible colonies. After that, the medium was discarded, and the cells were rinsed with phosphate-buffered saline (PBS). Next, 4% paraformaldehyde was added to each well for an incubation period of 15 min. Next, the 0.1% crystal violet dye was added to the cells for an incubation period of 30 min. Finally, the colony formation images were taken with a light microscope (Olympus, Japan).
Flow Cytometry Assay
Flow cytometry was carried out to measure cell death and identify the early and late apoptotic cells. Briefly, 1×10⁵/mL T24 and 5637 cells in every group were rinsed in PBS three times and fixed in cold methanol for 30 min at 4 °C. Subsequently, the cells were suspended in 100 μL 1×binding buffer. PBS was subsequently added to each well to wash the cell for three times. Then, the cells were incubated with 5 μL Annexin V and PI staining solution in the dark for 20 min. After that, the cells were passed through the FACS scan flow cytometer (Cytoflex, Beckman Coulter) in an hour. In this study, both early (Annexin V positive and PI negative populations) and late apoptosis (Annexin V positive and PI positive staining) rates were counted as the apoptosis rate.
Caspase-3 Activation Assay
This assay was conducted to further investigate the apoptosis conditions of the cells in each group. The caspase-3 activation was assessed using a Colorimetric Caspase-3 Assay Kit (Cat#: ab39401, Abcam, UK). First, 1×10⁶ transfected T24 and 5637 cells were suspended in 50 μL cold cell lysis buffer for 10 minutes. The protein concentration was later detected and adjusted to ~150 μg protein/50 μL reaction buffer. Then, 50 μL reaction buffer containing 10 mM DTT and 5 μL 4 mM DEVD-pNA substrate was added to the cell lysates for 1 h. The optical absorbance was finally read at 405 nm with a spectrometer.
Luciferase Reporter Assay
The plasmids containing the wild strains and mutants of TRPM2-AS and GINS2 mRNA, with and without the predicted binding sequences, were constructed by and purchased from GeneCopoeia (China). These plasmids were first transfected into the T24 and 5637 cells using Lipofectamine 2000 Reagent (Cat#: ThermoFisher, 11,668,027, USA). Then, the miR-22-3p mimics or NC were co-transfected into the transfected T24 and 5637 cells using Lipofectamine 2000 Reagent. After 48 h, the cells were gathered and lysed with the lysis buffer. The dual-luciferase reporter assay system (Cat#: LF031, GeneCopoeia, China) was used to analyze the relative luciferase activity.
RNA Immunoprecipitation (RIP)
RIP immunoprecipitation assay was performed using the Magna RIP RNA-Binding Protein Immunoprecipitation Kit (Millipore, 17–700, USA). The BLCA cells were lysed in the RIP lysis buffer that contained magnetic beads conjugated with anti-Argonaute2 (AGO2) or anti-IgG antibodies. After the samples were incubated with Proteinase K, the immunoprecipitated RNA was isolated with TRIzol Reagent (ThermoFisher, 15,596,026, USA). Finally, the enrichment of TRPM2-AS and miR-22-3p was measured using qRT-PCR.
RNA Pull-Down Assay
The T24 and 5637 cells (5×10⁶) were treated on ice for 20 minutes with 0.5 mL of 25 mM Tris-HCl, 0.05% NP-40, 70 mM KCl, 2.5 mM EDTA, 80 U/mL RNase inhibitor, and 1×protease inhibitor cocktail. After centrifugation, the supernatant was collected and incubated with biotin-coupled miR-22-3p (bio-miR-22-3p) or biotin-coupled NC (bio-NC) for 2 hours. The cell lysate containing bio-miR-22-3p or bio-NC was then incubated with streptavidin magnetic beads. After 4 h, the beads were washed with reaction buffer to isolate the bound RNAs in the pull-down complex. The expression of pull-down RNA was finally detected using qRT-PCR.
Western Blot Assay
The protein of cells was extracted using RIPA Lysis Buffer that contained 5 mM EDTA and PMSF (P0013B, Beyotime, China). Different groups of proteins were quantified using a spectrophotometer so that the proteins were at the same level. Then, 10% SDS-PAGE gel was used to separate 20μg of the total protein in these groups. The total protein was subsequently transferred onto the PVDF membranes (Millipore, MA, USA) with 5.0% evaporated milk at 37 °C for 1 h. Next, the PVDF membranes were incubated with the primary antibodies against GINS2 (1:500, Cat#: ab197123, Abcam, UK), Bcl-2 (1:2000, Cat#: ab182858, Abcam, UK), Bax (1:5000, Cat#: ab32503, Abcam, UK), Cleaved caspase-3 (1:500, Cat#: ab32042, Abcam, UK) and GAPDH (1:5000, Cat#: ab175781, Abcam, UK) at 4°C overnight. After 24 h, the PVDF membranes were washed three times with PBS and then incubated with Goat Anti-Rabbit IgG H&L secondary antibody (1:5000, Cat#: ab205718, Abcam, UK) at room temperature for 1 h. The ECL Substrate Kit (Cat#: ab133406, Abcam, UK) was subsequently used to strengthen the band signals. FluorChem FC2 software (Media Cybernetics, Inc., Rockville, MD, USA) was used to read the intensities of the protein bands.
Statistical Analyses
The data collected from at least three independent results of every experiment were analyzed using the Graphpad Prism v7.0 software. Data were presented as mean ± SD (standard deviation). The Wilcoxon test method was used to identify the significant differences between two groups, while the one-way ANOVA with the Dunnett’s test was used to identify the significant differences among multiple groups. P-values of less than 0.05 were considered statistically significant.
Results
Identification of Genes of Interest
After interrogating GEPIA database with log2FC >1.5 and adjusted P-value <0.01, findings indicated that lncRNA TRPM2-AS was significantly upregulated (log2FC=1.892, adjusted P-value=1.64×10⁻⁶) in BLCA (Figure 1A). This result means that TRPM2-AS was positively associated with BLCA progression. Interestingly, TRPM2-AS has been proved to be a tumor promoter in colon cancer,13 gastric cancer,12 breast cancer,14 and lung cancer17 by interacting with miRNAs; however, it has never been studied in BLCA. The GSE37815 data were also analyzed from the GEO database, and it was found that GINS2 was among the top 5 most differentially expressed genes (DEGs) with log2FC=1.99 and adjusted P value=0.00462 (Figure 1B). Like TRPM2-AS, GINS2 was considered to be a significant tumor promoter in thyroid cancer32 lung cancer,33 cervical cancer,40 ovarian cancer,38 breast cancer,34 triple-negative breast cancer,35 and leukemia.39 Based on these findings, it was hypothesized in this study that GINS2 might be a tumor promoter in BLCA as well. Figure 1C and D shows the relative expression of TRPM2-AS and GINS2 in BLCA tissues and healthy tissues. Both TRPM2-AS and GINS2 were found to be significantly upregulated in BLCA tissues. Apart from that, GINS2 was discovered to be upregulated in BLCA tissues based on the TCGA samples (Figure 1E). The predicted targets of TRPM2-AS from ENCORI starbase and those of GINS2 from TargetScan Human 7.2 were intersected to identify the potential bridge miRNA between TRPM2-AS and GINS2 (Figure 1F). Among the top 5 out of the total 13 common miRNAs, miR-22-3p was considered to suppress BLCA.41
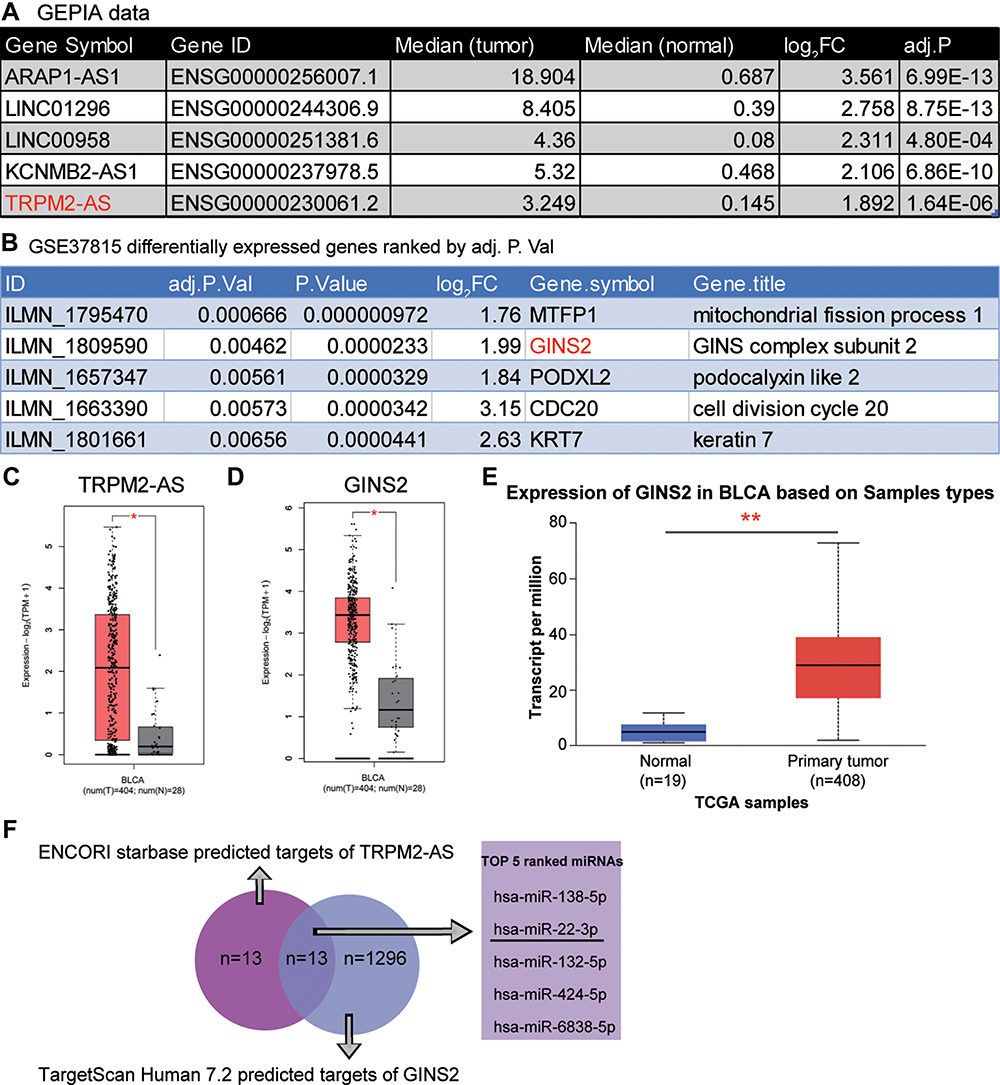 |
Figure 1 The identification of interested interactome in BLCA. (A) The top 5 most significantly upregulated lncRNAs in BLCA using GEPIA database based on the log2|FC| values. FC: fold change; adj.P: adjusted P value. (B) The top five most significantly upregulated mRNAs in BLCA by analyzing GSE37815 data series. (C) The relative expression of TRPM2-AS in BLCA tissues and healthy tissues from GEPIA database. *P < 0.01. (D) The relative expression of GINS2 in BLCA tissues and healthy tissues from GEPIA database. *P < 0.01. (E) The expression of GINS2 in BLCA tissues based on the TCGA database. **P < 0.0001. (F) The identification of the bridge miRNAs between TRPM2-AS and GINS2 mRNA. |
Effects of TRPM2-AS on BLCA Cells
The expression of TRPM2-AS in BLCA tissues collected from participants was first detected to explore the impact of TRPM2-AS on BLCA. The results showed that TRPM2-AS expression increased by 3.6-fold in BLCA tissues compared with normal adjacent tissues (Figure 2A). Furthermore, BLCA tissues were divided into two groups according to the median: the high-expression TRPM2-AS group (N = 19) and the low-expression TRPM2-AS group (N = 19). The data analysis showed that the expression of TRPM2-AS was related to the tumor diameter, histological grade, TNM stage, T stage, N stage, M stage, and lymphatic metastasis (Table 1). Similar to BLCA tissues, TRPM2-AS expression was observed to be higher in four BLCA cell lines (RT4, T24, J82 and 5637) than in the normal urothelial epithelial cell line (SV-HUC-1) (Figure 2B). Due to the highest expression of TRPM2-AS in T24 and 5637 cell lines, the T24 and 5637 cell lines were chosen to conduct our study in depth. Then, the subcellular fractionation location assay was employed to observe the TRPM2-AS location in T24 and 5637 cell lines. The results showed that TRPM2-AS was mainly located in the cytoplasm (Figure 2C). The results of the si-TRPM2-AS, which were used to transfect T24 and 5637 cells, indicated that si-TRPM2-AS decreased TRPM2-AS expression in T24 and 5637 cells by 70% compared with the blank group (Figure 2D). The outcomes of the CCK-8 and BrdU assays revealed that cell viability and cell proliferation were suppressed in the si-TRPM2-AS group compared with the blank groups (Figure 2E and F). Furthermore, the colony-formation assay results showed that the number of colonies decreased by approximately 50% in the cells transfected with si-TRPM2-AS (Figure 2G). Flow cytometry and caspase-3 assay were then employed to observe the effect of si-TRPM2-AS on cell apoptosis in two BLCA cell lines. The flow cytometry assay results demonstrated that the apoptosis rate in the si-TRPM2-AS group rose by approximately 2-fold in the two BLCA cell lines compared with the blank groups (Figure 3A). Besides, the caspase-3 activity in the si-TRPM2-AS group grew by approximately 3-fold in the two BLCA cell lines (Figure 3B). The Western blot assay was used to detect the effect of TRM2-AS downregulation on apoptosis-related proteins in BLCA cells, and the results of this assay showed that compared with the blank group, the protein expression of Bax, cleaved caspase-3 increased in T24 and 5637 cells, while that of Bcl-2 decreased. This outcome further indicated that TRM2-AS knockdown promoted the apoptosis of BLCA cells (Figure 3C).
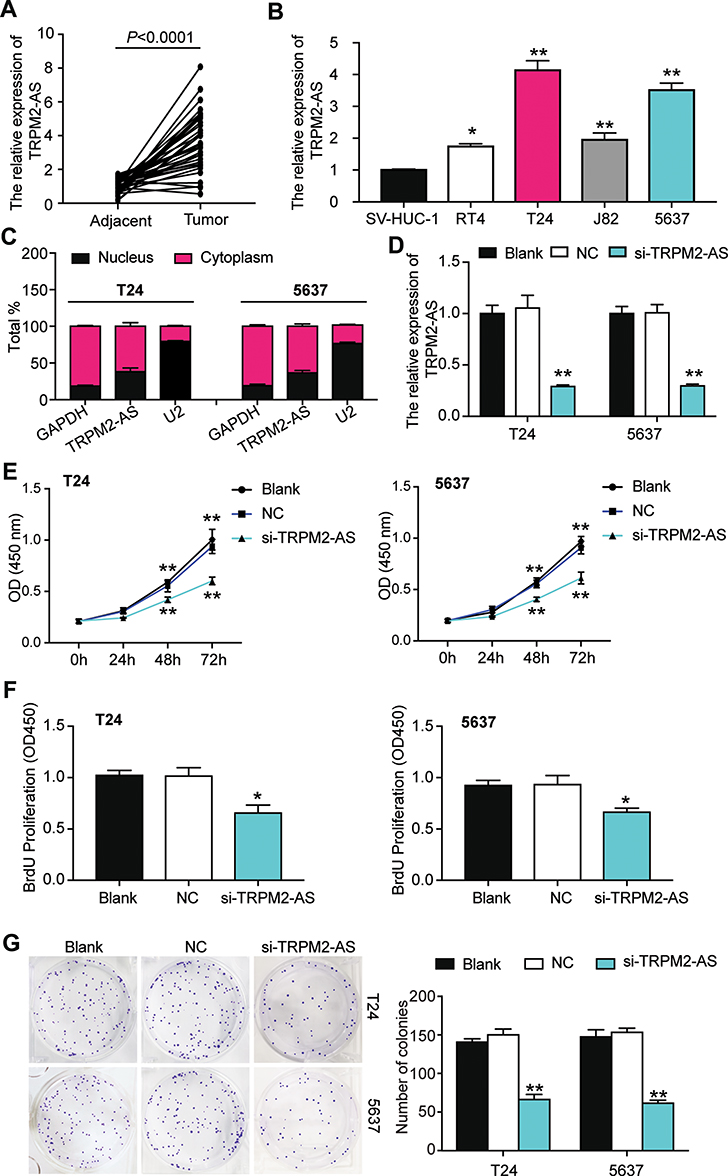 |
Figure 2 The inhibitory effect of si-TRPM2-AS on the proliferation of bladder cancer was confirmed. (A) The expression of TRPM2-AS was increased in BLCA tissues compared with normal adjacent tissues. N=38, Student’s t-test. (B) The expression of TRPM2-AS was higher in four BLCA cell lines (RT4, T24, J82 and 5637) than that in normal urothelial epithelial cell line SV-HUC-1. *P < 0.05, **P < 0.001 compared with SV-HUC-1 cell, ANOVA. (C) The location of TRPM2-AS was majorly in cytoplasm of T24 and 5637 cells. (D) The transfection effectiveness in T24 and 5637 cell lines after transfecting si-TRPM2-AS, negative control and blank control. **P < 0.001 compared with blank group, ANOVA. (E) CCK-8 assay was used to observe the cell viability in T24 and 5637 cell lines after transfecting si-TRPM2-AS, negative control and blank control at 0, 24, 48, and 72 hours. **P < 0.001 compared with blank group, ANOVA. (F) BrdU assay was used to observe the cell proliferation in T24 and 5637 cell lines after transfecting si-TRPM2-AS, negative control and blank control at 48 hours. *P < 0.05 compared with blank group, ANOVA. (G) Colony formation assay was employed to measure the number of colonies after transfecting si-TRPM2-AS, negative control and blank control. **P < 0.001 compared with blank group, ANOVA. |
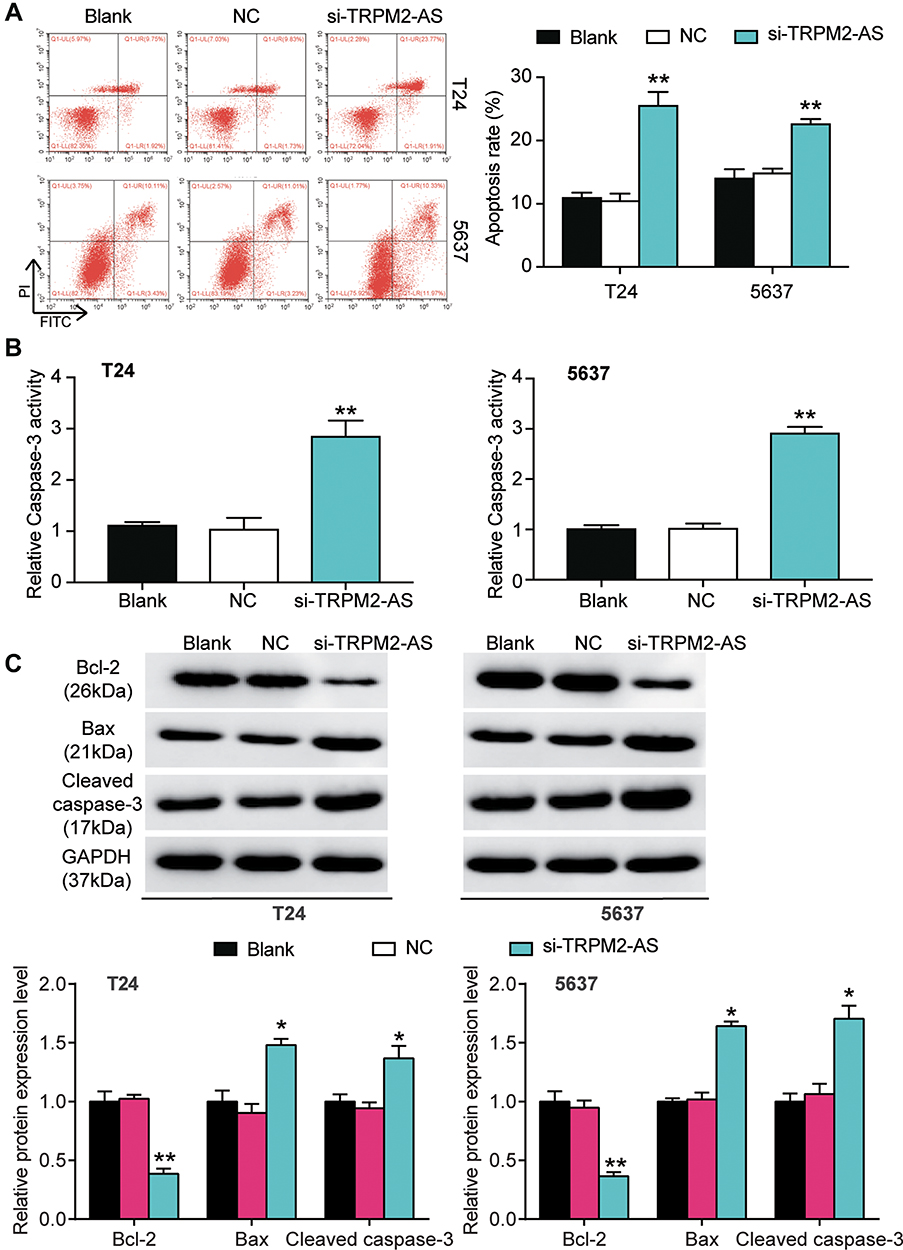 |
Figure 3 The promoting effect of si-TRPM2-AS on apoptosis of bladder cancer was confirmed. (A) Flow cytometry was employed to measure the cell apoptosis after transfecting si-TRPM2-AS, negative control and blank control. **P < 0.001 compared with blank group, ANOVA. (B) The caspase-3 activity assay was employed to measure the caspase-3 activity after transfecting si-TRPM2-AS, negative control and blank control. **P < 0.001 compared with blank group, ANOVA. (C) Western blot assay was employed to measure the protein expression of Bax, Cleaved caspase-3 and Bcl-2 after transfecting si-TRPM2-AS, negative control and blank control. *P < 0.05, **P < 0.001 compared with blank group, ANOVA. |
miR-22-3p: Downstream Target of TRPM2-AS
The binding site between TRPM2-AS and miR-22-3p was discovered after analyzing data with ENCORI starBase (Figure 4A). The results of the luciferase reporter assay demonstrated that the fluorescence intensity decreased by half after co-transfecting TRPM2-AS-wild type and miR-22-3p mimics; however, other groups had no differences in T24 and 5637 cell lines (Figure 4B). After performing the RIP assay, it was discovered that the expression of TRPM2-AS increased by 4.6-fold and 5.1-fold in T24 and 5637 cells, respectively. Put simply, this result confirmed that TRPM2-AS could combine with miR-22-3p (Figure 4C). It was also found that miR-22-3p expression decreased by 65.7% in BLCA tissues compared with normal adjacent tissues (Figure 4D) and that TRPM2-AS was negatively associated with miR-22-3p (Figure 4E). The qRT-PCR outcome even showed a more than 50% decrease in miR-22-3p expression in T24 and 5637 cells compared with SV-HUC-1 cells (Figure 4F). Experimental results also showed that si-TRPM2-AS increased miR-22-3p expression by more than 1.5-fold in T24 and 5637 cells (Figure 4G).
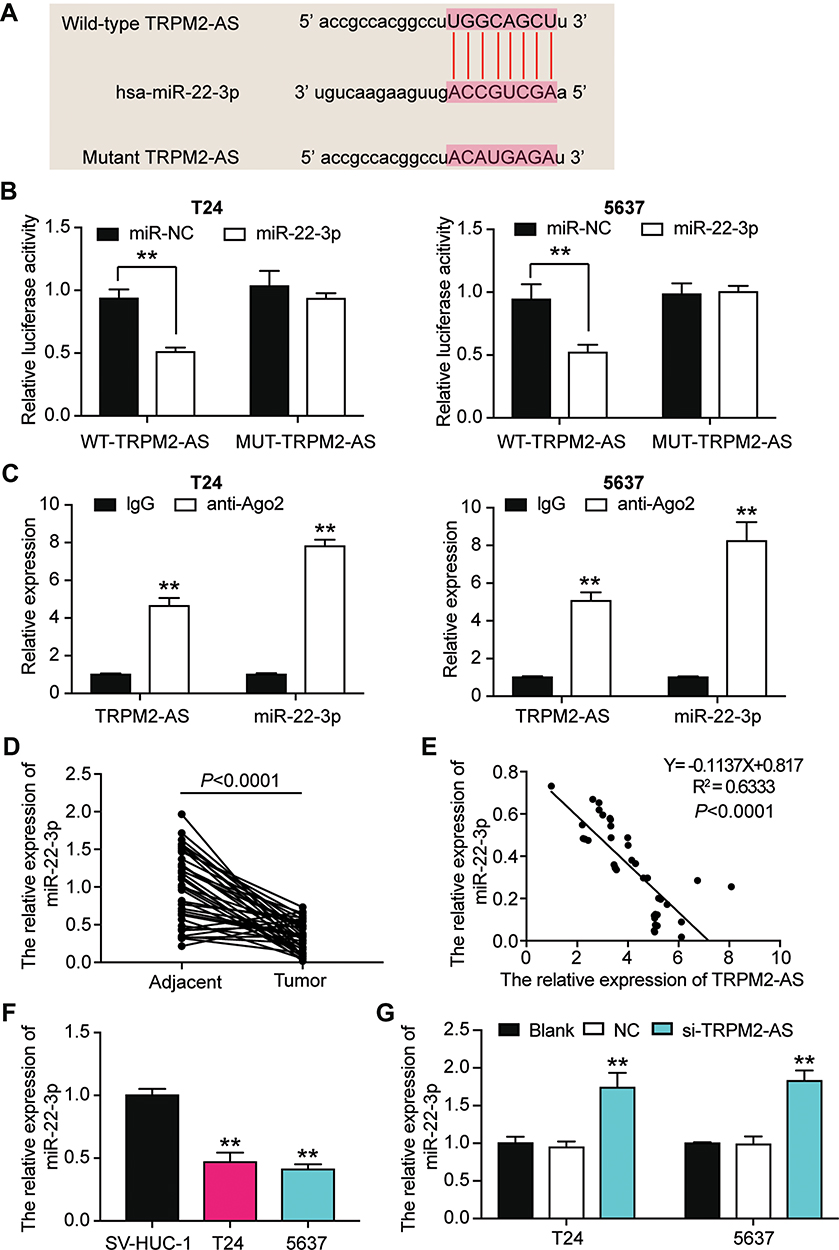 |
Figure 4 The negative correlation between MiR-22-3p and TRPM2-AS. (A) The combine region sequences of TRPM2-AS and miR-22-3p. (B) Luciferase reporter assay was used to assess the targeting relationship between TRPM2-AS and miR-22-3p. **P < 0.001, ANOVA. (C) RIP assay was used to further confirm the targeting relationship between TRPM2-AS and miR-22-3p. **P < 0.001 compared with IgG group, ANOVA. (D) the expression of miR-22-3p was down-regulated in BLCA tissues compared with normal adjacent tissues. N=38, Student’s t-test. (E) TRPM2-AS expression had a negative relationship with miR-22-3p expression. (F) The expression of miR-22-3p was reduced in T24 and 5637 cells compared with SV-HUC-1 cells. **P < 0.001 compared with SV-HUC-1 cells, ANOVA. (G) The expression of miR-22-3p was increased after transfecting si-TRPM2-AS in T24 and 5637 cells by qRT-PCR analysis. **P < 0.001 compared with blank group, ANOVA. |
Interactions of TRPM2-AS and miR-22-3p on BLCA
Several experiments were performed to explore whether TRPM2-AS could regulate BLCA cells’ malignancy phenotypes by regulating miR-22-3p. Before performing experiments, the transfection efficiency of TRPM2-AS siRNA and the miR-22p-3p inhibitor was confirmed using qPCR (Figure 5A). The CCK-8 assay results displayed that the miR-22-3p inhibitor enhanced cell viability, while si-TRPM2-AS weakened it. When the BLCA cells were co-transfected with the miR-22-3p inhibitor and si-TRPM2-AS, no significant differences in terms of cell viability were observed from the blank group (Figure 5B). The results of the BrdU assay showed that the proliferation ability of the cells in the miR-22-3p inhibitor group increased by nearly 1.5 times, while the proliferation ability of the cells in the co-transfection group was similar to that of the blank group (Figure 5C). Moreover, the colony formation assay results showed that while the miR-22-3p inhibitor increased the number of colonies, the si-TRPM2-AS decreased it. When the miR-22-3p inhibitor and si-TRPM2-AS were co-transfected with BLCA cells, no significant difference was observed in the number of colonies between the co-transfection group and the control group (Figure 5D). As for cell apoptosis, the flow cytometry results revealed that the cell apoptosis rate declined by 60% in the miR-22-3p inhibitor group, while the cell apoptosis rate rose by 2-fold in the si-TRPM2-AS group in T24 and 5637 cell lines. Equally important, the cell apoptosis rate in the co-transfection group was found to be the same as that in blank group (Figure 6A). The caspase-3 assay was employed to further study the effects of loss-of-function of TRPM2-AS and miR-22-3p, and the results showed that the miR-22-3p inhibitor decreased caspase-3 activities by 40% but that si-TRPM2-AS increased the caspase-3 activity in T24 and 5637 cells by 3-fold. When miR-22-3p inhibitor and si-TRPM2-AS were co-transfected into the T24 and 5637 cells, no significant difference was observed between the co-transfection group and the blank group (Figure 6B). The results of the Western blot assay showed that the protein levels of Bax and cleaved caspase-3 decreased in the miR-22-3p inhibitor group, while the Bcl-2 protein level increased in the miR-22-3p inhibitor group. However, the protein levels of the co-transfected group were similar to those of the blank group (Figure 6C).
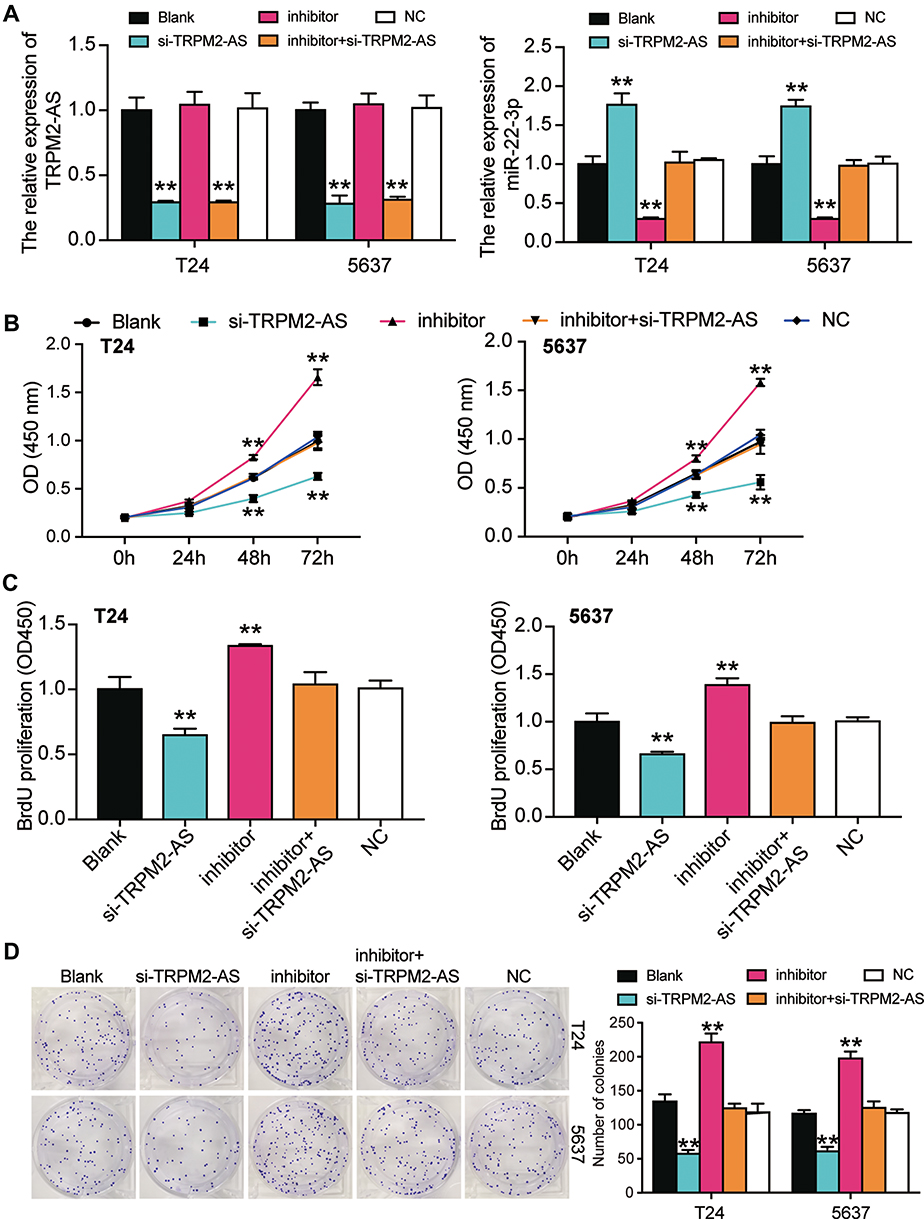 |
Figure 5 MiR-22-3p inhibitor promoted cell viability and cell proliferation in BLCA cells which was regulated by TRPM2-AS. (A) The transfection efficiency of miR-22-3p inhibitor and TRPM2-AS siRNA. (B) CCK-8 assay was used to observe the cell viability in T24 and 5637 cells after transfecting miR-22-3p inhibitor, si-TRPM2-AS, negative control, blank control and co-transfected miR-22-3p inhibitor and si-TRPM2-AS. (C) BrdU assay was used to observe the cell proliferation in T24 and 5637 cells after transfecting miR-22-3p inhibitor, si-TRPM2-AS, negative control, blank control and co-transfected miR-22-3p inhibitor and si-TRPM2-AS. (D) Colony formation assay was used to observe the number of colonies in T24 and 5637 cells after transfecting miR-22-3p inhibitor, si-TRPM2-AS, negative control, blank control and co-transfected miR-22-3p inhibitor and si-TRPM2-AS. **P < 0.001 compared with blank group, ANOVA. |
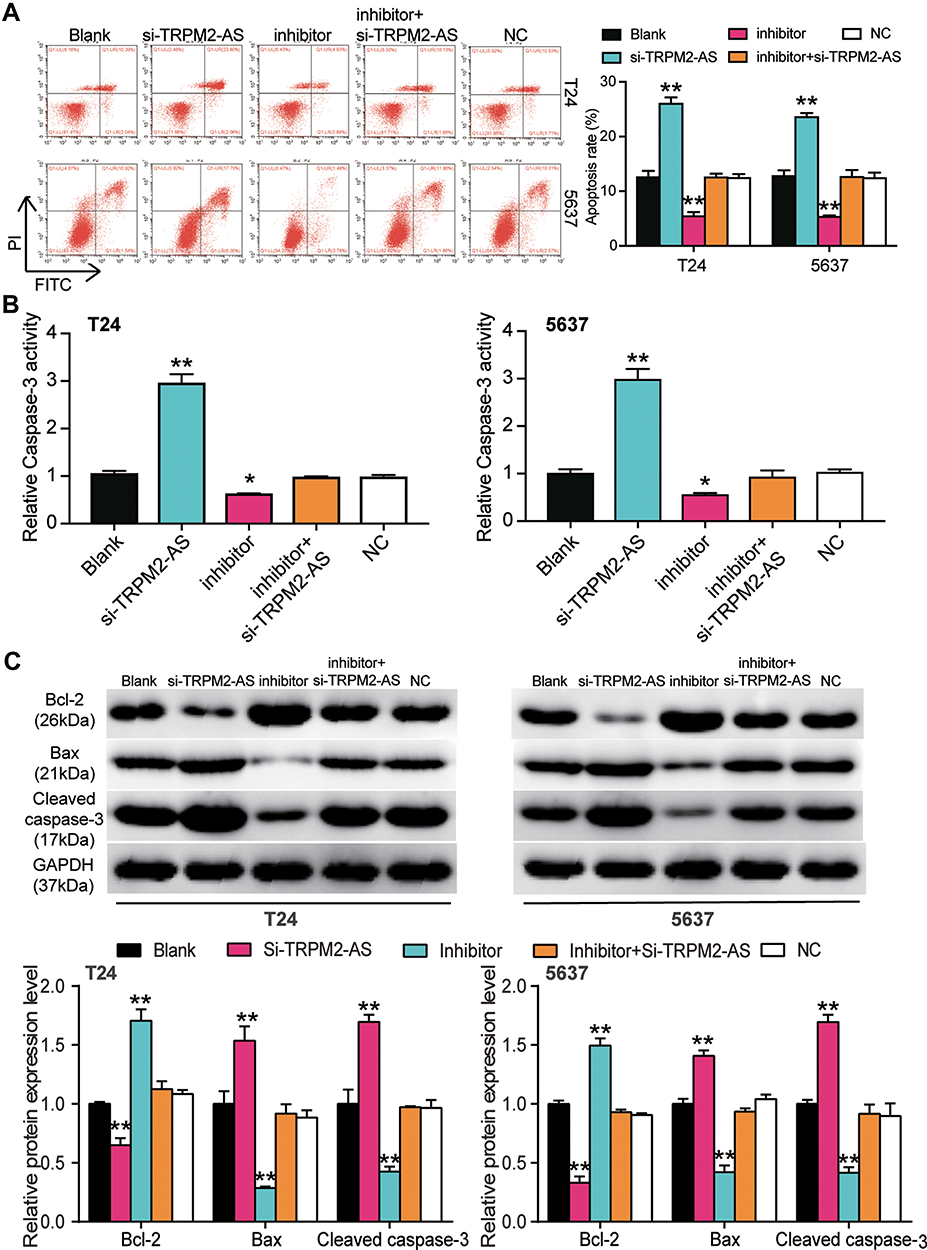 |
Figure 6 MiR-22-3p inhibitor inhibited cell apoptosis in BLCA cells, which was regulated by TRPM2-AS. (A) Flow cytometry was employed to measure the cell apoptosis in T24 and 5637 cells after transfecting miR-22-3p inhibitor, si-TRPM2-AS, negative control, blank control and co-transfected miR-22-3p inhibitor and si-TRPM2-AS. (B) Caspase-3 activation assay was employed to measure the caspase-3 activation in BLCA cells after transfecting miR-22-3p inhibitor, si-TRPM2-AS, negative control, blank control and co-transfected miR-22-3p inhibitor and si-TRPM2-AS. (C) Western blot assay was employed to measure the protein expression of Bax, Cleaved caspase-3 and Bcl-2 after transfecting miR-22-3p inhibitor, si-TRPM2-AS, negative control, blank control and co-transfected miR-22-3p inhibitor and si-TRPM2-AS. *P < 0.05, **P < 0.001 compared with blank group, ANOVA. |
GINS2: Downstream Target Gene of miR-22-3p
The complementary sequences of GINS2 mRNA 3ʹUTR and miR-22-3p were obtained following the analysis of TargetScan Human 7.2 (Figure 7A). The dual-luciferase reporter gene assay and RNA pull-down assay were later performed to verify the complementary binding relationship. The fluorescence intensity was discovered to be reduced in the GINS2-wild type and miR-22-3p mimic co-transfection group, while no differences in T24 and 5637 cell lines were observed in other groups (Figure 7B). The outcome of the RNA pull-down assay also suggested that miR-22-3p could interact directly with GINS2 mRNA (Figure 7C). Experimental findings also revealed that GINS2 was significantly upregulated in BLCA tissues compared with normal adjacent tissues (Figure 7D), a result that indicated a negative correlation with miR-22-3p expression (Figure 7E). In addition, the expression of GINS2 mRNA increased by 6.2-fold in T24 cells and 5.7-fold in 5637 cells compared to SV-HUC-1 cells (Figure 7F). At the protein level, GINS2 expression was observed to increase by 1.9-fold in T24 cells and 1.7-fold in 5637 cells compared to SV-HUC-1 (Figure 7G). What’s more, the transfection of miR-22-3p mimic decreased GINS2 expression by 50%, while the transfection of miR-22-3p inhibitor increased GINS2 expression in T24 and 5637 cells by 2-fold (Figure 7H).
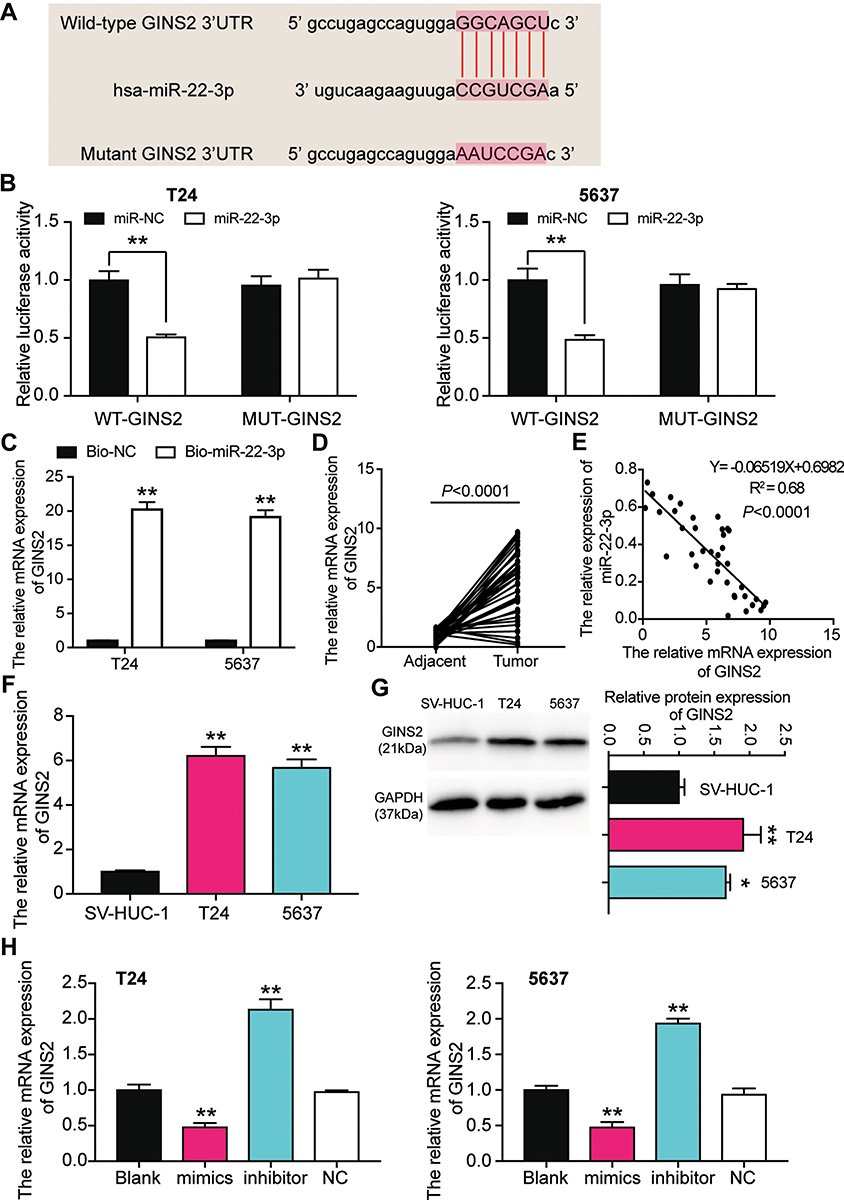 |
Figure 7 GINS2 was the downstream target gene of miR-22-3p. (A) The binding site of GINS2 3ʹUTR for miR-22-3p. (B) Luciferase reporter assay was used to measure the targeting relationship between miR-22-3p and GINS2. **P < 0.001, ANOVA. (C) RNA pull-down assay was used to further confirm the targeting relationship between TRPM2-AS, miR-22-3p and GINS2. **P < 0.001 compared with bio-NC group, ANOVA. (D) The GINS2 mRNA expression was more in BLCA tissues than that in adjacent normal tissues. N=38, Student’s t-test. (E) MiR-22-3p expression had a negative relationship with GINS2 expression. (F) GINS2 mRNA expression was higher in T24 and 5637 cell lines than that in SV-HUC-1 cells. **P < 0.001 compared with SV-HUC-1 cells, ANOVA. (G) GINS2 protein expression was higher in T24 and 5637 cell lines than that in SV-HUC-1 cells. *P < 0.05, **P < 0.001 compared with SV-HUC-1 cells, ANOVA. (H) GINS2 mRNA expression was increased after transfecting miR-22-3p inhibitor, while GINS2 mRNA expression was reduced after transfecting miR-22-3p mimic. **P < 0.001 compared with blank group, ANOVA. |
Suppressive Effects of GINS2 Silence on BLCA Cells
The miR-22-3p inhibitor and si-GINS2 were transfected into T24 and 5637 cells to explore whether the effects of GINS2 on BLCA cells was regulated by miR-22-3p. The transfection efficiency of miR-22-3p and GINS2 siRNA was confirmed using a qPCR system (Figure 8A) and a Western blot system. The Western blot results showed that the miR-22-3p inhibitor elevated the expression of GINS2 protein by 1.5-fold, while the expression of GINS2 protein in the si-GINS2 group was suppressed by approximately 50%, thus indicating that the miR-22-3p inhibitor and si-GINS2 were successfully transfected into both cell lines (Figure 8B). Moreover, the CCK-8 assay results showed that the si-GINS2 weakened the viability abilities of T24 and 5637 cells; the co-transfection with the miR-22-3p inhibitor attenuated the effect of si-GINS2 on cell viability in the two cell lines (Figure 8C). As for the BrdU assay, it was observed that the proliferation ability of T24 and 5637 cells was impaired by 50% in the si-GINS2 group; nonetheless, the proliferation ability of the two BLCA cell lines in the co-transfection group was the same as the blank group (Figure 8D). The results of the colony formation assay showed that the knockdown of GINS2 reduced the number of colonies of T24 and 5637 cells, but the co-transfection of miR-22-3p inhibitor impaired the influence of si-GINS2 on the colony formation of BLCA cell lines (Figure 8E). As for cell apoptosis, the flow cytometry results revealed that the apoptosis rate induced by si-GINS2 was raised by 2.3-fold in T24 cells and 1.7-fold in 5637 cells compared to the blank group; however, the apoptosis rate in the co-transfection group showed no significant differences with the blank group (Figure 9A). Furthermore, The caspase-3 activity in the transfected BLCA cells was observed, and findings revealed that the caspase-3 activity was enhanced by si-GINS2 and but that the caspase-3 activity in the co-transfection group did not show a significant difference with the blank group either (Figure 9B). Western blot assay findings demonstrated that downregulation of GINS2 increased the level of Bax and cleaved caspase-3 and decreased the level of Bcl-2; nonetheless, no significant difference was found in the protein expression level between the co-transfection group and the blank group (Figure 9C).
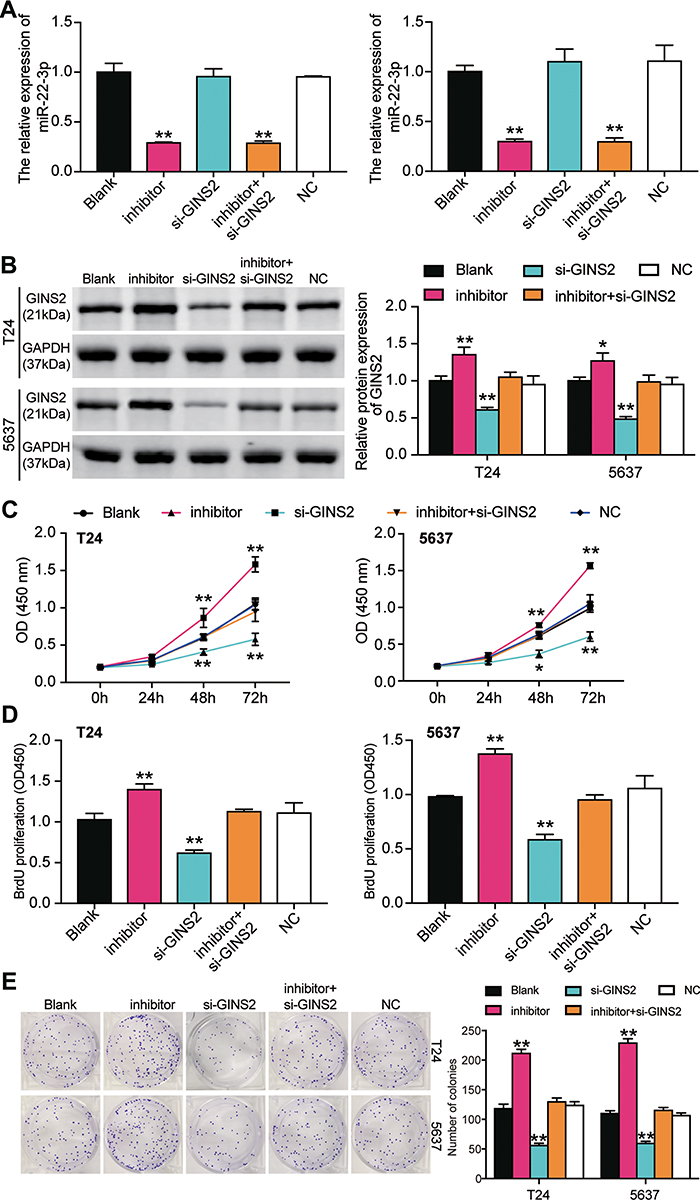 |
Figure 8 GINS2 silence inhibited cell viability and cell proliferation in bladder cancer cells which was regulated by miR-22-3p. (A) The transfection efficiency of miR-22-3p inhibitor and GINS2 siRNA in the two cell lines. (B) The expression of GINS2 protein was detected by Western blot in BLCA cells after transfecting with miR-22-3p inhibitor, si-GINS2, negative control, blank control and co-transfected miR-22-3p inhibitor and si-GINS2. (C) CCK-8 assay was used to observe the cell viability in T24 and 5637 cell lines after transfecting miR-22-3p inhibitor, si-GINS2, negative control, blank control and co-transfected miR-22-3p inhibitor and si-GINS2. (D) BrdU assay was used to observe the cell proliferation in T24 and 5637 cell lines after transfecting miR-22-3p inhibitor, si-GINS2, negative control, blank control and co-transfected miR-22-3p inhibitor and si-GINS2. (E) Colony formation assay was used to observe the number of colonies in T24 and 5637 cells after transfecting miR-22-3p inhibitor, si-GINS2, normal control, blank control and co-transfected miR-22-3p inhibitor and si-GINS2. *P < 0.05, **P < 0.001 compared with blank group, ANOVA. Abbreviation: NC, negative control. |
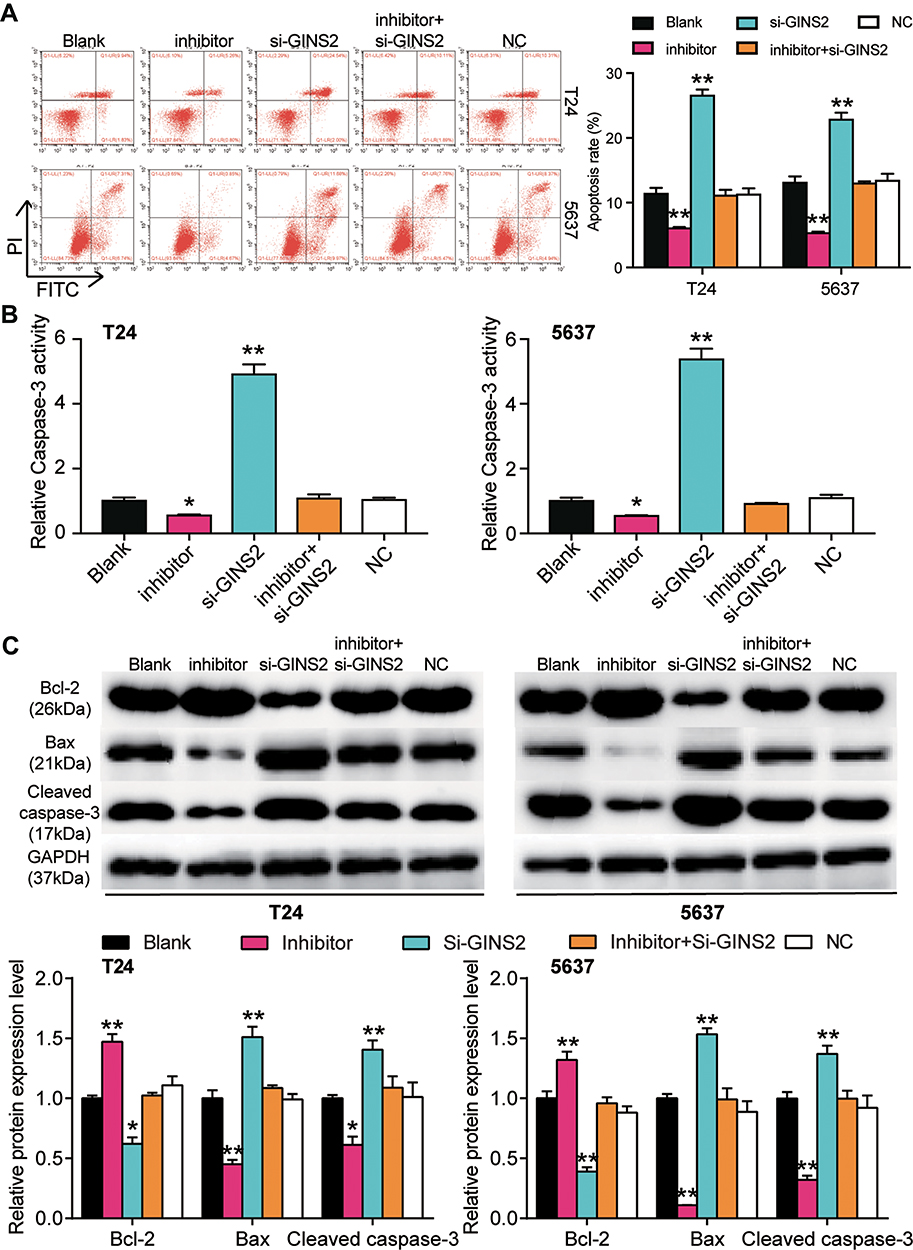 |
Figure 9 GINS2 silence regulated by miR-22-3p promoted cell apoptosis in bladder cancer cells. (A) Flow cytometry was employed to measure the cell apoptosis after transfecting miR-22-3p inhibitor, si-GINS2, negative control, blank control and co-transfected miR-22-3p inhibitor and si-GINS2. (B) Caspase-3 activity assay was employed to measure the caspase-3 activity after transfecting miR-22-3p inhibitor, si-GINS2, normal control, blank control and co-transfected miR-22-3p inhibitor and si-GINS2. (C) Western blot assay was employed to measure the protein expression of Bax, Cleaved caspase-3 and Bcl-2 after transfecting miR-22-3p inhibitor, si-GINS2, normal control, blank control and co-transfected miR-22-3p inhibitor and si-GINS2. *P < 0.05, **P < 0.001 compared with blank group, ANOVA. Abbreviation: NC, negative control. |
Discussion
TRPM2-AS was significantly upregulated in BLCA tissues and cells compared with the normal control and was found to be mainly located in the cytoplasm. We found that TRPM2-AS enhanced the viability and proliferation of BLCA cells but impaired the apoptosis of BLCA cells. We also noticed that TRPM2-AS was negatively associated with miR-22-3p. In other words, the expression of miR-22-3p in BLCA tissues and cells was low, thereby acting as a negative regulator of BLCA progression. GINS2, which was validated to be a target gene of miR-22-3p, was found to be upregulated in BLCA tissues and cells and observed to not only promote cell viability and cell proliferation but also inhibit cell apoptosis.
Previous studies have found lncRNA TRPM2-AS to be aberrantly upregulated in a wide spectrum of neoplasms. For instance, in melanoma, TRPM2-AS were over-expressed.10 Its aberrant upregulation led to significant cancer cell phenotypes, and its loss-of-function resulted in reduced cancer phenotypes. Apart from the fact that TRPM2-AS was found to stimulate the progression of prostate cancer, the knockout of TRPM2-AS was documented to induce cell apoptosis by strengthening cell stress and cell cycle arrest.11 Another research reported that TRPM2-AS accelerated the development of gastric cancer and that it had a significant association with invasion depth, lymphatic metastasis, TNM stage and poor 5-year survival rate, at the same time, TRPM2-AS enhanced cell propagation, migration and invasion by inhibiting miR-195 to promote the development of gastric cancer.12 Similarly, TRPM2-AS with higher expression in colorectal cancer cells could strengthen the proliferation ability of colorectal cancer by combining with RNA-binding protein TAF15 and thus stabilizing the TRPM2 mRNA.13 Also reported was the ability of TRPM2-AS to be upregulated in breast cancer and to enhance cell proliferation and weaken cell apoptosis in breast cancer cells by binding with miR-140-3p.14 Besides, TRPM2-AS was upregulated in hepatocellular carcinoma (HCC) tissues than in normal adjacent tissues, and it had a significant correlation with tumor size, differentiation, and the prognosis outcome of HCC patients.16 Our results and those of previous studies produced similar conclusions. In our research, TRPM2-AS was upregulated in BLCA to promote cell viability and cell proliferation and inhibit cell apoptosis. Our study not only identified the significant upregulation of TRPM2-AS in BLCA but also confirmed its promoting effects on BLCA phenotypes. However, we need to collect more clinical data to verify the regulatory association between TRPM2-AS expression and clinical characteristics.
Furthermore, previous studies have investigated the role of miR-22-3p in human neoplasms, including BLCA, and its ability to act as a tumor suppressor. For instance, miR-22-3p was reported to be significantly downregulated in NCI-H446 (a small cell lung cancer cell line); it was also found to enhance cell apoptosis and inhibit cell migration by downregulating WRNIP1.26 Similarly, miR-22-3p was downregulated in HCC, leading to the malignant progression of the carcinoma.27 In another study, miR-22-3p was found to hinder the malignancy phenotypes of BLCA.41 Similar to these findings, we found that miR-22-3p was significantly downregulated in BLCA. Our analysis also revealed that miR-22-3p could inhibit cell viability and cell proliferation but that it could enhance cell apoptosis. After studying the effect of miR-22-3p on BLCA’s cell apoptosis, we detected caspase-3 activities, flow cytometry, and apoptosis-related proteins in BLCA cells. Our study confirmed that miR-22-3p induced apoptosis process. Our finding was similar to that of Zeng et al42, in which the cleaved caspase-3 protein level was reported to be upregulated in T24 and RT4 cell lines after treating miR-22-3p mimic.
Besides, miR-22-3p has been reported to participate in the competitive endogenous RNA (ceRNA) network. For instance, miR-22-3p was reported to be involved in a ceRNA network pathway that included lncRNA NNT-AS1 and YAP1, thus regulating the malignancy phenotypes of NSCLC cells.43 In gastric cancer, miR-22-3p was found to be regulated by lncRNA CTC-497E21.4, thus regulating NET1 expression to suppress the malignant development of gastric cancer.44 By acting through the ceRNA network, LINC00858 suppressed miR-22-3p and thus regulated the down-stream effector (YWHAZ) to strengthen the progression of colorectal cancer.25 We herein validated the regulatory relationship between miR-22-3p and TRPM2-AS and found that the latter promoted BLCA by suppressing the former. Even though the ceRNA network in BLCA involving miR-22-3p has not yet been reported, the present study presented a novel ceRNA network that involved miR-22-3p. We believe this proposal might open a new approach for BLCA therapy.
Furthermore, GINS2 has been preliminarily studied in various human cancers. For instance, GINS2 enhanced cell proliferation and weakened cell apoptosis in thyroid cancer by regulating CITED2 and LOXL2 expression.32 GINS2 was also upregulated in NSCLC (non-small cell lung cancer) tissues and cell lines. Moreover, GINS2 enhanced the propagation, migration, invasion and epithelial–mesenchymal transition (EMT) of NSCLC cells by regulating the phosphorylation of PI3K p85, AKT, MEK and ERK.33 Besides, GINS2 was overexpressed in triple-negative breast cancer (TNBC) cell lines, and it was found to strengthen the aggression of TNBC cells by increasing the level of MMP9.35 What’s more, the GINS2 expression level was found to be higher in cervical cancer tissues and cell lines, and findings revealed that GINS2 could boost cell propagation, migration and invasion.37 In epithelial ovarian cancer, GINS2 with a high level of expression in tissues enhanced cell propagation but mitigated cell cycle arrest in S phase.38 To our knowledge, GINS2 has not yet been studied in BLCA. We herein identified that GINS2 was a validated downstream effector of miR-22-3p. We also discovered in previous studies that GINS2 was an oncogene that promoted the development of BLCA cells, which was consistent with the previous studies on GINS2 in other cancers. In addition to that, we found that the effects of the GINS2 knockdown on BLCA cell phenotypes could be attenuated via miR-22-3p inhibition.
Nonetheless, our study was fraught with several limitations. Even though we verified that the TRPM2-AS/miR-22-3p/GINS2 axis could regulate the viability, proliferation and apoptosis of BLCA cell phenotypes, we did not study the effects of the ceRNA network pathway on BLCA cell aggression phenotypes, such as migration and invasion. Besides, we did not conduct animal models to confirm our experiment results in vitro. Hence, we suggested that future research should investigate the clinical application of our findings. We also recommended that other factors influencing the occurrence and progression of tumors should be explored in future studies to expand the ceRNA network.
Conclusion
Our study suggested that TRPM2-AS was a tumor promoter. More specifically, we found that TRPM2-AS enhanced the progression of BLCA by downregulating miR-22-3p and thus increasing GINS2 expression in vitro. In sum, the TRPM2-AS/miR-22-3p/GINS2 axis could be a potential target of BLCA and might provide invaluable information about BLCA therapy.
Abbreviations
miRNAs, microRNAs; PBS, phosphate-buffered saline; EdU, 5-ethynyl-2′-deoxyuridine; BLCA, bladder cancer; qPCR, quantitative real-time PCR.
Data Sharing Statement
The datasets used during the current study are available from the corresponding author on reasonable request.
Ethics Approval and Consent to Participate
Ethic Committee of The First Affiliated Hospital of Zhengzhou University (Henan, China) approved the study.
Consent for Publication
Informed consent was obtained from all patients.
Funding
This research has received no funds.
Disclosure
There is no conflict of interest existed among the authors.
References
1. Bray F, Ferlay J, Soerjomataram I, Siegel RL, Torre LA, Jemal A. Global cancer statistics 2018: GLOBOCAN estimates of incidence and mortality worldwide for 36 cancers in 185 countries. CA Cancer J Clin. 2018;68(6):394–424. doi:10.3322/caac.21492
2. Chen W, Zheng R, Baade PD, et al. Cancer statistics in China, 2015. CA Cancer J Clin. 2016;66(2):115–132. doi:10.3322/caac.21338
3. Humphrey PA, Moch H, Cubilla AL, Ulbright TM, Reuter VE. The 2016 WHO classification of tumours of the urinary system and male genital organs-part B: prostate and bladder tumours. Eur Urol. 2016;70(1):106–119. doi:10.1016/j.eururo.2016.02.028
4. Babjuk M. Trends in bladder cancer incidence and mortality: success or disappointment? Eur Urol. 2017;71(1):109–110. doi:10.1016/j.eururo.2016.06.040
5. Shi X, Sun M, Liu H, Yao Y, Song Y. Long non-coding RNAs: a new frontier in the study of human diseases. Cancer Lett. 2013;339(2):159–166. doi:10.1016/j.canlet.2013.06.013
6. Trimarchi T, Bilal E, Ntziachristos P, et al. Genome-wide mapping and characterization of Notch-regulated long noncoding RNAs in acute leukemia. Cell. 2014;158(3):593–606. doi:10.1016/j.cell.2014.05.049
7. Cheng W, Zhang Z, Wang J. Long noncoding RNAs: new players in prostate cancer. Cancer Lett. 2013;339(1):8–14. doi:10.1016/j.canlet.2013.07.008
8. Zhong X, Lu M, Wan J, Zhou T, Qin B. Long noncoding RNA kcna3 inhibits the progression of colorectal carcinoma through down-regulating YAP1 expression. Biomed Pharmacother. 2018;107:382–389. doi:10.1016/j.biopha.2018.07.118
9. Wu X, Zhang P, Zhu H, Li S, Chen X, Shi L. Long noncoding RNA FEZF1-AS1 indicates a poor prognosis of gastric cancer and promotes tumorigenesis via activation of Wnt signaling pathway. Biomed Pharmacother. 2017;96:1103–1108. doi:10.1016/j.biopha.2017.11.113
10. Orfanelli U, Wenke AK, Doglioni C, Russo V, Bosserhoff AK, Lavorgna G. Identification of novel sense and antisense transcription at the TRPM2 locus in cancer. Cell Res. 2008;18(11):1128–1140. doi:10.1038/cr.2008.296
11. Orfanelli U, Jachetti E, Chiacchiera F, et al. Antisense transcription at the TRPM2 locus as a novel prognostic marker and therapeutic target in prostate cancer. Oncogene. 2015;34(16):2094–2102. doi:10.1038/onc.2014.144
12. Huang B, Chang C, Wang BL, Li H. ELK1-induced upregulation of lncRNA TRPM2-AS promotes tumor progression in gastric cancer by regulating miR-195/HMGA1 axis. J Cell Biochem. 2019;120(10):16921–16933. doi:10.1002/jcb.28951
13. Pan L, Li Y, Jin L, Li J, Xu A. TRPM2-AS promotes cancer cell proliferation through control of TAF15. Int J Biochem Cell Biol. 2020;120:105683. doi:10.1016/j.biocel.2019.105683
14. Sun T, Song Y, Yu H, Luo X. Identification of lncRNA TRPM2-AS/miR-140-3p/PYCR1 axis’s proliferates and anti-apoptotic effect on breast cancer using co-expression network analysis. Cancer Biol Ther. 2019;20(6):760–773. doi:10.1080/15384047.2018.1564563
15. Ma LY, Xie XW, Ma L, et al. Downregulated long non-coding RNA TRPM2-AS inhibits cisplatin resistance of non-small cell lung cancer cells via activation of p53- p66shc pathway. Eur Rev Med Pharmacol Sci. 2017;21(11):2626–2634.
16. Xu C, Huang Q, Zhang C, et al. Long non-coding RNA TRPM2-AS as a potential biomarker for hepatocellular carcinoma. Ir J Med Sci. 2018;187(3):621–628. doi:10.1007/s11845-017-1692-y
17. Huang C, Qin Y, Liu H, et al. Downregulation of a novel long noncoding RNA TRPM2-AS promotes apoptosis in non-small cell lung cancer. Tumour Biol. 2017;39(2):1010428317691191. doi:10.1177/1010428317691191
18. Mattick JS. Non-coding RNAs: the architects of eukaryotic complexity. EMBO Rep. 2001;2(11):986–991. doi:10.1093/embo-reports/kve230
19. Ahadi A, Brennan S, Kennedy PJ, Hutvagner G, Tran N. Long non-coding RNAs harboring miRNA seed regions are enriched in prostate cancer exosomes. Sci Rep. 2016;6:24922. doi:10.1038/srep24922
20. Seok H, Ham J, Jang ES, Chi SW. MicroRNA target recognition: insights from transcriptome-wide non-canonical interactions. Mol Cells. 2016;39(5):375–381.
21. Zhang W, Zhan F, Li D, Wang T, Huang H. RGMB-AS1/miR-22-3p/NFIB axis contributes to the progression of gastric cancer. Neoplasma. 2020;67:484–491. doi:10.4149/neo_2020_190418N350
22. Heidary Z, Zaki-Dizaji M, Saliminejad K, Edalatkhah H, Khorram Khorshid HR. MiR-4485-3p expression reduced in spermatozoa of men with idiopathic asthenozoospermia. Andrologia. 2020;52(3):e13539. doi:10.1111/and.13539
23. Liang L, Xu J, Wang M, et al. LncRNA HCP5 promotes follicular thyroid carcinoma progression via miRNAs sponge. Cell Death Dis. 2018;9(3):372. doi:10.1038/s41419-018-0382-7
24. Qiu BQ, Zhang PF, Xiong D, et al. CircRNA fibroblast growth factor receptor 3 promotes tumor progression in non-small cell lung cancer by regulating Galectin-1-AKT/ERK1/2 signaling. J Cell Physiol. 2019;234(7):11256–11264. doi:10.1002/jcp.27783
25. Sha QK, Chen L, Xi JZ, Song H. Long non-coding RNA LINC00858 promotes cells proliferation, migration and invasion by acting as a ceRNA of miR-22-3p in colorectal cancer. Artif Cells Nanomed Biotechnol. 2019;47(1):1057–1066. doi:10.1080/21691401.2018.1544143
26. Jiang W, Han X, Wang J, et al. miR-22 enhances the radiosensitivity of small-cell lung cancer by targeting the WRNIP1. J Cell Biochem. 2019;120(10):17650–17661. doi:10.1002/jcb.29032
27. Chen J, Wu FX, Luo HL, et al. Berberine upregulates miR-22-3p to suppress hepatocellular carcinoma cell proliferation by targeting Sp1. Am J Transl Res. 2016;8(11):4932–4941.
28. MacNeill SA. Structure and function of the GINS complex, a key component of the eukaryotic replisome. Biochem J. 2010;425(3):489–500. doi:10.1042/BJ20091531
29. Labib K, Gambus A. A key role for the GINS complex at DNA replication forks. Trends Cell Biol. 2007;17(6):271–278. doi:10.1016/j.tcb.2007.04.002
30. Kamada K. The GINS complex: structure and function. Subcell Biochem. 2012;62:135–156.
31. Huang J, Li Y, Lu Z, et al. Analysis of functional hub genes identifies CDC45 as an oncogene in non-small cell lung cancer - a short report. Cell Oncol (Dordr). 2019;42(4):571–578. doi:10.1007/s13402-019-00438-y
32. Ye Y, Song YN, He SF, Zhuang JH, Wang GY, Xia W. GINS2 promotes cell proliferation and inhibits cell apoptosis in thyroid cancer by regulating CITED2 and LOXL2. Cancer Gene Ther. 2019;26(3–4):103–113. doi:10.1038/s41417-018-0045-y
33. Liu X, Sun L, Zhang S, Zhang S, Li W. GINS2 facilitates epithelial-to-mesenchymal transition in non-small-cell lung cancer through modulating PI3K/Akt and MEK/ERK signaling. J Cell Physiol. 2019.
34. Rantala JK, Edgren H, Lehtinen L, et al. Integrative functional genomics analysis of sustained polyploidy phenotypes in breast cancer cells identifies an oncogenic profile for GINS2. Neoplasia. 2010;12(11):877–888. doi:10.1593/neo.10548
35. Peng L, Song Z, Chen D, et al. GINS2 regulates matrix metallopeptidase 9 expression and cancer stem cell property in human triple negative breast cancer. Biomed Pharmacother. 2016;84:1568–1574. doi:10.1016/j.biopha.2016.10.032
36. Zheng M, Zhou Y, Yang X, et al. High GINS2 transcript level predicts poor prognosis and correlates with high histological grade and endocrine therapy resistance through mammary cancer stem cells in breast cancer patients. Breast Cancer Res Treat. 2014;148(2):423–436. doi:10.1007/s10549-014-3172-7
37. Ouyang F, Liu J, Xia M, et al. GINS2 is a novel prognostic biomarker and promotes tumor progression in early-stage cervical cancer. Oncol Rep. 2017;37(5):2652–2662. doi:10.3892/or.2017.5573
38. Yan T, Liang W, Jiang E, Ye A, Wu Q, Xi M. GINS2 regulates cell proliferation and apoptosis in human epithelial ovarian cancer. Oncol Lett. 2018;16(2):2591–2598. doi:10.3892/ol.2018.8944
39. Zhang X, Zhong L, Liu BZ, Gao YJ, Gao YM, Hu XX. Effect of GINS2 on proliferation and apoptosis in leukemic cell line. Int J Med Sci. 2013;10(12):1795–1804. doi:10.7150/ijms.7025
40. Kacich RL, Williams LT, Coughlin SR. Arachidonic acid and cyclic adenosine monophosphate stimulation of c-fos expression by a pathway independent of phorbol ester-sensitive protein kinase C. Mol Endocrinol. 1988;2(1):73–77. doi:10.1210/mend-2-1-73
41. Xu M, Li J, Wang X, et al. MiR-22 suppresses epithelial-mesenchymal transition in bladder cancer by inhibiting Snail and MAPK1/Slug/vimentin feedback loop. Cell Death Dis. 2018;9(2):209. doi:10.1038/s41419-017-0206-1
42. Zeng Q, Liu J, Cao P, et al. Inhibition of REDD1 sensitizes bladder urothelial carcinoma to paclitaxel by inhibiting autophagy. Clin Cancer Res. 2018;24(2):445–459. doi:10.1158/1078-0432.CCR-17-0419
43. He W, Zhang Y, Xia S. LncRNA NNT-AS1 promotes non-small cell lung cancer progression through regulating miR-22-3p/YAP1 axis. Thorac Cancer. 2020;11:549–560. doi:10.1111/1759-7714.13280
44. Zong W, Feng W, Jiang Y, et al. LncRNA CTC-497E21.4 promotes the progression of gastric cancer via modulating miR-22/NET1 axis through RhoA signaling pathway. Gastric Cancer. 2020;23(2):228–240. doi:10.1007/s10120-019-00998-w
 © 2021 The Author(s). This work is published and licensed by Dove Medical Press Limited. The
full terms of this license are available at https://www.dovepress.com/terms
and incorporate the Creative Commons Attribution
- Non Commercial (unported, 3.0) License.
By accessing the work you hereby accept the Terms. Non-commercial uses of the work are permitted
without any further permission from Dove Medical Press Limited, provided the work is properly
attributed. For permission for commercial use of this work, please see paragraphs 4.2 and 5 of our Terms.
© 2021 The Author(s). This work is published and licensed by Dove Medical Press Limited. The
full terms of this license are available at https://www.dovepress.com/terms
and incorporate the Creative Commons Attribution
- Non Commercial (unported, 3.0) License.
By accessing the work you hereby accept the Terms. Non-commercial uses of the work are permitted
without any further permission from Dove Medical Press Limited, provided the work is properly
attributed. For permission for commercial use of this work, please see paragraphs 4.2 and 5 of our Terms.