
Back to Journals » Diabetes, Metabolic Syndrome and Obesity » Volume 19
Trimethylamine N-Oxide Combined with Phenylacetylglutamine as Potential Biomarkers for Diabetic Kidney Disease
Authors Xiong G, Fang Q, Wu H, Zhang D, Wang J, Qin Y, Chen Z, Wu Y, Lei Y, Cui Y, Chen L, Li X, Li Y, Ouyang D
Received 27 December 2025
Accepted for publication 19 May 2026
Published 29 May 2026 Volume 2026:19 592052
DOI https://doi.org/10.2147/DMSO.S592052
Checked for plagiarism Yes
Review by Single anonymous peer review
Peer reviewer comments 5
Editor who approved publication: Dr Rebecca Baqiyyah Conway
Guiling Xiong,1,2,* Qing Fang,3,4,* Hao Wu,1 Di Zhang,5 Jiangang Wang,1 Yuexiang Qin,1 Zi Chen,1 Yusi Wu,6 Yuyan Lei,2,7 Yimin Cui,8 Lulu Chen,2,3 Xiaohui Li,2– 4 Ying Li,1 Dongsheng Ouyang3,4
1Department of Health Management, The Third Xiangya Hospital, Central South University, Changsha, Hunan, People’s Republic of China; 2Department of Pharmacology, Xiangya School of Pharmaceutical Science, Central South University, Changsha, Hunan, People’s Republic of China; 3Changsha Duxact Biotech Co., Ltd., Changsha, Hunan, People’s Republic of China; 4Hunan Key Laboratory for Bioanalysis of Complex Matrix Samples, Changsha, Hunan, People’s Republic of China; 5Department of Clinical Laboratory, The Third Xiangya Hospital, Central South University, Changsha, Hunan, People’s Republic of China; 6Key Laboratory of Study and Discovery of Small Targeted Molecules of Hunan, Hunan Normal University Health Science Center, Hunan Normal University, Changsha, Hunan, People’s Republic of China; 7The Second Nanning People′s Hospital, Nanning, Guangxi, People’s Republic of China; 8Peking University First Hospital, Beijing, People’s Republic of China
*These authors contributed equally to this work
Correspondence: Ying Li, Department of Health Management, The Third Xiangya Hospital, Central South University, No. 138 Tongzipo Road, Yuelu District, Changsha, Hunan, 410013, People’s Republic of China, Tel +86-15116282794, Email [email protected] Dongsheng Ouyang, Changsha Duxact Biotech Co., Ltd., No. 1058 Wenxuan Road, Lugu Street, Yuelu District, Changsha, Hunan, 410000, People’s Republic of China, Tel +86-13307313736, Email [email protected]
Purpose: For diabetic kidney disease (DKD), a serious complication of diabetes mellitus, this study was designed to assess the potential utility of two gut microbiota-derived metabolites — trimethylamine N-oxide (TMAO) and phenylacetylglutamine (PAGln) — individually and in combination for identifying DKD.
Methods: Plasma TMAO and PAGln levels were quantified by Liquid chromatography-tandem mass spectrometry (LC-MS/MS) in 165 patients with type 2 diabetes mellitus (T2DM) (63 without nephropathy and 102 with DKD). Spearman correlation analysis was performed to evaluate the associations between metabolite concentrations and renal function metrics. Multivariable logistic regression and Receiver operating characteristic (ROC) analyses were performed to evaluate independent risk associations and the potential of the metabolites to indicate DKD.
Results: DKD patients showed significantly higher plasma TMAO and PAGln levels than T2DM subjects without nephropathy. Both metabolites correlated positively with blood urea nitrogen, serum creatinine, uric acid, microalbuminuria and urine albumin-to-creatinine ratio and negatively with estimated glomerular filtration rate, and each emerged as an independent correlate of DKD. ROC analysis gave area under the curve (AUC) values of 0.795 for TMAO and 0.832 for PAGln; combining the two metabolites raised the AUC to 0.846, with a substantial increase in sensitivity from 65.7% (TMAO alone) and 68.3% (PAGln alone) to 75.6%, while maintaining high specificity (85.2%).
Conclusion: TMAO and PAGln are independent biomarkers of DKD. Their combined use significantly improved sensitivity while maintaining high specificity, offering a powerful, non-invasive strategy for identification of DKD. A flowchart illustrating a study on a population of 165 individuals with type 2 diabetes. It includes 63 individuals with type 2 diabetes mellitus and 102 with diabetic kidney disease. The chart outlines the process of collecting clinical data and fasting venous plasma. It specifies the collection of baseline characteristics and laboratory results, followed by the quantification of plasma trimethylamine N-oxide and phenylacetylglutamine using high-performance liquid chromatography-tandem mass spectrometry. The final step is data processing.Flowchart of study on 165 type 2 diabetes patients, detailing data collection and processing.
Keywords: diabetic kidney disease, trimethylamine N-Oxide, phenylacetylglutamine, biomarkers
Introduction
Diabetes mellitus (DM) is a significant global public health threat. Approximately 90% of the affected adults have type 2 diabetes mellitus (T2DM), according to the International Diabetes Federation’s projection that the number of affected adults will increase from 537 million to 783 million over the next two decades.1 Diabetic kidney disease (DKD), the most severe chronic microvascular complication of DM, is defined by a progressive decrease in glomerular filtration rate and persistent albuminuria, which is a direct result of prolonged hyperglycemia. Approximately 30–40% of individuals with diabetes develop DKD,2,3 although the reported prevalence may vary depending on diabetes type, disease duration, diagnostic criteria, and access to appropriate care. Current diagnosis primarily relies on the urine albumin-to-creatinine ratio (UACR) and estimated glomerular filtration rate (eGFR), which are limited by suboptimal sensitivity and specificity, as well as susceptibility to confounding variables.4,5 UACR demonstrates low sensitivity for early-stage DKD,6 whereas eGFR measurements are complicated by technical challenges and susceptibility to interference.7 Consequently, the identification of novel biomarkers with improved precision is essential. Emerging evidence has implicated gut microbiota dysbiosis in the pathogenesis of DKD, which is accompanied by structural and functional remodeling in the early stages of the disease.8,9 Metabolites such as 3-hydroxyisobutyrate and glycerol-3-galactoside have been observed to be significantly elevated in incipient DKD.10 Notably, microbiota-derived metabolites fulfill a dual role as both early warning signals and pathogenic mediators, as exemplified by imidazole propionate, which exacerbates renal tubular inflammation through Toll-like Receptor 4-dependent oxidative stress.11 Thus, gut microbiota-derived metabolites are promising candidates for improving identification and risk stratification of DKD.
Trimethylamine N-oxide (TMAO) is a gut microbiota-derived metabolite that is generated through hepatic oxidation of trimethylamine (TMA) by flavin-containing monooxygenase; TMA is produced by microbial catabolism of dietary choline, L-carnitine, and betaine.12 TMAO has been causally linked to cardiovascular disease (CVD),13 T2DM,14 and chronic kidney disease (CKD).15 Recent clinical data have demonstrated a strong association between elevated circulating TMAO concentrations and an increased risk of DKD in individuals with T2DM, establishing TMAO as an independent determinant for both the onset and progression of DKD.16 Our previous work demonstrated that TMAO exacerbates renal fibrosis in rat models of DKD. Mechanistically, TMAO activates the NOD-like receptor family, pyrin domain-containing 3 (NLRP3) inflammasome, thereby promoting the maturation and secretion of interleukin-1β and IL-18, which amplifies localized renal inflammation.17 Furthermore, TMAO triggers mitochondrial reactive oxygen species (mROS)-mediated activation of the NLRP3 inflammasome, thereby inducing pyroptosis and accelerating the pathogenesis of DKD.18 Despite its high specificity, TMAO exhibits only modest sensitivity, with an area under the receiver operating characteristic curve (AUC) of 0.691,16 thereby increasing the risk of false-negative results and underdetection in clinical practice. Furthermore, TMAO levels can be influenced by medications; Sodium-Glucose Cotransporter 2 (SGLT2) inhibitors, for instance, reduce TMAO levels by attenuating precursor generation.19 Thus, relying solely on TMAO is insufficient; integration with complementary biomarkers is warranted to enhance identification performance.
Phenylacetylglutamine (PAGln) is a gut microbiota-derived metabolite that originates from the essential amino acid phenylalanine.20 Dietary phenylalanine is primarily absorbed in the small intestine;21 the unabsorbed fraction reaches the colon and undergoes microbial deamination to phenylpyruvate.11 Phenylpyruvate is metabolized to phenylacetic acid,22 which enters the portal circulation and is conjugated with glutamine in the liver to form PAGln.23 There is growing interest in PAGln due to its significant role in CVD.24 It has emerged as an independent risk factor for heart failure25 and is additionally linked to an increased risk of coronary artery disease.26 PAGln, which is a uremic toxin, is primarily cleared by the kidneys, and its clearance rate is closely correlated with eGFR.27 Elevated serum PAGln levels in CKD have been shown to correlate positively with disease severity and mortality.28 PAGln has also been identified as a biomarker for distal symmetric polyneuropathy in T2DM.29 Given the established role of PAGln as a biomarker in CKD and T2DM, it is hypothesized that PAGln may serve as a biomarker for DKD. Serial PAGln monitoring could refine risk stratification, guide therapy, and facilitate a precision medicine framework for DKD.
Based on this rationale, a novel paradigm for identification is proposed: the combined use of TMAO and PAGln as dual biomarkers for DKD. The measurement of individual biomarkers often exhibits inherent limitations in sensitivity or specificity. When one biomarker is near its clinical threshold, an aberrant level of the other provides orthogonal validation, reducing failure to identify DKD and misclassification. This integrated approach could improve identification rates and classification precision.
Materials and Methods
Study Design
In this single-center, cross-sectional study, 165 consecutive patients with T2DM were recruited from the Department of Nephrology at the Third Xiangya Hospital of Central South University between December 2023 and June 2024. To minimize selection bias, all eligible participants during this period were included using a consecutive sampling method. The cohort consisted of 63 patients with T2DM but without kidney disease and 102 patients with DKD. DKD was defined as the presence of UACR ≥ 30 mg/g and/or eGFR < 60 mL/min/1.73m2 in patients with type 2 diabetes, after excluding other causes of kidney damage. Plasma concentrations of TMAO and PAGln were quantified at Changsha Duxact Biotech Co., Ltd.
Inclusion Criteria
Inclusion criteria were: (i) age≥18 years; (ii) diagnosis per Chinese clinical guidelines; T2DM: 2020 Chinese Guidelines for Prevention and Treatment of Type 2 Diabetes, DKD: 2021 Chinese Guidelines for Diabetic Kidney Disease Prevention and Treatment; (iii) provision of written informed consent.
Exclusion Criteria
Exclusion criteria were (i) major organ dysfunction of cardiac, hepatic, or pulmonary origin; (ii) severe comorbidities including immunodeficiency, hematologic disorders, active infection, malignancy, or renal disorders; (iii) primary or secondary glomerulopathies or any renal disease diagnosed prior to the onset of diabetes; (iv) pregnancy or lactation; (v) interventions within the preceding four weeks (antibiotics or probiotics, major surgery, lower-gastro-intestinal endoscopy with bowel preparation); (vi) chronic diarrhea necessitating pharmacological treatment; and (vii) investigator-determined ineligibility.
Data Collection
Venous blood samples were collected after an overnight fast of at least 8 hours. At enrollment, 4 mL of peripheral venous blood was drawn from each participant into EDTA-containing tubes. Blood samples were immediately centrifuged at 3000 rpm for 10 minutes at 4°C, and the separated plasma was aliquoted and stored at −80°C until analysis. Demographic, anthropometric, and biochemical variables were assessed, including age, sex, ethnicity, birthplace, height, weight, medical/surgical/medication history, systolic blood pressure (SBP), diastolic blood pressure (DBP), fasting blood glucose (GLU), glycated hemoglobin (HbA1c), microalbuminuria (MAU), urinary creatinine (UCr), UACR, total cholesterol (TC), triglycerides (TG), high-density lipoprotein cholesterol (HDL-C), low-density lipoprotein cholesterol (LDL-C), uric acid (UA), blood urea nitrogen (BUN), serum creatinine (SCr). eGFR was calculated using the CKD-EPI formula:  .
.
Metabolite Measurements
PAGln Quantification
The precipitation solution (acetonitrile with 0.0757μM PAGln-d5) and calibrators (0.019, 0.057, 0.227, 1.135, and 2.270 μM PAGln) were prepared. Aliquots of plasma or calibrator were mixed with the precipitation solution, vortex-mixed, and centrifuged. The resulting supernatant was then transferred to an injection vial. Liquid chromatography-tandem mass spectrometry (LC-MS/MS) analysis was performed using an ExionLC AD system (Sciex, USA) coupled to a Triple Quad 6500+ mass spectrometer (Sciex, USA). Chromatographic separation was carried out on a Waters ACQUITY UPLC HSS T3 column (1.8 μm) using mobile phase A (2 mM ammonium acetate in 0.1% formic acid) and mobile phase B (Acetonitrile) with the following gradient program: 0–0.5 min, 5% B; 0.5–1.8 min, 5–40% B; 1.8–2.2 min, 40% B; 2.2–2.21 min, 40–5% B; 2.21–3.0 min, 5% B. The flow rate was 0.3 mL/min, injection volume 2 μL, and column temperature 40 °C. Detection utilized a Turbo V™ electrospray ionization source in positive mode at 500 °C, operating in multiple reaction monitoring (MRM) mode. The precursor-to-product ion transitions monitored were m/z 265.1 → 130.1 for phenylacetylglutamine (PAGln) and m/z 329.22 → 113.14 for the stable isotope-labeled internal standard PAGln-d5. Quantification was performed using an internal standard method to correct for potential matrix effects and ensure accurate, reliable results.
TMAO Quantification
Aliquots (50 μL) of plasma, calibrators (0.067–13.313 μM), or quality controls (QCs: 0.200, 1.997, and 10.651 μM) were transferred to a deep-well plate or 1.5 mL tube. Then, 150 μL of internal standard working solution (d9-TMAO at 0.666 μM) was added to each well or tube. The plate was sealed with aluminum foil, or tube caps were tightened. The samples were vortex-mixed for 2 min and subsequently centrifuged (deep-well plate: 4000 rpm for 15 min; centrifuge tube: 12,000 rpm for 10 min). After centrifugation, 50 μL supernatant was aspirated and transferred to a new plate or tube. Next, 450 μL of purified water was added to each well or tube. The diluted samples were vortex-mixed for 2 min and centrifuged again under the conditions specified above.
LC-MS/MS analysis: Chromatographic separation used a HILIC column (or equivalent) at 40 °C. An isocratic elution with 30% mobile phase A was used at 0.3 mL/min for 2 min. Mass spectrometric detection was conducted using electrospray ionization in positive mode (ESI+). Multiple reaction monitoring (MRM) tracked transitions: m/z 76→58 for TMAO and m/z 85→66 for internal standard TMAO-d9. Processed samples were placed in the LC autosampler for analysis. Calibration Curve: A standard curve was constructed by plotting the peak area ratio (TMAO / TMAO-d9) (Y-axis) against the nominal TMAO concentration (X-axis) of the calibrators. A linear least squares regression model with 1/x2 weighting was applied. The correlation coefficient (r) was required to be ≥0.990. Quantification: TMAO concentration in unknowns was determined from the calibration curve equation.
Statistical Analysis
Statistical analyses were conducted using GraphPad Prism 9.0 and SAS 9.4. Normality was assessed by the Shapiro–Wilk test. Normally distributed variables are expressed as mean ± standard deviation (SD), and comparisons between two groups were analyzed using the independent samples t‑test; otherwise, data are presented as median (interquartile range) and analyzed using the Mann‑Whitney U-test. For comparisons across three or more groups, one-way ANOVA with Student-Newman-Keuls (SNK) post-hoc testing was applied for parametric data, while the Kruskal–Wallis test was used for nonparametric data. To evaluate the relationship between metabolite levels and the severity of renal impairment, patients were stratified into three groups based on eGFR thresholds (≥60, 30–59, and <30 mL/min/1.73m2). Differences among these groups were assessed using the Kruskal–Wallis test with Dunn’s post-hoc correction for multiple comparisons, and monotonic trends across ordinal eGFR categories were examined using the Jonckheere-Terpstra test for trend. Receiver Operating Characteristic (ROC) curve analysis was performed to evaluate the identification capacity of TMAO and PAGln for DKD. Associations between metabolites and clinical parameters were assessed using Spearman’s rank correlation. For logistic regression, TMAO and PAGln were dichotomized at the median values (4.01 μM and 2.97 μM, respectively) to define low and high groups, allowing assessment of the association between elevated metabolite levels and DKD risk. Multivariate logistic regression was used to derive adjusted odds ratios (ORs) with 95% confidence intervals (CIs) for DKD risk factors. A two-tailed P value of less than 0.05 was considered statistically significant for all analyses.
Results
Elevated Plasma Levels of TMAO and PAGln in DKD Patients
This study enrolled a total of 165 patients with type 2 diabetes mellitus, comprising 63 patients without nephropathy (52.4% male, mean age 59 years) and 102 patients with DKD (76.5% male, mean age 60 years). As summarized in Table 1, significant differences in baseline clinical characteristics and laboratory parameters were observed between the two groups. Specifically, the DKD group demonstrated more pronounced cardiovascular and metabolic disturbances, as evidenced by higher systolic SBP, DBP, and blood glucose levels. GLU and HbA1c levels were significantly elevated in patients with DKD compared to those with T2DM alone. In terms of lipid profiles, TC, LDL-C, and HDL-C were significantly reduced in the DKD group.
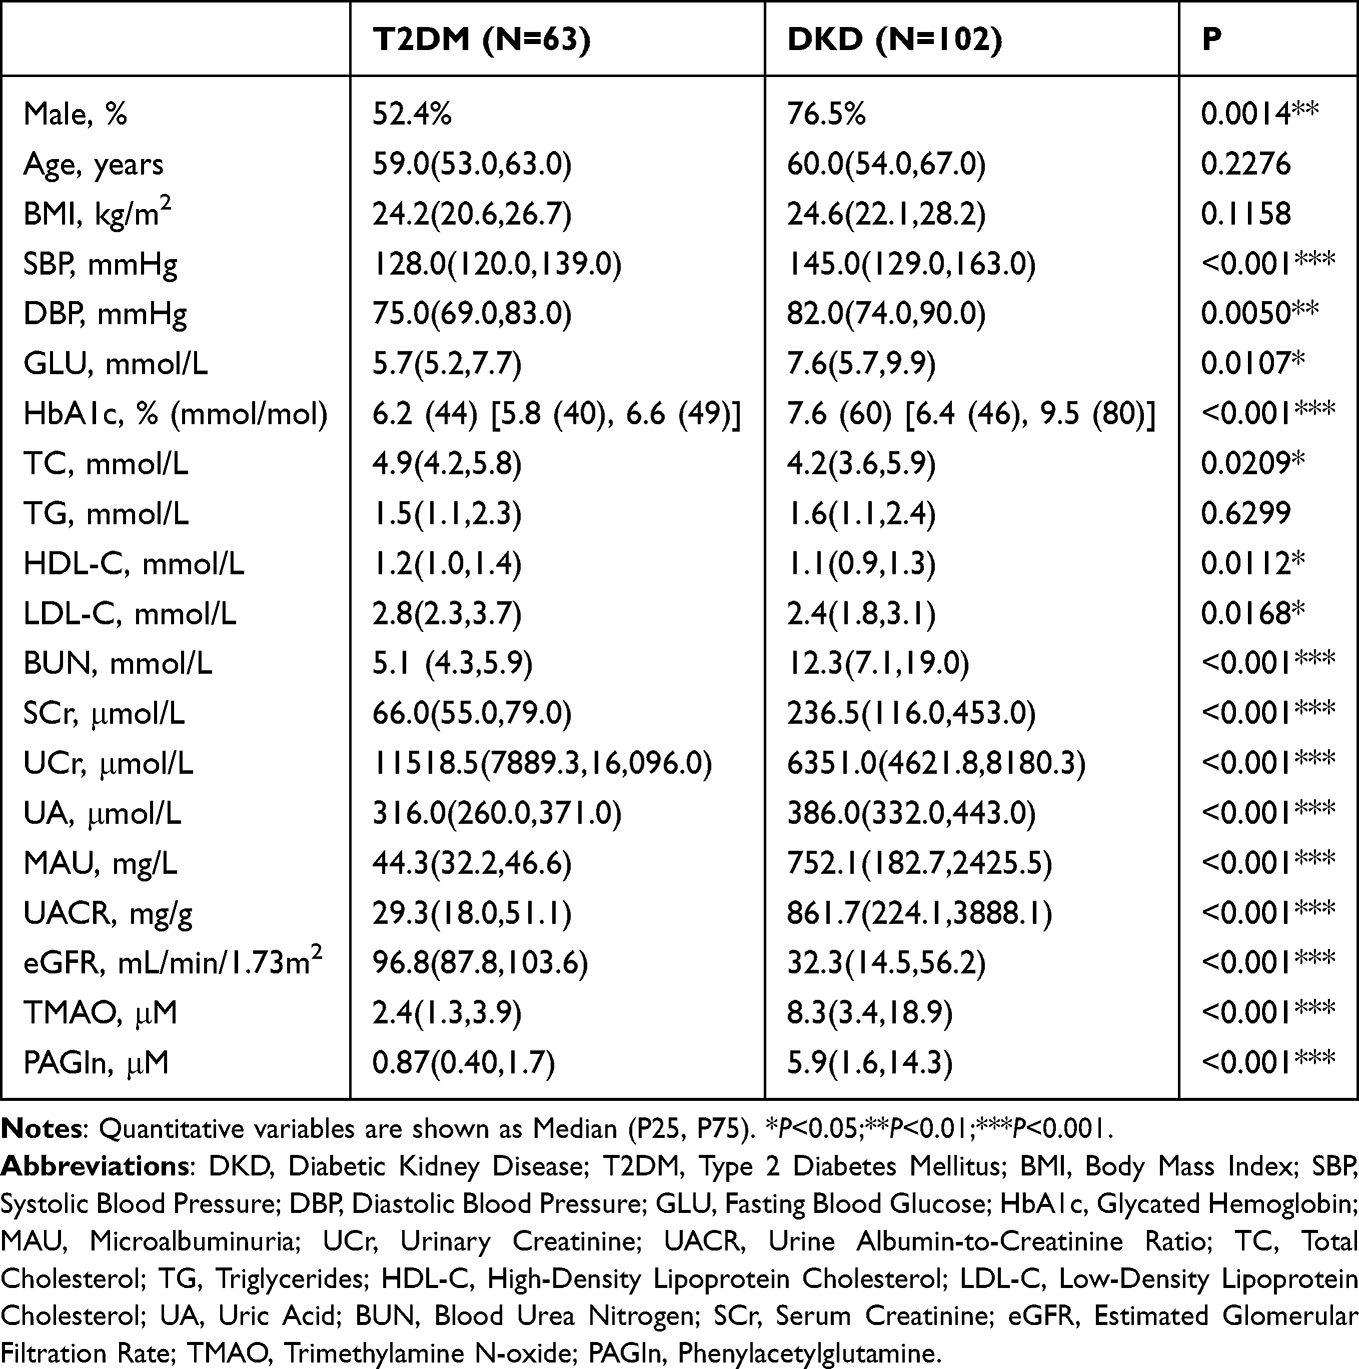 |
Table 1 Basic Characteristics and Laboratory Examination Results of Patients with DKD and T2DM |
Assessment of renal function indicated that BUN, Scr, MAU, and UACR were significantly higher in the DKD group compared to the T2DM group (P < 0.001), while the eGFR was significantly lower (P < 0.001). Notably, the UA levels were significantly elevated in the DKD group compared to the T2DM group (P < 0.001), indicating more severe uric acid metabolic disturbances. As shown in Figure 1, analysis of gut microbiota-derived metabolites revealed that plasma levels of TMAO and PAGln were significantly elevated in the DKD group compared with controls [TMAO: 8.3 (3.4–18.9) vs. 2.4 (1.3–3.9) μM; PAGln: 5.9 (1.6–14.3) vs. 0.87 (0.40–1.7) μM; both P < 0.001].
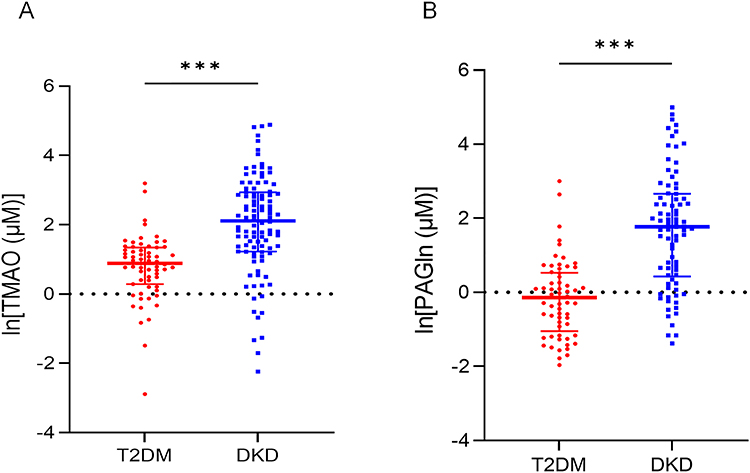 |
Figure 1 Plasma TMAO and PAGln Levels in Patients. (A) Plasma TMAO Levels in Patients with T2DM and DKD; (B) Plasma PAGln Levels in Patients with T2DM and DKD, T2DM: Type 2 Diabetes Mellitus; DKD: Diabetic Kidney Disease. In each box plot, the horizontal line within the box represents the median, the box boundaries indicate the interquartile range (25th to 75th percentile), and the whiskers extend to the minimum and maximum values within 1.5 times the interquartile range. ***P<0.001. |
Correlation of TMAO and PAGln with Renal Function Indicators
The assessment of renal function relies on several key indicators, including Scr, BUN, and eGFR, all of which reflect glomerular filtration capacity. Urinary indices that serve as direct markers of renal dysfunction include MAU and the UACR. Among markers of uric acid metabolism, serum UA level primarily reflects renal excretory capacity. As shown in Table 2 and Figure 2, plasma TMAO levels demonstrated significant positive correlations with BUN (r = 0.610), Scr (r = 0.617), UA (r = 0.379), MAU (r = 0.303), and UACR (r = 0.323) (P < 0.01), and a significant inverse correlation with eGFR (r = −0.616, P < 0.001). Collectively, these findings indicate that TMAO may hold potential value for identifying DKD.
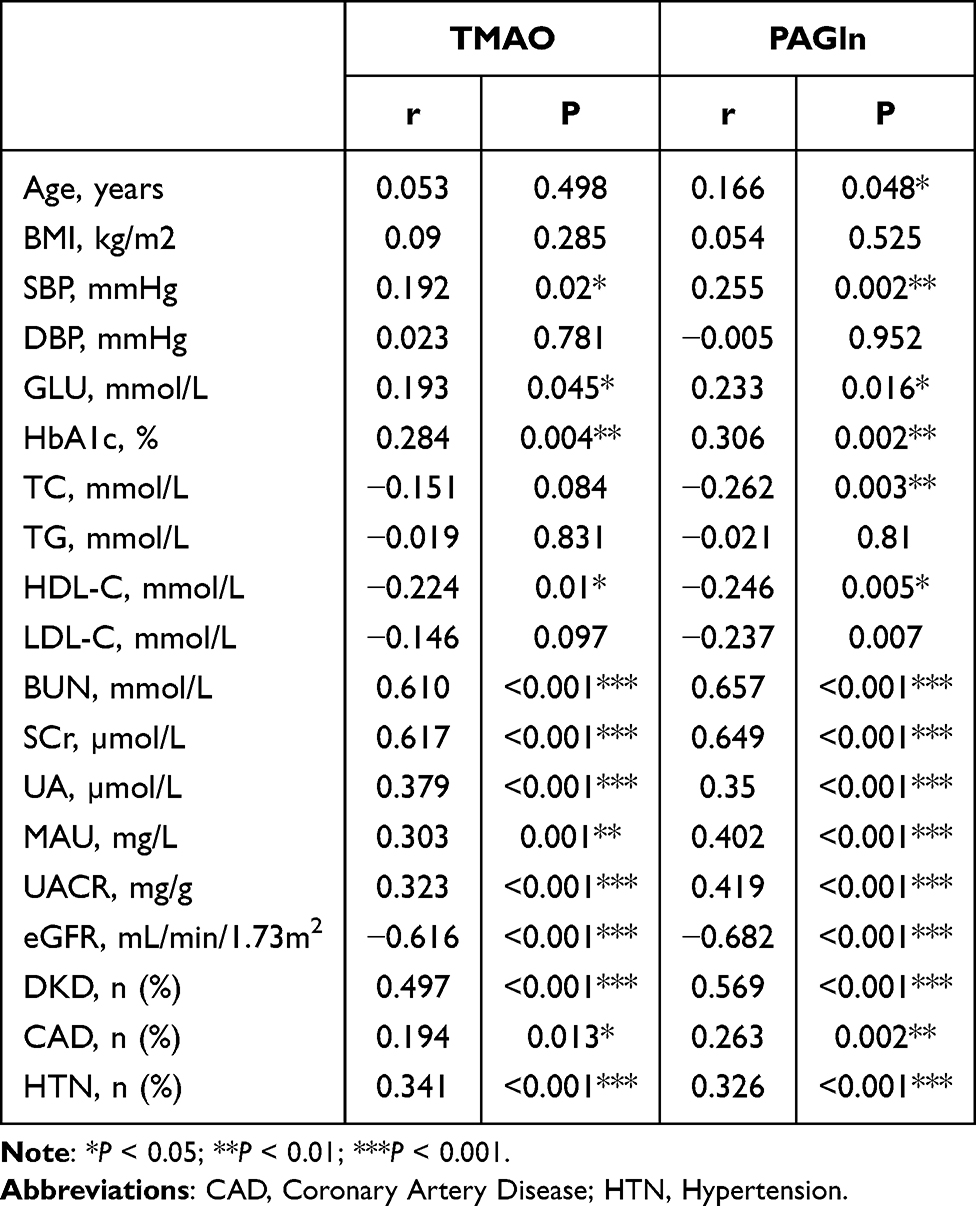 |
Table 2 Correlation of TMAO and PAGln with Renal Function Indicators |
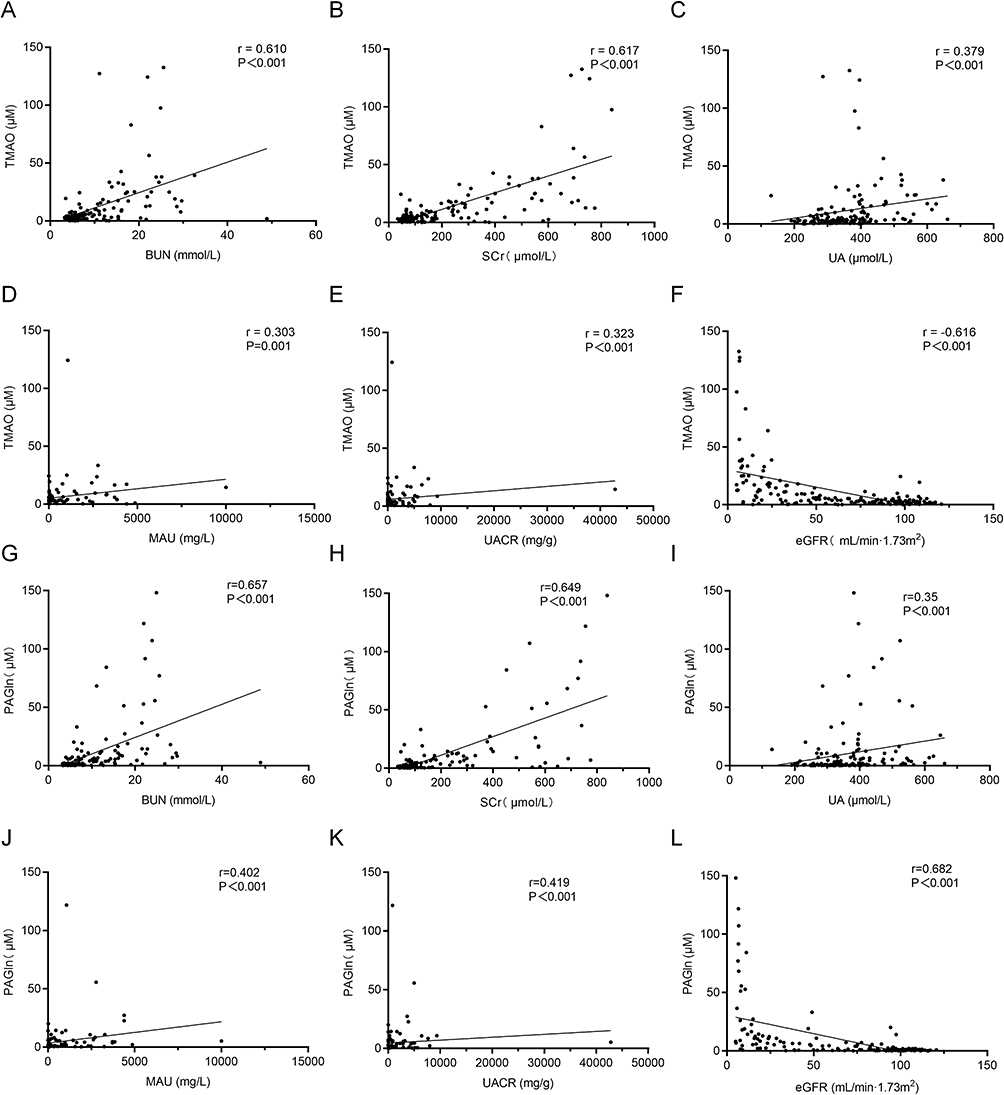 |
Figure 2 Correlation of TMAO and PAGln with Renal Function Indicators. (A) TMAO and BUN; (B) TMAO and SCr; (C) TMAO and UA; (D) TMAO and MAU; (E) TMAO and UACR; (F) TMAO and eGFR; (G) PAGln and BUN; (H) PAGln and SCr; (I) PAGln and UA; (J) PAGln and MAU; (K) PAGln and UACR; (L) PAGln and eGFR. |
As demonstrated by the data analysis presented in Table 2 and Figure 2 significant correlations were observed between PAGln levels and key renal function indicators associated with DKD. Specifically, PAGln levels were positively correlated with serum BUN (r = 0.657), Scr (r = 0.649), UA (r = 0.35), MAU (r = 0.402), and UACR (r = 0.419) (P < 0.001), and negatively correlated with eGFR (r = −0.682, P < 0.001). These results indicate that elevated levels of PAGln are closely associated with impaired glomerular filtration and disturbances in protein metabolism, suggesting its potential utility as a novel biomarker for identifying and stratifying of DKD.
High Levels of TMAO and PAGln as Independent Correlates of DKD
As shown in Table 3, multivariable logistic regression analyses demonstrated that both plasma TMAO (OR = 10.83; 95% CI, 4.99–23.51; P < 0.001) and PAGln (OR = 12.55; 95% CI, 4.65–33.86; P < 0.001) were significantly associated with an elevated risk of DKD in the unadjusted models. Following adjustment for established cardiometabolic risk factors (age, sex, BMI, systolic and diastolic blood pressure, coronary heart disease, and lipid profile including TC, TG, LDL-C, and HDL-C) based on their well-documented associations with DKD in prior literature and current clinical guidelines, both TMAO (OR = 11.42; 95% CI, 4.54–28.98; P < 0.001) and PAGln (OR = 21.02; 95% CI, 7.05–62.72; P < 0.001) persisted as significant independent factors associated with DKD. These significant associations remained even after additional adjustment for renal function indicators (eGFR, blood urea nitrogen, and uric acid) to assess whether these metabolites provide incremental value beyond established markers of kidney function (TMAO: OR = 8.69; 95% CI, 2.37–31.85; P = 0.001; PAGln: OR = 4.38; 95% CI, 1.05–18.33; P = 0.04).
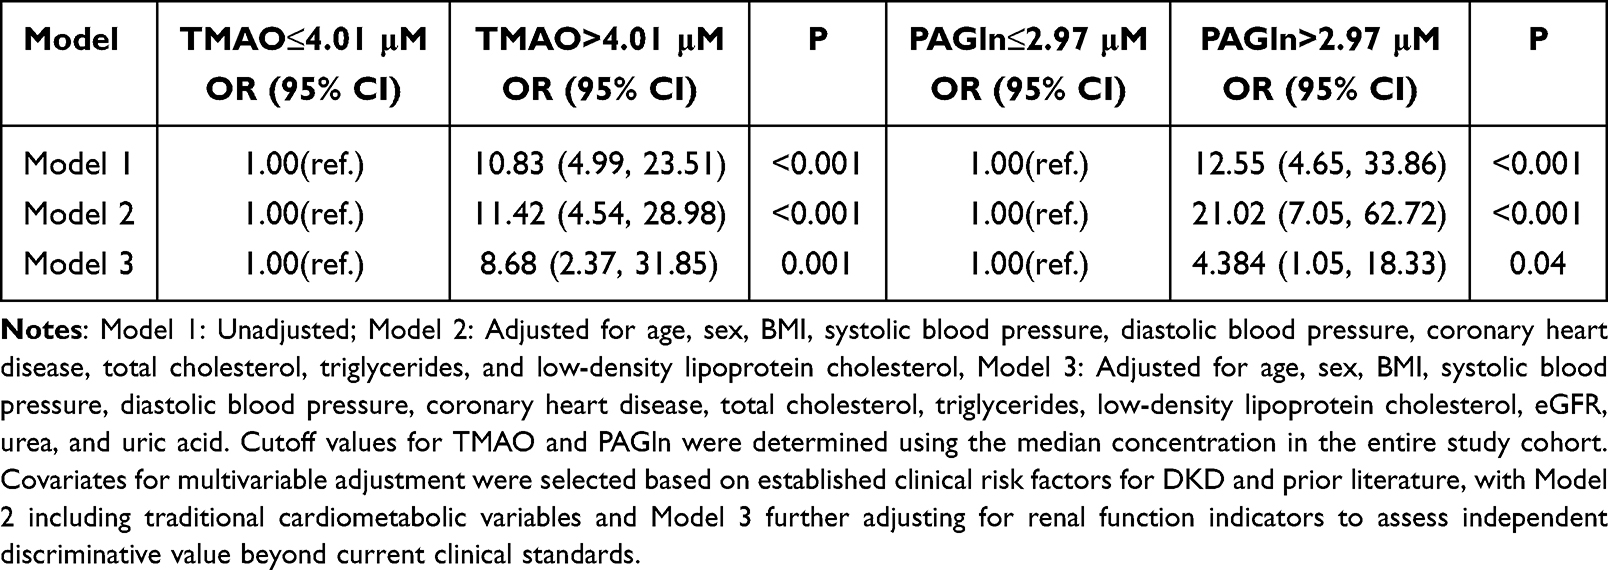 |
Table 3 High Levels of TMAO and PAGln as Independent Correlates of DKD |
Progressive Elevation of TMAO and PAGln Across Declining eGFR Categories
To examine the relationship between gut microbiota-derived metabolites and renal function in T2DM, patients were stratified into three eGFR categories: ≥60, 30–59, and <30 mL/min/1.73 m2. Both TMAO and PAGln exhibited a marked stepwise increase with declining eGFR (Table 4), with the highest levels observed in patients with severe renal impairment (P < 0.001). These findings indicate that circulating TMAO and PAGln rise progressively as renal function deteriorates.
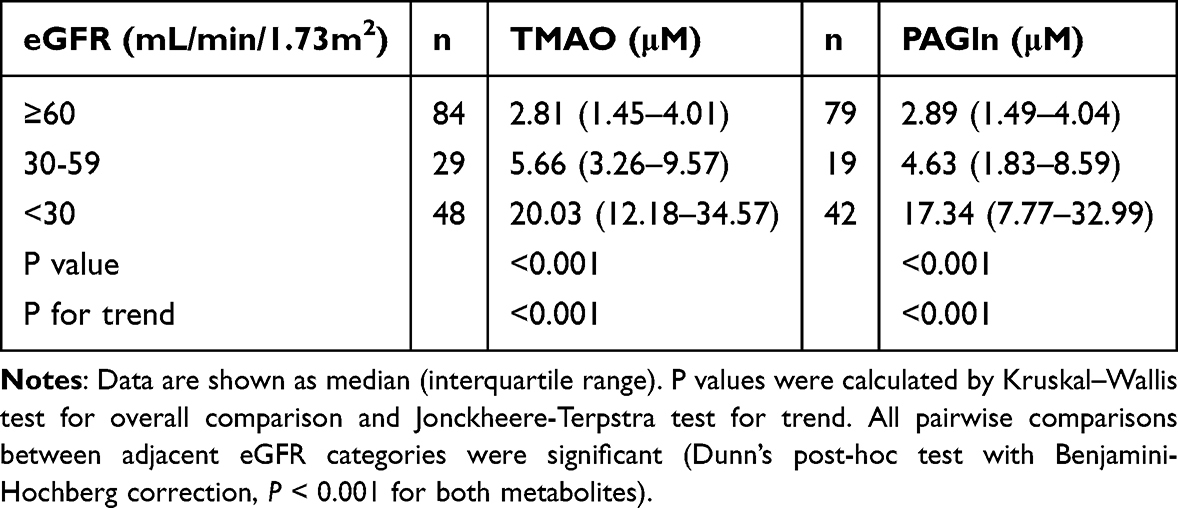 |
Table 4 Plasma Concentrations of TMAO and PAGln According to eGFR Strata |
Identification Value of Combined TMAO and PAGln for DKD
ROC curve analysis was conducted to evaluate the ability of TMAO and PAGln, both individually and in combination, to identify DKD. Specificity, sensitivity, the AUC, and optimal cutoff values were calculated. As summarized in Table 5 and Figure 3, the AUC of TMAO for identifying DKD was 0.795, with a sensitivity of 65.7% and a specificity of 92.1% at the optimal cutoff value (corresponding to a plasma TMAO level of 5.257 μM) determined by the maximum Youden index. For PAGln, the AUC was 0.832, with a sensitivity of 68.3% and a specificity of 88.5% at the optimal cutoff (plasma PAGln level of 3.64 μM) based on the maximum Youden index. The combination of TMAO and PAGln achieved a significantly higher AUC of 0.846 for identifying DKD, with a substantial increase in sensitivity (75.6%) while maintaining high specificity (85.2%).
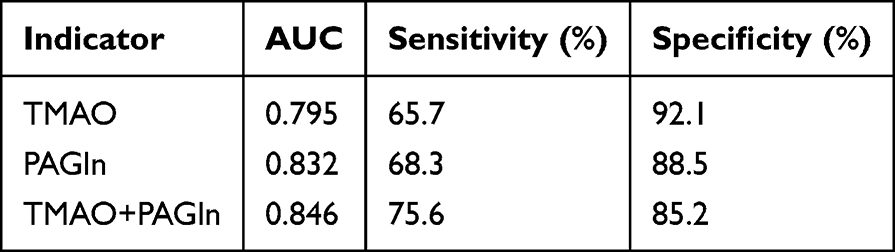 |
Table 5 ROC Curve Analysis of Plasma TMAO, PAGln, and Their Combination for Identifying DKD |
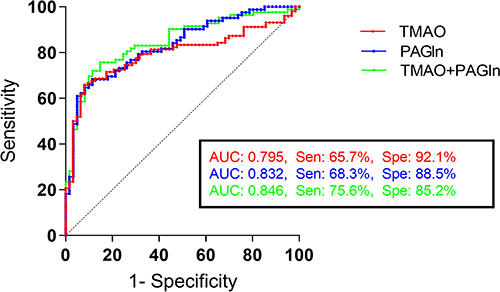 |
Figure 3 Analysis of the Discriminative Value of PAGln and TMAO for Identifying DKD. |
Discussion
DKD is a prevalent microvascular complication of diabetes and a leading cause of ESKD and cardiovascular mortality worldwide. Consequently, identification and regular assessment are crucial for mitigating disease progression. Conventional biomarkers, such as MAU, SCr, BUN, and eGFR, are associated with well-documented limitations. Their identification specificity and accuracy are often compromised by susceptibility to various confounding factors, including acute infections, strenuous exercise, hemorrhage, and exposure to nephrotoxic agents.30,31 Therefore, identifying novel biomarkers to accurately assess DKD prognosis is imperative. Such biomarkers are needed to enhance identification precision, reduce under‑identification, facilitate early intervention, and allow dynamic monitoring of disease progression, thereby optimizing therapeutic strategies.
Accumulating evidence establishes TMAO, a gut microbiota-derived metabolite, as a pathogenic mediator in CVD, CKD, and various diabetic complications. These complications encompass diabetic retinopathy,32 cognitive dysfunction associated with T2DM,33 and an increased risk of osteoporotic fractures in individuals with diabetes.34 Notably, elevated TMAO levels have been identified as an independent risk factor for the progression of DKD.16 Consistent with previous reports, it was demonstrated that plasma TMAO concentrations are significantly elevated in patients with DKD compared to those with T2DM alone. Furthermore, circulating TMAO levels correlated significantly with several indices of renal function, supporting its association with renal impairment. Multivariable logistic regression analysis identified that elevated TMAO is an independent correlate of DKD, suggesting its potential utility as a biomarker for identification. However, as a standalone identification test for DKD, TMAO exhibited high specificity but limited sensitivity and a modest AUC.
Although initially characterized as a cardiovascular risk factor, PAGln has been implicated in a broader spectrum of pathologies, including CKD and diabetic sequelae. Elevated circulating PAGln levels have recently been associated with cognitive decline in CKD35 and established as a metabolic signature of distal symmetric polyneuropathy in T2DM.29 This study provides the first evidence that PAGln is also associated with DKD. Plasma PAGln concentrations were significantly elevated in participants with DKD compared to those with T2DM alone and positively correlated with several metrics of renal dysfunction. Multivariable logistic regression analysis identified PAGln as an independent factor associated with DKD. The strong graded association with declining renal function suggests that it may not only be a biomarker but also contribute to disease progression, positioning it as a candidate for identification and risk stratification.
Nonetheless, similar to most single-analyte biomarkers, PAGln demonstrated limited sensitivity. A multimarker panel integrating PAGln and TMAO demonstrated significantly superior identification performance compared to either analyte alone, achieving a higher AUC and enhanced sensitivity while maintaining acceptable specificity, thereby highlighting its synergistic value for the identification of DKD. Both TMAO and PAGln are uremic toxins that contribute to the progression of CKD and CVD. In DKD, these metabolites mediate renal injury through distinct but interconnected pathways. TMAO primes a maladaptive inflammatory response, inducing endothelial damage36 and stimulating the release of pro-inflammatory mediators,37 which collectively increase the vulnerability of renal tissue. PAGln promotes endothelial dysfunction via G-protein-coupled receptors,38 amplifying vasoconstriction, platelet activation, and cellular stress.24 Consequently, the inflammatory milieu elicited by TMAO potentiates the deleterious effects of PAGln-receptor activation. In turn, PAGln-mediated vasculopathy and thromboinflammation feedback to exacerbate local inflammation and ischemia-reperfusion injury. This vicious cycle ultimately accelerates DKD progression. An important finding of this study is the clear dose-response relationship between declining eGFR and rising plasma levels of both TMAO and PAGln. The stepwise elevation observed across eGFR categories—from preserved renal function (eGFR ≥60) to moderate (30–59) and severe (<30) impairment—strengthens the biological plausibility of these metabolites as sensitive indicators of DKD progression. Notably, even among patients with eGFR ≥60, elevated metabolite levels were detectable, suggesting their potential as early diagnostic adjuncts.
However, several limitations warrant acknowledgment. First, the relatively small sample size and single-center design may introduce selection bias and limit generalizability. Thus, the PAGln/TMAO biomarker panel requires validation in prospective, multi-center cohorts with greater ethnic and geographic diversity. Second, the cross-sectional design precludes causal inference, necessitating validation of the underlying mechanisms in vitro and in vivo. Third, although all samples were collected under fasting conditions to minimize acute dietary interference, the lack of detailed dietary records precluded adjustment for habitual intake of TMAO precursors (eg, choline and L-carnitine12,39). It is worth noting that dietary patterns in Chinese populations typically differ from Western diets, with lower habitual intake of red meat and higher consumption of plant-based foods. These differences in dietary habits may contribute to variations in baseline TMAO levels across populations, highlighting the need for future cross-population studies with standardized dietary assessments to clarify these potential effects. Fourth, although we adjusted for major clinical covariates, detailed medication history (including statin use) was not incorporated into all multivariable models, which may introduce residual confounding. Additional limitations include the lack of stage-stratified analyses and longitudinal data on biomarker trajectories. The identification performance of TMAO and PAGln was not systematically compared across DKD stages (I–V), nor were temporal changes in their concentrations characterized throughout disease progression. Subsequent studies should enroll larger cohorts, stratify participants by DKD stage, and serially quantify TMAO and PAGln levels to delineate their predictive windows, particularly in early-stage disease. Finally, the prognostic utility of the PAGln/TMAO signature remains unestablished. Prospective studies with long-term follow-up are required to determine whether this panel predicts hard renal outcomes (eg, progression to ESKD) and cardiovascular events. Integration of these biomarkers into a multivariable prognostic model could inform individualized therapeutic strategies and improve the overall management of patients with DKD.
Conclusion
Based on this single-center study, we conclude that the combined measurement of TMAO and PAGln outperforms the use of either biomarker alone, achieving a significantly higher AUC and sensitivity while maintaining high specificity. Furthermore, this study provided the first evidence that circulating PAGln levels are not only elevated in DKD but also independently associated with the presence of DKD.
Highlights
- The combined use of TMAO and PAGln exhibits superior indicative value for DKD compared to either biomarker alone.
- This study provides initial evidence that PAGln correlates with indices of renal function, supporting its potential as a novel non-invasive indicator of DKD.
- PAGln was identified as an independent factor associated with DKD in this study.
Data Sharing Statement
The original contributions presented in this study are included in the article. Further inquiries can be directed to the corresponding authors.
Ethics Statement
The study was conducted in accordance with the Declaration of Helsinki, and the protocol was approved by the Ethics Committee of the Third Xiangya Hospital, Central South University (approval no. Quick-23590) on 28 August 2023. This trial was registered at the Chinese Clinical Trial Registry (ChiCTR2400094028).
Informed consent was obtained from all subjects involved in the study. Written informed consent has been obtained from the patients to publish this paper.
Author Contributions
Guilin Xiong (contributed equally): Conceptualization, Formal Analysis, Investigation, Data Curation, Writing – Original Draft. Qing Fang (contributed equally): Conceptualization, Methodology, Validation, Investigation, Writing – Original Draft. Hao Wu: Validation, Investigation, Data Curation, Writing – Review & Editing. Di Zhang: Investigation, Resources, Writing – Review & Editing. Jiangang Wang: Investigation, Resources, Writing – Review & Editing. Yuexiang Qin: Investigation, Resources, Writing – Review & Editing. Zi Chen: Investigation, Resources, Writing – Review & Editing. Yusi Wu: Validation, Investigation, Data Curation, Writing – Review & Editing. Yuyan Lei: Validation, Investigation, Data Curation, Writing – Review & Editing. Yimin Cui: Writing – Review & Editing, Supervision, Methodology, Project Administration. Lulu Chen: Writing – Review & Editing, Formal Analysis, Supervision, Project Administration. Xiaohui Li: Writing – Review & Editing, Data Curation, Supervision. Ying Li: Writing – Review & Editing, Validation, Supervision, Resources, Project Administration. Dongsheng Ouyang: Writing – Review & Editing, Formal Analysis, Supervision, Project Administration, Funding Acquisition. All authors gave final approval of the version to be published; have agreed on the journal to which the article has been submitted; and agree to be accountable for all aspects of the work.
Funding
This work was supported by grants from Hunan Key Laboratory for Bioanalysis of Complex Matrix Samples (2017TP1037); Huxiang Youth Talents Science and Technology Innovation Project (2023RC3232); Hunan Science and Technology Talent Support Project (2023TJ-N20); National Natural Science Foundation of China (81973324); Hunan Young Talent grant (2020RC3063); Natural Science Foundation of Hunan Province (2020JJ5858); Natural Science Foundation of Hunan Province (2025JJ50501); Wisdom Accumulation and Talent Cultivation Project of the Third XiangYa hospital of Central South University (YX202002); Natural Science Foundation of Hunan Province (2023JJ30858); National Natural Science Foundation of China (82473924); Self-funded research project of the Health Commission of Guangxi Zhuang Autonomous Region (Z-A20231168).
Disclosure
The authors declare that they have no known competing financial interests or personal relationships that could have appeared to influence the work reported in this paper.
References
1. Sun H, Saeedi P, Karuranga S, et al. IDF diabetes atlas: global, regional and country-level diabetes prevalence estimates for 2021 and projections for 2045. Diabet Res Clin Pract. 2022;183:109119. doi:10.1016/j.diabres.2021.109119
2. Bonner R, Albajrami O, Hudspeth J, Upadhyay A. Diabetic kidney disease. Prim Care. 2020;47(4):645–13. doi:10.1016/j.pop.2020.08.004
3. Gupta S, Dominguez M, Golestaneh L. Diabetic kidney disease: an update. Med Clin North Am. 2023;107(4):689–705. doi:10.1016/j.mcna.2023.03.004
4. Mogensen CE, Christensen CK, Vittinghus E. The stages in diabetic renal disease. With emphasis on the stage of incipient diabetic nephropathy. Diabetes. 1983;32 Suppl 2:64–78. doi:10.2337/diab.32.2.S64
5. Levey AS, de Jong PE, Coresh J, et al. The definition, classification, and prognosis of chronic kidney disease: a KDIGO Controversies Conference report. Kidney Int. 2011;80(1):17–28. doi:10.1038/ki.2010.483
6. Warram JH, Gearin G, Laffel L, Krolewski AS. Effect of duration of type I diabetes on the prevalence of stages of diabetic nephropathy defined by urinary albumin/creatinine ratio. J Am Soc Nephrol. 1996;7(6):930–937. doi:10.1681/ASN.V76930
7. Giron-Luque F, Garcia-Lopez A, Baez-Suarez Y, Patino-Jaramillo N. Comparison of three glomerular filtration rate estimating equations with 24-hour urine creatinine clearance measurement in potential living kidney donors. Int J Nephrol. 2023;2023:2022641. doi:10.1155/2023/2022641
8. Tao S, Li L, Li L, et al. Understanding the gut-kidney axis among biopsy-proven diabetic nephropathy, type 2 diabetes mellitus and healthy controls: an analysis of the gut microbiota composition. Acta Diabetol. 2019;56(5):581–592. doi:10.1007/s00592-019-01316-7
9. Chen W, Zhang M, Guo Y, et al. The profile and function of gut microbiota in diabetic nephropathy. Diab Metab Syndr Obes. 2021;14:4283–4296. doi:10.2147/DMSO.S320169
10. Liu S, Gui Y, Wang MS, et al. Serum integrative omics reveals the landscape of human diabetic kidney disease. Mol Metab. 2021;54:101367. doi:10.1016/j.molmet.2021.101367
11. Liu Y, Hou Y, Wang G, Zheng X, Hao H. Gut microbial metabolites of aromatic amino acids as signals in host-microbe interplay. Trends Endocrinol Metab. 2020;31(11):818–834. doi:10.1016/j.tem.2020.02.012
12. Obeid R, Awwad HM, Rabagny Y, Graeber S, Herrmann W, Geisel J. Plasma trimethylamine N-oxide concentration is associated with choline, phospholipids, and methyl metabolism. Am J Clin Nutr. 2016;103(3):703–711. doi:10.3945/ajcn.115.121269
13. Wang Z, Klipfell E, Bennett BJ, et al. Gut flora metabolism of phosphatidylcholine promotes cardiovascular disease. Nature. 2011;472(7341):57–63. doi:10.1038/nature09922
14. Huang Y, Wu Y, Zhang Y, et al. Dynamic changes in gut microbiota-derived metabolite trimethylamine-N-oxide and risk of type 2 diabetes mellitus: potential for dietary changes in diabetes prevention. Nutrients. 2024;16(11):1711. doi:10.3390/nu16111711
15. Wang M, Tang WHW, Li XS, et al. The gut microbial metabolite trimethylamine N -oxide, incident CKD, and kidney function decline. J Am Soc Nephrol. 2024;35(6):749–760. doi:10.1681/ASN.0000000000000344
16. Huang Y, Zhu Z, Huang Z, Zhou J. Elevated serum trimethylamine oxide levels as potential biomarker for diabetic kidney disease. Endocr Connect. 2023;12(8). doi:10.1530/EC-22-0542
17. Fang Q, Zheng B, Liu N, et al. Trimethylamine N-oxide exacerbates renal inflammation and fibrosis in rats with diabetic kidney disease. Front Physiol. 2021;12:682482. doi:10.3389/fphys.2021.682482
18. Yi ZY, Peng YJ, Hui BP, et al. Zuogui-Jiangtang-Yishen decoction prevents diabetic kidney disease: intervene pyroptosis induced by trimethylamine n-oxide through the mROS-NLRP3 axis. Phytomedicine. 2023;114:154775. doi:10.1016/j.phymed.2023.154775
19. Xu M, Zheng J, Hou T, et al. SGLT2 inhibition, choline metabolites, and cardiometabolic diseases: a mediation mendelian randomization study. Diab Care. 2022;45(11):2718–2728. doi:10.2337/dc22-0323
20. Seakins JW. The determination of urinary phenylacetylglutamine as phenylacetic acid. Studies on its origin in normal subjects and children with cystic fibrosis. Clin Chim Acta. 1971;35(1):121–131. doi:10.1016/0009-8981(71)90302-0
21. Agergaard J, Justesen TEH, Jespersen SE, Tagmose Thomsen T, Holm L, van Hall G. Even or skewed dietary protein distribution is reflected in the whole-body protein net-balance in healthy older adults: a randomized controlled trial. Clin Nutr. 2023;42(6):899–908. doi:10.1016/j.clnu.2023.04.004
22. Barrios C, Beaumont M, Pallister T, et al. Gut-microbiota-metabolite axis in early renal function decline. PLoS One. 2015;10(8):e0134311. doi:10.1371/journal.pone.0134311
23. Zhu Y, Dwidar M, Nemet I, et al. Two distinct gut microbial pathways contribute to meta-organismal production of phenylacetylglutamine with links to cardiovascular disease. Cell Host Microbe. 2023;31(1):18–32.e9. doi:10.1016/j.chom.2022.11.015
24. Nemet I, Saha PP, Gupta N, et al. A cardiovascular disease-linked gut microbial metabolite acts via adrenergic receptors. Cell. 2020;180(5):862–877.e22. doi:10.1016/j.cell.2020.02.016
25. Romano KA, Nemet I, Prasad Saha P, et al. Gut microbiota-generated phenylacetylglutamine and heart failure. Circ Heart Fail. 2023;16(1):e009972. doi:10.1161/CIRCHEARTFAILURE.122.009972
26. Ottosson F, Brunkwall L, Smith E, et al. The gut microbiota-related metabolite phenylacetylglutamine associates with increased risk of incident coronary artery disease. J Hypertens. 2020;38(12):2427–2434. doi:10.1097/HJH.0000000000002569
27. Jalan R, Wright G, Davies NA, Hodges SJ. L-Ornithine phenylacetate (OP): a novel treatment for hyperammonemia and hepatic encephalopathy. Med Hypotheses. 2007;69(5):1064–1069. doi:10.1016/j.mehy.2006.12.061
28. Poesen R, Claes K, Evenepoel P, et al. Microbiota-derived phenylacetylglutamine associates with overall mortality and cardiovascular disease in patients with CKD. J Am Soc Nephrol. 2016;27(11):3479–3487. doi:10.1681/ASN.2015121302
29. Xu J, Cai M, Wang Z, et al. Phenylacetylglutamine as a novel biomarker of type 2 diabetes with distal symmetric polyneuropathy by metabolomics. J Endocrinol Invest. 2023;46(5):869–882. doi:10.1007/s40618-022-01929-w
30. Furuichi K, Shimizu M, Hara A, Toyama T, Wada T. Diabetic nephropathy: a comparison of the clinical and pathological features between the CKD Risk classification and the classification of diabetic nephropathy 2014 in Japan. Intern Med. 2018;57(23):3345–3350. doi:10.2169/internalmedicine.1132-18
31. Papadopoulou-Marketou N, Kanaka-Gantenbein C, Marketos N, Chrousos GP, Papassotiriou I. Biomarkers of diabetic nephropathy: a 2017 update. Crit Rev Clin Lab Sci. 2017;54(5):326–342. doi:10.1080/10408363.2017.1377682
32. Liu W, Wang C, Xia Y, et al. Elevated plasma trimethylamine-N-oxide levels are associated with diabetic retinopathy. Acta Diabetol. 2021;58(2):221–229. doi:10.1007/s00592-020-01610-9
33. Xu N, Wan J, Wang C, Liu J, Qian C, Tan H. Increased serum trimethylamine n-oxide level in type 2 diabetic patients with mild cognitive impairment. Diabetes Metab Syndr Obes. 2022;15:2197–2205. doi:10.2147/DMSO.S370206
34. Yuan Y, Gan C, Wang M, et al. Association of serum trimethylamine N-oxide levels and bone mineral density in type 2 diabetes mellitus. Endocrine. 2024;84(3):958–968. doi:10.1007/s12020-024-03699-2
35. Levassort H, Boucquemont J, Liabeuf S, et al. Association of phenylacetylglutamine and cognitive impairment in CKD. Kidney Int Rep. 2025;10(8):2720–2731. doi:10.1016/j.ekir.2025.05.037
36. Querio G, Antoniotti S, Geddo F, Levi R, Gallo MP. Modulation of endothelial function by TMAO, a gut microbiota-derived metabolite. Int J Mol Sci. 2023;24(6):5806. doi:10.3390/ijms24065806
37. Stefania K, Ashok KK, Geena PV, Katarina P, Isak D. TMAO enhances TNF-α mediated fibrosis and release of inflammatory mediators from renal fibroblasts. Sci Rep. 2024;14(1):9070. doi:10.1038/s41598-024-58084-w
38. Li Z, Gu M, Zaparte A, et al. Alcohol-induced gut microbial reorganization and associated overproduction of phenylacetylglutamine promotes cardiovascular disease. Nat Commun. 2024;15(1):10788. doi:10.1038/s41467-024-55084-2
39. Cho CE, Aardema NDJ, Bunnell ML, et al. Effect of choline forms and gut microbiota composition on trimethylamine-N-oxide response in healthy men. Nutrients. 2020;12(8):2220. doi:10.3390/nu12082220
 © 2026 The Author(s). This work is published and licensed by Dove Medical Press Limited. The
full terms of this license are available at https://www.dovepress.com/terms
and incorporate the Creative Commons Attribution
- Non Commercial (unported, 4.0) License.
By accessing the work you hereby accept the Terms. Non-commercial uses of the work are permitted
without any further permission from Dove Medical Press Limited, provided the work is properly
attributed. For permission for commercial use of this work, please see paragraphs 4.2 and 5 of our Terms.
© 2026 The Author(s). This work is published and licensed by Dove Medical Press Limited. The
full terms of this license are available at https://www.dovepress.com/terms
and incorporate the Creative Commons Attribution
- Non Commercial (unported, 4.0) License.
By accessing the work you hereby accept the Terms. Non-commercial uses of the work are permitted
without any further permission from Dove Medical Press Limited, provided the work is properly
attributed. For permission for commercial use of this work, please see paragraphs 4.2 and 5 of our Terms.
Recommended articles

Molecular Pathways of Diabetic Kidney Disease Inferred from Proteomics
Wei L, Han Y, Tu C
Diabetes, Metabolic Syndrome and Obesity 2023, 16:117-128
Published Date: 12 January 2023