Back to Journals » International Journal of Nanomedicine » Volume 17
Transcriptomics-Based Investigation of Molecular Mechanisms Underlying Apoptosis Induced by ZnO Nanoparticles in Human Diffuse Large B-Cell Lymphoma
Authors Alsagaby SA ![]()
Received 23 December 2021
Accepted for publication 29 April 2022
Published 18 May 2022 Volume 2022:17 Pages 2261—2281
DOI https://doi.org/10.2147/IJN.S355408
Checked for plagiarism Yes
Review by Single anonymous peer review
Peer reviewer comments 2
Editor who approved publication: Prof. Dr. Anderson Oliveira Lobo
Suliman A Alsagaby
Department of Medical Laboratories Sciences, College of Applied Medical Sciences, Majmaah University, AL-Majmaah, 11932, Saudi Arabia
Correspondence: Suliman A Alsagaby, Email [email protected]
Introduction: Zinc oxide nanoparticles (ZnO NPs) show anti-cancer activity. Diffuse Large B-cell Lymphoma (DLBCL) is a type of B-cell malignancies with unsatisfying treatment outcomes. This study was set to assess the potential of ZnO NPs to selectively induce apoptosis in human DLBCL cells (OCI-LY3), and to describe possible molecular mechanisms of action.
Methods: The impact of ZnO NPs on DLBCL cells and normal peripheral blood mononuclear cells (PBMCs) was studied using cytotoxicity assay and flow-cytometry. Transcriptomics analysis was conducted to identify ZnO NPs-dependent changes in the transcriptomic profiles of DLBCL cells.
Results: ZnO NPs selectively induced apoptosis in DLBCL cells, and caused changes in their transcriptomes. Deferential gene expression (DGE) with fold change (FC) ≥ 3 and p ≤ 0.008 with corrected p ≤ 0.05 was identified for 528 genes; 125 genes were over-expressed and 403 genes were under-expressed in ZnO NPs-treated DLBCL cells. The over-expressed genes involved in biological processes and pathways like stress response to metal ion, cellular response to zinc ion, metallothioneins bind metals, oxidative stress, and negative regulation of growth. In contrast, the under-expressed genes were implicated in DNA packaging complex, signaling by NOTCH, negative regulation of gene expression by epigenetic, signaling by WNT, M phase of cell cycle, and telomere maintenance. Setting the FC to ≥ 1.5 with p ≤ 0.05 and corrected p ≤ 0.1 showed ZnO NPs to induce over-expression of anti-oxidant genes and under-expression of oncogenes; target B-cell receptor (BCR) signaling pathway and NF-κB pathway; and promote apoptosis by intrinsic and extrinsic pathways.
Discussion: Overall, ZnO NPs selectively induced apoptosis in DLBCL cells, and possible molecular mechanisms of action were described.
Keywords: transcriptomics, ZnO NPs, DLBCL, apoptosis, mechanism of action
Introduction
A growing body of evidence has shown a therapeutic potential of nanoparticles (NPs) against a wide range of malignant cells.1 Previous research by us and others have shown a preferential killing of cancer cells, such as acute promyelocytic leukemia cells (HL-60),2 cervical carcinoma cells (HeLa),3 hepatocellular carcinoma cells (HepG2),4,5 lung cancer cells (A549),5,6 and breast cancer cells (MDA- MB-231)7 by metal NPs like gold NPs and silver NPs. Furthermore, earlier work on zinc oxide (ZnO) NPs, which are another example of metal NPs, have demonstrated the capability of the ZnO NPs to selectively induce apoptosis in cancer cells like acute promyelocytic leukemia cells (HL60) and chronic myeloid leukemia cells (K562) with almost no impact on the normal peripheral blood mononuclear cells (PBMCs).8,9 Similar results were found in breast cancer cells (MCF7),10 colon cancer cells (Caco-2),11 hepatocellular carcinoma cells (HepG2),12 lung adenocarcinoma (A549),12 ovarian cancer cells (SKOV3)13 and cervical carcinoma cells (HeLa).14 Despite the extensive research on the therapeutic potential of ZnO NPs against cancer cells, the molecular mechanism of apoptosis induction by ZnO NPs has not yet been fully illustrated. Nevertheless, the cytotoxicity of ZnO NPs has been related to the disequilibrium of zinc-dependent protein activity and to overproduction of reactive oxygen species (ROSs) in the treated cells.15–18
Transcriptomics is a high-throughput approach that enables a global gene expression profiling of all human coding genes in a single assay.19 Therefore, transcriptomics is a promising approach to provide insights into the molecular basis of malignent tumors and putative mechanism of NPs cytotoxicity against cancer cells.20–23 In this context, different investigators sought alterations induce by ZnO NPs in the transcriptome of cancer cells, such as lung cancer cells (A549),24 colon carcinoma cells (RKO),25 colorectal adenocarcinoma cells (Caco-2),25 melanoma cells (SK Mel-28),25 acute monocytic leukemia cells (THP-1)26 and acute T-cell leukemia cells (Jurkat A3).27 Nevertheless, as indicated by the search engines of “PubMed” and “Google Scholar” using the following key words “ZnO NPs gene expression and diffuse large B-cell lymphoma cells ” or “ZnO NPs transcriptomics and diffuse large B-cell lymphoma cells”, and to the best of our knowledge, no transcriptomics work on diffuse large B-cell lymphoma cells (DLBCL) treated with ZnO NPs was reported before.
DLBCL is the most prevalent type of lymphomas seen in adults.28 Despite the improvements that have been made in the new modalities of DLBCL therapy, the disease still follows an aggressive clinical course with unsatisfactory treatment outcomes, as large proportion of DLBCL patients shows recurrence or refractory disease.29,30 Achieving full remission in recurrence or refractory patients have been shown to be challenging, putting patients at high-risk of death.31 In fact, the five years overall survival of DLBCL patients was reported to be 50%, especially in patients diagnosed with the subtype known as activated B-cell like (ABC), in which relapse and refractory are frequently reported.32 Therefore, there has been a great and urgent need for a new modality of therapy to improve the treatment outcomes of the disease.
Given the selective cytotoxicity of ZnO NPs against a wide range of cancer cells as reported above, the present work was set to investigate the potential of ZnO NPs to induce apoptosis in human DLBCL cell line (OCI-LY3), which has been established from a relapsed DLBCL (subtype ABC) patient with advanced stage of the disease, and has been known for its resistance to standard chemotherapies.33 Next, molecular mechanisms of action of ZnO NPs cytotoxicity on DLBCL cells were studied using transcriptomics. The expected findings of the current work would possibly advance our understanding about the therapeutic potential of ZnO NPs against the ABC subtype of DLBCL, and may form the fundamentals on which ZnO NPs-based clinical applications could be developed to overcome the refractory feature of this disease.
Materials and Methods
Cell Culture
Human DLBCL cells (OCI-LY3 cell line) were obtained from German Collection of Microorganisms and Cell Cultures GmbH (DSMZ). OCI-LY3 cells were cultivated in RPMI 1649 medium with 10% fetal bovine serum (FBS), 40 μg/mL gentamycin, 100 μg/mL streptomycin sulphate, 100 U/mL penicillin, 4.5 mg/mL glucose and 2 mg/mL sodium bicarbonate under humidified condition containing 5% CO2 at 37 °C. Blood samples of healthy donors were collected in accordance with the granted ethical approval from the Ethical Committee of Majmaah University in Saudi Arabia (MUREC-April.01/COM-206) and informed consents were obtained from all the participants. This work also adhered to the principles of the Declaration of Helsinki. Density-gradient centrifugation with lymphoprep were utilized for the isolation of peripheral blood mononuclear cells (PBMCs) from blood of healthy subjects. PBMCs were stimulated in RPMI 1640 medium supplemented with 10% FBS, 5 μg/mL phytohemagglutinin, 100 U/mL penicillin, 40 μg/mL gentamycin, 100 μg/mL streptomycin sulphate, 4.5 mg/mL glucose and 2 mg/mL sodium bicarbonate for 3 days at 37 °C under an atmosphere of humidified air containing 5% CO2. Next, the PBMCs were transferred to a medium as the above but which lacked phytohemagglutinin and contained 5 ng/mL of interleukin 2 and were incubated at 37 °C in a CO2 incubator for subsequent analysis.
Cytotoxicity Assay
The preparation and characterization of the ZnO NPs (Sigma-Aldrich #721077) used in the present study were previously reported by Triboulet et al.34 To assess the impact of ZnO NPs against DLBCL cells MTT assay was used. Suspension of DLBCL cells (3×10⁵ cells/mL) in RPMI 1640 medium supplemented with 10% FBS were seeded into 96-well culture plate (200 μL/ well) with different concentration of ZnO NPs (0 μg/mL, 10 μg/mL, 20 μg/mL, 30 μg/mL, 40 μg/mL, 50 μg/mL, 60 μg/mL, 70 μg/mL and 80 μg/mL). The 96-well culture plate was then incubated for five days (120 hours) at 37 °C in a CO2 incubator with no change of the culture medium.
The toxicity of the ZnO NPs on normal PBMCs compared with DLBCL cells was also studied using MTT assay. Suspensions of PBMCs (3×10⁵ cells/mL) in culture medium (RPMI 1640 with 10% FBS and 5 ng/mL interleukin 2) and suspensions of DLBCL cells (3×10⁵ cells/mL) in culture medium (RPMI 1640 supplemented with 10% FBS) were separately seeded into a 96-well culture plate (200 μL/well) containing different concentrations of ZnO NPs (0 μg/mL, 10 μg/mL, 20 μg/mL, and 30 μg/mL). Next, the cells were continuously incubated for 5 days (120 hours) at 37 °C with the presence of CO2 with no change of the culture medium.
Post incubation, MTT [3-(4,5-dimethylthiazol-2-yl)-2,5-diphenylt×10 trazolium bromide] assay was utilized to evaluate the viability of the DLBCL cells and PBMCs. Briefly, the medium was carefully removed, and a new medium (RPMI 1640) with FBS (10%) and MTT dye (final concentration 0.5 mg/mL) was added to the 96-well culture plate that was incubated for 3 hours at 37 °C. Next, the medium was removed and the formazan crystals were dissolved in DMSO (200 μL). Absorbance microplate reader was then used to measure the reduced levels of MTT at wavelength = 570 nm.35 All experiments were conducted three times independently.
Identification of the Type of Cell Death
To determine the type of killing of the DLBCL cells induced by the ZnO NPs, the DLBCL cells in RPMI 1640 medium with 10% FBS (3×10⁵ cells/mL) were incubate in a 6-well plate with and without ZnO NPs (30 μg/mL) for 24 hours at 37 °C in CO2 incubator. The type of cell death was investigated using FACS CantoII flow cytometer (Becton Dickinson) with an Annexin V-FITC Kit (Trevigen, Inc.). Briefly, a washing step of the malignant cells (3×10⁵ cells/mL) with cold 1X phosphate buffered saline (1X PBS) followed by centrifugation for 5 minutes at 300×g was done. Next, a dye solution (fluorescein-labeled Annexin V, propidium iodide and 1X binding buffer) was used to stain the cells for 15 minutes at room temperature in dark. Next, the stained cells were transferred into a FACS tube and 1X binding buffer was added to them. Finally, the cells were injected into FACS CantoII flow cytometer (Becton Dickinson) and analyzed using FACSdiva software (Becton Dickinson). The experiments were performed three times independently.
Determination of ROS Levels
ROS levels in the DLBCL cells with and without ZnO NPs treatment was measured using DCFH-DA (2ʹ,7ʹ-dichlorodihydrofluorescein diacetate). Suspensions of DLBCL cells (3×10⁵ cells/mL) in culture medium (RPMI 1640 supplemented with 10% FBS) were cultivated in a 96-well culture plate (200 μL/well) containing different concentrations of ZnO NPs (0 μg/mL, 30 μg/mL, 40 μg/mL, 50 μg/mL) for 24 hours at 37 °C with the presence of CO2. Post incubation, the cells were washed twice with PBS and were treated with the DCFH-DA (20 μM) and incubated as before for 1 hour. Next, the dichlorofluorescein (DCF) intensity was measured using microplate reader (Synergy-4) with an excitation wavelength = 338nm and emission wavelength = 500nm. The calculation of DCF intensity in the ZnO NPs treated cells was relative to that of the control cells (ZnO NPs = 0 μg/mL); and the final results were expressed in percentage. The experiments were conducted three times independently.
RNA Extraction and Quality Control
The reagents and the manufacturer’s protocol of RNeasy Mini Kit (QIAGEN) were used to extract total RNA from the DLBCL cells. NanoDrop ND-1000 spectro-photometer (Thermo Fisher Scientific, Inc.) was then utilized to measure the purity and quantity of the isolated RNA; use of RNA samples was limited to those with high purity (260 nm/280 nm ≥2). Similarly, the RNA Nano 6000 chips with the Agilent 2100 Bioanalyzer were used evaluate the integrity of the RNA samples according to the manufacturer’s instructions (Agilent Technologies, Inc.) RNA samples used for subsequent experiments had good integrity (RNA Integrity Number (RIN) ≥8).
Transcriptomics Profiling
The Agilent protocol of “one-color microarray-based gene expression analysis” was followed to study the transcriptomic profile of the DLBCL cells. Briefly, 100 ng of the isolated RNA from the DLBCL cells along with the RNA spikes from RNA Spike-In Kit, One-Color (Agilent) were converted to cDNA. Next, low input quick amp labeling (one-color) kit (Agilent) was used to transcribe and amplify the cDNA to fluorescent-labeled cRNA that was purified using the materials and protocol of RNeasy Mini Kits (QIAGEN). To assess the quality and quantity of the labeled cRNA, nanoDrop ND-1000 spectro-photometer (Thermo Fisher Scientific, Inc.) was utilized. All samples proceeded to the next step showed: 260 nm/280 nm ≥2, cRNA yield ≥825 ng and specific activity (pmol Cy3/μg cRNA) ≥6. To prepare the hybridization samples, 600 ng of the labeled cRNA was mixed with 5 μL of 10X Gene Expression Blocking Agent (Agilent) and 1 μL of 25X Fragmentation Buffer (Agilent), making a total volume of 25 μL. The labeled cRNA in the hybridization samples was then fragmented by incubation at 60°C for 30 min. To stop the fragmentation, 25 μL of 2X Hi-RPM hybridization Buffer (Agilent) was added to the pre-cooled hybridization samples (total volume = 50 μL). Next, 40 μL from each hybridization sample was added onto a gasket that was assembled to SurePrint G3 Human Gene Expression 8×60K Microarray slide (Agilent) and incubated for 17 hours at 65°C. Post incubation, a washing step using the Gene Expression Washing Buffer 1 and 2, to which 0.005% Triton X-102 was added (Agilent), was performed for the microarray slides. After that, the Agilent SureScan Microarray Scanner using the AgilentG3_GX_1color protocol was employed to scan the microarray slides. Next, Agilent Feature Extraction Software (version 11.0.1.1; Agilent Technologies, Inc.) was used to extract the quantitative data of probe features from the scanned microarray slides. The quantitative data were then saved for further analysis.
Data Analysis
The quantitative data of probe features that were saved in previous section were loaded into the GeneSpring GX version 12.1 software package (Agilent Technologies, Inc.). The log2 transformation and normalization (percentile shift algorithm with percentile target = 75) were applied to the quantitative data in order to generate normalized signal value of the probes. The analysis was limited to probe quantitative data with the flag labels: “detected” or “not detected”. Two conditions were made; treated condition (ZnO NPs-treated samples; n= 3) and untreated condition (untreated samples (control samples); n= 3). Probes were filtered according to their flag label; only probes with flag “detected” in all samples of either condition (treated condition or untreated condition) were used for the further analysis. Next, fold change (FC) was used to identify differentially expressed genes (DEGs) in the two groups of samples (the two conditions). To identify the most evident DEGs in the two conditions, FC was set to 3-fold or higher with p≤0.008 and corrected p≤0.05. Next, the FC cut-off was reduced to ≥1.5-fold with p≤0.05 and corrected p≤0.1 in attempt to broadly investigate ZnO NPs-induced transcriptomics alteration. Cluster analysis and heatmap presentations of DEGs were conducted using hierarchical algorithm and were based on probes (normalized signal value of probes) and conditions with Euclidean method for similarity measure and Wards for linkage rule. Gene ontology (GO) enrichment analyses were conducted using the GeneSpring GX version 12.1 software package (Agilent Technologies, Inc.) and only over-represented GO terms with corrected p≤0.05 were reported. Functional profiling the DEGs was also performed using the gProfiler36 (https://biit.cs.ut.ee/gprofiler/gost) against GO and biological pathways (KEGG pathway database, Reactome pathways database and WikiPathways database); the option “only annotated genes” was selected for statistical domain scope and corrected p-value cut-off was set at ≤0.05.
Statistical Analysis
The significance values (p values) were determined using paired Student’s t-test; and corrected p values were calculated on the basis of Benjamini–Hochberg false discovery rate (FDR). GeneSpring GX version 12.1 software package (Agilent Technologies, Inc.) was used for the generation of the p values and corrected p values of DEGs. Excel software was used to calculate the p values of the viability assay and the analyses titled identification of the type of cell death. Excel software was also utilized to calculate the means and standard deviations; and to construct the column graphs.
Results
Cytotoxicity of ZnO NPs and Identification of the Kind of Cell Death
To determine the impact of ZnO NPs on the viability of DLBCL cells, MTT assay was performed on DLBCL cells that were incubated with different concentrations of ZnO NPs (from 0 to 80 μg/mL) for 120 hours. ZnO NPs were found to confer cytotoxicity on DLBCL cells; the mean of 50% cytotoxic concentration (CC50) was 10 μg/mL (Figure 1A).
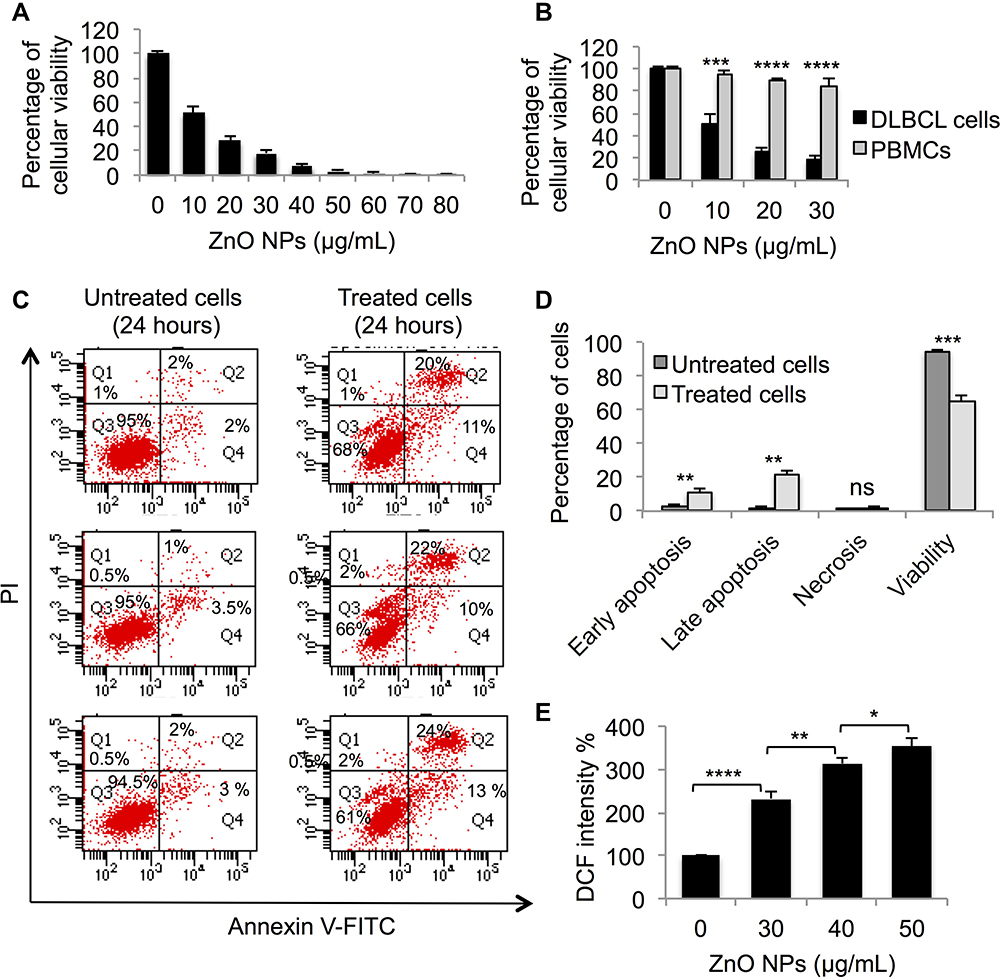 |
Figure 1 Evaluation of the cytotoxicity of ZnO NPs against DLBCL cells and normal cells. The viability of DLBCL cells (A) and PBMCs (B) following treatment with different concentrations of ZnO NPs for 120 hours was determined using MTT assay. The type of cellular death caused by ZnO NPs (30 μg/mL) in DLBCL cells (C) was identified using annexin V-FITC and propidium iodide (PI) with flow cytometer. The data of flow cytometer were presented using column graph (D). ZnO NPs-induced production of ROS was measured in DLBCL cells using DCFH-DA (E). All experiments were performed in triplicate. Asterisk symbol was used to define p values; p ≤ 0.05 is *p ≤ 0.01 is **p ≤ 0.001 is*** and p ≤ 0.0001 is****. Abbreviation: PBMCs, peripheral blood mononuclear cells. |
To investigate whether the toxicity of ZnO NPs is selective against DLBCL cells but not normal cells, MTT assay was conducted on PBMCs and DLBCL cells treated with four concentrations of ZnO NPs (0 μg/mL, 10 μg/mL, 20 μg/mL, and 30 μg/mL) for 120 hours. Figure 1B showed ZnO NPs to selectively target the viability of DLBCL cells; at concentration = 30 μg/mL of ZnO NPs the average viability of DLBCL cells dropped to 18% (range = 14% to 22%) compared with 85% (range = 80% to 92%) for normal PBMCs (p< 0.0001).
To identify the type of cellular death induced by ZnO NPs in DLBCL cells, flow-cytometric analysis post staining with Annexin V-FITC and PI was performed. The analysis was done on DLBCL cells treated with ZnO NPs (30 μg/mL) for 24 hours and on control cells (untreated DLBCL cells). ZnO NPs targeted the viability of DLBCL cell by inducing apoptosis. The average early apoptotic population (singly positive cells for annexin V-FITC) was 11.3% (range = 10% to 13%) for the treated cells compared with 2.8% (range = 2% to 3.5%) in the control cells (p = 0.01; Figure 1C and D). Similarly, the average late apoptotic population (doubly positive cells for annexin V-FITC and PI) was 22% (range = 20% to 24%) for the treated cells as opposed to 1.7% (range = 1% to 2%) for the control cells (p = 0.003; Figure 1C and D). The average viable population (doubly negative cells for annexin V-FITC and PI) was reduced from 94.8% (range = 94.5% to 95%) in the control cells to 65% (range = 61% to 68%) in the treated cells (p = 0.0004; Figure 1C and D). The treated DLBCL cells with ZnO NPs (30 μg/mL) for 24 hours and control cells (untreated DLBCL cells) were stored for subsequent analyses.
ZnO NPs-Induced Production of ROS
To determine whether the ZnO NPs-induced apoptosis in DLBCL cells was associated with changes in the levels of ROS, experiments were conducted to measure ROS levels in DLBCL cells treated with different concentration of ZnO NPs (0 μg/mL, 30 μg/mL, 40 μg/mL, 50 μg/mL) for 24 hours. Figure 1E shows an increase in the level of ROS in the treated cells compared with the control cells; and that the production of ROS in response to ZnO NPs appeared to be dose-dependent. Compared with the DCF intensity (100%) of the control cells, the DCF intensity of the ZnO NPs-treated cells was 232% for 30 μg/mL NPs, 313% for 40 μg/mL NPs and 353% for the 50 μg/mL NPs.
ZnO NPs-Dependent Transcriptomics Changes in DLBCL Cells
In attempt to illustrate the transcriptomics-related mechanisms that underpin the apoptotic impact of ZnO NPs on DLBCL cells, the transcriptomics profiles of DLBCL cells (three independent samples with independent experiment for each sample) that were treated with ZnO NPs (30 μg/mL) for 24 hours were compared with that of untreated DLBCL cells (three independent control samples with independent experiment for each control). The cellular viability of the treated cells was 65% with apoptotic population (early and late apoptosis) = 33.3%. In contrast, the viability of the control cells was 94.8% with apoptotic population (early and late apoptosis) = 4.5%. The transcriptomics comparison included 26,950 probe IDs that had flag label “detected” in all samples of at least one of the two conditions (treated and untreated). The following criteria (FC ≥3-fold with p≤0.008 and corrected p≤0.05) were applied to the transcriptomics profiles of the two groups of samples to identify DEGs. ZnO NPs were found to induce differential expression of 528 genes (probe IDs) in DLBCL cells. Of these genes, 125 were over-expressed and 403 were under-expressed in ZnO NPs-treated DLBCL cells compared with untreated DLBCL cells (Supplementary Table 1). Volcano plot (Figure 2A) shows the impact of the ZnO NPs on the transcriptomes of DLBCL cells; and hierarchical cluster analysis coupled with heatmap presentation (Figure 2B) demonstrates the DEGs (FC ≥3-fold with p≤0.008 and corrected p≤0.05).
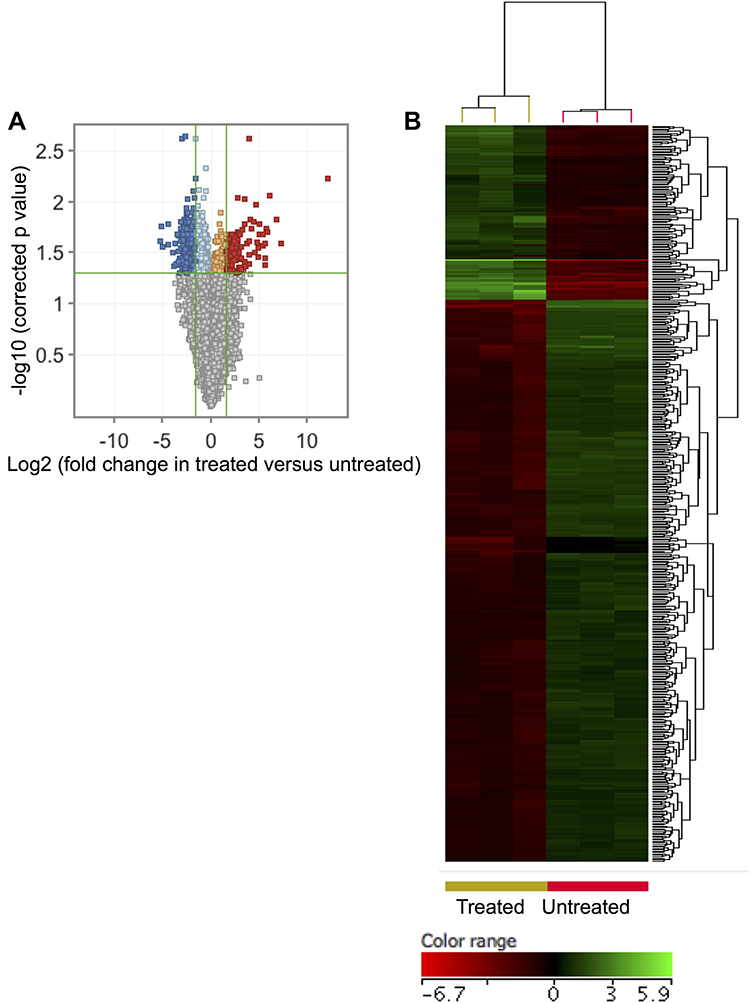 |
Figure 2 ZnO NPs induced significant changes in the transcriptomic profile of DLBCL cells. Volcano plot demonstrates differentially expressed genes (DEGs: FC≥3; p≤0.008; corrected p≤0.05) in the ZnO NPs-treated DLBCL cells compared with untreated DLBCL cells (A). Hierarchical cluster analysis with heatmap presentation were done for the DEGs (B). The color range represents the normalized signal value of probes (log2 transformation and 75 percentile shift normalization). |
To shed some light onto the functional roles of the DEGs, GO and biological pathway enrichment analysis using KEGG pathway database, Reactome pathways database and WikiPathways database was conducted through the GeneSpring GX version 12.1 software package (Agilent Technologies, Inc.) and the gProfiler (Table 1). The over-expressed genes enriched for biological processes and pathways that have been implicated in cellular response to chemical insult. For example, significant over-representation was identified for stress response to metal ion (corrected p value = 4.94×10¹⁹), cellular zinc ion homeostasis (corrected p value = 3.51×10¹⁵), cellular response to zinc ion (corrected p value =4.94×10¹⁴), metallothioneins bind metals (corrected p value = 1.36×10⁹), negative regulation of growth (corrected p value = 3.38×10⁶), attenuation phase (corrected p value 3.91×10⁵) and oxidative stress (corrected p value = 0.0006). Figure 3 shows heatmap presentations of the genes that over-represented cellular response to zinc ions, response to chemicals, and negative regulator of growth. In contrast, the under-expressed genes were found to enrich for biological processes and pathways implicated in DNA modifications, gene expression and cell cycle. For instance, significant over-presentation by the under-expressed genes was found for DNA packaging complex (corrected p value 1.74×10¹²), chromatin assembly (corrected p value 1.02×10⁷), signaling by NOTCH (corrected p value 1.68×10⁷), negative regulation of gene expression by epigenetic (corrected p value 6.69×10⁷), signaling by WNT (corrected p value 1.49×10⁶), M phase of cell cycle (corrected p value 4.27×10⁵), telomere maintenance (corrected p value = 0.005), and negative regulation of transcription (corrected p value 0.02). Figure 4 shows heatmap presentations of genes that over-represented negative regulation of transcription, chromatin assembly, telomere maintenance and signaling by NOTCH.
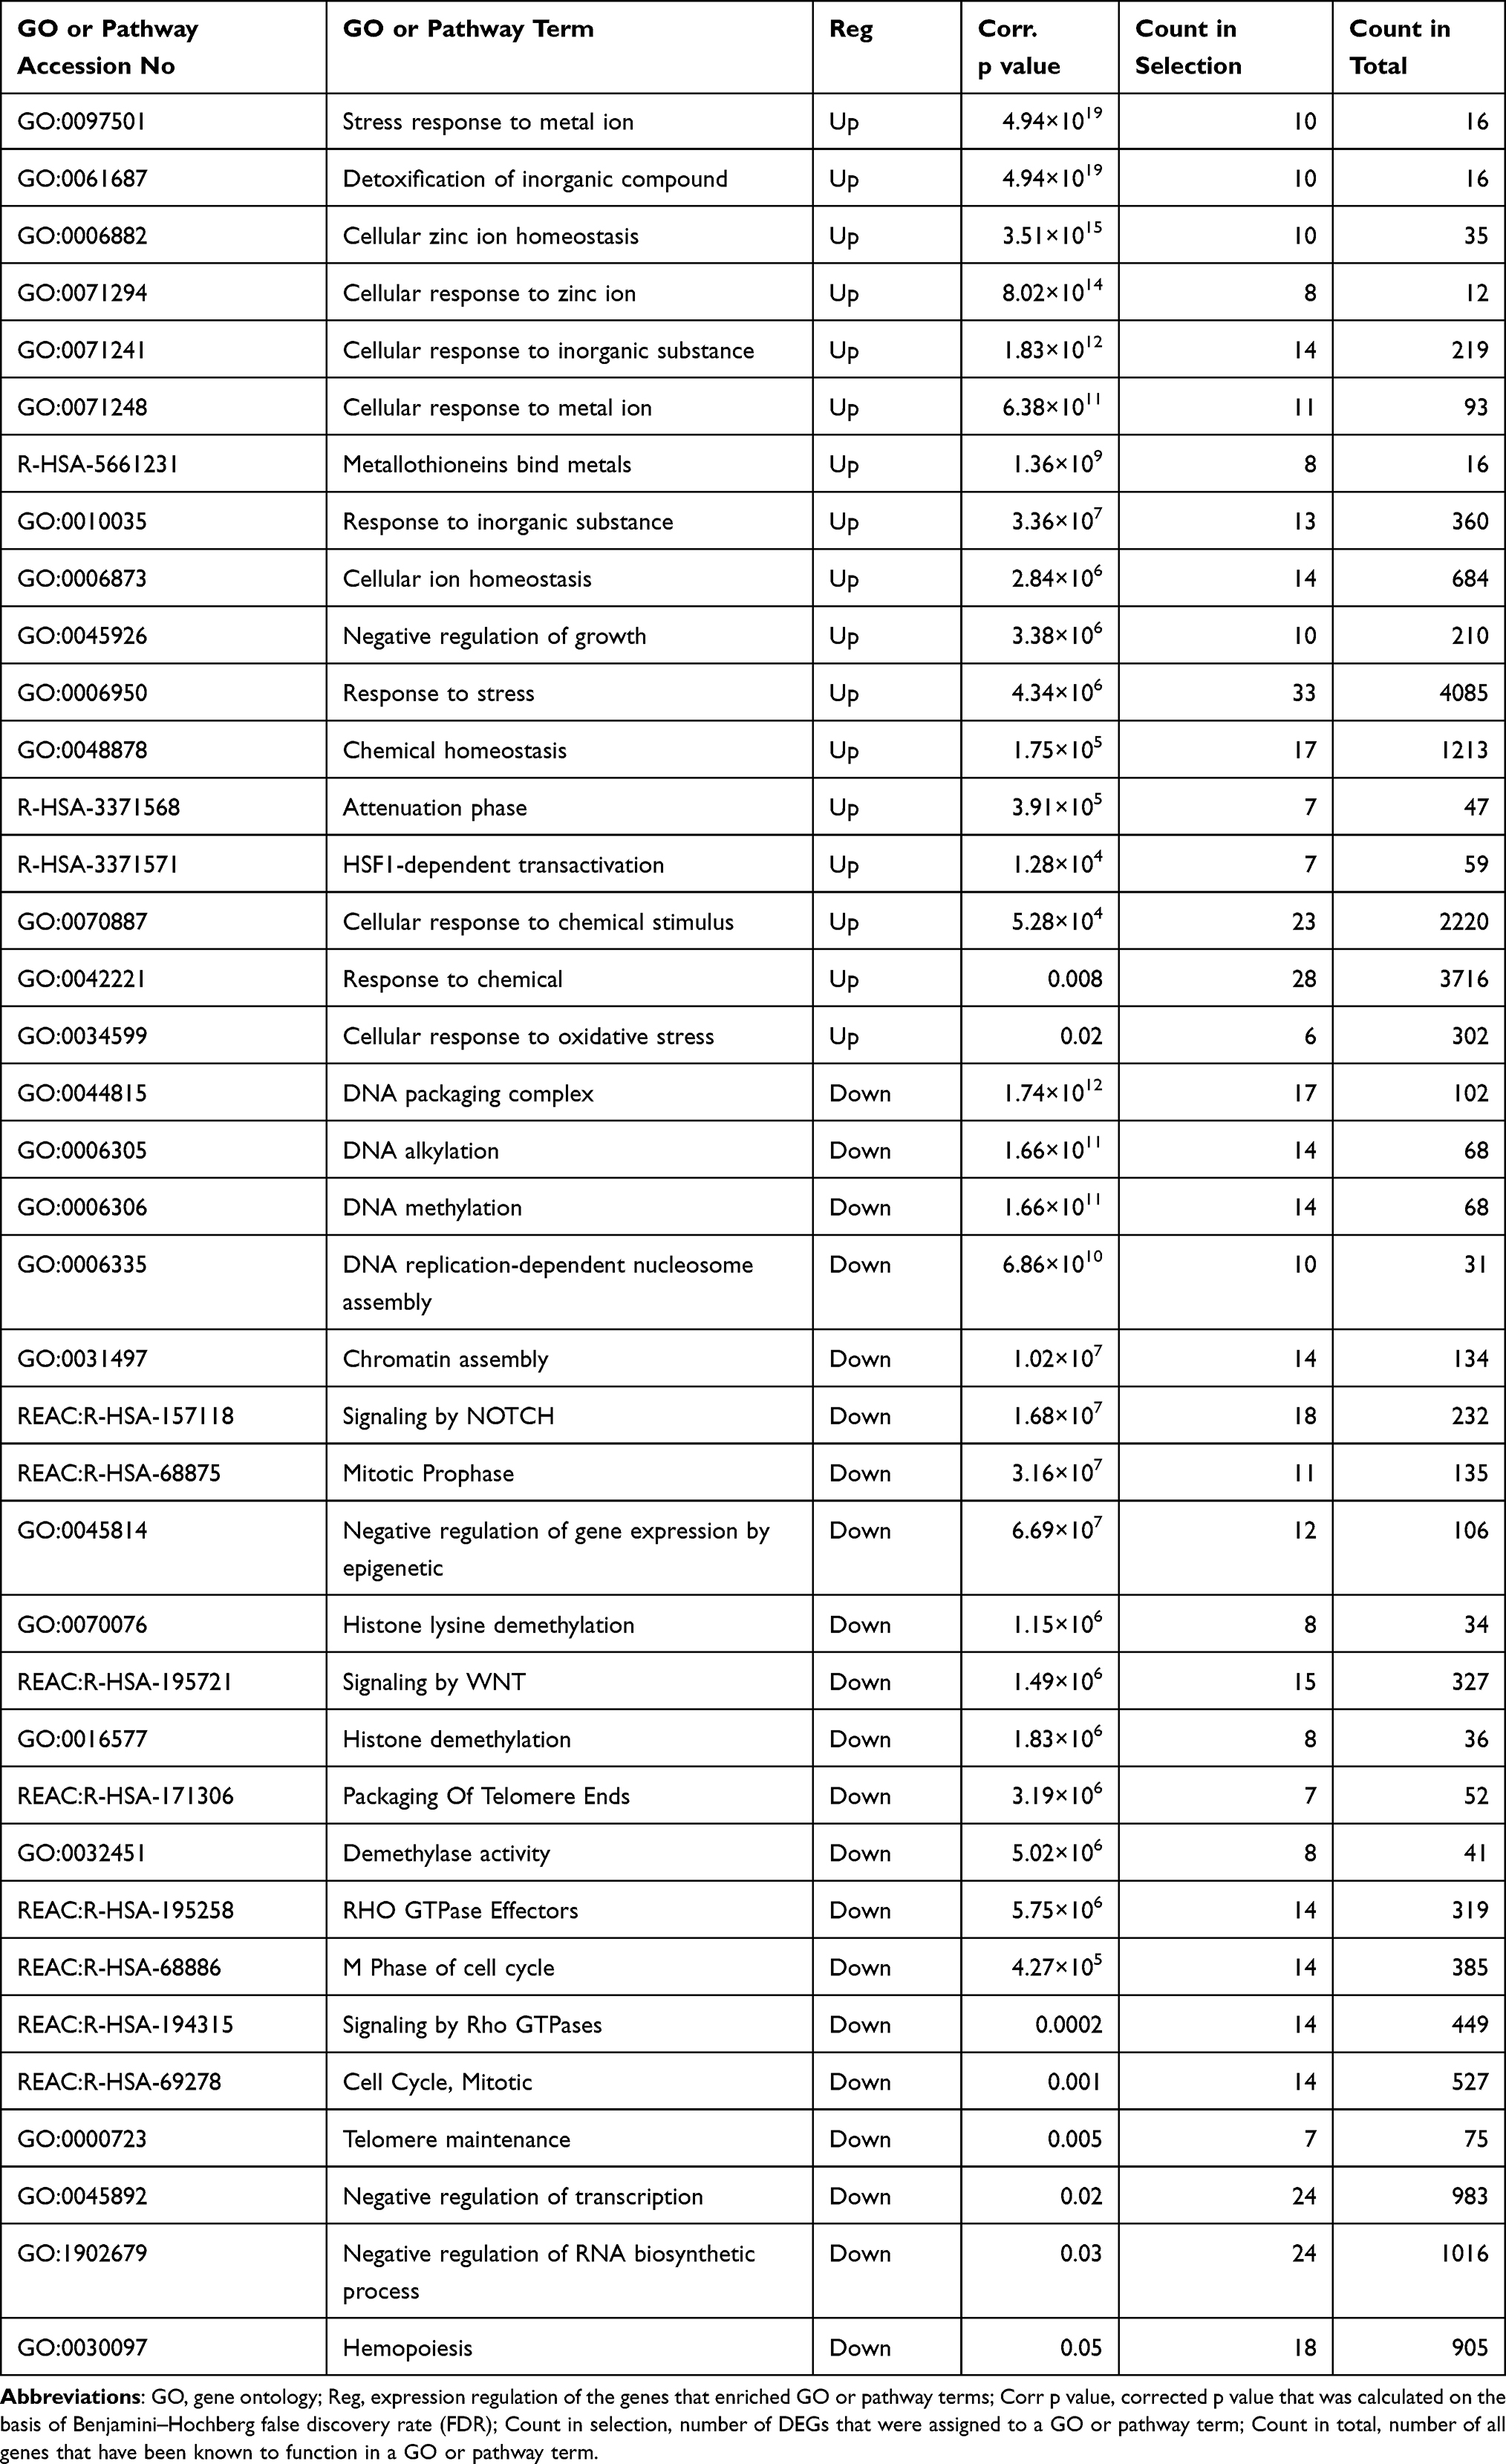 |
Table 1 Biological Processes and Pathways Enrichment Analysis of the Differentially Expressed Genes (DEGs: FC≥3; P≤0.008; Corrected P≤0.05) in the ZnO NPs-Treated DLBCL Cells Compared with the Untreated DLBCL Cells |
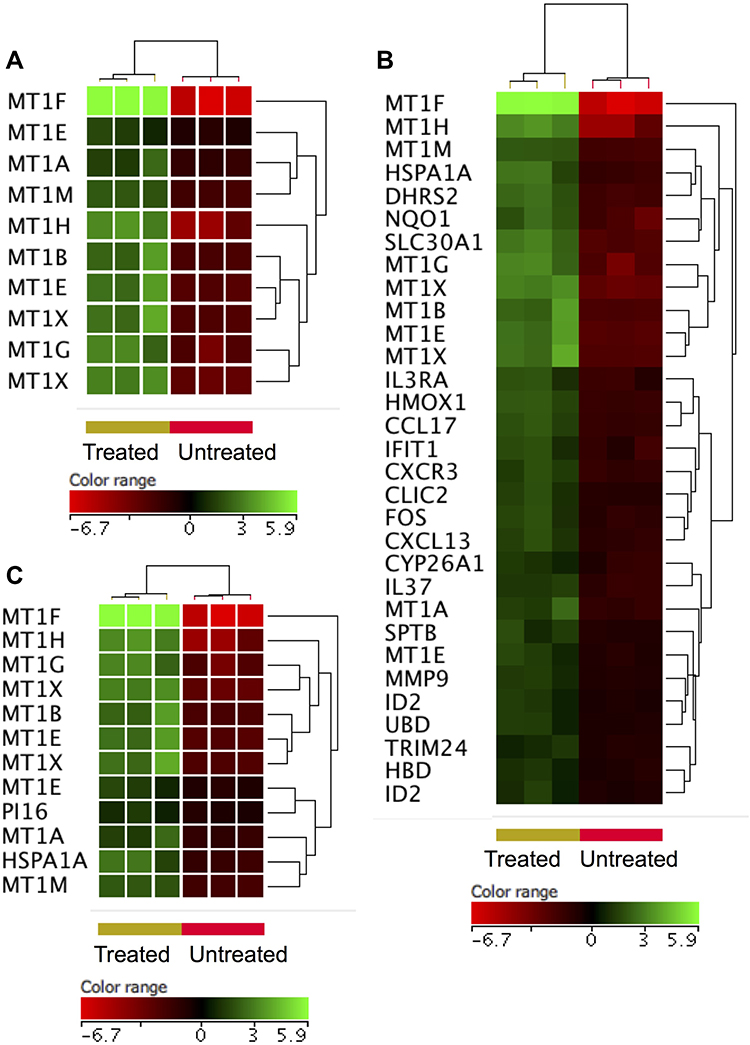 |
Figure 3 Genes identified with over-expression in the ZnO NPs-treated DLBCL cells compared with the untreated DLBCL cells. Hierarchical cluster analysis with heatmap presentation was conducted on the over-expressed genes (FC≥3; p≤0.008; corrected p≤0.05) that significantly over-represented the biological processes and pathways: cellular response to zinc ions (A), response to chemicals (B) and negative regulator of growth (C). The color range represents the normalized signal value of probes (log2 transformation and 75 percentile shift normalization). |
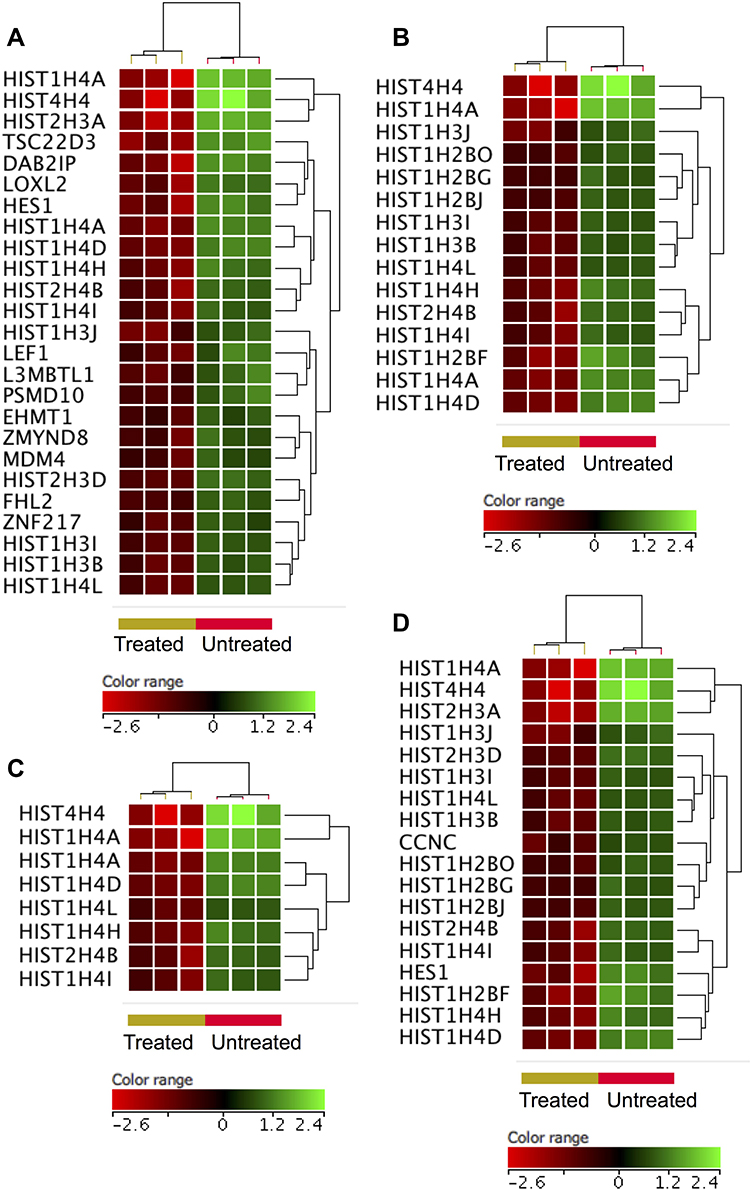 |
Figure 4 Genes that were under-expressed in the ZnO NPs-treated DLBCL cells compared with the untreated DLBCL cells. Hierarchical cluster analysis with heatmap presentation was conducted on the under-expressed genes (FC≥3; p≤0.008; corrected p≤0.05) that significantly over-represented the biological processes and pathways: negative regulation of transcription (A), chromatin assembly (B), telomere maintenance (C) and NOTCH signaling (D). The color range represents the normalized signal value of probes (log2 transformation and 75 percentile shift normalization). |
Oxidative Stress Responsive Genes
ZnO NPs have been shown to increase the production of reactive oxygen species (ROS) leading to oxidative stress-induced cell death.15 Among the DEGs (FC ≥3-fold with p≤0.008 and corrected p≤0.05), six oxidative responsive genes, namely heat shock protein family A (Hsp70) member 1A (HSPA1A), murine osteosarcoma viral oncogene homolog (FOS), matrix metallopeptidase 9 (MMP9), heme oxygenase (HMOX1), dehydrogenase/reductase (SDR family) member 2 (DHRS2) and NAD(P)H dehydrogenase [quinone 1] (NQO1), were over-expressed in DLBCL cells upon treatment with ZnO NPs (Supplementary Table 1). To widen the search for DEGs implicated in cellular response to oxidative stress, the FC cutoff was set to ≥1.5 with p≤0.05 and corrected p≤0.1. As a result, 11 additional oxidative response genes were identified with over-expression in ZnO NPs- treated DLBCL cells (Figure 5). Among these genes were oxidation resistance 1 (OXR1), dual specificity phosphatase 1 (DUSP1), thyroid peroxidase (TPO), and thioredoxin reductase 1 and 2 (TXNRD1 and TXNRD2).
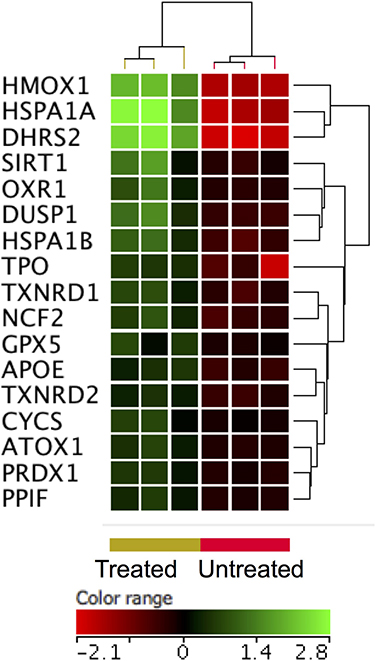 |
Figure 5 Expression profile of oxidative stress responsive gene. Hierarchical cluster analysis with heatmap presentation was done on oxidative stress responsive gene (FC ≥1.5 with p≤0.05 and corrected p≤0.1) in ZnO NPs treated DLBCL cells versus untreated DLBCL cells. The color range represents the normalized signal value of probes (log2 transformation and 75 percentile shift normalization). |
Apoptotic Genes
As shown by flowcytometric analysis (Figure 1), ZnO NPs induced apoptosis in DLBCL cells. In line with this cellular finding, ZnO NPs caused an over-expression of genes (FC ≥3-fold with p≤0.008 and corrected p≤0.05) that inhibit the cellular growth (corrected p value = 3.38×10⁶; Table 1) such as different types of metallothioneins (MT1F, MT1H, MT1G, MT1X, MT1B, MT1E, MT1A and MT1M). In contrast, ZnO NPs induced under-expression of genes (FC ≥3-fold with p≤0.008 and corrected p≤0.05) implicated in cell cycle (corrected p value = 0.001; Table 1); such as MDM4, NINLI, PSMD10, TUBB3 and 10 types of histones. Nevertheless, the DEGs (FC ≥3-fold with p≤0.008 and corrected p≤0.05) did not include other core apoptotic genes, such as those that belong to tumor necrosis receptor superfamily and their ligands, BCL2 family or caspases. Consequently, the FC cutoff was set to ≥1.5 with p≤0.05 and corrected p≤0.1 in order to broaden the search for apoptotic genes. Figure 6A shows the expression profile of anti-apoptotic genes and Figure 6B demonstrates the expression profile of pro-apoptotic genes. Interestingly anti-apoptotic genes such as BCL2-like 1 (BCL2L1), BCL2-associated athanogene 4 (BAG4), CASP8 and FADD-like apoptosis regulator (CFLAR), TNF receptor-associated factor 2 (TRAF2) were under-expressed in ZnO NPs-treated DLBCL cells. In contrast, pro-apoptotic genes like programmed cell death 5 (PDCD5), caspase 1 apoptosis-related cysteine peptidase (CASP1), cell death-inducing DFFA-like effector c (CIDEC), BCL2-associated agonist of cell death (BAD), apoptosis-inducing factor (SIVA1) and BCL2-antagonist/killer 1 (BAK1) were over-expressed in ZnO NPs-treated DLBCL cells.
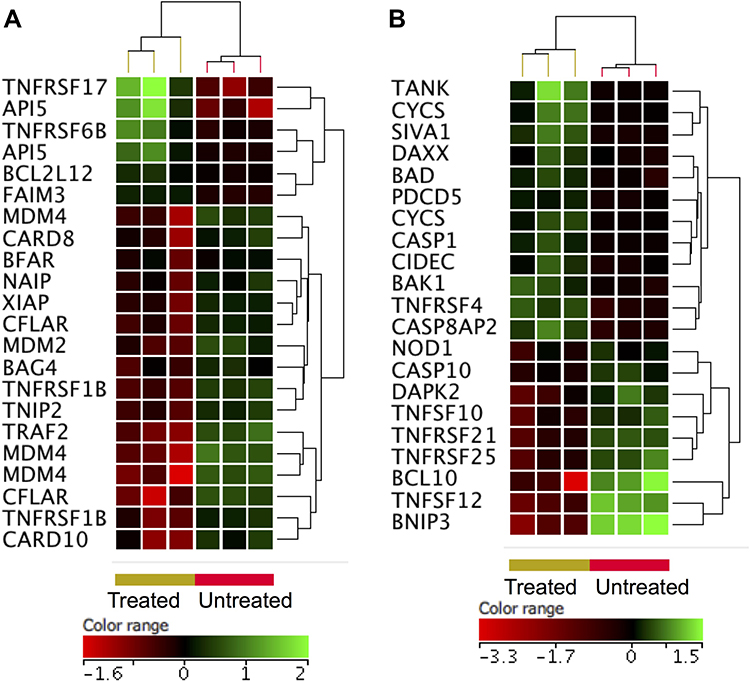 |
Figure 6 Expression profile of apoptotic gene. Hierarchical cluster analysis with heatmap presentation were constructed for anti-apoptotic genes (A) and pro-apoptotic genes (B) (FC ≥1.5 with p≤0.05 and corrected p≤0.1) in ZnO NPs-treated DLBCL cells compared with untreated DLBCL cells. The color range represents the normalized signal value of probes (log2 transformation and 75 percentile shift normalization). |
Oncogenes
Oncogenes play important roles in the survival and proliferation of malignant cells.37 Setting the FC cutoff to ≥1.5 with p≤0.05 and corrected p≤0.1 allowed the identification ZnO NPs-induced altered expression of oncogenes in DLBCL cells. Forty oncogenes were differentially expressed in response to treatment with ZnO NPs; 32 genes were under-expressed and 8 genes were over-expressed in the in the ZnO NPs-treated DLBCL cells. Of interest, ABL proto-oncogene 2 non-receptor tyrosine kinase (ABL2), SET nuclear proto-oncogene (SET), T-cell leukemia/lymphoma 1A (TCL1A), LCK proto-oncogene Src family tyrosine kinase (LCK), AKT serine/threonine kinase 2 and 3 (AKT2 and AKT3), lymphoblastic leukemia associated hematopoiesis regulator 1 (LYL1), fibroblast growth factor receptor 4 (FGFR4), and v-erb-b2 avian erythroblastic leukemia viral oncogene homolog 3 (ERBB3) were under-expressed in ZnO NPs-treated DLBCL cells (Figure 7).
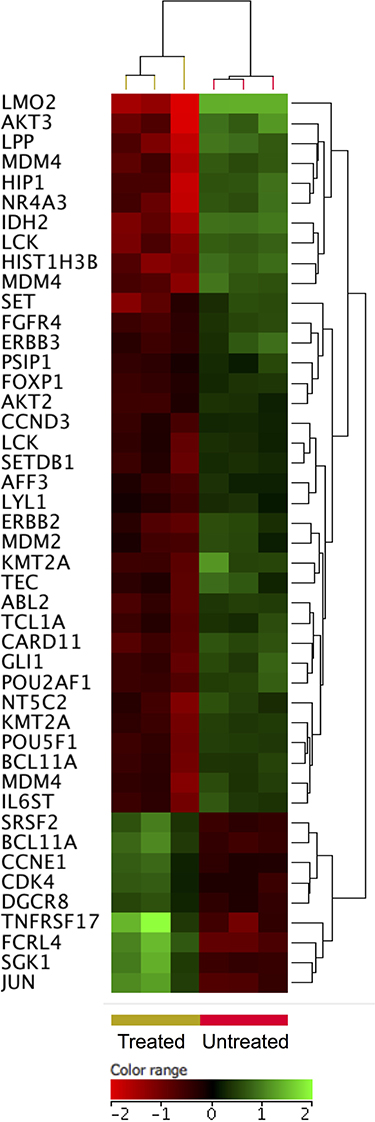 |
Figure 7 Expression profile of oncogenes. Hierarchical cluster analysis with heatmap presentation were constructed for oncogenes (FC ≥1.5 with p≤0.05 and corrected p≤0.1) in ZnO NPs treated DLBCL cells compared with untreated DLBCL cells. The color range represents the normalized signal value of probes (log2 transformation and 75 percentile shift normalization). |
B-Cell Receptor Signaling Genes
Signaling through B-cells receptor (BCR) is a key for activation, survival and proliferation of normal and malignant B-cells.38 The transcriptomic profiling showed under-expression of BCR signaling genes (FC cutoff ≥1.5, p≤0.05, corrected p≤0.1) in response to the treatment with ZnO NPs. For example, Bruton tyrosine kinase (BTK), AKT1, AKT2, tyrosine-protein kinase Blk (BLK), receptor-type tyrosine-protein phosphatase C (PTPRC), B-cell lymphoma/leukemia 10 (BCL10), hematopoietic progenitor kinase (HPK), tyrosine-protein kinase Tec (TEC) and linker for activation of B-cells (LAT2) showed decreased expression in the ZnO NPs-treated cells (Figure 8).
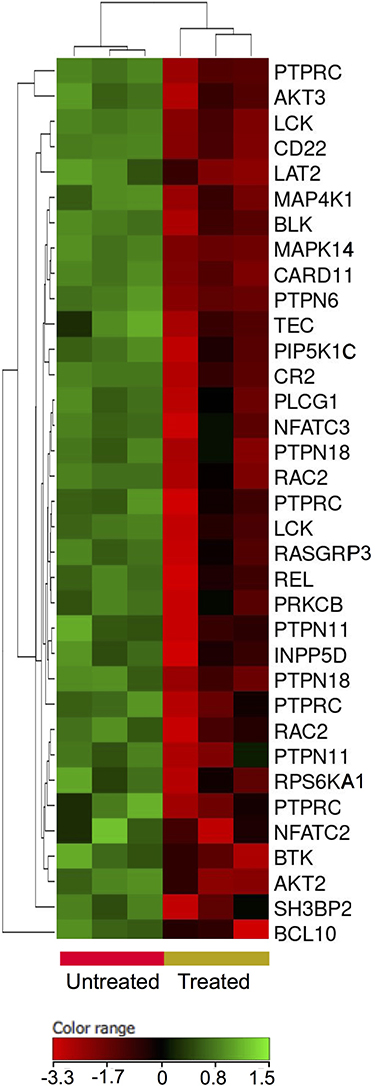 |
Figure 8 Expression profile of B-cell receptor signaling genes. Hierarchical cluster analysis with heatmap presentation were constructed for the genes (FC ≥1.5 with p≤0.05 and corrected p≤0.1) in ZnO NPs-treated DLBCL cells compared with untreated DLBCL cells. The color range represents the normalized signal value of probes (log2 transformation and 75 percentile shift normalization). |
Nuclear Factor Kappa B Genes
Nuclear factor kappa B (NFκB) pathway has been heavily implicated in the survival and proliferation of different malignancies including DLBCL.39 The treatment of DLBCL cells with ZnO NPs decreased the expression of NFκB pathway genes (FC cutoff ≥1.5, p≤0.05, corrected p≤0.1). For example I-kappa-B-kinase beta (IKBKB), nuclear factor NF-kappa-B p100 (NFKB2), nuclear factor NF-kappa-B p110 subunit (REL) and transcription factor RelB (RELB) where found to be under-expressed in ZnO NPs-treated DLBCL cells (Figure 9).
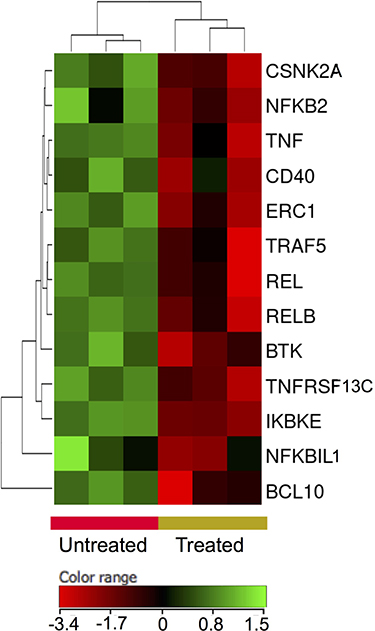 |
Figure 9 Expression profile of nuclear factor kappa B signaling genes. Hierarchical cluster analysis with heatmap presentation were constructed for the genes (FC ≥1.5 with p≤0.05 and corrected p≤0.1) in ZnO NPs-treated DLBCL cells compared with untreated DLBCL cells. The color range represents the normalized signal value of probes (log2 transformation and 75 percentile shift normalization). |
Discussion
ZnO NPs have been reported by many studies to induced apoptosis in cancer cells.15 DLBCL (subtype ABC) is an aggressive blood cancer with increased rate of refractory and relapse.33 The present work demonstrated the capability of ZnO NPs to selectively induce apoptosis in DLBCL cells (subtype ABC), which have been characterized by their resistance to standard chemotherapy. In attempt to identify transcriptomics-related mechanisms that underlay the apoptotic effect of the ZnO NPs on DLBCL cells, transcriptomics profiling was conducted on DLBCL cells that were treated with ZnO NPs and control cells (untreated DLBCL cells). Conducting the transcriptomic experiments on ZnO NPs-treated samples with percentage of apoptotic cells = 33.3% was necessary to identify changes in the transcriptomic profile that preceded the ZnO NPs-induced apoptosis (because not all the treated cells were dead; in fact, approximately 65% of the treated cells had not yet undergone apoptosis). Therefore, the identified alterations in the transcriptomic profile of the treated cells are likely to underpin the cytotoxic impact of ZnO NPs.
The molecular findings (transcriptomic profiles) supported and to a large extent explained the cellular findings (induction of apoptosis in DLBCL cells by ZnO NPs). For instance, the treated cells over-expressed genes that have been implicated in response to metal ion, cellular zinc ion homeostasis, cellular response to zinc ion, metallothioneins bind metals and negative regulation of growth. Of these genes, eight types of MT1 that have been known to play roles in intracellular homeostasis of zinc ions, detoxification of heavy metal ions and suppression of tumor growth.36 The expression of MT1 genes is down-regulated in different types of cancer perhaps because they target the survival of cancer cells as MT1 genes inhibits tumor growth.41–44 As tumor suppressors, the over-expression of MT1 genes might have promoted apoptosis in ZnO NPs-treated cells. Agreeing with these data, the treated cells also over-expressed FOS, which antagonizes proliferation and promotes apoptosis.45 As a self defense mechanism against ZnO NPs the treated cells over-expressed HSPA1A, which protects cells from chemical insult,46 SLC30A1, which exports intracellular Zn ions out of cells to maintain Zn homeostasis,47 and cytoskeleton gene SPTP perhaps to overcome the previously reported destructive impact of ZnO NPs on cytoskeleton proteins.47
The ZnO NPs-treated cells under-expressed genes that play roles in DNA packaging complex, chromatin assembly, signaling by NOTCH, negative regulation of gene expression by epigenetic, signaling by WNT, M phase of cell cycle and telomere maintenance. For example, 14 types of HIST1 and 3 types of HIST2, which are core components of nucleosome that compact DNA into chromatin (DNA packaging and chromatin assembly) restricting access to DNA for transcription,48,49 were under-expressed in ZnO NPs-treated cells. Similarly, the transcriptional repressors L3MBTL150 ZMYND851 and ZNF21752 were also under-expressed in the treated cells. Likewise, EHMT1 which mono and dimethylates lysine residue number 9 of histone 3 leading to repression of DNA transcription,53 was also under-expressed in treated cells. These data suggested that as a defense mechanism, the treated cells attempted to enhance transcription machinery by decreasing the expression of histones (to make DNA more accessible for transcription) and by reducing the expression of transcriptional repressors.
NOTCH signaling has been implicated in the growth and survival B-cell malignancies including DLBCL54 Interestingly, ZnO NPs appeared to target NOTCH signaling as indicated by the decreased expression of the NOTCH target gene HES1,55 NOTCH2 (FC=2, p= 0.003, corrected p =0.05), which is a receptor engagement of which with its ligands (Jagged-1 and 2) activates NOTCH signaling,56 NOTCH2NL (FC=2.4, p= 0.003, corrected p =0.05), which enhances the signaling of NOTCH pathway by direct interaction with NOTCH2,57 and increased expression of NRARP (FC=1.88, p= 0.02, corrected p =0.1), which blocks NOTCH signaling and inhibits the activation of NOTCH target genes.58 It appeared from these data that targeting NOTCH signaling is a mechanism by which ZnO NPs target the survival of DLBCL cells.
The treated cells under-expressed variants of HSIT1, HIST2 and HIST4. Global expression of histones has been implicated in chromosomal integrity and telomere maintenance.59 Cells at replicative-senescence show low expression of histones compared with actively replicative cells. Furthermore, cells with short telomere appeared to express low levels of histones compared with those harboring long telomere.60 Furthermore, active telomere maintenance and lengthening by telomerase require increased expression of histones.59 Taken together, these findings indicate the importance of histones in telomere maintenance pathway. Agreeing with this view, the treated cells also reduced the expression of genes that constitute human telomerase complex;61 such as TEP1 (FC=1.8, p= 0.03, corrected p =0.1), and TERC (FC=2.3, p= 0.001, corrected p =0.03). Moreover, the treated cells also decreased the expression of PCK (FC=1.7, p= 0.03, corrected p =0.1), AKT2 (FC=1.7, p= 0.003, corrected p =0.05) and AKT3 (FC= 4.4, p= 0.007, corrected p =0.07), which phosphorylate TEP1 and TRET contributing to the activation human telomerase complex.61 Collectively, these data indicated that targeting telomere maintenance is a mechanism by which ZnO NPs excreted their cytotoxicity on DLBCL cells.
A growing body of evidence attributed the cytotoxicity of ZnO NPs on cancer cells to ZnO NPs-dependent production of cellular ROS that promotes oxidative stress-induced cellular death.15,62 Agreeing with this, studies have shown increased expression of cellular oxidative stress responsive genes (anti-oxidant genes); such as SOD, catalase, PRDX2 and GSH, in response to treatment with ZnO NPs.63–65 Both the ROS measurement analysis and transcriptomics data of the present study support this notion, where ZnO NPs were found to increase the production of ROS and cause an over-expression of a group of anti-oxidant genes in DLBCL cells. DHRS2, which has NADPH-dependent dicarbonyl reductase activity and reduces ROS,66 ORX-1, which increases the expression of genes needed for detoxification hydrogen peroxide,67 PRDX1 and GPX5, which detoxify different forms of peroxide,68,69 and TXNRD2, which keeps thioredoxin in the reduced state,70 were all over-expressed upon treatment with ZnO NPs.
As indicated by the flow-cytometric findings, ZnO NPs killed DLBCL cells by apoptosis. The transcriptomic profile of apoptotic genes showed that apoptosis might have occurred in the treated DLBCL cells through the intrinsic (mitochondrial-dependent) and extrinsic (death receptor-dependent) pathways. For example, genes that play anti-apoptotic roles in the intrinsic pathway; such as MDM4 (MDMX), which suppresses the activation of p53,71 MDM2, which induces p53 proteasomal degradation and negatively regulates p53 function72 SIVA1, which binds to and inhibits the anti-apoptotic gene BCL-XL,73 were under-expressed in the treated cells. In line with this, pro-apoptotic genes of the intrinsic pathway like BAD, which binds and inactivates Bcl-2 and Bcl-xL,74 PDCD5 (TRAF19) and BAK1, which decrease the mitochondrial membrane potential and promote the release of cytochrome c,74,75 were over-expressed in the treated cells. For the extrinsic pathway, anti-apoptotic genes including TRAF2, which blocks the pro-apoptotic signal of TNFSF10 (TRAIL) and CD95L (FASL),76 BAG4 (SODD), which blocks TNFRSF1A (TNF-R1) signaling,77 FAIM3 (TOSO), which inhibits FAS-induced apoptosis78 were under-expressed in the treated cells. In contrast pro-apoptotic genes in the extrinsic pathway like DAXX, which bind with Fas death domain and enhances Fas-mediated apoptosis79 CASP8AP2, which is required for the activation of CAPS8 and FASL-mediated apoptosis80 were over-expressed in the treated cells. XIAP (BIRC4), NAIP (BIRC1) and BCL2L12, which inhibit the activation of executioner capsases (CASP3 and CASP7: common for both pathways)81–84 were under-expressed in the treated cells.
The apoptotic impact of ZnO NPs appeared to be conferred, at least partially, through altering the expression of oncogenes in DLBCL cells. For instance, ABL2, which is a non-receptor tyrosine-protein kinase that plays roles in cell growth and survival and was implicated in pathogenesis of acute myeloid leukemia and B-cell lymphomas,85–87 was under-expressed in the treated cells. Similarly, TCL1A, which plays important roles in the progression of chronic lymphocytic leukemia and B-cell lymphomas,88,89 showed reduced expression in the treated cells. AKT2 and AKT3, which regulate apoptosis, cell survival, and proliferation and were implicated progression of DLBCL,90,91 were also down-regulated in the treated cells. Overall, targeting the expression of oncogenes appeared to be implicated for the exertion of ZnO NPs toxicity on DLBCL cells.
BCR signaling has been heavily involved in the pathogenesis and the aggressive prognosis of DLBCL.92,93 Interestingly ZnO NPs targeted the expression (reduced the expression) of AKT2, AKT3, BTK, BLK, BCL10, TEC and LAT2, all of which are transducer of BCR signal from the plasma membrane to nucleus.94 Targeting BCR signaling has been an attractive approach for the therapy of for many B-cell malignancies including DLBCL.95 Of the downstream events of BCR signaling is the activation of NF-κB pathways, which favors the progression and treatment resistant in many type of cancer including DLBCL.96,97 Interestingly, targeting BCR signaling by the ZnO NPs was also associated with reduced expression of IKBKB, which is the main activator of NF-κB pathway,39 and the subunits of NF-κB (NFKB2, REL and RELB).39 Taken together, these data indicated that ZnO NPs targeted BCR signaling and NF-κB pathway to induce apoptosis in DLBCL cells.
Collectively, the findings reported here proposed a possible mechanism through which ZnO NPs-induced apoptosis in DLBCL cells happened. The mechanism involved increased production of ROS; and inhibition of proliferation and survival of DLBCL cells by targeting BCR, NF-κB, NOTCH and telomere maintenance pathways; and activation of extrinsic and intrinsic apoptotic pathways. As self defense mechanism, DLBCL cells responded to ZnO NPs by overexpressing Zn homeostasis, stress responsive and oxidative responsive genes. However, the cellular protection machinery appeared to be defeated by the cytotoxicity of ZnO NPs leading to the induction of apoptosis in DLBCL cells. Interestingly, some of the changes in the transcriptomics profiles of the treated cells were related the nature of the DLBCL subtype ABC. The ZnO NPs targeted DLBCL subtype ABC-dependent proliferation and survival pathways like BCR, NF-κB and NOTCH; and oncogenes TCLA1, AKT2 and AKT3. The alterations in the transcriptomics profiles of the treated cells may also provide clues about how ZnO toxicity could be measured. The over-expressed genes like MTIs (eight genes), HSPA1A, SLC30A1 and SPTP are perhaps good biomarker candidates for measuring/monitoring ZnO toxicity.
Conclusion
Overall, the present study reported ZnO NPs to selectively induce apoptosis in DLBCL subtype ABC cells, which have been know to be resistant to chemotherapy. The transcriptomics profiling in the present study revealed ZnO NPs-induced changes in the transcriptomic profile of DLBCL cells. The transcriptomic alterations were consistent with the apoptotic effect of the ZnO NPs on DLBCL cells, and described possible molecular mechanisms through which ZnO NPs killed DLBCL cells. These mechanisms appeared to involve increased production of ROS and down-regulation of DLBCL subtype ABC- dependent proliferation and survival pathways like BCR, NF-κB and NOTCH, leading to induction of cell death through the intrinsic and extrinsic apoptosis pathways. The ZnO NPs-induced changes in the transcriptomics of DLBCL cells provided a list of genes that could be further studied as biomarker candidates for assessing/monitoring ZnO toxicity.
Acknowledgment
The author would like to thank the Deanship of Scientific Research at Majmaah University in Saudi Arabia for supporting this study under project number [R-2022-138]. The author would also like to thank Dr. Wael Alturaiki for the provision of normal PBMCs.
Disclosure
The author declares that there are no conflicts of interest.
References
1. Handy RD, Von der Kammer F, Lead JR, Hassellöv M, Owen R, Crane M. The ecotoxicology and chemistry of manufactured nanoparticles. Ecotoxicology. 2008;17:287–314. doi:10.1007/s10646-008-0199-8
2. Govindaraju K, Krishnamoorthy K, Alsagaby SA, Singaravelu G, Premanathan M. Green synthesis of silver nanoparticles for selective toxicity towards cancer cells. IET Nanobiotechnol. 2015;9:325–330. doi:10.1049/iet-nbt.2015.0001
3. Ke Y, Al Aboody MS, Alturaiki W, et al. Photosynthesized gold nanoparticles from Catharanthus roseus induces caspase-mediated apoptosis in cervical cancer cells (HeLa). Artif Cells, Nanomed Biotechnol. 2019;47:1938–1946. doi:10.1080/21691401.2019.1614017
4. Kawata K, Osawa M, Okabe S. In vitro toxicity of silver nanoparticles at noncytotoxic doses to HepG2 human hepatoma cells. Environ Sci Technol. 2009;43:6046–6051. doi:10.1021/es900754q
5. Rajeshkumar S. Anticancer activity of eco-friendly gold nanoparticles against lung and liver cancer cells. J Genet Eng Biotechnol. 2016;14:195–202. doi:10.1016/j.jgeb.2016.05.007
6. Foldbjerg R, Dang DA, Autrup H. Cytotoxicity and genotoxicity of silver nanoparticles in the human lung cancer cell line, A549. Arch Toxicol. 2011;85:743–750. doi:10.1007/s00204-010-0545-5
7. Gurunathan S, Han JW, Eppakayala V, Jeyaraj M, Kim J-H. Cytotoxicity of biologically synthesized silver nanoparticles in MDA-MB-231 human breast cancer cells. Biomed Res Int. 2013;2013. doi:10.1155/2013/535796
8. Premanathan M, Karthikeyan K, Jeyasubramanian K, Manivannan G. Selective toxicity of ZnO nanoparticles toward Gram-positive bacteria and cancer cells by apoptosis through lipid peroxidation. Nanomed Nanotechnol Biol Med. 2011;7:184–192. doi:10.1016/j.nano.2010.10.001
9. Alsagaby SA, Vijayakumar R, Premanathan M, et al. Transcriptomics-based characterization of the toxicity of ZnO nanoparticles against chronic myeloid leukemia cells. Int J Nanomedicine. 2020;15:7901–7921. doi:10.2147/IJN.S261636
10. Boroumand Moghaddam A, Moniri M, Azizi S, et al. Eco-friendly formulated zinc oxide nanoparticles: induction of cell cycle arrest and apoptosis in the MCF-7 cancer cell line. Genes. 2017;8:281. doi:10.3390/genes8100281
11. Cao Y, Roursgaard M, Kermanizadeh A, Loft S, Møller P. Synergistic effects of zinc oxide nanoparticles and fatty acids on toxicity to caco-2 cells. Int J Toxicol. 2015;34:67–76. doi:10.1177/1091581814560032
12. Akhtar MJ, Ahamed M, Kumar S, Khan MAM, Ahmad J, Alrokayan SA. Zinc oxide nanoparticles selectively induce apoptosis in human cancer cells through reactive oxygen species. Int J Nanomedicine. 2012;7:845. doi:10.2147/IJN.S29129
13. Bai D-P, Zhang X-F, Zhang G-L, Huang Y-F, Gurunathan S. Zinc oxide nanoparticles induce apoptosis and autophagy in human ovarian cancer cells. Int J Nanomedicine. 2017;12:6521. doi:10.2147/IJN.S140071
14. Pandurangan M, Enkhtaivan G, Kim DH. Anticancer studies of synthesized ZnO nanoparticles against human cervical carcinoma cells. J Photochem Photobiol B. 2016;158:206–211. doi:10.1016/j.jphotobiol.2016.03.002
15. Bisht G, Rayamajhi S. ZnO nanoparticles: a promising anticancer agent. Nanobiomedicine. 2016;3:3–9. doi:10.5772/63437
16. Jiang J, Pi J, Cai J. The advancing of zinc oxide nanoparticles for biomedical applications. Bioinorg Chem Appl. 2018;2018:1–18. doi:10.1155/2018/1062562
17. Shen C, James SA, de Jonge MD, Turney TW, Wright PFA, Feltis BN. Relating cytotoxicity, zinc ions, and reactive oxygen in ZnO nanoparticle–exposed human immune cells. Toxicol Sci. 2013;136:120–130. doi:10.1093/toxsci/kft187
18. Manke A, Wang L, Rojanasakul Y. Mechanisms of nanoparticle-induced oxidative stress and toxicity. Biomed Res Int. 2013;2013:1–15. doi:10.1155/2013/942916
19. Lowe R, Shirley N, Bleackley M, Dolan S, Shafee T. Transcriptomics technologies. PLoS Comput Biol. 2017;13:e1005457. doi:10.1371/journal.pcbi.1005457
20. Alsagaby, Suliman A. “Omics-based insights into therapy failure of pediatric B-lineage acute lymphoblastic leukemia.” Oncology Reviews 13.2 2019.
21. Alsagaby, Suliman A. “Transcriptomics-based validation of the relatedness of heterogeneous nuclear ribonucleoproteins to chronic lymphocytic leukemia as potential biomarkers of the disease aggressiveness.” Saudi Medical Journal 40.4 2019;328–338.
22. Supplitt, Stanislaw, et al. “Current achievements and applications of transcriptomics in personalized cancer medicine.” International Journal of Molecular Sciences 22.3 2021;1422.
23. Sager, Monica, et al. “Transcriptomics in cancer diagnostics: developments in technology, clinical research and commercialization.” Expert Review of Molecular Diagnostics 15.12 2015;1589–1603.
24. Hanagata N, Xu M, Takemura T, Zhuang F. Cellular response to ZnO nanoparticle toxicity inferred from global gene expression profiles. Nano Biomed. 2010;2:153–169.
25. Moos PJ, Olszewski K, Honeggar M, et al. Responses of human cells to ZnO nanoparticles: a gene transcription study. Metallomics. 2011;3:1199–1211. doi:10.1039/c1mt00061f
26. Poon W-L, Alenius H, Ndika J, et al. Nano-sized zinc oxide and silver, but not titanium dioxide, induce innate and adaptive immunity and antiviral response in differentiated THP-1 cells. Nanotoxicology. 2017;11:936–951. doi:10.1080/17435390.2017.1382600
27. Tuomela S, Autio R, Buerki-Thurnherr T, et al. Gene expression profiling of immune-competent human cells exposed to engineered zinc oxide or titanium dioxide nanoparticles. PLoS One. 2013;8:e68415. doi:10.1371/journal.pone.0068415
28. Lenz G, Staudt LM, Schwartz RS. Aggressive lymphomas. N Engl J Med. 2010;362:1417–1429. doi:10.1056/NEJMra0807082
29. Li S, Young KH, Medeiros LJ. Diffuse large B-cell lymphoma. Pathology. 2018;50:74–87. doi:10.1016/j.pathol.2017.09.006
30. Sehn LH, Salles G, Longo DL. Diffuse large B-cell lymphoma. N Engl J Med. 2021;384:842–858. doi:10.1056/NEJMra2027612
31. Thieblemont C, Bernard S, Meignan M, Molina T. Optimizing initial therapy in DLBCL. Best Pract Res Clin Haematol. 2018;31:199–208. doi:10.1016/j.beha.2018.08.001
32. Wight JC, Chong G, Grigg AP, Hawkes EA. Prognostication of diffuse large B-cell lymphoma in the molecular era: moving beyond the IPI. Blood Rev. 2018;32:400–415. doi:10.1016/j.blre.2018.03.005
33. Tweeddale ME, Lim B, Jamal N, et al. The presence of clonogenic cells in high-grade malignant lymphoma: a prognostic factor. Blood. 1987;69:1307–1314.
34. Triboulet S, Aude-Garcia C, Armand L, et al. Analysis of cellular responses of macrophages to zinc ions and zinc oxide nanoparticles: a combined targeted and proteomic approach. Nanoscale. 2014;6:6102–6114. doi:10.1039/C4NR00319E
35. Mosmann T. Rapid colorimetric assay for cellular growth and survival: application to proliferation and cytotoxicity assays. J Immunol Methods. 1983;65:55–63. doi:10.1016/0022-1759(83)90303-4
36. Reimand J, Arak T, Adler P, et al. g: profiler—a web server for functional interpretation of gene lists (2016 update). Nucleic Acids Res. 2016;44:W83–W9. doi:10.1093/nar/gkw199
37. Croce CM. Oncogenes and cancer. N Engl J Med. 2008;358:502–511. doi:10.1056/NEJMra072367
38. Tanaka S, Baba Y. B cell receptor signaling. In: B Cells in Immunity and Tolerance. Springer; 2020:23–36.
39. Zinatizadeh MR, Schock B, Chalbatani GM, Zarandi PK, Jalali SA, Miri SR. The Nuclear Factor Kappa B (NF-kB) signaling in cancer development and immune diseases. Genes Dis. 2021;8:287–297. doi:10.1016/j.gendis.2020.06.005
40. Si M, Lang J. The roles of metallothioneins in carcinogenesis. J Hematol Oncol. 2018;11:107. doi:10.1186/s13045-018-0645-x
41. Zheng Y, Jiang L, Hu Y, et al. Metallothionein 1H (MT1H) functions as a tumor suppressor in hepatocellular carcinoma through regulating Wnt/β-catenin signaling pathway. BMC Cancer. 2017;17:161. doi:10.1186/s12885-017-3139-2
42. Liu Z, Ye Q, Wu L, et al. Metallothionein 1 family profiling identifies MT1X as a tumor suppressor involved in the progression and metastastatic capacity of hepatocellular carcinoma. Mol Carcinog. 2018;57:1435–1444. doi:10.1002/mc.22846
43. Wang Y, Wang G, Tan X, et al. MT1G serves as a tumor suppressor in hepatocellular carcinoma by interacting with p53. Oncogenesis. 2019;8:1–11. doi:10.1038/s41389-019-0176-5
44. Mao J, Yu H, Wang C, et al. Metallothionein MT1M is a tumor suppressor of human hepatocellular carcinomas. Carcinogenesis. 2012;33:2568–2577. doi:10.1093/carcin/bgs287
45. Yun CW, Kim HJ, Lim JH, Lee SH. Heat shock proteins: agents of cancer development and therapeutic targets in anti-cancer therapy. Cells. 2020;9:60. doi:10.3390/cells9010060
46. Chowanadisai W, Kelleher SL, Lonnerdal BO. Zinc deficiency is associated with increased brain zinc import and LIV-1 expression and decreased ZnT-1 expression in neonatal rats. J Nutr. 2005;135:1002–1007. doi:10.1093/jn/135.5.1002
47. García-Hevia L, Valiente R, Martín-Rodríguez R, et al. Nano-ZnO leads to tubulin macrotube assembly and actin bundling, triggering cytoskeletal catastrophe and cell necrosis. Nanoscale. 2016;8:10963–10973. doi:10.1039/C6NR00391E
48. Prado F, Jimeno-González S, Reyes JC. Histone availability as a strategy to control gene expression. RNA Biol. 2017;14:281–286. doi:10.1080/15476286.2016.1189071
49. Hammond CM, Strømme CB, Huang H, Patel DJ, Groth A. Histone chaperone networks shaping chromatin function. Nat Rev Mol Cell Biol. 2017;18:141–158. doi:10.1038/nrm.2016.159
50. Kalakonda N, Fischle W, Boccuni P, et al. Histone H4 lysine 20 monomethylation promotes transcriptional repression by L3MBTL1. Oncogene. 2008;27:4293–4304. doi:10.1038/onc.2008.67
51. Li N, Li Y, Lv J, et al. ZMYND8 reads the dual histone mark H3K4me1-H3K14ac to antagonize the expression of metastasis-linked genes. Mol Cell. 2016;63:470–484. doi:10.1016/j.molcel.2016.06.035
52. Cowger JJM, Zhao Q, Isovic M, Torchia J. Biochemical characterization of the zinc-finger protein 217 transcriptional repressor complex: identification of a ZNF217 consensus recognition sequence. Oncogene. 2007;26:3378–3386. doi:10.1038/sj.onc.1210126
53. Ea C-K, Hao S, Yeo KS, Baltimore D. EHMT1 protein binds to nuclear factor-κB p50 and represses gene expression. J Biol Chem. 2012;287:31207–31217. doi:10.1074/jbc.M112.365601
54. Mirandola L, Comi P, Cobos E, Kast WM, Chiriva-Internati M, Chiaramonte R. Notch-ing from T-cell to B-cell lymphoid malignancies. Cancer Lett. 2011;308:1–13. doi:10.1016/j.canlet.2011.05.009
55. Dudley DD, Wang H-C, Sun X-H. Hes1 potentiates T cell lymphomagenesis by up-regulating a subset of notch target genes. PLoS One. 2009;4:e6678. doi:10.1371/journal.pone.0006678
56. Allenspach EJ, Maillard I, Aster JC, Pear WS. Notch signaling in cancer. Cancer Biol Ther. 2002;1:466–476. doi:10.4161/cbt.1.5.159
57. Fiddes IT, Lodewijk GA, Mooring M, et al. Human-specific NOTCH2NL genes affect Notch signaling and cortical neurogenesis. Cell. 2018;173:1356–69. e22. doi:10.1016/j.cell.2018.03.051
58. Lamar E, Deblandre G, Wettstein D, et al. Nrarp is a novel intracellular component of the Notch signaling pathway. Genes Dev. 2001;15:1885–1899. doi:10.1101/gad.908101
59. Song S, Johnson FB. Epigenetic mechanisms impacting aging: a focus on histone levels and telomeres. Genes. 2018;9:2–27. doi:10.3390/genes9040201
60. O’Sullivan RJ, Kubicek S, Schreiber SL, Karlseder J. Reduced histone biosynthesis and chromatin changes arising from a damage signal at telomeres. Nat Struct Mol Biol. 2010;17:1218–1225. doi:10.1038/nsmb.1897
61. Wojtyla A, Gladych M, Rubis B. Human telomerase activity regulation. Mol Biol Rep. 2011;38:3339–3349. doi:10.1007/s11033-010-0439-x
62. Mishra PK, Mishra H, Ekielski A, Talegaonkar S, Vaidya B. Zinc oxide nanoparticles: a promising nanomaterial for biomedical applications. Drug Discov Today. 2017;22:1825–1834. doi:10.1016/j.drudis.2017.08.006
63. Lee SH, Pie J-E, Kim Y-R, Lee HR, Son SW, Kim M-K. Effects of zinc oxide nanoparticles on gene expression profile in human keratinocytes. Mol Cell Toxicol. 2012;8:113–118. doi:10.1007/s13273-012-0014-8
64. Muthuraman P, Ramkumar K, Kim DH. Analysis of dose-dependent effect of zinc oxide nanoparticles on the oxidative stress and antioxidant enzyme activity in adipocytes. Appl Biochem Biotechnol. 2014;174:2851–2863. doi:10.1007/s12010-014-1231-5
65. Syama S, Reshma SC, Sreekanth PJ, Varma HK, Mohanan PV. Effect of zinc oxide nanoparticles on cellular oxidative stress and antioxidant defense mechanisms in mouse liver. Toxicol Environ Chem. 2013;95:495–503. doi:10.1080/02772248.2013.789606
66. Zhou Y, Wang L, Ban X, et al. DHRS2 inhibits cell growth and motility in esophageal squamous cell carcinoma. Oncogene. 2018;37:1086–1094. doi:10.1038/onc.2017.383
67. Jaramillo-Gutierrez G, Molina-Cruz A, Kumar S, Barillas-Mury C. The Anopheles gambiae oxidation resistance 1 (OXR1) gene regulates expression of enzymes that detoxify reactive oxygen species. PLoS One. 2010;5:e11168. doi:10.1371/journal.pone.0011168
68. Ding C, Fan X, Wu G. Peroxiredoxin 1–an antioxidant enzyme in cancer. J Cell Mol Med. 2017;21:193–202. doi:10.1111/jcmm.12955
69. Drevet JR. The antioxidant glutathione peroxidase family and spermatozoa: a complex story. Mol Cell Endocrinol. 2006;250:70–79. doi:10.1016/j.mce.2005.12.027
70. Hanschmann E-M, Godoy JR, Berndt C, Hudemann C, Lillig CH. Thioredoxins, glutaredoxins, and peroxiredoxins—molecular mechanisms and health significance: from cofactors to antioxidants to redox signaling. Antioxid Redox Signal. 2013;19:1539–1605. doi:10.1089/ars.2012.4599
71. Danovi D, Meulmeester E, Pasini D, et al. Amplification of Mdmx (or Mdm4) directly contributes to tumor formation by inhibiting p53 tumor suppressor activity. Mol Cell Biol. 2004;24:5835–5843. doi:10.1128/MCB.24.13.5835-5843.2004
72. Chen D, Zhang Z, Li M, et al. Ribosomal protein S7 as a novel modulator of p53–MDM2 interaction: binding to MDM2, stabilization of p53 protein, and activation of p53 function. Oncogene. 2007;26:5029–5037. doi:10.1038/sj.onc.1210327
73. Xue L, Chu F, Cheng Y, et al. Siva-1 binds to and inhibits BCL-XL-mediated protection against UV radiation-induced apoptosis. Proc Natl Acad Sci. 2002;99:6925–6930. doi:10.1073/pnas.102182299
74. Ola MS, Nawaz M, Ahsan H. Role of Bcl-2 family proteins and caspases in the regulation of apoptosis. Mol Cell Biochem. 2011;351:41–58. doi:10.1007/s11010-010-0709-x
75. Tian H-K, Xia T, Jiang C-S, Zhang H-M, Wang K, Li X-J. TFAR19 enhances the opening of permeability transition pore in the mitochondrial membrane of mice liver. Sheng Wu Hua Xue Yu Sheng Wu Wu Li Xue Bao (Shanghai). 2002;34:279–284.
76. Karl I, Jossberger-Werner M, Schmidt N, et al. TRAF2 inhibits TRAIL-and CD95L-induced apoptosis and necroptosis. Cell Death Dis. 2014;5:e1444–e. doi:10.1038/cddis.2014.404
77. Jiang Y, Woronicz JD, Liu W, Goeddel DV. Prevention of constitutive TNF receptor 1 signaling by silencer of death domains. Science. 1999;283:543–546. doi:10.1126/science.283.5401.543
78. Hitoshi Y, Lorens J, Kitada S-I, et al. Toso, a cell surface, specific regulator of Fas-induced apoptosis in T cells. Immunity. 1998;8:461–471. doi:10.1016/S1074-7613(00)80551-8
79. Yang X, Khosravi-Far R, Chang HY, Baltimore D. Daxx, a novel Fas-binding protein that activates JNK and apoptosis. Cell. 1997;89:1067–1076. doi:10.1016/S0092-8674(00)80294-9
80. Imai Y, Kimura T, Murakami A, Yajima N, Sakamaki K, Yonehara S. The CED-4-homologous protein FLASH is involved in Fas-mediated activation of caspase-8 during apoptosis. Nature. 1999;398:777–785. doi:10.1038/19709
81. Deveraux QL, Takahashi R, Salvesen GS, Reed JC. X-linked IAP is a direct inhibitor of cell-death proteases. Nature. 1997;388:300–304. doi:10.1038/40901
82. Suzuki Y, Imai Y, Nakayama H, Takahashi K, Takio K, Takahashi R. A serine protease, HtrA2, is released from the mitochondria and interacts with XIAP, inducing cell death. Mol Cell. 2001;8:613–621. doi:10.1016/S1097-2765(01)00341-0
83. Maier JKX, Lahoua Z, Gendron NH, et al. The neuronal apoptosis inhibitory protein is a direct inhibitor of caspases 3 and 7. J Neurosci. 2002;22:2035–2043. doi:10.1523/JNEUROSCI.22-06-02035.2002
84. Stegh AH, Kesari S, Mahoney JE, et al. Bcl2L12-mediated inhibition of effector caspase-3 and caspase-7 via distinct mechanisms in glioblastoma. Proc Natl Acad Sci. 2008;105:10703–10708. doi:10.1073/pnas.0712034105
85. Cazzaniga G, Tosi S, Aloisi A, et al. The tyrosine kinase abl-related gene ARG is fused to ETV6 in an AML-M4Eo patient with at (1; 12)(q25; p13): molecular cloning of both reciprocal transcripts. Blood. 1999;94:4370–4373. doi:10.1182/blood.V94.12.4370
86. Aventin A, Mecucci C, Guanyabens C, et al. Variant t (2; 18) translocation in a Burkitt conversion of follicular lymphoma. Br J Haematol. 1990;74:367–369. doi:10.1111/j.1365-2141.1990.tb02599.x
87. De Vos S, Hofmann W-K, Grogan TM, et al. Gene expression profile of serial samples of transformed B-cell lymphomas. Lab Invest. 2003;83:271–285. doi:10.1097/01.LAB.0000053913.85892.E9
88. Aggarwal M, Villuendas R, Gomez G, et al. TCL1A expression delineates biological and clinical variability in B-cell lymphoma. Mod Pathol. 2009;22:206–215. doi:10.1038/modpathol.2008.148
89. Pekarsky Y, Palamarchuk A, Maximov V, et al. Tcl1 functions as a transcriptional regulator and is directly involved in the pathogenesis of CLL. Proc Natl Acad Sci. 2008;105:19643–19648. doi:10.1073/pnas.0810965105
90. Uddin S, Hussain AR, Siraj AK, et al. Role of phosphatidylinositol 3′-kinase/AKT pathway in diffuse large B-cell lymphoma survival. Blood. 2006;108:4178–4186. doi:10.1182/blood-2006-04-016907
91. Wang J, Xu-Monette ZY, Jabbar KJ, et al. AKT hyperactivation and the potential of AKT-targeted therapy in diffuse large B-cell lymphoma. Am J Pathol. 2017;187:1700–1716. doi:10.1016/j.ajpath.2017.04.009
92. Young RM, Shaffer Iii AL, Phelan JD, Staudt LM. B-cell receptor signaling in diffuse large B-cell lymphoma. Semin Hematol. 2015;52:77–85. doi:10.1053/j.seminhematol.2015.01.008
93. Niemann CU, Wiestner A. B-cell receptor signaling as a driver of lymphoma development and evolution. Semin Cancer Biol. 2013;23:410–421. doi:10.1016/j.semcancer.2013.09.001
94. Koehrer S, Burger JA. B-cell receptor signaling in chronic lymphocytic leukemia and other B-cell malignancies. Clin Adv Hematol Oncol. 2016;14:55–65.
95. Kim H-O. Development of BTK inhibitors for the treatment of B-cell malignancies. Arch Pharm Res. 2019;42:171–181. doi:10.1007/s12272-019-01124-1
96. Compagno M, Lim WK, Grunn A, et al. Mutations of multiple genes cause deregulation of NF-κB in diffuse large B-cell lymphoma. Nature. 2009;459:717–721. doi:10.1038/nature07968
97. Pavan A, Spina M, Canzonieri V, Sansonno S, Toffoli G, De Re V. Recent prognostic factors in diffuse large B-cell lymphoma indicate NF-κB pathway as a target for new therapeutic strategies. Leuk Lymphoma. 2008;49:2048–2058. doi:10.1080/10428190802444176
 © 2022 The Author(s). This work is published and licensed by Dove Medical Press Limited. The
full terms of this license are available at https://www.dovepress.com/terms
and incorporate the Creative Commons Attribution
- Non Commercial (unported, 3.0) License.
By accessing the work you hereby accept the Terms. Non-commercial uses of the work are permitted
without any further permission from Dove Medical Press Limited, provided the work is properly
attributed. For permission for commercial use of this work, please see paragraphs 4.2 and 5 of our Terms.
© 2022 The Author(s). This work is published and licensed by Dove Medical Press Limited. The
full terms of this license are available at https://www.dovepress.com/terms
and incorporate the Creative Commons Attribution
- Non Commercial (unported, 3.0) License.
By accessing the work you hereby accept the Terms. Non-commercial uses of the work are permitted
without any further permission from Dove Medical Press Limited, provided the work is properly
attributed. For permission for commercial use of this work, please see paragraphs 4.2 and 5 of our Terms.