Back to Journals » Journal of Inflammation Research » Volume 14
Transcriptome-Wide Analysis to Identify the Inflammatory Role of lncRNA Neat1 in Experimental Ischemic Stroke
Authors Jin F ![]() , Ou W, Wei B, Fan H, Wei C, Fang D, Li G, Liu W, Liu J, Jin L, He X, Duan C
, Ou W, Wei B, Fan H, Wei C, Fang D, Li G, Liu W, Liu J, Jin L, He X, Duan C ![]()
Received 16 April 2021
Accepted for publication 28 May 2021
Published 22 June 2021 Volume 2021:14 Pages 2667—2680
DOI https://doi.org/10.2147/JIR.S315281
Checked for plagiarism Yes
Review by Single anonymous peer review
Peer reviewer comments 3
Editor who approved publication: Professor Ning Quan
Fa Jin, Weiyang Ou, Boyang Wei, Haiyan Fan, Chengcong Wei, Dazhao Fang, Guangxu Li, Wenchao Liu, Jiahui Liu, Lei Jin, Xuying He, Chuanzhi Duan
Neurosurgery Center, Department of Cerebrovascular Surgery, The National Key Clinical Specialty, The Engineering Technology Research Center of Education Ministry of China on Diagnosis and Treatment of Cerebrovascular Disease, Guangdong Provincial Key Laboratory on Brain Function Repair and Regeneration, The Neurosurgery Institute of Guangdong Province, Zhujiang Hospital, Southern Medical University, Guangzhou, 510282, People’s Republic of China
Correspondence: Chuanzhi Duan; Xuying He Tel +86 135 399 622 33
; +86 136 888 771 33
Fax +86 206 164 3010
Email [email protected]; [email protected]
Background: Ischemic stroke is one of the leading causes of mortality and disability worldwide. Following stroke, there is secondary neuroinflammation that promotes further injury. Identifying the long non-coding RNA (lncRNA) involved in neuroinflammation after cerebral ischemic stroke will promote the discovery of potential therapeutic targets.
Methods: We identified differentially expressed genes from genome-wide RNA-seq profiles of mice with focal ischemia using Gene Ontology Term Enrichment, Kyoto Encyclopedia of Genes and Genomes, and Gene Set Enrichment analyses. Immune cell infiltration deconvolution, protein-protein interaction network construction, and co-expression network analyses were also used to screen lncRNAs. In further experiments, lncRNA Neat1 knockdown animal models were developed by intraventricular injection of the antisense oligonucleotide before performing middle cerebral artery occlusion (MCAO). An enzyme-linked immunosorbent assay was performed to measure the level of cytokines. Hematoxylin-eosin staining and immunohistochemical staining were used to observe the changes in morphology.
Results: Enrichment analysis revealed that differential mRNAs induced neuroinflammation after MCAO. Immune deconvolution showed that the proportion of microglia gradually increased while monocytes decreased within 24 h. We identified six hub lncRNAs (Neat1, Gm10827, Trp53cor1, Mir670hg, C730002L08Rik, and Mir181a-hg) that were highly correlated with activated-microglia mRNAs (cor > 0.8). We found that Neat1 had the highest correlation coefficient with pro-inflammatory factor mRNA levels. In vivo experiments demonstrated that Neat1 had abnormally high expression after MCAO. Knockdown of Neat1 could significantly alleviate brain damage by reducing the number of activated microglia and reducing their release of proinflammatory cytokines.
Conclusion: We identified inflammation-associated lncRNA Neat1 as crucial, which means it is a potential target for ischemic stroke treatment.
Keywords: bioinformatics, lncRNA Neat1, ischemic stroke, MCAO, microglia, neuroinflammation
Introduction
Ischemic stroke is one of the leading causes of disability and death worldwide; its pathological processes are typically associated with inflammation, oxidative stress, blood-brain barrier disruption, apoptosis, autophagy, and eventually neuronal cell death in the brain.1–3 To remove cellular debris and restore tissue homeostasis,4 damage-associated molecular patterns were extensively released with inflammatory cytokines and microglia activated in to the damaged area.5 The normally immune-privileged brain environment is consequently exposed to systemic responses that further aggravate the immune responses and cause secondary brain damage.6 Therefore, controlling post-ischemic inflammation is considered a potential therapeutic target in ischemic stroke.
Long non-coding RNA (lncRNA), defined as transcripts longer than 200 nucleotides with little protein-coding capacity, constitutes a large proportion of the transcriptome.7 Accumulating evidence has shown lncRNA plays a pivotal role in the pathophysiological processes of ischemic stroke injury. For instance, antisense RNA to INK4 locus (ANRIL), metastasis-associated lung adenocarcinoma transcript 1 (MALAT1), maternally expressed 3 (MEG3), and 1810034E14Rik have been validated as affecting cell inflammation, apoptosis, cell death, and angiogenesis in ischemic stroke.8–11 However, the lncRNAs that regulate inflammation in the acute phase of ischemic stroke have been studied very little.
In this study, we identified the lncRNA nuclear paraspeckle assembly transcript 1 (Neat1) associated with inflammation after ischemic stroke in mice. Neat1 and its human ortholog NEAT1 assemble paraspeckles and maintain their structural integrity.12,13 The paraspeckle is a specific type of nuclear body in the interchromatin space whose function remains unknown.14 Neat1 has two transcript isoforms; ie, Neat1_1 (3190 nt) and Neat1_2 (20,771 nt)12 (Supplemental Figure 1A). In contrast to the Neat1_2 isoform, which has been observed in low abundance in various organs of adult mice, Neat1_1 exhibits high expression throughout the brain (Supplemental Figure 1B). Our study on Neat1 was more specifically dealing with Neat1_1.
We used bioinformatics and functional analysis to screen lncRNA candidates that promote ischemic inflammation. Furthermore, we verified the target lncRNA Neat1 first and then further clarified its pro-inflammatory biological function through loss-of-function studies.
Materials and Methods
Genome-Wide Transcriptomic Data Processing
We downloaded high throughput raw data SRA files (GSE112348) from the NCBI Gene Expression Omnibus (GEO, https://www.ncbi.nlm.nih.gov/gds/). Twelve samples from both healthy and post-ischemic male C57BL/6 mouse cortices were created at different reperfusion time-points (6 h, 12 h, or 24 h) with Illumina sequencing. The SRA Toolkit converted each SRA to the FASTQ format. Quality control processes included adapter trimming, removal of low-quality reads, and removal of short reads with fastp software.15 Clean paired-end reads were aligned to the mouse reference genome GRCm38 using HISAT2.16 Samtools was then used to convert the aligned sam files to sorted bam files. Gene expression for each sample was quantified by counting the number of uniquely mapped reads with featureCounts.17 For annotation, we annotated gene symbols via Mus_musculus.GRCm38.99.gtf (http://asia.ensembl.org/), and those without gene symbol reads rows were dropped. The flowchart diagram for this study is represented in Figure 1A.
 |
Figure 1 Differential genes involved in the pathophysiology of MCAO. (A) Outline of the workflow in the present study. (B and C) Principal component analysis results of mRNAs and lncRNAs. (D) The number of mapped, annotated, protein-coding and lncRNA genes expressed during dataset procession. (E) Heatmap of DEGs between Sham and MCAO at various time points. (F and G) The Venn diagram shows the intersection of mRNA and lncRNA DEGs at different time points. (H and I) Volcano plot shows the distribution of log fold change and adjusted p-value for mRNAs and lncRNAs; indicated genes represent the top of both up-regulated and down-regulated genes. |
Screening of Differentially Expressed Genes (DEGs)
Normalization and DEGs analyses were performed with the Deseq2 R package.18 The duplicate gene rows were removed and the mean value was taken as the expression value. All q-values were used as the false discovery rate (FDR) to correct the statistical significance of multiple groups (p < 0.05, FDR < 0.05) and absolute log2 fold change ≥ 2.0 (mRNA) or ≥ 1.0 (lncRNA) was considered significant.
Functional and Pathway Enrichment Analyses
Gene Ontology (GO), Kyoto Encyclopedia of Genes and Genomes (KEGG) and Gene Set Enrichment Analysis (GSEA) were used to uncover functional annotations through the Bioconductor R package clusterProfiler19 or DAVID website tool (https://david.ncifcrf.gov/). GO was used to describe the set of gene functions along with three aspects: biological process (BP), cellular component (CC), and molecular function (MF). The KEGG and GSEA databases were searched for pathways at the significance level cutoff p < 0.05. The interaction network of BP terms was constructed with Cytoscape software20 and ClueGO plugin.21 The protein-protein interaction (PPI) network was analyzed using the STRING functional protein association network (https://string-db.org).
LncRNA-mRNA Co-Expression Network
We obtained a mRNA gene symbol list for regulating microglial activation from the MSigDB website (https://www.gsea-msigdb.org/) to construct the lncRNA-mRNA co-expression network. We used seq-immuCC22 to estimate the relative proportion of different immune cell types in samples. Each differentially expressed lncRNA was calculated with the Pearson correlation test using the expression value of these mRNAs. For each pair of lncRNA-mRNA analyzed, only the absolute value of a correlation ≥ 0.8 and p < 0.01 pair was considered a strong correlation (either positive or negative).
Animals
Male C57BL/6 mice (8 weeks, weight, 21–25 g) were purchased from Charles River Laboratory (Charles River Laboratories, Inc., Beijing, China). Animals were housed under controlled temperature and humidity conditions (22 ± 1 °C; 40–60%) under a 12/12-h light/dark cycle with food and water ad libitum. The animal experiments were approved by the Ethics Committee of Zhujiang Hospital (Approval Number: LAEC-2020-012) and performed in accordance with the National Institutes of Health guidelines for the care and use of laboratory animals.23
Silencing of the lncRNA Neat1
Neat1 knockdown was performed using 2ʹ-OMe antisense oligonucleotides (ASOs) synthesized by RiboBio (RiboBio Co., Ltd., Guangzhou, China). ASOs (5ʹ-GGAAATCATAGAGGACAGGC-3ʹ) or Scrambled control (5ʹ-GAAGAAGTACGAAGTGACGC-3ʹ) were delivered to the groups through intraventricular administration. Mice were anesthetized with 1% pentobarbital sodium (60 mg/kg) by intraperitoneal injection and then fixed in a stereotaxic frame. A skin incision was made and puncture points were made at x (1.5 mm from the sagittal suture), y (−2.0 mm from the bregma), and z (2.5 mm depth). ASO-Neat1 (2 nmol, 2 μL) or ASO-scramble (negative control, ASO-NC) was injected into the intraventricular once a week for 2 weeks before middle cerebral artery occlusion (MCAO).
MCAO Model
Two weeks after injection, MCAO procedures were performed according to previous studies.24 Briefly, mice were anesthetized with 2% isoflurane in oxygen for 3 min and maintained with 1.0 to 1.5% isoflurane in 70% N2O and 30% O2 using a small-animal anesthesia system (Vet Equip, Pleasanton, CA, USA). Body temperature was maintained at a constant 37.5 °C during surgery with a heating pad. A midline neck incision was cut and the left common carotid artery (CCA) and external carotid artery (ECA) were isolated. After temporarily blocking the internal carotid artery (ICA) and CCA, a silicone-coated monofilament (MSMC21B120PK50, RWD Life Science Inc., Shenzhen, China) was inserted via the arteriotomy in the ECA and slowly advanced through the left ICA to reach the origin of the middle cerebral artery (MCA). The monofilament was removed after a 60-min occlusion, and the ECA was ligated permanently. Animals that died of anesthetic procedural problems during surgeries, 12h, or had no neurological deficits after the operation were excluded from the study (Supplemental Table 1). The mouse in the sham group was inserted with a monofilament to occlude the MCA and then the monofilament was withdrawn immediately to restore blood flow.
Animal Experimental Design
The animal experiments were performed as follows (Supplemental Figure 2). Mice were randomly assigned to different groups according to a previously described method.25 There were no significant differences in the number or weights of animals in each group.
Experiment 1
The relative expression level of six lncRNAs associated with activation of microglia were detected by quantitative polymerase chain reaction (qPCR) at 24 h after MCAO. Ten mice were randomly allocated into two groups including the sham and MCAO groups (n = 5).
Experiment 2
For qPCR detection of the time-course of Neat1 expression levels after MCAO, a total 20 of mice were randomly divided into four groups: the sham group and three MCAO subgroups (at 6 h, 48 h, 72 h after MCAO; n = 5).
Experiment 3
Sixty-four mice were randomly assigned to the four groups, including the sham, MCAO, MCAO + ASO-NC, MCAO + ASO-Neat1 groups, for the examination with qPCR and an enzyme-linked immunosorbent assay (ELISA, n = 5), 2,3,5-triphenyl tetrazolium chloride (TTC) staining (n = 5), brain water content (BWC; n = 5), hematoxylin-eosin (HE) staining, and immunohistochemical (IHC) staining (n = 3).
Experiment 4
Thirty mice were randomly divided into three groups, including the MCAO, MCAO + ASO-NC, and MCAO + ASO-Neat1 groups (n = 10), to evaluate the effects of knocking down Neat1 on neurological function and survival in mice post-MCAO.
Neurological Function Evaluation
Mice were assessed with the Modified Neurological Severity Score (mNSS) test26,27 at 12 h, 24 h, 48 h, and 72 h after MCAO. Specific criteria for mNSS in mice were scored as shown in Supplemental Table 2. The higher score represents the more neurological severe impairment (normal score, 0; maximal score, 14). Scores were evaluated by two observers who were blind to the mice groups.
TTC Staining
Mice were sacrificed at 24 h after MCAO and brains were rapidly harvested and cut into five coronal sections (1.5 mm thick each). They were then incubated in a 2% TTC solution (Sigma-Aldrich, St. Louis, MO, USA) for 30 min at 37 °C and then transferred into a 4% paraformaldehyde solution for 24 h for fixation. The infarction area in each slice was measured with ImageJ software (ImageJ, 1.8.0, NIH, Bethesda, USA) after digital photo capture.
Brain Water Content Analysis
Brains were removed at 24 h after MCAO. Left and right hemispheres were weighed immediately to obtain the wet weight and were then oven-dried at 75 °C for 48 h to obtain the dry weight. The brain water content percentage was computed as follows: [(wet weight - dry weight)/wet weight] × 100%.
qPCR
Total RNA was isolated with TRIzol reagent (#15596-026, Invitrogen™ TRIzol™, Thermo Scientific, USA). 1 mg of RNA was used to synthesize cDNA using the RT Master Mix (#RR036A, Takata Bio, Dalian, China). qPCR was performed using SYBR Green real-time PCR analysis with specific primers (Table 1). PCR amplification was performed as follows: 95 °C for 5 min, followed by 40 cycles of 95 °C for 10 s and 60 °C for 60 s. The expression of candidate lncRNAs was calculated using the 2−ΔΔC method and Gapdh as an internal control.
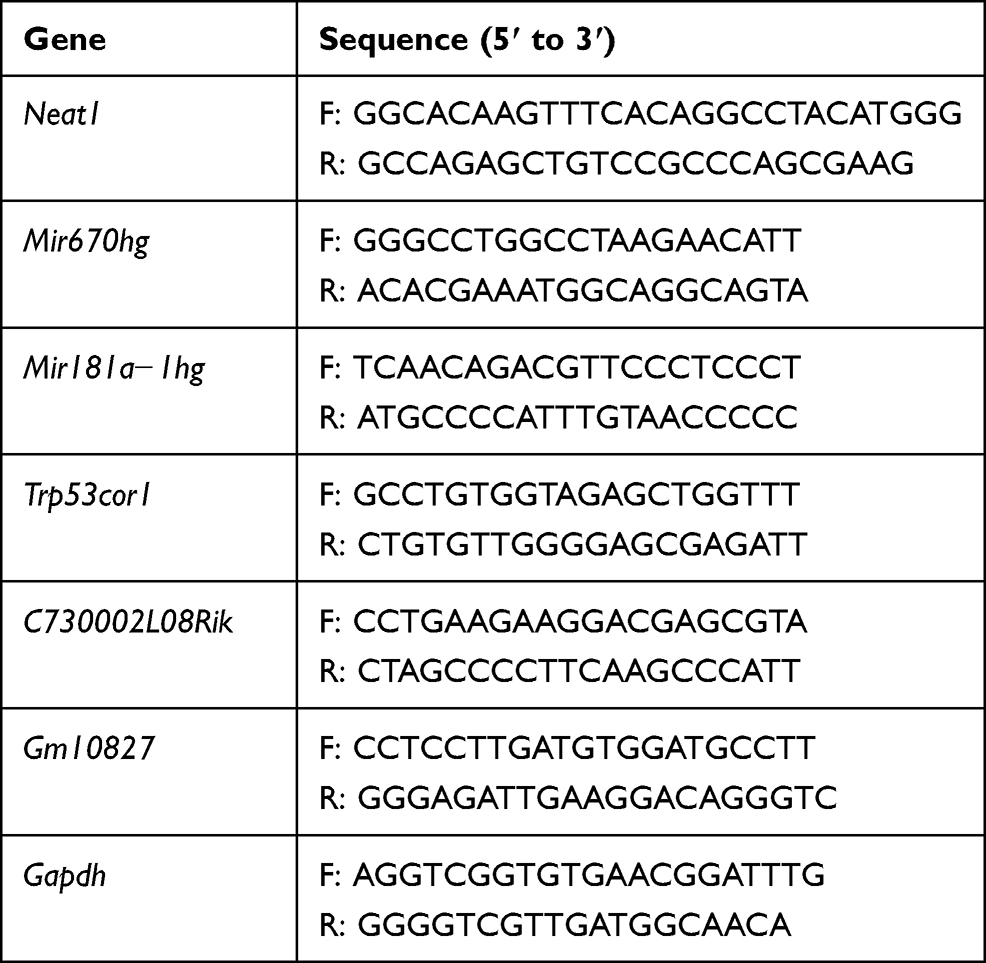 |
Table 1 Primer Sequence of qPCR |
ELISA
At 24 h post-MCAO, mice were anesthetized and transcardially perfused with phosphate-buffered saline (PBS, pH 7.4, 4 °C). The infarcted hemisphere was harvested immediately and homogenized in 0.9% normal saline 200 mg/mL and centrifuged at 12,000 rpm for 20 min. The supernatant was collected and stored at − 80 °C until used further. The concentrations of tumor necrosis factor alpha (TNF-α), interleukin 6 (IL-6), interleukin 1 beta (IL-1β), interleukin 4 (IL-4), and interleukin (IL-10) in brain tissue lysates were analyzed using commercial ELISA kits (#88-7324-22, #88-7064-22, #88-7013-22, #88-7044-22 and #88-7105-22, Invitrogen, Thermo Scientific, USA) according to the manufacturer’s instructions. The final concentration of cytokines was determined according to the standard curve of absorbance.
H&E Staining
Three mice in each group were anesthetized and perfused with PBS (pH 7.4, 4 °C) followed by 4% paraformaldehyde solution (4 °C). The brains were removed and postfixed in 4% formaldehyde solution for 24 h at 4 °C. After being dehydrated and embedded with paraffin, the samples were cut into 4 μm thick sections. Sections were deparaffinized and then rehydrated in decreasing concentrations of ethanol; they were then stained with H&E solution (#G1005, Servicebio, Wuhan, China) according to the manufacturer’s protocols.
IHC Staining
The deparaffinized and rehydrated coronal sections (4 μm thickness) were prepared as described previously. Endogenous peroxidase activity was quenched using 3% H2O2 for 10 min at room temperature. Sections were then blocked in 5% bovine serum albumin for 20 min and were incubated overnight at 4°C with anti-Iba1 rabbit pAb (1:400; #GB11105, Servicebio, Wuhan, China). Sample slices were then washed with PBS and incubated with biotinylated goat anti-rabbit IgG (1:200; #PV-6001, ZSGB-Bio, Beijing, China) for 15 min at room temperature. Next, brain slices were incubated with horseradish peroxidase–streptavidin reagent for 10 min and developed using diaminobenzidine peroxidase substrate. Images were captured on a bright-field microscope (DM2500, Leica Microsystems, Wetzlar, Germany).
Statistical Analysis
All statistical analyses were performed using R (version 4.0.2). The volcano plot was plotted with the R package “EnhancedVolcano”. Heat maps were drawn with the R package “pheatmap”. The GO chord plot was generated with the R package “Goplot”. The survival curves were constructed with R package “survminer”. The Pearson correlation matrix was generated with the R package “corrplot”. The Shapiro–Wilk test was used to test continuous variables for normality. Student’s t-test was used for normal distribution variables; Mann–Whitney U rank-sum tests were used for variables that did not follow a normal distribution. Statistical results are presented as the mean ± standard deviation (SD) or standard error (SEM). For all comparisons, a p-value <0.05 was regarded as statistically significant.
Results
Sequence Data Summary and DEG Analysis
Using the mouse genome (mm10) whole-genome alignment, principal component analysis clustered 12 samples into four distinct populations, in line with the four sample populations from different groups (Figure 1B and C). Data from the sham group and each time point after MCAO were obviously distinguished. A total of 40,972 genes were mapped and 21,933 mRNA genes and 13,180 lncRNA genes, were detected in at least one sample (Figure 1D). Comparing the transcriptome expression of the sham and MCAO groups at different time points and then taking the intersection of DEGs (Figure 1E), a total of 441 up-regulated mRNAs and 72 down-regulated mRNAs and 42 up-regulated lncRNAs and 16 down-regulated lncRNAs were identified (Figure 1F and G). These DEGs were visualized separately in volcano maps (Figure 1H and I). Of note, there were significantly more up-regulated genes than that of down-regulated genes after MCAO.
GO Term Enrichment and KEGG Pathway Analysis
To explore the biological function of the DEGs, we extracted protein-coding DEGs (Figure 2A) to perform GO term enrichment and KEGG pathway analysis. Up-regulated mRNAs were enriched in the function of immunologic reactions (cell chemotaxis, cytokine activity, and leukocyte chemotaxis) and activating immune cell migration (neutrophil and monocyte); cellular component and molecular function indicated a relation to inflammation reaction (Figure 2B and C). The KEGG pathway analysis results of the DAVID and GSEA showed that the TNF pathway, JAK-STAT pathway, and NFκB pathway were activated (Figure 2D and E). These results showed that the DEGs were involved in inflammatory responses after MCAO.
 |
Figure 2 Function enrichment analysis indicated changes in cytochemical signals and activation of inflammatory cells. (A) Heatmap of the top 60 up-regulated and 10 down-regulated mRNAs. (B) GO-chord plot shows the main biological process function enrichment, mRNAs are linked via ribbons to their enriched GO terms. The left half outer ring colors show log fold change of DEGs. (C) The top 10 function enrichment terms of biological process, cellular component and molecular function. (D) KEGG pathway enrichment was analyzed from the DAVID website. (E) Pathway enrichment was analyzed with the GSEA method. |
Co-Expression Analysis of lncRNA Associated with Inflammation
To identify the lncRNA that regulates inflammation, we first used clueGO to perform network analysis on the enriched GO terms. The results showed that inflammation is closely related to the activation of microglia (Figure 3A). Then we constructed a PPI network with key mRNAs involved in activating microglia (Figure 3B). To further investigate the changes in microglia after MCAO, we applied the deconvolution method to estimate the relative proportion of different immune cell types in mouse cerebral tissue by seq-immuCC.22 MCAO groups displayed a gradual increase in the microglia proportion following the time course in 24 h. Simultaneously, the proportion of monocytes declined (Figure 3C). Finally, we performed a co-expression analysis on the transcript expression values of these differential mRNAs and differential lncRNAs that activate microglia, and we screened the 23 lncRNAs with the highest correlation coefficients from the matrix of long non-coding DEGs (Figure 3D and E). The top ten hub lncRNAs were found with a high correlation coefficient (|cor| > 0.8) to 27 mRNAs of the activated microglia (Figure 3F). The pie chart matrix (Figure 3G) illustrates correlation coefficients between lncRNAs and mRNAs.
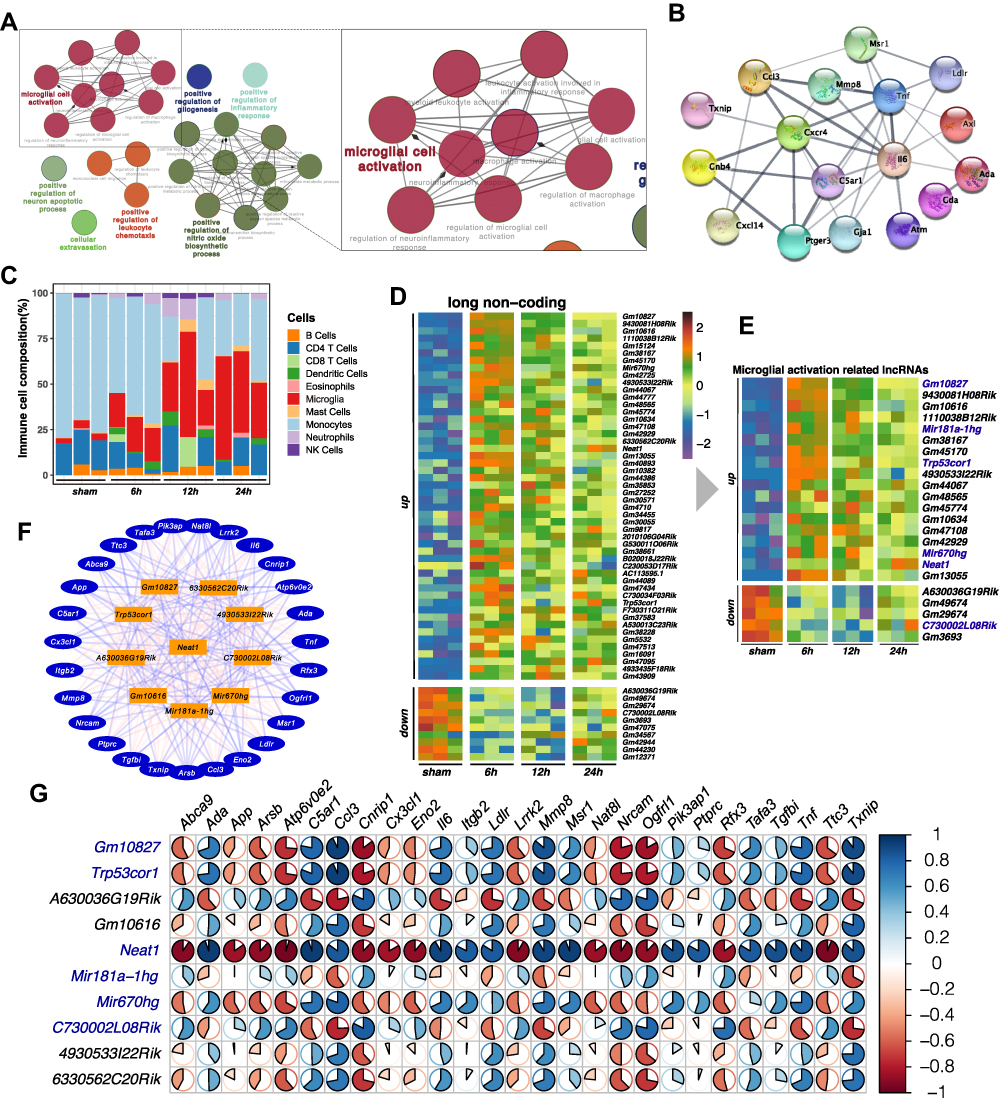 |
Figure 3 Co-expression analysis screened out lncRNAs related to inflammatory activation. (A) Using the ClueGO plugin from Cytoscape to visualize the network relationship between the GO terms, the enlarged part indicates the pathway related to microglial activation. (B) PPI network shows the hub protein-coding DEGs involved in microglial activation. (C) seq-ImmuCC estimated the relative proportions of immune cell populations in each sample. (D) Heatmap of the top 50 up-regulated and 10 down-regulated differential expression lncRNAs. (E) The 18 up-regulated lncRNAs and 5 down-regulated lncRNAs that had the highest correlation with microglial activation genes were found with co-expression analysis. (F) Co-expression network of mRNAs (outer ring) and lncRNAs (orange), lines between genes represent correlation, red as positive, blue as negative. (G) The pie matrix illustrates the correlation between 10 hub lncRNAs (row name) and 27 activating microglial mRNAs (column name). Each pie color intensity and area represents the proportionality of Pearson correlation coefficients. The scale bar on the right panel indicates the positive (blue) and negative (red) correlations. |
Verification of lncRNAs Related to Microglia Activation
In the early stage of ischemic stroke, activated microglia can secrete a variety of pro-inflammatory factors, promote neuroinflammation and aggravate brain damage.28 We analyzed the correlation between the expression levels of six candidate lncRNAs and the proinflammatory factor mRNA secreted by microglia. The results showed that Neat1, Gm10827, Trp53cor1, and Mir670hg were positively correlated with the expression of proinflammatory factors, while C730002L08Rik and Mir181a-hg were negatively correlated (Figure 4A). Among them, Neat1 had the highest correlation with the expression level of inflammatory factors, and the correlation coefficients with IL-6, IL-1β, TNF-α, and NFκB were 0.894, 0.756, 0.868, and 0.929, respectively. To verify these results of co-expression, we established the animal model (mice subjected to 1 h MCAO, 24 h reperfusion) and detected the RNA expression levels with qPCR. The results showed that C730002L08Rik, Mir181a-1hg, and Mir670hg had no significant differences (Figure 4B, C and F), while Gm10827, Trp53cor1, and Neat1 were significantly increased (Figure 4D, E and G). Combining the results of bioinformatics analysis and qPCR, we decided to study Neat1 further. Subsequently, we tested the changes in Neat1 in 6 h, 24 h, 48 h, and 72 h after MCAO (Figure 4H). We observed that Neat1 expression was maintained at a high level compared to the sham group.
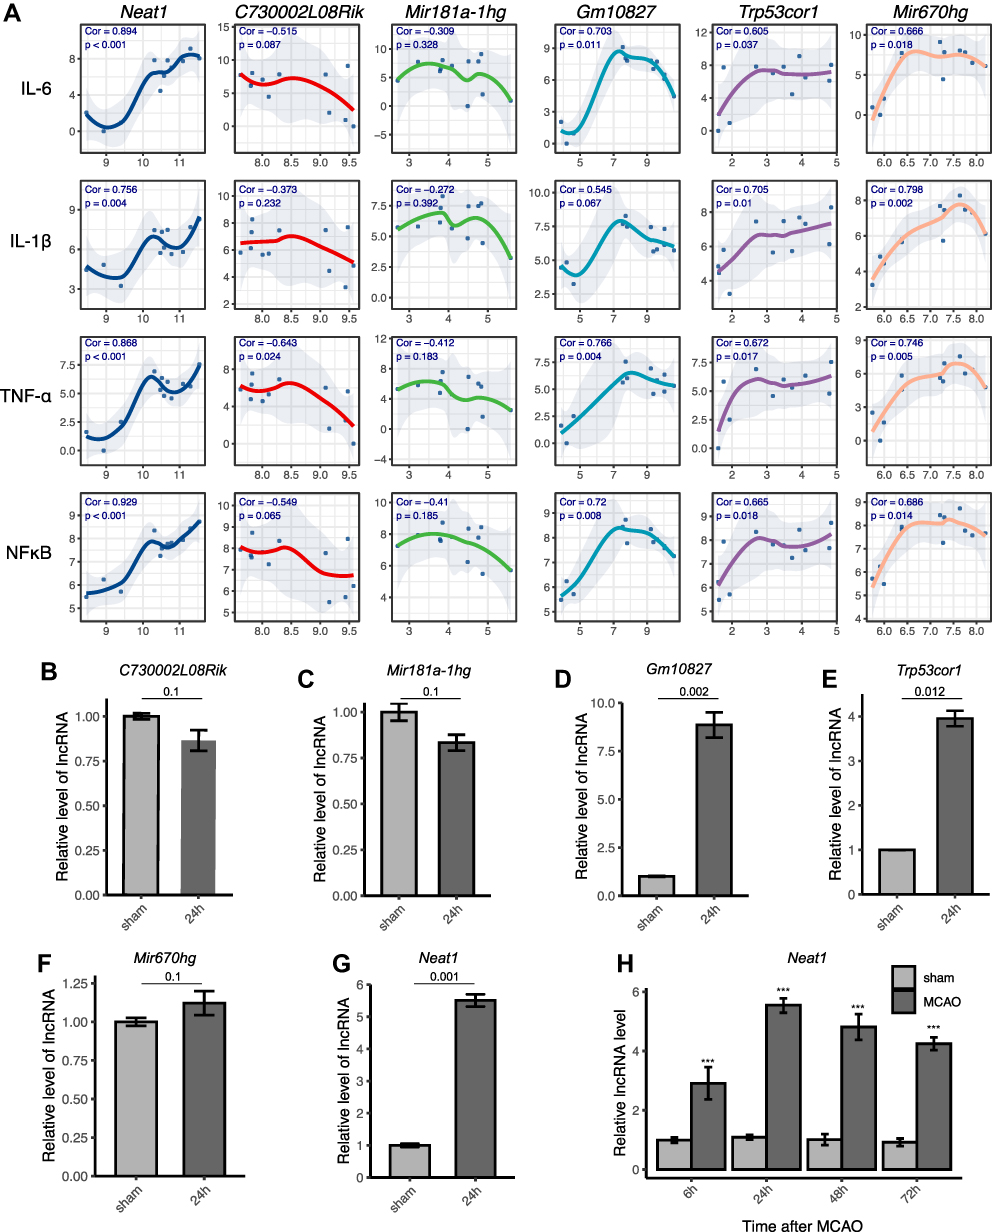 |
Figure 4 Verification of lncRNAs related to microglia activation after ischemic stroke. (A) Analysis of the correlation between six lncRNAs (C730002L08Rik, Mir181a-1hg, Gm10827, Trp53cor1, Mir670hg, and Neat1) and the expression of proinflammatory factors mRNA (Il6, Il1, Tnfa, and Nfkb). The X- or Y-axis represents the normalized expression level of lncRNAs or mRNA, respectively. The correlation coefficients and p-values are shown in the top left of each subplot. (B–G) The lncRNA expressions from the cortex of experimental mice were detected by qPCR. Data are presented as the mean ± SEM, n = 5, Mann–Whitney test. (H) The expression of Neat1 at 6 h, 24 h, 48 h, and 72 h after MCAO was detected by qPCR. The data represent the mean ± SEM. n = 5 in each group. ***p < 0.001 versus the sham group, t-test. |
Neat1 Knockdown Ameliorated Ischemic Brain Insult and Reduced Pro-Inflammatory Cytokine Release After MCAO
To characterize the impact of Neat1 in experimental stroke in vivo, ASO-Neat1 was used to knockdown Neat1 expression in MCAO mice. Neat1 is localized in the nucleus. The use of lentivirus or adenovirus to interfere with the effect is inefficient.29 We therefore chose ASO for animal knockdown experiments. First, we examined the knockdown effect of ASO-Neat1, as shown in Figure 5A. Neat1 expression of the ASO-Neat1 group was significantly downregulated compared with the ASO-NC and MCAO groups. We next rated the neurological severity scores for the mice. The results showed that the neurological function of the mice was impaired significantly, but the ASO-Neat1 group showed lower function damage compared to the MCAO and ASO-NC groups (Figure 5B). Moreover, during the subsequent 7-day recovery phase, the ASO-Neat1 group showed better functional recovery and lower mortality (Figure 5C). Furthermore, Neat1 knockdown mice had less cerebral edema (Figure 5D) and smaller infarct volume in TTC staining (Figure 5E and F). We then investigated whether knockdown Neat1 regulates the levels of inflammatory factors released by the microglia. ELISAs determined three pro-inflammatory cytokines; ie, IL-1β (Figure 5G), IL-6 (Figure 5H), and TNF-α (Figure 5I); two anti-inflammatory cytokines; ie, IL-4 (Figure 5J) and IL-10 (Figure 5K). Knockdown of Neat1 reduced MCAO-induced IL-1β and TNF-α proinflammatory cytokine levels and enhanced IL-10 and IL-4 anti-inflammatory cytokines levels. These findings suggested that knockdown of Neat1 reduces the inflammatory response induced by microglia activation, thereby reducing brain damage.
 |
Figure 5 Neat1 knockdown reduced the infarct volume and decreased pro-inflammatory cytokines after MCAO. (A) The expression of Neat1 was detected with qPCR after ASO-Neat1 administration. Data are presented as the mean ± SEM, n = 5, ***p < 0.001 versus ASO-NC, ns p > 0.05 versus MCAO, Mann–Whitney test. (B) Time-course of modified neurological severity scores. Data are presented as the mean ± SD, n = 5, **p < 0.01 versus ASO-NC, ##p < 0.01 versus MCAO. Mann–Whitney test. (C) The percentage of survival was determined daily for 7 days after MCAO. Survival was analyzed by the Log rank test, n=10, **p < 0.01 versus ASO-NC, ##p < 0.01 versus MCAO. (D) The brain water content was measured to reflect the severity of brain edema. Bars indicate the mean ± SD, n = 3, **p < 0.01 versus sham group, *p < 0.05 versus sham group, #p < 0.05 versus ASO-NC group, t-test. (E) TTC-stained brain slices in sham, MCAO, ASO-NC, and ASO-Neat1 mice at 24 h after MCAO. (F) Comparison of the percentages of infarct volume between each group of mice. n = 5, **p < 0.01 versus ASO-NC, Mann–Whitney test. An ELISA examined the protein levels of IL-1β (G), IL-6 (H), TNF-α (I), IL-4 (J), and IL-10 (K) in the infarcted cortex at 24 h after MCAO. Data represent the mean ± SD. n = 5. *p < 0.05, **p < 0.01, and ***p < 0.001 versus sham group; ##p < 0.01, and ###p < 0.001 versus ASO-NC, t-test. |
Neat1 Knockdown Ameliorated Ischemic Brain Tissue Damage and Reduced the Number of Activated Microglia
We further observed the pathological changes in the cortex and striatum under a microscope (Figure 6A). Morphological alterations were observed with HE staining. Pyknotic nuclei and vacuolated cytoplasms were markedly reduced in the cortex and striatum of ASO-Neat1 mice (Figure 6B). Immunohistochemical staining showed that activated microglia were found in all groups after MCAO. Compared to the sham group, microglia had shorter ramifies and larger cell bodies. Also, there were significantly fewer activated microglia in the ASO-Neat1 group compared with the MCAO and ASO-NC groups (Figure 6C).
 |
Figure 6 Neat1 knockdown alleviated the ischemic brain tissue damage and suppressed microglia activation after MCAO. (A) Representative images of histological staining of the cortex and striatum from mice after MCAO. Coronal sections were stained with H&E (B) and immunohistochemistry of anti-IBA1 (C). Scale bar, 20 μm. The yellow box shows the enlarged area. |
Discussion
Accumulating evidence has indicated that lncRNAs play an essential role in physiological and pathological responses in various diseases.30 However, until now, few lncRNAs have been studied in ischemic stroke31 and function in the pathological process of cerebral ischemia remains largely undefined. The rapid development of bioinformatics analysis methods provides an entry point for exploring the biological functions of lncRNA. We applied differential expression, hierarchical clustering, functional GO enrichment, KEGG and GESA pathway analysis, PPI network construction, immune component deconvolution, and mRNA-lncRNA co-expression network analysis to process and analyze high-throughput sequencing data of ischemic stroke. Our study’s major finding is the identification of the inflammation-related lncRNA Neat1 by mRNA-lncRNA co-expression analysis and subsequent experimental verification. Furthermore, it is the first demonstration that the overexpression of Neat1 in ischemic stroke is closely related to the activation of microglia in vivo, and Neat1 knockdown has a suppressing effect on inflammation.
Recently, increasing evidence has indicated there is an inflammatory role for Neat1 in ischemic stroke. For instance, Neat1 had a pro-inflammation effect in a BV2 cell oxygen-glucose deprivation/reoxygenation (OGD/R) model and knockdown of Neat1 reduces microglial activation and inhibits activity of the AKT/STAT3 pathway.32 These findings are consistent with our research results. However, contrary to previous studies, we used animal experiments to illustrate the anti-inflammatory effects of knockdown Neat1 on early ischemic stroke. In addition, we first clarified in the transcriptome the dynamics of Neat1 and microglia at different time points after MCAO by analyzing the cortex sequencing data. Therefore, our study is deeper than and complementary to previous studies. Moreover, a previous study reported NEAT1 is up-regulated in peripheral blood samples from patients with acute ischemic stroke and is positively correlated with recurrence/death risk.33 Mice Neat1 acts as a homologous lncRNA for NEAT1, suggesting that our study may have translational value.
In the presence of microorganisms, the acute inflammatory response is usually rapid, specific, and self-limiting to avoid inflammation-mediated damage to adjacent tissues.34 However, in the absence of microorganisms, sterile inflammation occurs in the tissue after ischemic stroke. The triggers of sterile inflammation are the elements of damaged tissues, collectively referred to as damage-associated molecular patterns that activate local microglia through pattern recognition receptors, including toll-like receptors.5 The local immune response is amplified, subsequently leading to a massive invasion of systemic immune cells.35 In our study, the results of immune cell deconvolution estimation showed that the ratio of microglia gradually increased after stroke, while the ratio of monocytes decreased. There are two possibilities for this change. One is intrinsic monocytes are transformed into microglia and the other is infiltration of peripheral macrophages to the damaged brain tissue. In either case, this result indicates that microglia play a key role in the inflammatory response. Following ischemic stroke, microglia are activated within 4 h,36 leading to the production of cytokines and chemokines and leukocyte infiltration. The activated microglia are divided into M1 or M2 activation phenotypes; M1 releases cytotoxic substances, eliciting inflammation and contributing to cell death, while M2 clears cellular debris through phagocytosis and the release of trophic factors.37 M1 activation has been mostly reported in the early course of the acute proinflammatory response and possesses antigen-presenting capacity.38 In addition, recent research has shown that Neat1 knockdown could ameliorate LPS-Induced inflammatory responses by promoting M2 polarization in a mouse macrophage cell line.39 This is consistent with our ELISA test; the anti-inflammatory factors IL10 and IL4 increased after Neat1 knockdown. Although we did not perform further experiments to prove whether the specific type of microglia inhibited by ASO-Neat1 was M1 or M2, according to the level of the proinflammatory factors detected by ELISA, it can be inferred that ASO-Neat1 is likely to inhibit the activation of M1 microglia and exert anti-inflammatory effects. A very recent study reported Neat_1 is an innate immunity mediator in that translocation from nuclei to the cytoplasm occurs with inflammatory stimuli and it promotes the activation of NLRP3, NLRC4, and AIM2 inflammasomes.40 Taken together, due to inflammation being inhibited, brain tissue damage is alleviated, indicating that suppressing the inflammatory response in the acute phase of ischemic stroke is particularly important for saving neurons and decreasing disability and mortality.
A previous study showed that, with activation of microglia through Janus kinase JAK1 signaling, interferon γ activates the STAT1 factor and increases the production of proinflammatory cytokines, such as TNFα, IL-23, IL-1β, IL-12, chemotactic factors, reactive oxygen species, and NO.41 It has been demonstrated that microglia polarization to M1 also involves NFκB activation.42 Our KEGG signaling pathway analysis results showed that JAK-STAT and NFκB pathway activation were consistent with these findings.
Nevertheless, this study had limitations. First, the deconvolution analysis of the immune cell proportion could have introduced systematic bias. Future studies with a higher resolution, such as single-cell RNA sequencing (scRNA-seq), should be performed.43,44 Second, although the upstream of lncRNA is regulated by methylation, histone modification, and gene copy number variation, there is no database for the upstream mechanism leading to differential expression of lncRNA. It is difficult to predict which molecules upstream of Neat1 are regulated. Third, we lacked the transcriptome data of brain tissue from human ischemic stroke, so it is impossible to know whether Neat1 has the same differential expression in ischemic stroke patients and whether it has the same biological function as rodents. Fourth, studies of lncRNA loss-of-function in vivo require more knockdown efficiency than mRNAs, due to their lower abundance. The new approach, such as CRISPR-Cas9 lncRNA knockout, may be more specific and may have fewer side effects.31,45
Conclusions
Our study combined bioinformatics analyses of genome-wide RNA-seq datasets and revealed that Neat1 is up-regulated in ischemic stroke and promotes activation of microglia in vivo, and knockdown of Neat1 prevents cerebral ischemic damage caused by acute neuroinflammation. However, although using ASO to knock down Neat1 had an apparent therapeutic effect, as other molecules that may interact with Neat1 and further mechanism studies are still required.
Data Sharing Statement
The data that support the findings of this study are openly available in GEO at https://www.ncbi.nlm.nih.gov/gds (GEO accession: GSE112348).
Acknowledgments
We thank Dr. Jianming Zeng (University of Macau) and all the Bioinformatics team members, biotrainee, for generously sharing their experience of RNA-seq analysis. We also thank Professor Yu Guangchuang for his help in using ‘clusterProfiler’ R package.
Funding
This work was funded by the Science and Technology Project Foundation of Guangdong province (Grant number: 2016A020215098), the Key Project of Clinical Research of Southern Medical University (Grant number: LC2016ZD024), the National Key Research Development Program (Grant numbers: 2016YFC1300804, 2016YFC1300800), and the Guangdong Provincial Clinical Medical Centre for Neurosurgery (Grant number: 2013B020400005).
Disclosure
The authors have no competing interests to declare.
References
1. Moskowitz MA, Lo EH, Iadecola C. The science of stroke: mechanisms in search of treatments. Neuron. 2010;67(2):181–198. doi:10.1016/j.neuron.2010.07.002
2. Kang R, Gamdzyk M, Lenahan C, Tang J, Tan S, Zhang JH. The dual role of microglia in blood-brain barrier dysfunction after stroke. Curr Neuropharmacol. 2020;18(12):1237–1249. doi:10.2174/1570159X18666200529150907
3. Zhang L, Wang H. Long non-coding RNA in CNS injuries: a new target for therapeutic intervention. Mol Ther Nucleic Acids. 2019;17:754–766. doi:10.1016/j.omtn.2019.07.013
4. Jin R, Yang G, Li G. Inflammatory mechanisms in ischemic stroke: role of inflammatory cells. J Leukoc Biol. 2010;87(5):779–789. doi:10.1189/jlb.1109766
5. Gülke E, Gelderblom M, Magnus T. Danger signals in stroke and their role on microglia activation after ischemia. Ther Adv Neurol Disord. 2018;11:1756286418774254. doi:10.1177/1756286418774254
6. Perego C, Fumagalli S, De Simoni M-G. Temporal pattern of expression and colocalization of microglia/macrophage phenotype markers following brain ischemic injury in mice. J Neuroinflammation. 2011;8(1):174. doi:10.1186/1742-2094-8-174
7. Roberts TC, Morris KV, Weinberg MS. Perspectives on the mechanism of transcriptional regulation by long non-coding RNAs. Epigenetics. 2014;9(1):13–20. doi:10.4161/epi.26700
8. Bai Y, Nie S, Jiang G, et al. Regulation of CARD8 expression by ANRIL and association of CARD8 single nucleotide polymorphism rs2043211 (p.C10X) with ischemic stroke. Stroke. 2014;45(2):383–388. doi:10.1161/STROKEAHA.113.003393
9. Zhang X, Tang X, Liu K, Hamblin MH, Yin K-J. Long noncoding RNA malat1 regulates cerebrovascular pathologies in ischemic stroke. J Neurosci. 2017;37(7):1797–1806. doi:10.1523/JNEUROSCI.3389-16.2017
10. Liu J, Li Q, Zhang K, et al. Downregulation of the long non-coding RNA Meg3 promotes angiogenesis after ischemic brain injury by activating notch signaling. Mol Neurobiol. 2017;54(10):8179–8190. doi:10.1007/s12035-016-0270-z
11. Zhang X, Zhu X-L, Ji B-Y, et al. LncRNA-1810034E14Rik reduces microglia activation in experimental ischemic stroke. J Neuroinflammation. 2019;16(1):75. doi:10.1186/s12974-019-1464-x
12. Sasaki YTF, Ideue T, Sano M, Mituyama T, Hirose T. MENepsilon/beta noncoding RNAs are essential for structural integrity of nuclear paraspeckles. Proc Natl Acad Sci U S A. 2009;106(8):2525–2530. doi:10.1073/pnas.0807899106
13. Yamazaki T, Souquere S, Chujo T, et al. Functional domains of NEAT1 architectural lncRNA induce paraspeckle assembly through phase separation. Mol Cell. 2018;70(6):1038–1053.e7. doi:10.1016/j.molcel.2018.05.019
14. Sunwoo H, Dinger ME, Wilusz JE, Amaral PP, Mattick JS, Spector DL. MEN epsilon/beta nuclear-retained non-coding RNAs are up-regulated upon muscle differentiation and are essential components of paraspeckles. Genome Res. 2009;19(3):347–359. doi:10.1101/gr.087775.108
15. Chen S, Zhou Y, Chen Y, Gu J. Fastp: an ultra-fast all-in-one FASTQ preprocessor. Bioinformatics. 2018;34(17):i884–i890. doi:10.1093/bioinformatics/bty560
16. Kim D, Paggi JM, Park C, Bennett C, Salzberg SL. Graph-based genome alignment and genotyping with HISAT2 and HISAT-genotype. Nat Biotechnol. 2019;37(8):907–915. doi:10.1038/s41587-019-0201-4
17. Liao Y, Smyth GK, Shi W. Featurecounts: an efficient general purpose program for assigning sequence reads to genomic features. Bioinformatics. 2014;30(7):923–930. doi:10.1093/bioinformatics/btt656
18. Love MI, Huber W, Anders S. Moderated estimation of fold change and dispersion for RNA-seq data with DESeq2. Genome Biol. 2014;15(12):550. doi:10.1186/s13059-014-0550-8
19. Yu G, Wang L-G, Han Y, He Q-Y. clusterProfiler: an R package for comparing biological themes among gene clusters. OMICS. 2012;16(5):284–287. doi:10.1089/omi.2011.0118
20. Smoot ME, Ono K, Ruscheinski J, Wang P-L, Ideker T. Cytoscape 2.8: new features for data integration and network visualization. Bioinformatics. 2011;27(3):431–432. doi:10.1093/bioinformatics/btq675
21. Bindea G, Mlecnik B, Hackl H, et al. ClueGO: a Cytoscape plug-in to decipher functionally grouped gene ontology and pathway annotation networks. Bioinformatics. 2009;25(8):1091–1093. doi:10.1093/bioinformatics/btp101
22. Chen Z, Quan L, Huang A, et al. seq-ImmuCC: cell-centric view of tissue transcriptome measuring cellular compositions of immune microenvironment from mouse RNA-seq data. Front Immunol. 2018;9:1286. doi:10.3389/fimmu.2018.01286
23. National Research Council (US) Committee for the Update of the Guide for the Care and Use of Laboratory Animals. Guide for the Care and Use of Laboratory Animals.
24. Engel O, Kolodziej S, Dirnagl U, Prinz V. Modeling stroke in mice - middle cerebral artery occlusion with the filament model. J Vis Exp. 2011;(47). doi:10.3791/2423
25. Johnson PD, Besselsen DG. Practical aspects of experimental design in animal research. ILAR J. 2002;43(4):202–206. doi:10.1093/ilar.43.4.202
26. Schaar KL, Brenneman MM, Savitz SI. Functional assessments in the rodent stroke model. Exp Transl Stroke Med. 2010;2(1):13. doi:10.1186/2040-7378-2-13
27. Michael B, Janine G, Anne-Carina S, et al. Validity and reliability of neurological scores in mice exposed to middle cerebral artery occlusion. Stroke. 2019;50(10):2875–2882. doi:10.1161/STROKEAHA.119.026652
28. Jayaraj RL, Azimullah S, Beiram R, Jalal FY, Rosenberg GA. Neuroinflammation: friend and foe for ischemic stroke. J Neuroinflammation. 2019;16(1):142. doi:10.1186/s12974-019-1516-2
29. Lennox KA, Behlke MA. Cellular localization of long non-coding RNAs affects silencing by RNAi more than by antisense oligonucleotides. Nucleic Acids Res. 2016;44(2):863–877. doi:10.1093/nar/gkv1206
30. Mercer TR, Dinger ME, Mattick JS. Long non-coding RNAs: insights into functions. Nat Rev Genet. 2009;10(3):155–159. doi:10.1038/nrg2521
31. Bao M-H, Szeto V, Yang BB, Zhu S, Sun H-S, Feng Z-P. Long non-coding RNAs in ischemic stroke. Cell Death Dis. 2018;9(3). doi:10.1038/s41419-018-0282-x
32. Ni X, Su Q, Xia W, et al. Knockdown lncRNA NEAT1 regulates the activation of microglia and reduces AKT signaling and neuronal apoptosis after cerebral ischemic reperfusion. Sci Rep. 2020;10(1):19658. doi:10.1038/s41598-020-71411-1
33. Li P, Duan S, Fu A. Long noncoding RNA NEAT1 correlates with higher disease risk, worse disease condition, decreased miR-124 and miR-125a and predicts poor recurrence-free survival of acute ischemic stroke. J Clin Lab Anal. 2020;34(2):e23056. doi:10.1002/jcla.23056
34. Akira S, Uematsu S, Takeuchi O. Pathogen recognition and innate immunity. Cell. 2006;124(4):783–801. doi:10.1016/j.cell.2006.02.015
35. Iadecola C, Anrather J. The immunology of stroke: from mechanisms to translation. Nat Med. 2011;17(7):796–808. doi:10.1038/nm.2399
36. Taylor RA, Sansing LH. Microglial responses after ischemic stroke and intracerebral hemorrhage. Clin Dev Immunol. 2013;2013:1–10. doi:10.1155/2013/746068
37. Mosser DM, Edwards JP. Exploring the full spectrum of macrophage activation. Nat Rev Immunol. 2008;8(12):958–969. doi:10.1038/nri2448
38. Hu X, Li P, Guo Y, et al. Microglia/macrophage polarization dynamics reveal novel mechanism of injury expansion after focal cerebral ischemia. Stroke. 2012;43(11):3063–3070. doi:10.1161/STROKEAHA.112.659656
39. Wang W, Guo Z-H. Downregulation of lncRNA NEAT1 ameliorates LPS-induced inflammatory responses by promoting macrophage M2 polarization via miR-125a-5p/TRAF6/TAK1 axis. Inflammation. 2020;43(4):1548–1560. doi:10.1007/s10753-020-01231-y
40. Zhang P, Cao L, Zhou R, Yang X, Wu M. The lncRNA Neat1 promotes activation of inflammasomes in macrophages. Nat Commun. 2019;10. doi:10.1038/s41467-019-09482-6
41. Zhao S, Ma L, Chu Z, Xu H, Wu W, Liu F. Regulation of microglial activation in stroke. Acta Pharmacol Sin. 2017;38(4):445–458. doi:10.1038/aps.2016.162
42. Gordon S, Taylor PR. Monocyte and macrophage heterogeneity. Nat Rev Immunol. 2005;5(12):953–964. doi:10.1038/nri1733
43. Giladi A, Amit I. Single-cell genomics: a stepping stone for future immunology discoveries. Cell. 2018;172(1–2):14–21. doi:10.1016/j.cell.2017.11.011
44. Papalexi E, Satija R. Single-cell RNA sequencing to explore immune cell heterogeneity. Nat Rev Immunol. 2018;18(1):35–45. doi:10.1038/nri.2017.76
45. Doetschman T, Georgieva T. Gene editing with CRISPR/Cas9 RNA-directed nuclease. Circ Res. 2017;120(5):876–894. doi:10.1161/CIRCRESAHA.116.309727
 © 2021 The Author(s). This work is published and licensed by Dove Medical Press Limited. The
full terms of this license are available at https://www.dovepress.com/terms
and incorporate the Creative Commons Attribution
- Non Commercial (unported, 3.0) License.
By accessing the work you hereby accept the Terms. Non-commercial uses of the work are permitted
without any further permission from Dove Medical Press Limited, provided the work is properly
attributed. For permission for commercial use of this work, please see paragraphs 4.2 and 5 of our Terms.
© 2021 The Author(s). This work is published and licensed by Dove Medical Press Limited. The
full terms of this license are available at https://www.dovepress.com/terms
and incorporate the Creative Commons Attribution
- Non Commercial (unported, 3.0) License.
By accessing the work you hereby accept the Terms. Non-commercial uses of the work are permitted
without any further permission from Dove Medical Press Limited, provided the work is properly
attributed. For permission for commercial use of this work, please see paragraphs 4.2 and 5 of our Terms.