")
Back to Journals » Clinical Epidemiology » Volume 16
Trajectories of Body Mass Index and Risk for Diabetes Complications and All-Cause Mortality in Finnish Type 2 Diabetes Patients
Authors Wang Z , Lavikainen P , Wikström K, Laatikainen T
Received 30 November 2023
Accepted for publication 5 March 2024
Published 29 March 2024 Volume 2024:16 Pages 203—212
DOI https://doi.org/10.2147/CLEP.S450455
Checked for plagiarism Yes
Review by Single anonymous peer review
Peer reviewer comments 3
Editor who approved publication: Professor Vera Ehrenstein
Zhiting Wang,1 Piia Lavikainen,2 Katja Wikström,1,3 Tiina Laatikainen1,3,4
1Institute of Public Health and Clinical Nutrition, University of Eastern Finland, Kuopio, Finland; 2School of Pharmacy, University of Eastern Finland, Kuopio, Finland; 3Department of Public Health and Welfare, Finnish Institute for Health and Welfare, Helsinki, Finland; 4Joint Municipal Authority for North Karelia Social and Health Services, Joensuu, Finland
Correspondence: Zhiting Wang, Institute of Public Health and Clinical Nutrition, University of Eastern Finland, PO Box 1627, Kuopio, 70211, Finland, Tel +358 469589963, Email [email protected]
Objective: We aimed to assess how longitudinal body mass index (BMI) trajectories are associated with diabetes complications and all-cause mortality in Finnish patients with type 2 diabetes (T2D).
Methods: In this cohort study, electronic health records from public primary and specialized healthcare services in all 13 municipalities of North Karelia, Finland, were utilized. This study included a total of 889 adults with newly diagnosed T2D in 2011 or 2012 (mean age at baseline 62.0 years). Individual BMI trajectories from the T2D diagnosis until 2014 were estimated and grouped by growth mixture modeling (GMM). Hazard ratios (HRs) with 95% confidence intervals (CIs) for microvascular complications, macrovascular complications, any diabetes complications, and all-cause mortality from 2015 to 2022 across BMI trajectory groups were estimated using Cox regression models.
Results: Three distinct BMI trajectory groups were identified using GMM and labeled as follows: “stable” (n = 774, 87.1%), “decreasing” (n = 87, 9.8%), and “increasing” (n = 28, 3.1%). During a median follow-up of 8 years, there were 119 (13.3%) patients with microvascular complications, 187 (21.0%) with macrovascular complications, 258 (29.0%) with any diabetes complications, and 180 (20.2%) deaths. Compared with the “stable” BMI, the “increasing” BMI was associated with an increased risk of microvascular complications (HR = 2.88, 95% CI: 1.32 to 6.28), macrovascular complications (HR = 2.52, 95% CI: 1.17 to 5.43), and any diabetes complications (HR = 2.21, 95% CI: 1.16 to 4.20). The “decreasing” BMI was associated with an increased risk of all-cause mortality (HR = 1.90, 95% CI: 1.14 to 3.15), compared to the “stable” BMI.
Conclusion: Our findings underscore the significance of continuous BMI monitoring and weight management in patients with T2D. Tailored treatments are crucial for efficiently preventing weight gain and reducing the risk of diabetes complications.
Keywords: body mass index trajectory, type 2 diabetes, diabetes complications, all-cause mortality
Introduction
Most type 2 diabetes (T2D) patients live with obesity (body mass index, BMI ≥30 kg/m2),1 and weight loss is one of the therapeutic objectives in T2D management.2,3 Clinical trials have demonstrated that modest weight loss, ie, 5‒10%, in T2D patients with high BMI improves the risk factors of diabetes complications, such as hyperglycemia, hyperlipidemia, and hypertension.4,5
Complications arising from T2D can be categorized into microvascular complications, including retinopathy, neuropathy, and nephropathy, as well as macrovascular complications, such as cardiovascular disease, cerebrovascular disease, and peripheral vascular disease.6,7 The association of BMI with microvascular complications and macrovascular complications in T2D patients has been investigated in observational studies. Some studies have reported a positive association,8,9 while others have found either an inverse10,11 or no association.12,13 Furthermore, a meta-analysis including 16 cohort studies has reported a U-shaped relationship between the baseline BMI and total mortality among T2D patients, with the lowest risk observed at a BMI of 28‒30 kg/m2.14 When these associations were estimated using baseline BMI alone, it neglects to take account of the fact that patients with T2D may experience BMI fluctuation over time.15 Considering longitudinal BMI measurements, increasing evidence has demonstrated that high body weight variability is a risk factor for diabetes complications and all-cause mortality in American,16,17 Korean,18 and Swedish patients with T2D.19
To emphasize the need for intensive support for weight management in diabetes care and inform the targeted treatment lines for T2D patients, the effects of longitudinal patterns of BMI change on health consequences in T2D patients should be investigated. To date, such investigations are still limited. To our knowledge, only one recent longitudinal study has examined the impact of BMI trajectories on mortality from any cause in Chinese T2D patients.20 To gain a deeper understanding of the impact of BMI changes post-diagnosis on clinical outcomes, we investigated BMI trajectories in Finnish patients with T2D. Our study assessed the associations between BMI trajectories and the occurrence of microvascular and macrovascular complications, along with all-cause mortality.
Methods
Study Setting
We used regional electronic health records (EHRs) data of North Karelia, Finland, from 2011 to 2022, to conduct a cohort study. A common electronic patient information system called Mediatri has been applied in all 13 municipalities of the North Karelia region since the beginning of 2011. It covers demographic, diagnosis and laboratory data from both public primary and specialized healthcare services.21,22 We collected data on patients’ birth year, sex, measurements of BMI, fasting plasma glucose (FPG), glycated hemoglobin (HbA1c) and low-density lipoprotein (LDL), diagnosis codes and dates for T2D and complications, as well as the date of death.
Study Design and Study Participants
In this study, 889 adult patients who were newly diagnosed with T2D (ICD-10 code E11) in 2011 or 2012 and free of any diabetes complications were included. BMI was obtained from the EHRs and calculated as weight divided by the square of height (kg/m2). Individual BMI trajectories were estimated from the date of T2D diagnosis to the end of 2014, with a maximum duration of 4 years. The latest BMI measurement of ≤6 months prior to the T2D diagnosis was defined as the baseline value, and subsequent BMI measurements since the T2D diagnosis until the end of 2014 were defined as the follow-up values.
Ascertainment of Baseline Characteristics
The baseline age was determined at the diagnosis year of T2D. The baseline values of FPG and HbA1c were determined as the closest measurement of the T2D diagnosis date, within a ± 3-month range. Similarly, for LDL, the baseline value was defined as the closest measurement within ±1 month of the T2D diagnosis. FPG, HbA1c and LDL were examined by applying the enzymatic hexokinase method, the turbidimetric inhibition immunoassay method and the photometric direct enzymatic method, respectively.23,24 All FPG, HbA1c and LDL samples were analyzed in the same regional laboratory – the Eastern Finland Laboratory (ISLAB, https://www.islab.fi) which is an accredited laboratory and participates in external quality surveys. All values were standardized to International Federation of Clinical Chemistry (IFCC) units.
Ascertainment of Diabetes Complications, Mortality, and Follow-Up
Diabetes complications were identified from the EHRs using ICD-10 codes recorded to any appointment in primary or specialized care. The specific codes25,26 are listed in Supplementary Table 1. Incident microvascular complications, macrovascular complications, any diabetes complications, and death from any cause were assessed separately. Follow-up time began from 1 January 2015 until the first occurrence of the specific event, moving outside the study area, or 31 December 2022, whichever occurred first.
Statistical Analyses
Growth mixture modeling (GMM) and latent class growth analysis (LCGA) were used to identify distinct BMI trajectory groups by grouping patients with similar average BMI growth curves into latent classes, capturing variability across latent classes.27 GMM is more flexible, allowing within-class variability through random effects,28 while LCGA assumes no within-class variability.29 Random effects capture individual differences within the same class by allowing variation in the intercepts and slopes of the growth curves.30,31 We applied linear, quadratic, and cubic models with random effects for GMM and without random effects for LCGA, ranging from single to five-class models, respectively. GMM and LCGA analyses were performed in R using the “lcmm” package, under the assumption of missing data at random.32,33 Missing data were not imputed but, instead, the model was estimated based on all available data. In the analysis, a function of time was set from the T2D diagnosis until the last BMI measurement. The optimal number and shape of trajectories were determined based on the following six indices: (1) clinical interpretation, (2) low Bayesian information criteria, (3) average posterior membership in each class >0.8, (4) the proportion of individuals in each class >3.0%, (5) significant Lo-Mendell-Rubin likelihood ratio test with p-value <0.05, (6) entropy index >0.7.34–36
The baseline characteristics of patients are summarized using mean with standard deviation (SD) for continuous variables, and count with proportion (%) for categorical variables. Differences in baseline characteristics between the included patients and the patients excluded due to no BMI measurements for trajectory analysis, as well as between BMI trajectories were evaluated using standardized mean differences, with values ≥10% indicating meaningful differences between the groups.37
The BMI trajectory groups identified using latent growth modeling approaches were utilized to examine their associations with diabetes complications and all-cause mortality risk from 2015 to 2022 (Figure 1). The incidence rates of microvascular complications, macrovascular complications, any diabetes complications, and all-cause mortality per 1000 person-years were calculated. Unadjusted and age- and sex-adjusted Cox regression models were employed to analyze hazard ratios (HRs) with 95% confidence intervals (CIs) for complications and all-cause mortality based on BMI trajectory groups. The validity of the proportional hazard assumption for all age- and sex-adjusted models was tested using the Schoenfeld residuals, and no violations were observed. In the sensitivity analyses, T2D patients with only one BMI measurement were excluded to avoid selection bias. All statistical analyses were performed on R version 4.2.2 (R Foundation for Statistical Computing, Vienna, Austria).
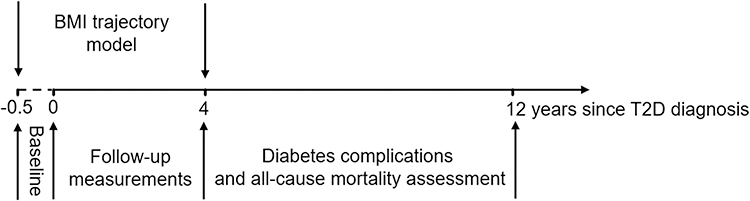 |
Figure 1 The study design for investigating the associations between BMI trajectories and poor health outcomes in 889 T2D patients. Abbreviations: BMI, body mass index; T2D, type 2 diabetes. |
Results
A total of 1643 T2D patients aged 18 years and over were identified. Patients without any BMI measurements (n = 408), those who died (n = 118), or those who had known or developed any diabetes complications during the study period of BMI trajectories (n = 228) were excluded. Finally, 889 T2D patients with 3587 BMI measurements were included in the analyses. In the sensitivity analyses, 711 patients with 3409 BMI measurements were included.
BMI Trajectories
The linear GMM with random effect for the intercept identified three BMI trajectories that best fit the data based on the fit indices and clinical interpretability (Supplementary Table 2). A total of 889 T2D patients with 3587 BMI measurements were assigned to the corresponding trajectory groups. The number of T2D patients and BMI measurements at the baseline and during the follow-up are summarized in Supplementary Table 3. The identified BMI trajectory groups were labeled: “stable” (n = 774, 87.1%), “decreasing” (n = 87, 9.8%), and “increasing” (n = 28, 3.1%) (Figure 2).
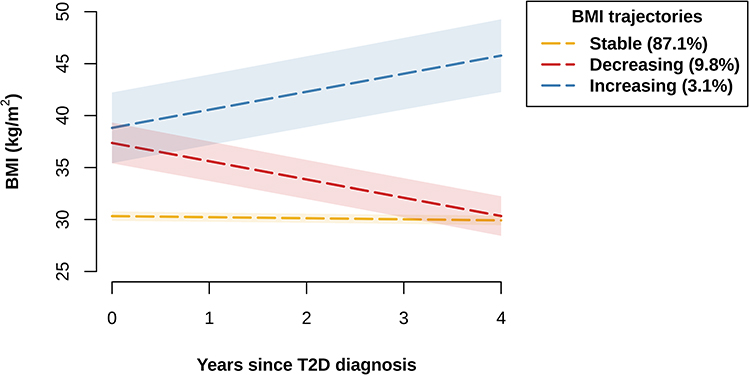 |
Figure 2 BMI trajectories of 889 T2D patients. Dashed line represents average BMI, while shaded area indicates the 95% confidence interval for the mean. Abbreviations: BMI, body mass index; T2D, type 2 diabetes. |
Baseline Characteristics
Baseline characteristics of T2D patients are presented in Table 1. Of 889 T2D patients with a mean (SD) baseline age of 62.0 (12.2) years, 430 (48.4%) were female. Altogether 374 (42.1%) patients had the baseline BMI measurement with a mean (SD) BMI of 31.8 (6.5). The excluded ones without any BMI measurements during the study period of BMI trajectories were older than those included in this study, but no difference was found in FPG, HbA1c and LDL levels at baseline (Supplementary Table 4). Compared with the patients in the “stable” BMI group, those either in the “increasing” or “decreasing” BMI group had higher baseline BMI and were younger, but had lower LDL level; those in the “decreasing” BMI group had higher FPG and HbA1c levels at baseline. Additionally, the patients in the “increasing” BMI group had higher BMI and were younger, but had lower FPG and HbA1c levels at baseline than those in the “decreasing” BMI group (Supplementary Table 5).
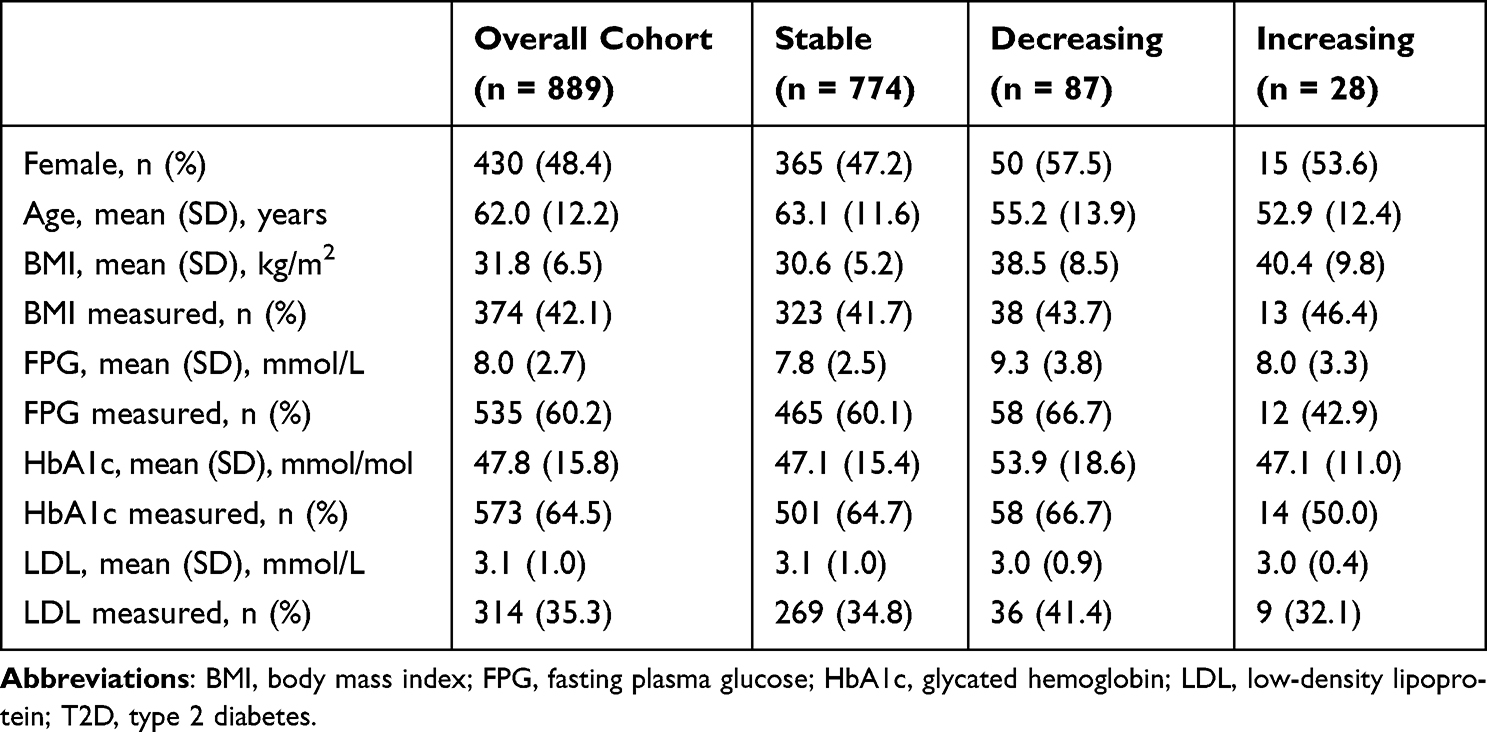 |
Table 1 Baseline Characteristics of 889 T2D Patients in the Overall Cohort and by BMI Trajectory Groups |
Diabetes Complications and Mortality
A total of 258 patients (mean age of 73.8 years) developed diabetes complications (119 microvascular complications and 187 macrovascular complications; Supplementary Tables 6, 7) and 180 patients (mean age of 78.5 years) died during a median follow-up of 8 years. In the “stable”, “decreasing”, and “increasing” BMI groups, 12.9%, 13.8%, and 25.0% developed microvascular complications, 21.3%, 17.2%, and 25.0% developed macrovascular complications, and 28.9%, 27.6%, and 35.7% experienced any diabetes complications, respectively, over a median follow-up period of 8 years (Supplementary Table 8). From those who died (n = 180) during the follow-up period, 30 (16.7%) had developed microvascular complications, 68 (37.8%) macrovascular complications, and 79 (43.9%) any diabetes complications. So, 101 (56.1%) did not have any complications before death (Supplementary Table 9). The incidence rates in the whole cohort were 20.1, 32.7, 46.7, and 28.5 per 1000 person-years for microvascular complications, macrovascular complications, any diabetes complications, and all-cause mortality, respectively. The incidence rates across BMI trajectory groups are presented in Supplementary Table 10.
In comparison to the patients with “stable” BMI, those with “increasing” BMI had an increased risk of microvascular complications (HR = 2.88, 95% CI: 1.32 to 6.28), of macrovascular complications (HR = 2.52, 95% CI: 1.17 to 5.43), and of any diabetes complications (HR = 2.21, 95% CI: 1.16 to 4.20) with adjustment for age and sex. However, the “decreasing” BMI group had similar risk of microvascular complications, macrovascular complications, or any diabetes complications than the “stable” BMI group, when age and sex were adjusted (Table 2). Compared to the patients in the “stable” group, those in the “decreasing” group had a higher risk of all-cause mortality (HR = 1.90, 95% CI: 1.14 to 3.15) after adjusting for age and sex. However, there was no difference in the risk of mortality between the “increasing” group and the “stable” group in the age- and sex-adjusted model (Table 2). The results from the sensitivity analyses are similar to the findings from the primary analyses (Supplementary Table 11).
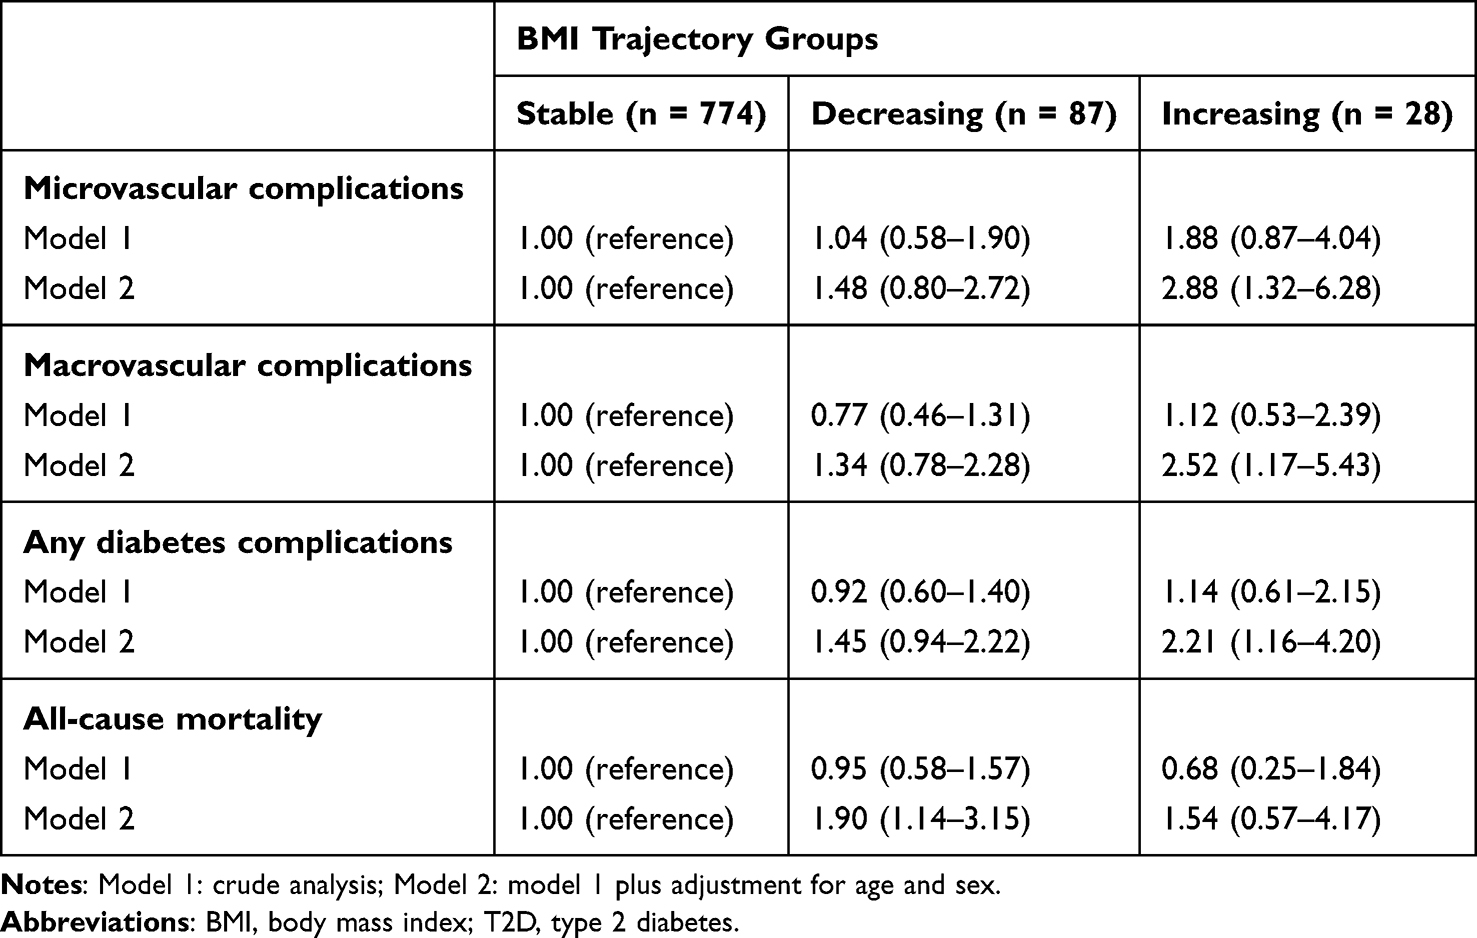 |
Table 2 Hazard Ratio with 95% Confidence Interval for Diabetes Complications and All-Cause Mortality According to BMI Trajectory Groups in 889 T2D Patients |
Discussion
Our study revealed three different longitudinal patterns of BMI development since T2D diagnosis and their associations with adverse health outcomes. We found that a continuous increase in BMI elevated the risk of both microvascular and macrovascular complications, whereas no association was found between a continuous reduction in BMI and the risk of microvascular or macrovascular complications. Furthermore, we observed that a continuous BMI decrease was associated with an increased risk of all-cause mortality, while no association existed between a continuous BMI increase and all-cause mortality.
BMI Trajectories and Diabetes Complications
In the findings of our three distinct BMI trajectories, the majority of the T2D patients were assigned to the “stable” BMI trajectory (87.1%), followed by 9.8% in the “decreasing” BMI trajectory and 3.1% in the “increasing” BMI trajectory. A limited number of studies have explored patterns of BMI growth in T2D patients. Two other studies which identified three20 or four BMI trajectories38 consistently found that most (82.1–91.2%) of the T2D patients were grouped into the trajectory with stable BMI, while the remaining T2D patients made up the trajectories with either increasing or decreasing BMI. These findings demonstrated that a notable proportion of T2D patients have challenges with weight control, which suggest that tracking developmental BMI trajectories since T2D diagnosis is crucial and helps emphasize efficient weight management in diabetes care.
We demonstrated that the patients with “increasing” BMI were at a higher risk of both microvascular and macrovascular complications than those with “stable” BMI. Several factors could explain such findings. First, inflammation, which is triggered by elevated body weight, contributes to the development of microvascular39 and macrovascular complications.40 Second, higher BMI is associated with poor control of glycemia,41–43 lipids44,45 and blood pressure46,47 in patients with T2D. These metabolic conditions are associated with increased risk of microvascular48–50 and macrovascular complications.24,51,52 However, we did not observe any difference in FPG, HbA1c or LDL levels between the “increasing” BMI group and the “stable” BMI group during 2015–2022 (data not shown). This indicates that the increased risk of microvascular and macrovascular complications in the “increasing” BMI group may not be solely explained by worse glycemic and lipid control in our study. Moreover, we did not have any data on blood pressure, and therefore we could not assess the difference in blood pressure between BMI trajectory groups during 2015–2022. Third, age contributes to the development of macrovascular complications since it plays a crucial role in the deterioration of cardiovascular functionality and is recognized as a risk factor for CVD in adults.53,54 The elevated risk of cardiovascular diseases in patients with T2D increases with age at diagnosis.55,56 In our study, the patients especially in the “increasing” BMI group were younger than those in the “stable” BMI group and the hazard ratios for both microvascular and macrovascular complications become clearly significant after adjusting for age in model 2.
Several studies have evaluated the association of weight change with microvascular57,58 and macrovascular complications in T2D patients.59–61 With respect to microvascular complications, a cohort study including 1083 T2D patients in Germany measured the relative annual BMI change between before and after diabetes diagnosis and evaluated its impact on microvascular complications during a median follow-up of 11.1 years.57 In contrast to our findings, the German study demonstrated that a reduction in BMI (>1% of BMI loss) was associated with a decreased risk of total microvascular complications (as a composite of kidney disease, neuropathy, and retinopathy) in comparison to the patients with a stable BMI (≤1% of BMI gain/loss), while no association existed between an increase in BMI (>1% of BMI gain) and total microvascular complications. Their results may be biased by the self-reported weight values after T2D diagnosis, as the self-reported weight data is observed to overestimate the association between high BMI and worse health outcomes.62 Instead, the patients’ weight and height in our study were measured during healthcare visits, which can ensure high accuracy and reliability in the analysis. In terms of macrovascular complications, a cohort study of 173,246 newly diagnosed T2D patients in Korea measured the difference in body weight over the course of 2 years after T2D diagnosis and its relationship to macrovascular complications risk during a median follow-up of 5.5 years.60 Consistent with our findings, the Korean study observed that the patients with weight gain (≥10%) were at a higher risk of developing stroke than those who maintained stable weight, while no association was found in the weight loss group (≥10%). Note that previous studies used only two BMI measurements to investigate the effect of weight change on diabetes complications. To accurately predict the risk of diabetes complications with weight management in T2D patients, it is recommended that subsequent investigations should incorporate longitudinal BMI measurements, as exemplified in our study.
BMI Trajectories and All-Cause Mortality
We observed that the patients with “decreasing” BMI had an increased risk of all-cause mortality compared to those with “stable” BMI. Comorbidities and smoking can contribute to weight decrease.63–65 Large unintentional weight loss is indicative of bone and muscle tissue loss and is related to increased mortality.66,67 In our study, adjusting for the status of cancer and depression (occurred before assessing the incident all-cause mortality) did not change our results (data not shown), but BMI decrease may be caused by other comorbidities, smoking, or severity of diabetes. Furthermore, we found a null effect of “increasing” BMI on all-cause mortality in T2D patients. This may indicate the existence of the “obesity paradox”, where T2D patients with a higher BMI experience lower mortality rate than those with a normal BMI.68,69
Consistent with our findings, a meta-analysis including eight studies concluded that weight loss in overweight or obese patients with diabetes was associated with increased all-cause mortality, but no association was found in the weight gain group.70 However, a recent cohort study of 28,438 Chinese T2D patients, based on the early 5-year BMI trajectory from registration, showed that the patients with an increasing BMI development, ie, “early-increasing”, “late-sharp increasing”, were at a higher risk of all-cause mortality than those with a stable BMI development (“medium-stable”).20 Such inconsistent findings between the Chinese study and our study are probably due to the difference in mean baseline age of the patients with continuous increase in BMI (62.0 years vs 52.9 years). Generally, life expectancy declines with age.71 Taken together, as the effects observed so far are contradictory, further research is required to better understand the effect of longitudinal weight change on all-cause mortality in T2D patients.
Strengths and Limitations
The long study period of total follow-up of 12 years enabled us to model the BMI trajectories and their impact on later-onset diabetes complications and all-cause mortality. All patients diagnosed with T2D in 2011 or 2012 in the North Karelia region were included to help eliminate selection bias. Furthermore, as previously mentioned, values of weight and height were not self-reported, which ensured that there was negligible recall bias.
Some limitations of our study should be noted. First, the number of T2D patients ultimately encompassed in our study is relatively small, and further studies with larger sample size are suggested to verify our results. The small sample size might affect the precision of the estimates in the associations especially between the “increasing” BMI and complications but to some extent also in the associations between the “decreasing” BMI and complications. Second, as we rely on administrative register-based data, the measurements are not necessarily available at regular intervals and thus the repeated measurements of BMI for trajectory analysis are not complete. This may lead to inadequate characterization of within-subject variations in BMI development. This also impacts the accessibility of data on potential confounding factors, as lifestyle factors like smoking or alcohol use are often not well-documented in a structured format within EHRs. Third, we focused on T2D patients from a specific region in Finland, so, the estimated BMI trajectory groups and their associations to outcomes may not be applicable to other populations. Region-specific factors, including genetics, socioeconomic conditions, and environmental influences, could impact the generalizability of our findings.
Conclusion
Our findings emphasize the importance of continuous BMI monitoring and weight management in T2D patients, especially for early prevention of weight gain since T2D diagnosis. Our findings could inform personalized treatment to appropriately manage weight and reduce the risk of diabetes complications. Further research is warranted to explore the factors influencing both the BMI trajectories and their associations with treatment outcomes in patients with T2D.
Ethics Approval and Informed Consent
The Ethics Committee of the Northern Savonia Hospital District, responsible for reviewing all study protocols within its university hospital catchment area, approved the use of the data (diary number 81/2012). The study protocol also received approval from the register administrator, Siun sote – Joint Municipal Authority for North Karelia Social and Health Services, which provided the permission for the use of data. We used only pseudonymized register-based data, and individuals in the registers were not contacted. In accordance with Finnish legislation, written consent from the patients was not required.
Author Contributions
All authors made a significant contribution to the work reported, whether that is in the conception, study design, execution, acquisition of data, analysis and interpretation, or in all these areas; took part in drafting, revising or critically reviewing the article; gave final approval of the version to be published; have agreed on the journal to which the article has been submitted; and agree to be accountable for all aspects of the work.
Funding
This study was funded by the Strategic Research Council at the Academy of Finland, funding decision numbers 312703 and 336325. The funder was not involved in the study design, collection, analysis, and interpretation of the data, in writing the report, or the decision to submit the manuscript for publication.
Disclosure
The authors declare that they have no competing financial interests or personal relationships that could have appeared to influence the work reported in this paper.
References
1. Colosia AD, Palencia R, Khan S. Prevalence of hypertension and obesity in patients with type 2 diabetes mellitus in observational studies: a systematic literature review. Diabetes Metabol Syndr Obes. 2013;327–338. doi:10.2147/DMSO.S51325
2. Type 2 diabetes Current Care Guidelines. A working group set up by the Duodecim of the Finnish Medical Associations, the Finnish Association of Internal Medicine Physicians and the Medical Council of the Diabetes Association. Available from: www.kaypahoito.fi/hoi50056.
3. American Diabetes Association. 8. Obesity management for the treatment of type 2 diabetes: standards of medical care in diabetes—2021. Diabetes Care. 2021;44(Supplement_1):S100–S110.
4. Wing RR; Look AHEAD Research Group. Long-term effects of a lifestyle intervention on weight and cardiovascular risk factors in individuals with type 2 diabetes mellitus: four-year results of the Look AHEAD trial. Arch Inter Med. 2010;170(17):1566–1575. doi:10.1001/archinternmed.2010.334
5. Wing RR, Lang W, Wadden TA, et al. Benefits of modest weight loss in improving cardiovascular risk factors in overweight and obese individuals with type 2 diabetes. Diabetes Care. 2011;34(7):1481–1486. doi:10.2337/dc10-2415
6. Cade WT. Diabetes-related microvascular and macrovascular diseases in the physical therapy setting. Physical Ther. 2008;88(11):1322–1335. doi:10.2522/ptj.20080008
7. Harding JL, Pavkov ME, Magliano DJ, Shaw JE, Gregg EW. Global trends in diabetes complications: a review of current evidence. Diabetologia. 2019;62(1):3–16. doi:10.1007/s00125-018-4711-2
8. Eeg-Olofsson K, Cederholm J, Nilsson P, et al. Risk of cardiovascular disease and mortality in overweight and obese patients with type 2 diabetes: an observational study in 13,087 patients. Diabetologia. 2009;52(1):65–73. doi:10.1007/s00125-008-1190-x
9. Svensson M, Tyrberg M, Nyström L, et al. The risk for diabetic nephropathy is low in young adults in a 17‐year follow‐up from the Diabetes Incidence Study in Sweden (DISS). Older age and higher BMI at diabetes onset can be important risk factors. Diabetes Metab Res Rev. 2015;31(2):138–146. doi:10.1002/dmrr.2574
10. Bentata Y, Abouqal R. Paradoxical association between body mass index, renal progression, and cardiovascular disease in elderly adults with type 2 diabetes mellitus. J Am Geriatr Soc. 2014;62(10):2002–2004. doi:10.1111/jgs.13058
11. Li W, Katzmarzyk PT, Horswell R, et al. Body mass index and stroke risk among patients with type 2 diabetes mellitus. Stroke. 2015;46(1):164–169. doi:10.1161/STROKEAHA.114.006718
12. Klein R, Klein BE, Moss SE. Is obesity related to microvascular and macrovascular complications in diabetes?: the Wisconsin Epidemiologic Study of Diabetic Retinopathy. Arch Inter Med. 1997;157(6):650–656. doi:10.1001/archinte.1997.00440270094008
13. Mohsen A, Brown R, Hoefield R, et al. Body mass index has no effect on rate of progression of chronic kidney disease in subjects with type 2 diabetes mellitus. J Nephrol. 2012;25(3):384–393. doi:10.5301/jn.5000062
14. Kwon Y, Kim HJ, Park S, Park YG, Cho KH, Kaser S. Body mass index-related mortality in patients with type 2 diabetes and heterogeneity in obesity paradox studies: a dose-response meta-analysis. PLoS One. 2017;12(1):e0168247. doi:10.1371/journal.pone.0168247
15. Aucott LS, Philip S, Avenell A, Afolabi E, Sattar N, Wild S. Patterns of weight change after the diagnosis of type 2 diabetes in Scotland and their relationship with glycaemic control, mortality and cardiovascular outcomes: a retrospective cohort study. BMJ open. 2016;6(7):e010836. doi:10.1136/bmjopen-2015-010836
16. Yeboah P, Hsu F-C, Bertoni AG, Yeboah J. Body mass index, change in weight, body weight variability and outcomes in type 2 diabetes mellitus (from the ACCORD Trial). Am j Cardiol. 2019;123(4):576–581. doi:10.1016/j.amjcard.2018.11.016
17. Kaze AD, Santhanam P, Erqou S, Ahima RS, Bertoni AG, Echouffo-Tcheugui JB. Body weight variability and risk of cardiovascular outcomes and death in the context of weight loss intervention among patients with type 2 diabetes. JAMA Network Open. 2022;5(2):e220055–e220055. doi:10.1001/jamanetworkopen.2022.0055
18. Nam GE, Kim W, Han K, et al. Body weight variability and the risk of cardiovascular outcomes and mortality in patients with type 2 diabetes: a nationwide cohort study. Diabetes Care. 2020;43(9):2234–2241. doi:10.2337/dc19-2552
19. Ceriello A, Lucisano G, Prattichizzo F, et al. Variability in body weight and the risk of cardiovascular complications in type 2 diabetes: results from the Swedish National Diabetes Register. Cardiovasc Diabetol. 2021;20(1):1–10. doi:10.1186/s12933-021-01360-0
20. Yang Z, Shen P, Qu Y, et al. Baseline and longitudinal trajectories of body-mass index and all-cause mortality among patients with type 2 diabetes. Diabetes Metabol. 2023;49(3):101426. doi:10.1016/j.diabet.2023.101426
21. Lamidi M-L, Wikström K, Inglin L, Rautiainen P, Tirkkonen H, Laatikainen T. Trends in the process and outcome indicators of type 2 diabetes care: a cohort study from Eastern Finland, 2012–2017. BMC Family Practice. 2020;21(1):1–11. doi:10.1186/s12875-020-01324-5
22. Wikström K, Lamidi M-L, Rautiainen P, Tirkkonen H, Kivinen P, Laatikainen T. The effect of the integration of health services on health care usage among patients with type 2 diabetes in North Karelia, Finland. BMC Health Serv Res. 2021;21(1):1–9. doi:10.1186/s12913-021-06059-2
23. Inglin L, Lavikainen P, Jalkanen K, Laatikainen T. LDL-cholesterol trajectories and statin treatment in Finnish type 2 diabetes patients: a growth mixture model. Sci Rep. 2021;11(1):22603. doi:10.1038/s41598-021-02077-6
24. Lavikainen P, Aarnio E, Linna M, et al. Data-driven long-term glycaemic control trajectories and their associated health and economic outcomes in Finnish patients with incident type 2 diabetes. PLoS One. 2022;17(6):e0269245. doi:10.1371/journal.pone.0269245
25. Brämer GR. International statistical classification of diseases and related health problems. Tenth revision. World Health Statist Quarter. 1988;41(1):32–36.
26. Nordic Medico-Statistical Committee. NOMESCO classification of surgical procedures (NCSP), version 1.15. Nordic Medico-Statistical Committee (NOMESCO); 2011.
27. Jung T, Wickrama KA. An introduction to latent class growth analysis and growth mixture modeling. Soc Personal Psychol Compass. 2008;2(1):302–317. doi:10.1111/j.1751-9004.2007.00054.x
28. Berlin KS, Parra GR, Williams NA. An introduction to latent variable mixture modeling (part 2): longitudinal latent class growth analysis and growth mixture models. J Pediatric Psychol. 2014;39(2):188–203. doi:10.1093/jpepsy/jst085
29. Nagin DS. Analyzing developmental trajectories: a semiparametric, group-based approach. Psychological Methods. 1999;4(2):139. doi:10.1037/1082-989X.4.2.139
30. Muthén B, Shedden K. Finite mixture modeling with mixture outcomes using the EM algorithm. Biometrics. 1999;55(2):463–469. doi:10.1111/j.0006-341X.1999.00463.x
31. Reinecke J, Seddig D. Growth mixture models in longitudinal research. AStA Adv Statis Anal. 2011;95(4):415–434. doi:10.1007/s10182-011-0171-4
32. Collins LM, Schafer JL, Kam C-M. A comparison of inclusive and restrictive strategies in modern missing data procedures. Psychological Methods. 2001;6(4):330. doi:10.1037/1082-989X.6.4.330
33. Wardenaar K. Latent Class Growth Analysis and Growth Mixture Modeling using R: a tutorial for two R-packages and a comparison with Mplus; 2020.
34. Nagin DS, Odgers CL. Group-based trajectory modeling in clinical research. Ann Rev Clin Psychol. 2010;6(1):109–138. doi:10.1146/annurev.clinpsy.121208.131413
35. Tein J-Y, Coxe S, Cham H. Statistical power to detect the correct number of classes in latent profile analysis. Struct Equat Model. 2013;20(4):640–657. doi:10.1080/10705511.2013.824781
36. Nylund-Gibson K, Choi AY. Ten frequently asked questions about latent class analysis. Transl Issues Psychol Sci. 2018;4(4):440. doi:10.1037/tps0000176
37. Austin PC. An introduction to propensity score methods for reducing the effects of confounding in observational studies. Multivariate Behav Res. 2011;46(3):399–424. doi:10.1080/00273171.2011.568786
38. Jensen BW, Watson C, Geifman N, Baker JL, Badrick E, Renehan AG. Weight changes in type 2 diabetes and cancer risk: a latent class trajectory model study. Obesity Facts. 2022;15(2):150–159. doi:10.1159/000520200
39. Nguyen DV, Shaw LC, Grant MB. Inflammation in the pathogenesis of microvascular complications in diabetes. Front Endocrinol. 2012;3:170. doi:10.3389/fendo.2012.00170
40. Huang D, Refaat M, Mohammedi K, Jayyousi A, Al Suwaidi J, Abi Khalil C. Macrovascular complications in patients with diabetes and prediabetes. Biomed Res Int. 2017;2017:1–9. doi:10.1155/2017/7839101
41. Stone MA, Charpentier G, Doggen K, et al. Quality of care of people with type 2 diabetes in eight European countries: findings from the Guideline Adherence to Enhance Care (GUIDANCE) study. Diabetes Care. 2013;36(9):2628–2638. doi:10.2337/dc12-1759
42. Bae J, Lage M, Mo D, Nelson D, Hoogwerf B. Obesity and glycemic control in patients with diabetes mellitus: analysis of physician electronic health records in the US from 2009–2011. J diabet complicat. 2016;30(2):212–220. doi:10.1016/j.jdiacomp.2015.11.016
43. Boye KS, Lage MJ, Shinde S, Thieu V, Bae JP. Trends in HbA1c and body mass index among individuals with type 2 diabetes: evidence from a US database 2012–2019. Diabetes Therapy. 2021;12(7):2077–2087. doi:10.1007/s13300-021-01084-0
44. Bansal P, Upadhyay HP, Jha R. Correlation between body mass index and lipid profile in a diabetic population of central Nepal. J Coll Med Sci. 2018;14(4):184–188. doi:10.3126/jcmsn.v14i4.21997
45. Akinjinmi A, Amballi A, Abdulrahman AO, et al. Relationship between serum leptin, lipid metabolism, HbA1c, and renal function in individuals with type 2 diabetes mellitus and obesity and in individuals with type 2 diabetes mellitus without obesity. medRxiv. 2023. doi:10.1101/2023.02.20.23286131
46. Sonmez A, Yumuk V, Haymana C, et al. Impact of obesity on the metabolic control of type 2 diabetes: results of the Turkish nationwide survey of glycemic and other metabolic parameters of patients with diabetes mellitus (TEMD obesity study). Obesity Facts. 2019;12(2):167–178. doi:10.1159/000496624
47. Chaudhary GMD, Din ATU, Chaudhary FMD, et al. Association of obesity indicators with hypertension in type 2 diabetes mellitus patients. Cureus. 2019;11(7):1–5.
48. Klein R, Klein BE, Moss SE, Cruickshanks KJ. Relationship of hyperglycemia to the long-term incidence and progression of diabetic retinopathy. Arch Inter Med. 1994;154(19):2169–2178. doi:10.1001/archinte.1994.00420190068008
49. Rema M, Srivastava B, Anitha B, Deepa R, Mohan V. Association of serum lipids with diabetic retinopathy in urban South Indians—the Chennai urban rural epidemiology study (CURES) eye study—2. Diabetic Med. 2006;23(9):1029–1036. doi:10.1111/j.1464-5491.2006.01890.x
50. Hurst C, Thinkhamrop B, Tran HT. The association between hypertension comorbidity and microvascular complications in type 2 diabetes patients: a nationwide cross-sectional study in Thailand. Diabet Metabol J. 2015;39(5):395–404. doi:10.4093/dmj.2015.39.5.395
51. Turner R, Holman R, Matthews D, et al. Hypertension in Diabetes Study (HDS): II. Increased risk of cardiovascular complications in hypertensive type 2 diabetic patients. J Hypertens. 1993;11(3):103–113. doi:10.1097/00004872-199301000-00015
52. Howard BV, Robbins DC, Sievers ML, et al. LDL cholesterol as a strong predictor of coronary heart disease in diabetic individuals with insulin resistance and low LDL: the Strong Heart Study. Arteriosclerosis Thrombosis Vasc Biol. 2000;20(3):830–835. doi:10.1161/01.ATV.20.3.830
53. Curtis AB, Karki R, Hattoum A, Sharma UC. Arrhythmias in patients≥ 80 years of age: pathophysiology, management, and outcomes. J Am Coll Cardiol. 2018;71(18):2041–2057. doi:10.1016/j.jacc.2018.03.019
54. Rodgers JL, Jones J, Bolleddu SI, et al. Cardiovascular risks associated with gender and aging. J Cardiovasc Dev Dis. 2019;6(2):19. doi:10.3390/jcdd6020019
55. Zoungas S, Woodward M, Li Q, et al. Impact of age, age at diagnosis and duration of diabetes on the risk of macrovascular and microvascular complications and death in type 2 diabetes. Diabetologia. 2014;57(12):2465–2474. doi:10.1007/s00125-014-3369-7
56. Yao X, Zhang J, Zhang X, et al. Age at diagnosis, diabetes duration and the risk of cardiovascular disease in patients with diabetes mellitus: a cross-sectional study. Front Endocrinol. 2023;14:1131395. doi:10.3389/fendo.2023.1131395
57. Polemiti E, Baudry J, Kuxhaus O, et al. BMI and BMI change following incident type 2 diabetes and risk of microvascular and macrovascular complications: the EPIC-Potsdam study. Diabetologia. 2021;64(4):814–825. doi:10.1007/s00125-020-05362-7
58. Koh ES, Do Han K, Kim MK, et al. Weight change and microvascular outcomes in patients with new-onset diabetes: a nationwide cohort study. Korean J Inter Med. 2021;36(4):932. doi:10.3904/kjim.2020.121
59. Cho E, Manson JE, Stampfer MJ, et al. A prospective study of obesity and risk of coronary heart disease among diabetic women. Diabetes Care. 2002;25(7):1142–1148. doi:10.2337/diacare.25.7.1142
60. Kim MK, Han K, Koh ES, et al. Weight change and mortality and cardiovascular outcomes in patients with new-onset diabetes mellitus: a nationwide cohort study. Cardiovasc diabetol. 2019;18(1):1–12. doi:10.1186/s12933-019-0838-9
61. Strelitz J, Lawlor ER, Wu Y, et al. Association between weight change and incidence of cardiovascular disease events and mortality among adults with type 2 diabetes: a systematic review of observational studies and behavioural intervention trials. Diabetologia. 2022;65:1–16.
62. Chiolero A, Peytremann‐Bridevaux I, Paccaud F. Associations between obesity and health conditions may be overestimated if self-reported body mass index is used. Obesity Rev. 2007;8(4):373–374. doi:10.1111/j.1467-789X.2007.00375.x
63. Gazeivood JD, Mehr DR. Diagnosis and management of weight loss in the elderly. J Fam Pract. 1998;47(1):19–25.
64. Chiolero A, Faeh D, Paccaud F, Cornuz J. Consequences of smoking for body weight, body fat distribution, and insulin resistance. Am J Clin Nutr. 2008;87(4):801–809. doi:10.1093/ajcn/87.4.801
65. Chen S-P, Peng L-N, Lin M-H, Lai H-Y, Hwang S-J, Chen L-K. Evaluating probability of cancer among older people with unexplained, unintentional weight loss. Arch Gerontol Geriatr. 2010;50:S27–S29.
66. Ensrud KE, Ewing SK, Stone KL, et al. Intentional and unintentional weight loss increase bone loss and Hip fracture risk in older women. J Am Geriatr Soc. 2003;51(12):1740–1747. doi:10.1046/j.1532-5415.2003.51558.x
67. Wannamethee SG, Shaper AG, Lennon L. Reasons for intentional weight loss, unintentional weight loss, and mortality in older men. Arch Inter Med. 2005;165(9):1035–1040. doi:10.1001/archinte.165.9.1035
68. Carnethon MR, De Chavez PJD, Biggs ML, et al. Association of weight status with mortality in adults with incident diabetes. JAMA. 2012;308(6):581–590. doi:10.1001/jama.2012.9282
69. Costanzo P, Cleland JG, Pellicori P, et al. The obesity paradox in type 2 diabetes mellitus: relationship of body mass index to prognosis: a cohort study. Ann Internal Med. 2015;162(9):610–618. doi:10.7326/M14-1551
70. Chen Y, Yang X, Wang J, Li Y, Ying D, Yuan H. Weight loss increases all-cause mortality in overweight or obese patients with diabetes: a meta-analysis. Medicine. 2018;97(35):e12075.
71. Ebeling M, Rau R, Malmström H, Ahlbom A, Modig K. The rate by which mortality increase with age is the same for those who experienced chronic disease as for the general population. Age Ageing. 2021;50(5):1633–1640. doi:10.1093/ageing/afab085
 © 2024 The Author(s). This work is published and licensed by Dove Medical Press Limited. The full terms of this license are available at https://www.dovepress.com/terms.php and incorporate the Creative Commons Attribution - Non Commercial (unported, v3.0) License.
By accessing the work you hereby accept the Terms. Non-commercial uses of the work are permitted without any further permission from Dove Medical Press Limited, provided the work is properly attributed. For permission for commercial use of this work, please see paragraphs 4.2 and 5 of our Terms.
© 2024 The Author(s). This work is published and licensed by Dove Medical Press Limited. The full terms of this license are available at https://www.dovepress.com/terms.php and incorporate the Creative Commons Attribution - Non Commercial (unported, v3.0) License.
By accessing the work you hereby accept the Terms. Non-commercial uses of the work are permitted without any further permission from Dove Medical Press Limited, provided the work is properly attributed. For permission for commercial use of this work, please see paragraphs 4.2 and 5 of our Terms.