Back to Journals » OncoTargets and Therapy » Volume 14
TP53 Mutation Related and Directly Regulated lncRNA Prognosis Markers in Hepatocellular Carcinoma
Authors Zhang X ![]() , Fu Z, Zhang X
, Fu Z, Zhang X
Received 26 May 2021
Accepted for publication 26 July 2021
Published 10 August 2021 Volume 2021:14 Pages 4427—4437
DOI https://doi.org/10.2147/OTT.S321669
Checked for plagiarism Yes
Review by Single anonymous peer review
Peer reviewer comments 4
Editor who approved publication: Dr William C. Cho
Xiulei Zhang,1 Zhihao Fu,2 Xiao Zhang2
1Department of Microbiome Laboratory, Henan Provincial People’s Hospital, Zhengzhou University, Zhengzhou, 450003, People’s Republic of China; 2Department of Hepatobiliary Surgery, Henan Provincial People’s Hospital, Zhengzhou University, Zhengzhou, 450003, People’s Republic of China
Correspondence: Xiulei Zhang; Xiao Zhang Email [email protected]; [email protected]
Purpose: TP53 mutation is the most common genetic variation type in Hepatocellular carcinoma (HCC). We aim to illustrate the landscape of genomic alterations and TP53 mutation related and directly regulated lncRNA prognosis markers.
Materials and Methods: Utilizing the clinical and transcriptome data from The Cancer Genome Atlas (TCGA) website, we present the landscape of genomic alterations and RNA differential expression profiles. By analyzing the ENCODE TP53 ChIP-seq data, we get the TP53 chromatin binding profiles. By Kaplan–Meier (KM) survival analysis and ROC analysis, we identify lncRNA prognosis markers.
Results: TP53 ranks the highest mutation frequency gene and the maximum mutation type of TP53 is Missense Mutation (> 2.5× 10⁴). TP53 mutation showed poor clinical outcome among the pathological Stage II and Stage III HCC patients. By differential expression analysis of the TP53 wild type and mutation HCC, we find thousands of misregulated genes, including 699 differential expression lncRNAs (p < 0.05, |log2FC| ≥ 1). Functional enrichment analysis of the misregulated genes shows that TP53 mutation events mainly alter DNA replication, cell cycle and immune response signaling pathways. By estimation of tumor-infiltrating immune cells through CIBERSORT, we find that the TP53 mutation events are significantly correlated with the different proportions of nine immune cells. We then integratively analyze the differential expression lncRNAs in TP53 wild type and mutation groups and the TP53 ChIP-seq binding lncRNAs, and get 112 overlap lncRNAs. By Kaplan–Meier survival analysis and ROC analysis, we identify two lncRNAs (RP4-736L20.3 and SNRK-AS1) that show significant prognosis value. Using the collected HCC samples, we validate the misregulated expression of RP4-736L20.3 and SNRK-AS1.
Conclusion: The work presents the landscape of genomic variations and two TP53 mutation related and directly regulated lncRNA prognosis markers of HCC.
Keywords: hepatocellular carcinoma, genomic variations, TP53 mutation, lncRNA, prognosis marker, HCC
Introduction
Liver cancer is the seventh most common cancer and the third leading cause of cancer mortality worldwide.1 Hepatocellular carcinoma (HCC) is the globally predominant pathological type of liver cancer, with high morbidity and mortality.2,3 The main reasons of poor clinical outcome are recurrence and metastasis.4 There is a challenging to discover novel biomarkers for the progression of HCC and drugable targets. Next generation sequencing (NGS) data from HCC patients have provided us with an invaluable resource to better understand HCC by integrating data from different sources, thus helping to identify promising biomarkers and therapeutic targets. Identification of genomic variations will provide more susceptibility genes and some common clinical drugs for cancer are always mutation sensitive.5 Gefitinib, an epidermal growth factor receptor tyrosine kinase inhibitor (EGFR-TKI), is used for metastasis non-small lung cancer (NSLC) patients and always effective in patients with EGFR exon 19 deletion and exon 21 (L858R) mutation.6 TP53 is the most commonly mutated gene and almost 50% cancers include TP53 genetic variations. Normally, TP53 can act as transcription factor and directly regulate transcription in the cell cycle, cell death, and DNA repair signaling pathways.7 Previous studies demonstrate that mutant TP53 are associated with the loss of tumor suppressor function and the gain of new oncogenic activities.8 Mutated TP53 indicate poor clinical outcome in many cancers, including lung cancer, breast cancer and liver cancer.9 More and more studies have indicated that lncRNAs are involved in a broad range of biological processes and are associated with many diseases, including carcinogenesis.10,11 LncRNA is demonstrated important functions in the oncogenesis and drug resistance in various patterns such as epigenetic regulation, transcription regulation and post-transcription regulation.12,13 In Head and neck squamous cell carcinomas (HNSCCs), Mutant TP53, forming oncogenic complexes with NF-Y and E2F1, transcriptionally promotes the lncRNA MIR205HG expression. MIR205HG promotes Cyclin B, CDK1, and YAP expression by sponging miR-590-3p, leading to aggressive growth.8 However, few studies have documented the relationship between mutant TP53 and lncRNA in HCC. In our study, we integratively analyze the prognosis value of the TP53 mutation status and the TP53 directly regulated and mutation related lncRNAs, which will provide more promising lncRNA prognosis biomarkers for HCC.
Materials and Methods
Data Download and Sample Information
By the gdc-client tool, the mutation annotation data, transcriptome data and clinical data of HCC were obtained from TCGA website. Since all data used in this work were downloaded from TCGA website and the work complied with the terms of use of TCGA website, approval and informed consent from the Clinical Research Ethics Committee was not required. The TP53 Wild type and Mutation HCC patients’ clinical features were summarized in Table 1.
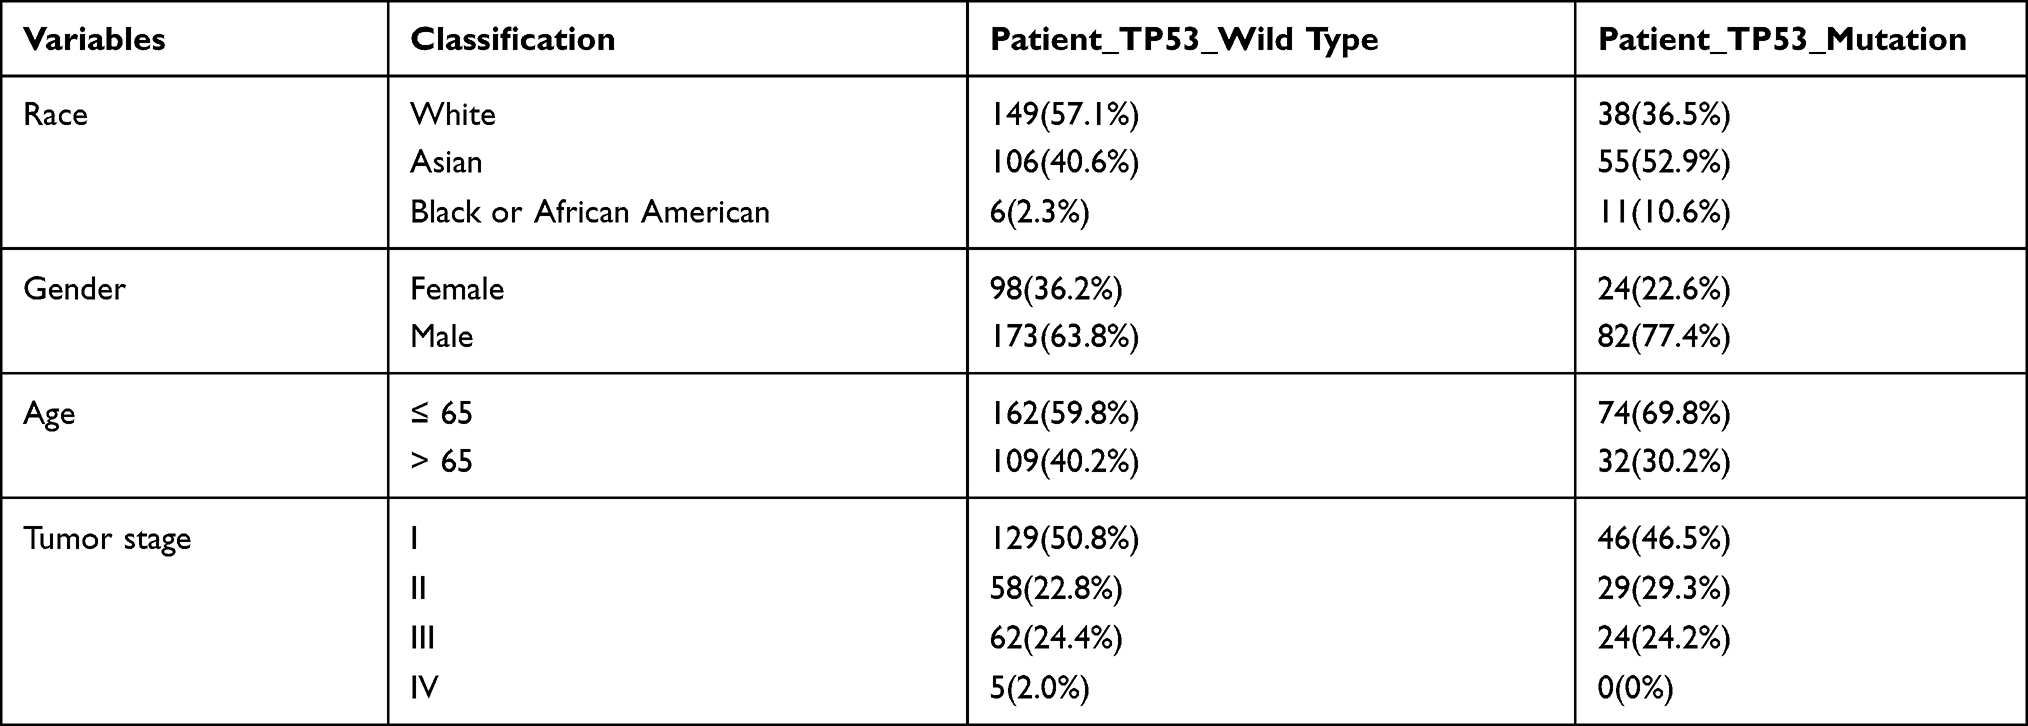 |
Table 1 The Demographic and Clinical Features of the TP53 Wild Type and Mutation Hepatocellular Carcinoma Patients |
Analysis of the Somatic Variants
The mutation annotation data of HCC were used to calculate, analyze and visualize the landscape of genomic alterations and mutual exclusive and co-occurring events through the maftools package.14 The oncogenic signaling pathways enrichment analysis of the mutated genes was analyzed by checking the mechanisms and patterns of somatic alterations in ten canonical pathways (Cell cycle, Hippo, Myc, Notch, Nrf2, PI3K/Akt, RTK-RAS, TGFβ, TP53 and Wnt) by the maftools package.14,15 The overall survival analysis of TP53 wild type and mutation groups was performed using the survival package (p < 0.05 was set as the cut-off).
Differentially Expressed RNAs
The unqualified samples were first filtered, and then the HTSeq-Counts of gene quantification data were merged to single expression matrix for following analysis. The matrix was grouped into TP53 wild type and mutation groups. The differential expression analysis was conducted using the DEseq2 package.16 p < 0.05 and |log2FC| ≥1 were used as the cut-off to filter candidate genes. Volcano plot and heatmap were used to present the differential mRNAs, and lncRNAs expression profiles by the ggplot package.17
Functional Enrichment Analysis
The functional enrichment analysis of the abnormally expressed genes based on Gene Ontology (GO), Kyoto Encyclopedia of Genes and Genomes (KEGG) and Gene Set Enrichment Analysis (GSEA) was conducted through the clusterProfiler package and p < 0.05 was regarded significant.18
Estimation of Tumor-Infiltrating Immune Cells
The normalized HTseq-counts were transferred to Transcript per million (TPM) and then used to estimate the fractions of 22 human haematopoietic cell phenotypes using 1000 permutations and the LM22 signature matrix through the CIBERSORT package.19
ChIP-Seq Analysis
The TP53 ChIP-seq in HCC HepG2 cell data were obtained from the GEO datasets (GSE170834). The reads were first performed quality-control using the FastQC package and trimmed using the cutadapt package.20,21 Then the filtered reads were mapped using the bowtie2 and the peak calling was performed using the MACS.22,23 The peaks were reordered using the Samtools package and annotated using the hg19 reference genome through ChIPseeker package.24,25
RT-qPCR Validation
Further RT-qPCR validation of the differential expression was conducted on 30 collected HCC patients’ samples. The resected samples were obtained between Apr 16, 2020 and Jul 10, 2020 from the People’s Hospital of Zhengzhou University. A professional pathologist dissected the HCC samples into normal samples, paracancer samples and cancer samples through proximity (normal samples, 3–5cm; paracancer samples, 1–2cm). The enrolled subjects were all newly diagnosed as HCC by the color ultrasound technique and histopathology and they all did not receive any treatment before. The detail of the clinicopathological data of the enrolled HCC patients were collected by a professional pathologist from the hospital information system. This work was conducted in accordance with the Declaration of Helsinki and approved by the clinical research ethics committee of the People’s Hospital of Zhengzhou University. All enrolled subjects wrote the informed consents before they participated in the study. The followed qPCR experiments were performed following the previous article.12 The results were analyzed by ΔΔCt method, and the statistical analysis was performed with two tail paired t-test. p < 0.05 was regarded significant. The sequence of the specific qPCR primers was 18S, forward-GTAACCCGTTGAACCCCATT, reverse-CCATCCAATCGGTAGTAGCG; RP4-736L20.3, forward-TCTGTCCAGAAACTCGACGC, reverse-GAATCCCCTCAACGGAGCG; SNRK-AS1, forward-AGGAAGTGGTTGCATGAGGC, reverse- CCTTTCCTCACTCTGCTGGTC.
Results
The Landscape of Genomic Alterations
Somatic variation of HCC was illustrated by mutation annotation data in TCGA database. The landscape of genomic alterations in HCC showed the top 20 high mutation frequency genes and TP53 ranked the highest mutation frequency gene (Table S1). The maximum mutation type of TP53 was Missense Mutation (> 2.5×10⁴) (Figure 1A). The top three enriched signaling pathways of mutated genes were RTK-RAS, WNT, and NOTCH by checking the known oncogenic signaling pathways (Figure 1B). The mutual exclusive and co-occurring events analysis showed the mutation events correlationship, and TP53 and CTNNB1 was mutually exclusive (Figure 1C). We further checked the clinical significance of TP53 and the mutation status showed poor clinical outcome, including pathological Stage II and Stage III (Figure 2). The further understanding of the genomic alterations contributed to identification of the susceptibility genes in HCC and provide more molecular markers for prognosis.
 |
Figure 1 The landscape of genomic alterations of HCC. (A) Somatic mutation landscape of the HCC cohort. Genes are arranged according to the frequency of mutations. (B) Dot plot of the HCC mutated genes enrichment analysis in the 10 oncogenic signaling pathways and the mutated fraction samples. (C) Mutual exclusive and co-occurring events among the top 20 high mutation frequency genes in HCC cohort, the blue indicates co−occurrence and the brown indicates mutually exclusive events. *p<0.05 is regarded significant. |
 |
Figure 2 Overall survival analysis of TP53 in different pathological stage of HCC. Kaplan–Meier survival curve of overall survival of total (A), Stage I (B), Stage II (C) and Stage III (D) HCC patients in TP53 mutant or wild-type status.The light yellow line represents the mutant group and the light blue line represents the wild-type group. |
TP53 Mutation Related Genes and Signaling Pathways
By dividing the transcriptome data of HCC into TP53 wild type and mutation groups and differential expression analysis, we got thousands of misregulated genes, including 699 differential expression lncRNAs (561 up-regulated, 138 down-regulated) (p <0.05, |log2FC| ≥1) (Figure 3A and B, Table S2). These abnormally expressed genes may participate in the progression of HCC. We performed GSEA and comparative GO enrichment analysis of the misregulated genes (p <0.05, |log2FC| ≥1) to identify the abnormal signaling pathways in the TP53 mutation events of HCC. GSEA enrichment analysis showed TP53 mostly enriched in DNA replication and Cell cycle signaling pathways (Figure 3C and D). Enriched GO terms of the up-regulated and down-regulated genes showed different categories. Up-regulated GO terms mostly enriched in immune signaling pathways, such as immune response and complement activation. Down-regulated GO terms mainly enriched in various catabolic and metabolism processes, such as hormone metabolic process and carboxylic acid biosynthetic process (Figure 3E). These analyses indicated that the TP53 mutation event may alter the immune response in HCC.
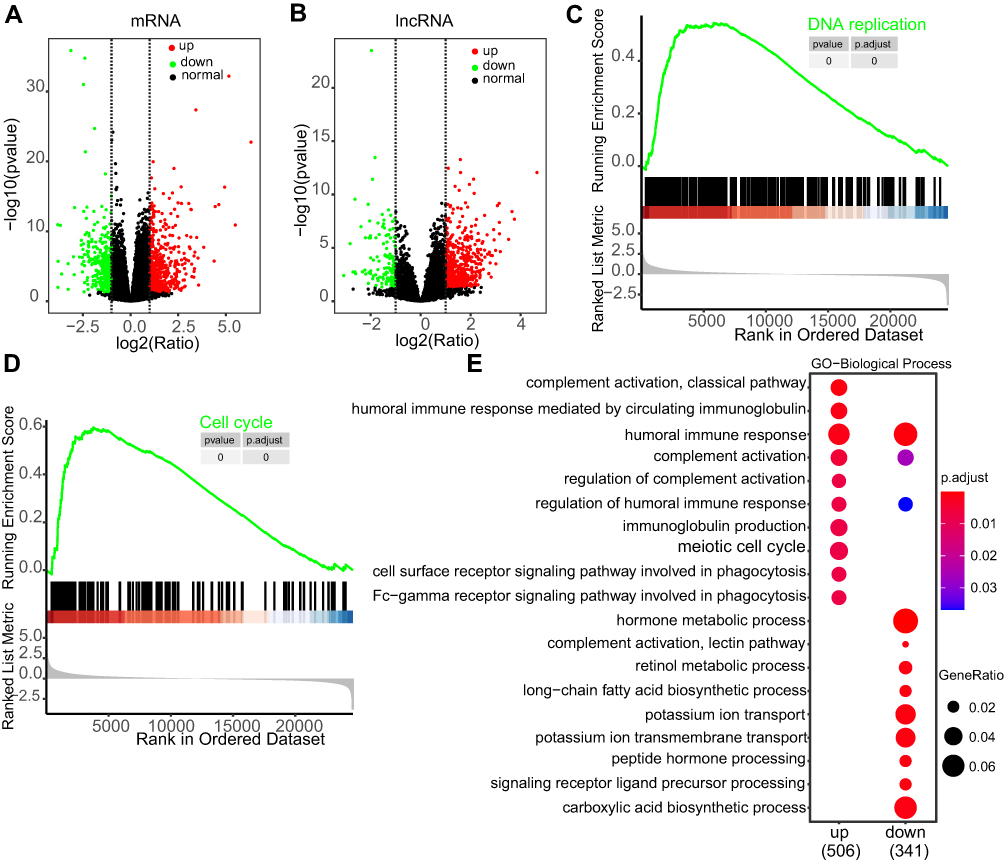 |
Figure 3 Gene differential expression profile in wild type and mutant HCC samples. (A and B) Volcano plot of mRNA (A) and lncRNA (B) expression profiles. Red dots represent up-regulated RNAs, green dots represent down-regulated RNAs, and black dots represent normal RNAs.(C and D) GSEA enrichment analysis of the misregulated genes in HCC, and the curve shows two representive functional enrichment categories. (E) Dot plot of the comparative GO enrichment analysis of the up-regulated and down-regulated genes (p<0.05, logFC≥1 or ≦-1). |
Immune Cell Infiltration Landscapes of TP53 Wild Type and Mutation HCC Patients
For the TP53 mutation status altered the immune response, we next investigated the immune cell infiltration difference between TP53 wild type and mutation HCC patients. The immune cell infiltration landscapes of TP53 wild type and mutation HCC patients showed the variations in the proportions of 22 tumour-infiltrating immune cells (Figure 4A), which may indicate the heterogeneity feature of HCC. The TP53 mutation events were significantly correlated with the different proportions of nine immune cells (T cells CD4 memory resting, Macrophages M0, Mast cells resting, NK cells activated, B cells naïve, Monocytes, Dendritic cells activated, Eosinophils, and T cells CD4 memory activated). The TP53 mutation HCC subgroup included significantly higher proportions of four immune cells (Macrophages M0, Monocytes, Eosinophils, and T cells CD4 memory activated) (Figure 4B).The heterogeneity of immune infiltration investigated in TP53 wild type and mutation HCC patients showed clinical implications and may offer drugable immunotherapy targets.
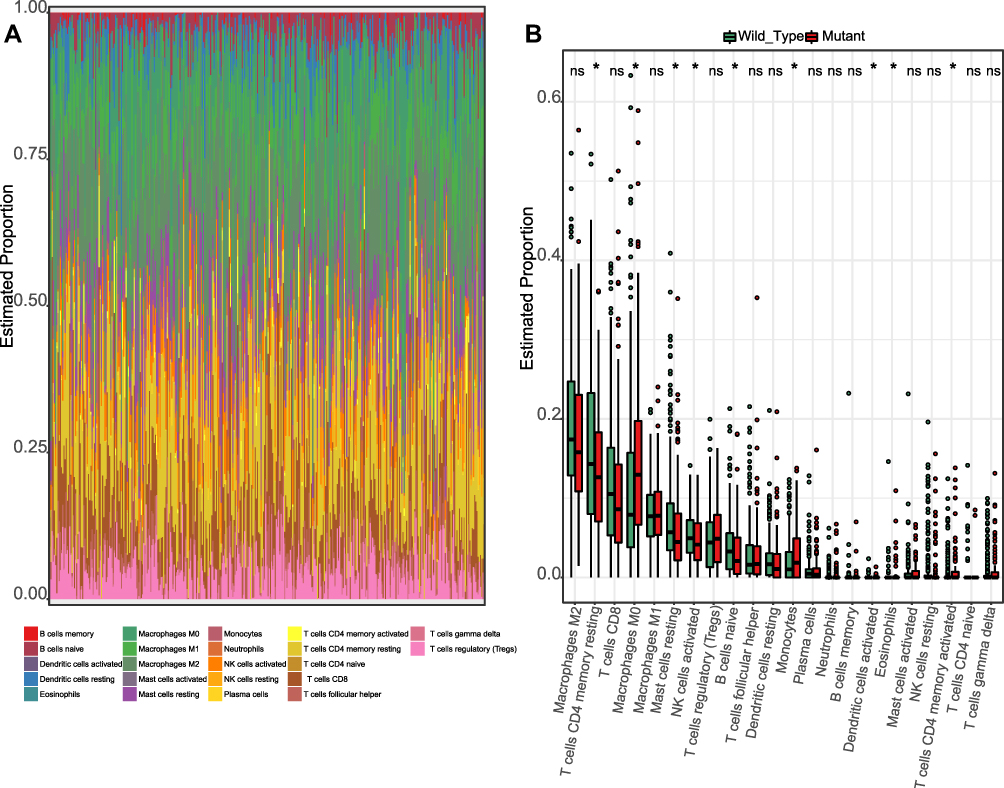 |
Figure 4 Immune cell infiltration landscape of TP53 wild type and mutation HCC patients. (A) Summary of estimated fractions of 22 immune cell subtypes from the CIBERSORT algorithm. Each Bar chart exhibits the cell proportions of each HCC patient. (B) Box plot of the differential abundance of 22 immune cells inTP53 wild type and mutation HCC patients. * indicates “p<0.05”, and ns indicates “not significant”. |
TP53 ChIP-Seq Profile
To illustrate the TP53 ChIP-seq profile, we analyzed the TP53 ChIP-seq data of HCC HepG2 cells (Table S3). The TP53 binding peaks on the promoter regions (−3000_3000) were centralized around the transcription start site (TSS) (Figure 5A), but the most TP53 binding peaks were focused on the Distal Intergenic regions (>37.5%) (Figure 5C). By Reactome Pathway Analysis, we found that the TP53 directly regulated genes mainly enriched in Signaling by Rho GTPases, Growth factor receptors and second messengers, and Cell Cycle Checkpoints (Figure 5B). By investigating the TP53 binding events, we may get the TP53 directly regulated genes and signaling pathways.
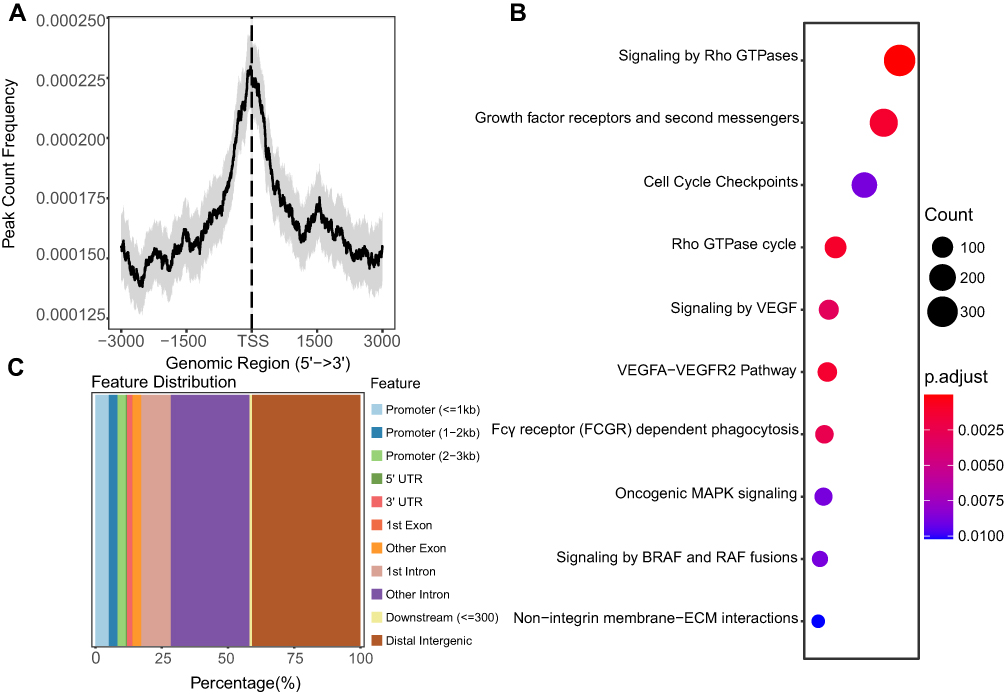 |
Figure 5 The TP53 ChIP-seq profile. (A) The peak count frequency of TP53 ChIP-seq peaks binding around transcription start site (TSS) regions (−3000_3000) of HepG2 cells. (B) Dot plot of the KEGG enrichment analysis of the TP53 ChIP-seq binding genes (−5000_3000 regions). (C) Genomic annotation of TP53 ChIP-seq peaks and their distribution percentage in different genomic regions of HepG2 cells. |
TP53 Directly Regulated and Mutation Related lncRNA Prognosis Markers
To get TP53 directly regulated and mutation related lncRNAs, we integratively analyzed the differential expression lncRNAs in TP53 wild type and mutation groups and the TP53 ChIP-seq binding lncRNAs, and got 112 overlap lncRNAs (selected region −5000_3000) (Figure 6A). We investigated the clinical significance of these lncRNAs in the TP53 mutation HCC patients by Kaplan–Meier (KM) survival analysis, and got eight lncRNAs (Figure 6B). By further ROC analysis, two lncRNAs (RP4-736L20.3 and SNRK-AS1) showed high sensitivity and accuracy as a prognosis marker (Figure 6C–F). The maximum mutation type in TP53 mutation was Missense Mutation (Figure 1A), so we also validated their prognosis value in the TP53 Missense Mutation HCC subgroup, and they also showed significant prognosis value (Figure 6G–J). By qPCR validation, RP4-736L20.3 and SNRK-AS1 showed differential expression, and were gradually high expressed in paracancer and cancer samples (Figure 7). RP4-736L20.3 and SNRK-AS1 were directly regulated by TP53, and showed significant prognosis value.
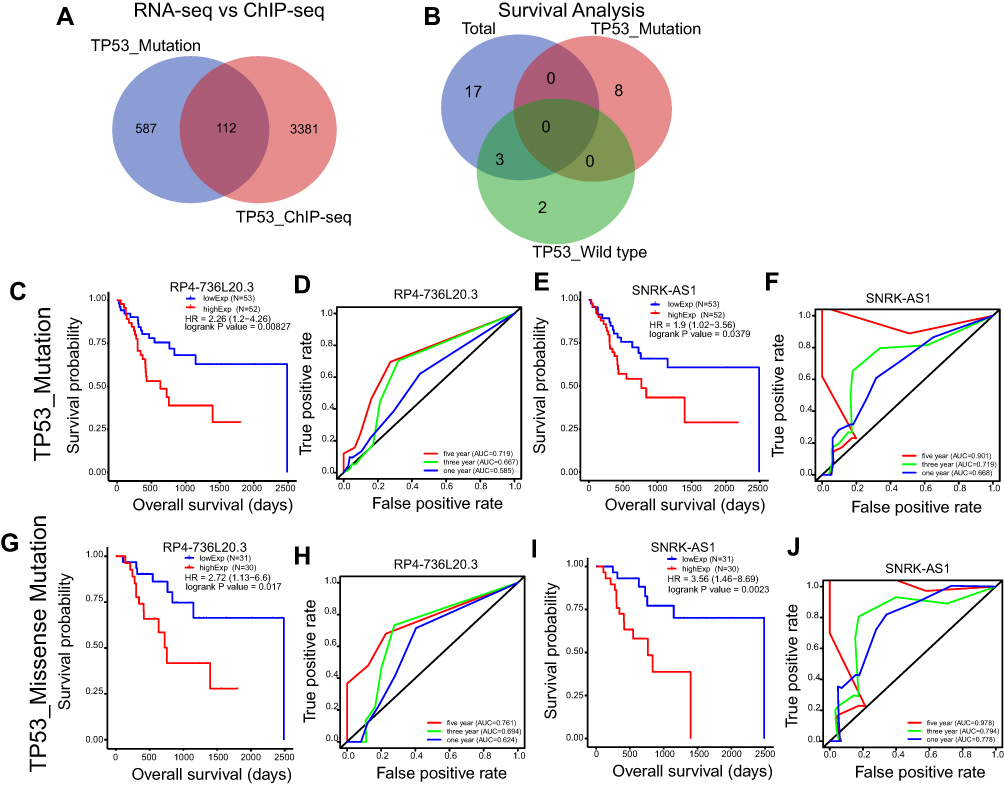 |
Figure 6 TP53 mutation related and directly regulated lncRNA prognosis markers in HCC. (A) Venn plot of the overlap lncRNAs of TP53 mutation related lncRNAs and TP53 directly regulated lncRNAs. (B) Venn plot of the TP53 mutation related lncRNAs and TP53 directly regulated lncRNAs that show clinical significance in total, TP53 wild type and TP53 mutation HCC patients by Kaplan–Meier survival analysis (p<0.05). (C–F) Kaplan–Meier survival curve and Time dependent ROC curve of RP4-736L20.3 and SNRK-AS1 in TP53 mutation HCC patients. (G–J) Kaplan–Meier survival curve and Time dependent ROC curve of RP4-736L20.3 and SNRK-AS1 in TP53 missense mutation HCC patients. |
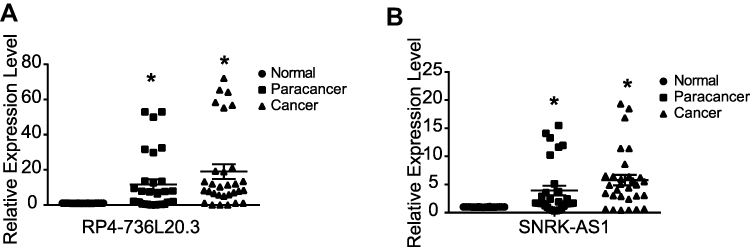 |
Figure 7 The differential expression of RP4-736L20.3 (A) and SNRK-AS1 (B) in HCC patients. Dot plot of the RT-qPCR results of RP4-736L20.3 and SNRK-AS1 in HCC patients’ normal, paracancer and cancer samples. *p<0.05 is regarded significant. |
Discussion
In this work, we analyzed the somatic variants and RNA expression profiles of TP53 wild type and mutation HCC. In our analysis, TP53 ranked the highest mutation rate (28%), and the maximum mutation type in TP53 mutation was Missense Mutation (16.4%). Further, we analyzed whether the mutation events showed clinical significance among the HCC patients. We identified that TP53 mutation showed poor clinical outcome among pathological Stage II and Stage III HCC patients. Previous studies also demonstrated our results and showed that the mutation of TP53 significantly reduced overall survival and increased the risk of recurrence of HCC.26 Previous studies revealed that lncRNA played critical role in the TP53 signaling pathways.27 Thus, we performed differential expression analysis of TP53 wild type and mutation HCC, and found 1941 differentially expressed genes, including 699 lncRNAs (561 up-regulated, 138 down-regulated) (p <0.05, |log2FC| ≥1). These differential expression lncRNAs may act as important effector in the TP53 mutation event. Among these DElncRNAs, previous study demonstrated that XIST showed oncogenic feature in HCC, and it promoted the propagation and inhibited apoptosis by sponging miR-181a.28 Several selected lncRNAs were demonstrated vital function in the important processes of tumorigenesis and these misregulated lncRNAs may work as key factors in the TP53 mutation event and progression of HCC. Function enrichment analysis of these genes indicated that TP53 mutation was involved in Cell cycle and DNA replication signaling pathways and may also affect immune response. The Immune cell infiltration landscapes of TP53 wild type and mutation HCC patients further showed the variations in the proportions of 22 tumour-infiltrating immune cells. Previous studies also revealed that loss or mutation of TP53 in cancers showed an effect on the recruitment and activity of myeloid and T cells, leading to immune evasion and cancer progression.29 By analyzing the TP53 ChIP-seq data, we further got 112 TP53 directly regulated and mutation related lncRNAs. By KM survival analysis, eight lncRNAs indicated clinical significance. Further ROC analysis, two lncRNAs (RP4-736L20.3 and SNRK-AS1) showed high sensitivity and accuracy as a prognosis marker. Using the collected HCC samples, RP4-736L20.3 and SNRK-AS1 showed differential expression, and were gradually high expressed in paracancer and cancer samples, which may indicate the progression of the HCC. These two lncRNAs showed prognosis value and may also indicate the carcinogenesis of HCC and act as prognosis markers.
Conclusion
This study provided the landscape of genomic variations, RNA expression profiles and illustrated the abnormal signaling pathways in the TP53 mutation event of HCC. Our work also discovered two TP53 mutation related and directly regulated lncRNAs (RP4-736L20.3 and SNRK-AS1) in HCC. Our study may provide more promising drugable targets and prognosis biomarkers for HCC.
Abbreviations
HCC, Hepatocellular carcinoma; TCGA, The Cancer Genome Atlas; LncRNAs, Long-noncoding RNAs; DERNA, differentially expressed RNA.
Data Sharing Statement
The data used to support the findings of this study are included within the article and are available upon request.
Funding
This work was supported by the Provincial and Ministerial joint construction project of Health Commission of Henan Province (No. SBGJ202002008).
Disclosure
The authors report no conflicts of interest in this work.
References
1. Bray FI, Ferlay J, Soerjomataram I, Siegel RL, Torre LA, Jemal A. Global cancer statistics 2018: GLOBOCAN estimates of incidence and mortality worldwide for 36 cancers in 185 countries. CA-Cancer J Clin. 2018;68(6):394–424. doi:10.3322/caac.21492
2. Sun S, Wang W, Luo X, et al. Circular RNA circ-ADD3 inhibits hepatocellular carcinoma metastasis through facilitating EZH2 degradation via CDK1-mediated ubiquitination. Am J Cancer Res. 2019;9(8):1695–1707.
3. Sun S, Gao J, Zhou S, et al. A novel circular RNA circ-LRIG3 facilitates the malignant progression of hepatocellular carcinoma by modulating the EZH2/STAT3 signaling. J Exp Clin Canc Res. 2020;39(1):252–264. doi:10.1186/s13046-020-01779-5
4. Jiang H, Cao HJ, Ma N, Bao WD, Xie D. Chromatin remodeling factor ARID2 suppresses hepatocellular carcinoma metastasis via DNMT1-Snail axis. Proc Natl Acad Sci. 2020;117(9):4770–4780. doi:10.1073/pnas.1914937117
5. Sun S, Li Y, Han S, Jia H, Li X, Li X. A comprehensive genome-wide profiling comparison between HBV and HCV infected hepatocellular carcinoma. BMC Med Genomics. 2019;12(1):147–156. doi:10.1186/s12920-019-0580-x
6. Leighl N, Karaseva N, Nakagawa K, et al. Patient-reported outcomes from FLAURA: osimertinib versus erlotinib or gefitinib in patients with EGFR-mutated advanced non-small-cell lung cancer. Eur J Cancer. 2020;125:49–57. doi:10.1016/j.ejca.2019.11.006
7. Kastenhuber E, Lowe S. Putting p53 in context. Cell. 2017;170(6):1062–1078. doi:10.1016/j.cell.2017.08.028
8. Di Agostino S. The impact of mutant p53 in the non-coding RNA world. Biomolecules. 2020;10(3):472–486. doi:10.3390/biom10030472
9. Xu F, Lin H, He P, et al. TP53A -associated gene signature for prediction of prognosis and therapeutic responses in lung squamous cell carcinoma. Oncoimmunology. 2020;9(1):1–11. doi:10.1080/2162402X.2020.1731943
10. Zhang X, Gao S, Li Z, Wang W, Liu G. Identification and analysis of estrogen receptor alpha promoting tamoxifen resistance-related lncRNAs. Biomed Res Int. 2020;2020. doi:10.1155/2020/9031723
11. Li J, Meng H, Bai Y, Wang K. Regulation of lncRNA and its role in cancer metastasis. Oncol Res. 2016;23(5):205–217. doi:10.3727/096504016X14549667334007
12. Zhang X, Zheng P, Li Z, Gao S, Liu G. The somatic mutation landscape and RNA prognostic markers in stomach adenocarcinoma. Oncotargets Ther. 2020;13:7735–7746. doi:10.2147/OTT.S263733
13. Hu W, Alvarez-Dominguez J, Lodish H. Regulation of mammalian cell differentiation by long non-coding RNAs. EMBO Rep. 2012;13(11):971–983. doi:10.1038/embor.2012.145
14. Mayakonda A, Lin DC, Assenov Y, Plass C, Koeffler HP. Maftools: efficient and comprehensive analysis of somatic variants in cancer. Genome Res. 2018;28(11):1747–1756. doi:10.1101/gr.239244.118
15. Sanchez-Vega F, Mina M, Armenia J, et al. Oncogenic signaling pathways in the cancer genome atlas. Cell. 2018;173(2):321–337.
16. Love MI, Huber W, Anders S. Moderated estimation of fold change and dispersion for RNA-seq data with DESeq2. Genome Biol. 2014;15(12):550–570. doi:10.1186/s13059-014-0550-8
17. Wickham H. ggplot2. Wiley Interdiscip Rev Comput Stat. 2011;3(2):180–185. doi:10.1002/wics.147
18. Yu G, Wang LG, Han Y, He QY. clusterProfiler: an R package for comparing biological themes among gene clusters. OMICS. 2012;16(5):284–287. doi:10.1089/omi.2011.0118
19. Newman AM, Steen CB, Liu CL, et al. Determining cell type abundance and expression from bulk tissues with digital cytometry. Nat Biotechnol. 2019;37(7):773–782. doi:10.1038/s41587-019-0114-2
20. Martin M. Cutadapt removes adapter sequences from high-throughput sequencing reads. EMBnet J. 2011;17(1):10–12. doi:10.14806/ej.17.1.200
21. Andrews S. FastQC: a quality control tool for high throughput sequence data. In: Babraham Bioinformatics. Cambridge, United Kingdom: Babraham Institute; 2010.
22. Langmead B, Salzberg SL. Fast gapped-read alignment with Bowtie 2. Nat Methods. 2012;9(4):357–359. doi:10.1038/nmeth.1923
23. Zhang Y, Liu T, Meyer CA, et al. Model-based analysis of ChIP-Seq (MACS). Genome Biol. 2008;9(9):R137–R145. doi:10.1186/gb-2008-9-9-r137
24. Li H, Handsaker B, Wysoker A, et al. The sequence alignment/map format and SAMtools. Bioinformatics. 2009;25(16):2078–2079. doi:10.1093/bioinformatics/btp352
25. Yu G, Wang LG, He QY. ChIPseeker: an R/Bioconductor package for ChIP peak annotation, comparison and visualization. Bioinformatics. 2015;31(14):2382–2383. doi:10.1093/bioinformatics/btv145
26. Cancer Genome Atlas Research Network. Comprehensive and integrative genomic characterization of hepatocellular carcinoma. Cell. 2017;169(7):1327–1341. doi:10.1016/j.cell.2017.05.046
27. Bao S, Zhao H, Yuan J, et al. Computational identification of mutator-derived lncRNA signatures of genome instability for improving the clinical outcome of cancers: a case study in breast cancer. Brief Bioinform. 2020;21(5):1742–1755. doi:10.1093/bib/bbz118
28. Chang S, Chen B, Wang X, Wu K, Sun Y. Long non-coding RNA XIST regulates PTEN expression by sponging miR-181a and promotes hepatocellular carcinoma progression. BMC Cancer. 2017;17(1):248–261. doi:10.1186/s12885-017-3216-6
29. Blagih J, Buck M, Vousden K. p53, cancer and the immune response. J Cell Sci. 2020;133(5):jcs237453. doi:10.1242/jcs.237453
 © 2021 The Author(s). This work is published and licensed by Dove Medical Press Limited. The
full terms of this license are available at https://www.dovepress.com/terms
and incorporate the Creative Commons Attribution
- Non Commercial (unported, 3.0) License.
By accessing the work you hereby accept the Terms. Non-commercial uses of the work are permitted
without any further permission from Dove Medical Press Limited, provided the work is properly
attributed. For permission for commercial use of this work, please see paragraphs 4.2 and 5 of our Terms.
© 2021 The Author(s). This work is published and licensed by Dove Medical Press Limited. The
full terms of this license are available at https://www.dovepress.com/terms
and incorporate the Creative Commons Attribution
- Non Commercial (unported, 3.0) License.
By accessing the work you hereby accept the Terms. Non-commercial uses of the work are permitted
without any further permission from Dove Medical Press Limited, provided the work is properly
attributed. For permission for commercial use of this work, please see paragraphs 4.2 and 5 of our Terms.