")
Back to Journals » International Journal of Nanomedicine » Volume 9 » Issue 1
Toxicity assessment of repeated intravenous injections of arginine–glycine–aspartic acid peptide conjugated CdSeTe/ZnS quantum dots in mice
Authors Wang Y, Yang K, Tang H, Chen D, Bai Y
Received 26 June 2014
Accepted for publication 15 August 2014
Published 17 October 2014 Volume 2014:9(1) Pages 4809—4817
DOI https://doi.org/10.2147/IJN.S70092
Checked for plagiarism Yes
Review by Single anonymous peer review
Peer reviewer comments 3
Editor who approved publication: Professor Lei Yang
You-Wei Wang, Kai Yang, Hong Tang, Dan Chen, Yun-Long Bai
Department of Oral and Maxillofacial Surgery, The First Affiliated Hospital of Chongqing Medical University, Chongqing, People’s Republic of China
Background: Nanotechnology-based near-infrared quantum dots (NIR QDs) have many excellent optical properties, such as high fluorescence intensity, good fluorescence stability, and strong tissue-penetrating ability. Integrin αvß3 is highly and specifically expressed in tumor angiogenic vessel endothelial cells of almost all carcinomas. Recent studies have shown that NIR QDs linked to peptides containing the arginine–glycine–aspartic acid (RGD) sequence (NIR QDs-RGD) can specifically target integrin αvß3 expressed in endothelial cells of tumor angiogenic vessels in vivo, and they offer great potential for early cancer diagnosis, in vivo tumor imaging, and tumor individualized therapy. However, the toxicity profile of NIR QDs-RGD has not been reported. This study was conducted to investigate the toxicity of NIR QDs-RGD when intravenously administered to mice singly and repeatedly at the dose required for successful tumor imaging in vivo.
Materials and methods: A NIR QDs-RGD probe was prepared by linking NIR QDs with the maximum emission wavelength of 800 nm (QD800) to the RGD peptide (QD800-RGD). QD800-RGD was intravenously injected to BALB/C mice once or twice (200 pmol equivalent of QD800 for each injection). phosphate-buffered saline solution was used as control. Fourteen days postinjection, toxicity tests were performed, including complete blood count (white blood cell, red blood cell, hemoglobin, platelets, lymphocytes, and neutrophils) and serum biochemical analysis (total protein, albumin, albumin/globulin, aspartate aminotransferase, alanine aminotransferase, and blood urea nitrogen). The coefficients of liver, spleen, kidney, and lung weight to body weight were measured, as well as their oxidation and antioxidation indicators, including superoxide dismutase, glutathione, and malondialdehyde. The organs were also examined histopathologically.
Results: After one or two intravenous injections of QD800-RGD, as compared with control, no significant differences were observed in the complete blood count; biochemical indicators of blood serum, organ coefficient, and oxidation and antioxidation indicators; and no cell necrosis or inflammation were seen in the liver, spleen, kidney, or lung through histopathological examination.
Conclusion: Our data demonstrate that the single and repeated intravenous injection of QD800-RGD at a dose needed for successful tumor imaging in vivo is not toxic to mice. Our work lays a solid foundation for further biomedical applications of NIR QDs-RGD.
Keywords: nanotechnology, RGD peptides, integrin αvß3, quantum dots, intravenous injection, toxicity
Introduction
Due to their unique physical and chemical properties, many synthetic nanomaterials have become important tools for medical research.1,2 Quantum dots (QDs) with unique optical properties are a class of novel nanomaterials and have been widely used in medical research.3,4 QDs are nanocrystals (diameter ranges from 2–10 nm) consisting of elements belonging to group 2–6 or group 3–5. When coated with water-soluble bioactive material, they form core–shell nanostructures that are water soluble and biocompatible. The structures can be further conjugated with a variety of ligands, antibodies, or peptides to prepare functional nano fluorescent probes with unique optical properties. These functional QD probes have been increasingly used in cellular and molecular tracing, in vivo tumor imaging, drug monitoring, and signal transduction.3–8
Since the core components of QDs are heavy metals (such as Cd, Se, and so on), their toxicity and biosafety have aroused general concern.9,10 Some studies have shown that due to the release of heavy metals from the QD core and the generation of reactive oxygen free radicals induced by QDs in cells, QDs are toxic to the organism and cells.9–11 However, other studies show that for some functional QDs coated with bioactive substances, no cell or organism toxicity was observed in vitro and in vivo.12–14 Since there is a large number of functionalized QDs species, each having different physical and chemical properties, their toxicity varies greatly. A number of factors have been demonstrated to impact the toxicity of QDs,15–24 such as the composition of the QD core, particle size, exposure concentration, exposure time, the physical and chemical properties of the coating material, environmental condition, administration manner, and the types of targeted cells. Therefore, QDs cannot be generally defined as toxic or nontoxic. The toxicity of functionalized QDs needs to be assessed individually. What is important is that, firstly, we need to assess, individually, the toxicity of different types of functional QDs to the organism and cell at the dose that is required for the QDs to achieve their medical application purposes.
The recently developed near-infrared QDs (NIR QDs) with emission wavelengths between 700–900 nm have unique optical properties, such as high fluorescent intensity, excellent fluorescence stability, and strong tissue-penetrating ability, and therefore have great potential for early cancer diagnosis, in vivo tumor imaging, and individualized tumor therapy.25–27 The occurrence and development of cancer have been shown to depend on angiogenesis, and integrin αvβ3 is specifically and highly expressed in the endothelial cells of almost all tumor angiogenic vessels; moreover, integrin αvβ3 can specifically bind to peptides containing the arginine–glycine–aspartic acid (RGD) sequence.28,29 Previous studies27,30–32 have shown that a probe prepared by linking RGD to NIR QDs (NIR QDs-RGD) can target integrin αvβ3 expressed in the endothelial cells of tumor angiogenic vessels. For mice weighing 20–25 g, intravenously administered doses of a NIR QDs-RGD probe containing 150–200 pmol equivalent of QDs were needed to achieve satisfactory in vivo imaging of tumors and tumor angiogenic vessels, indicating that NIR QDs-RGD are of great potential in early cancer diagnosis, in vivo tumor imaging, and individualized treatment. However, the toxicity of NIR QDs-RGD has not yet been investigated.
When used as a clinical formulation, either for cancer diagnosis or therapy, repeated dosing is common. Therefore, it is important to first evaluate the toxicity of NIR QDs-RGD repeatedly, using a dose that can achieve a medical application goal. In this study, we conjugated RGD with QDs with an emission wavelength of 800 nm (QD800) to generate QD800-RGD, and we assessed the toxicity of QD800-RGD containing 200 pmol equivalent of QD800 in mice when intravenously administered as a single or double injections. The results would provide invaluable information for further study, and it may lead to the transformation to clinical use of NIR QDs-RGD.
Materials and methods
Experimental animals
Thirty-three specific pathogen-free (SPF) mice (male; BALB/C) aged 6–8 weeks, weighing 17–20 g were purchased from the Experimental Animal Center of Chongqing Medical University (Chongqing, People’s Republic of China). They were reared under constant temperature and humidity conditions (room temperature: 22°C±2°C; air humidity: 60%±10%), with free access to water and feed. All litter, feed, and water were sterilized. All experimental procedures were approved by the Experimental Animal Use and Management Committee in Experimental Animal Research Institute, Chongqing Medical University.
Preparation of QD800-RGD
QD800 are made of CdSeTe cores with a ZnS shell and an amino-derivatized polyethylene glycol outer coating (Thermo Fisher Scientific, Waltham, MA, USA); cyclic RGD peptide was obtained from GL Biochem Ltd. (Shanghai, People’s Republic of China). QD800 and RGD were conjugated to prepare QD800-RGD according to the protocol described in Qdot® Antibody Conjugation Kits (Thermo Fisher Scientific). The detailed operational steps were reported in our previous paper.27
Characterization of QD800-RGD and QD800
A 50 μL aliquot of QD800-RGD solution (16 μmol/mL) and a 50 μL aliquot of QD800 solution (16 μmol/mL) were diluted 100 times separately with double-distilled water after being sonicated. A 50 μL aliquot of each diluted suspension was separately added to copper grids with a membrane. After standing for 10 minutes, redundant water was removed from the copper grids with filter paper. The samples were observed under a transmission electron microscope (H-7500; Hitachi Ltd., Tokyo, Japan) for QD800-RGD and QD800 dispersion when they became dry. A 200 μL aliquot of each suspension was separately diluted to 6 mL with ultrapure water in sample tubes (Yixing Jingke Optical Instrument Co., Ltd., Jiangsu, People’s Republic of China), and determined with a laser scattering analyzer (BI-200SM; Brookhaven Instruments Corporation, Holtsville, NY, USA). QD800-RGD and QD800 dynamic diameters were analyzed by Dynamics® Light Scattering software version 5.77 (Wyatt Technology Corporation, Goleta, CA, USA).
In vivo distribution of QD800-RGD and QD800
Nine SPF mice (male; BALB/C mice) were randomly divided into three groups with three mice in each group. In group 1, mice were injected via tail vein with 100 μL of QD800-RGD solution (containing 200 pmol equivalent of QD800). For group 2, the mice were similarly injected with 100 μL of QD800 solution (containing 200 pmoL QD800). In group 3, mice were injected with 100 μL of phosphate-buffered saline (PBS) solution through the tail vein. All mice were cervically dislocated 24 hours later and dissected immediately for brain, heart, liver, spleen, lung, kidney, tibia, and stomach. After washing with PBS and blotting dry with filter paper, the organs were fluorescently imaged with the MaestroTM in vivo imaging system (Maestro EX IVIS; Thermo Fisher Scientific) at an excitation of 630 nm and an emission of 800 nm to observe the distribution of QD800-RGD and QD800 in various organs.
Blood count and serum biochemical analysis
Twenty-four SPF mice (male; BALB/C) were randomly divided into four groups with six mice in each group. In experimental group 1, mice were injected via tail vein with 100 μL of QD800-RGD (equivalent to 200 pmol of QD800) on the first day. For control group 1, mice were injected similarly with 100 μL of PBS. In experimental group 2, mice were repeatedly injected via tail vein with 100 μL of QD800-RGD (equivalent to 200 pmol of QD800) on the first and seventh days, and for control group 2, mice were repeatedly injected similarly with 100 μL of PBS on the first and seventh days. The general health of the mice was observed once a day. On the 14th day, the weights of all mice were measured and recorded, and then the right eyeball of every mouse was removed to collect about 1.2 mL of blood from each mouse after 12 hours of watering but not feeding. The blood from each mouse was put into two collection tubes with coagulant or anticoagulants (approximately 0.6 mL each). The samples in the tubes with the anticoagulants were analyzed using an automatic hematology analyzer (XE-2100; Sysmex Corporation, Kobe, Japan) for numbers or content of white blood cells (WBCs), red blood cells (RBCs), hemoglobin (Hb), platelets (PLT), lymphocytes (LYM#), and neutrophils (NEUT#). The samples in the tubes with the coagulant were immediately centrifuged for 6 minutes (4°C; 3,000 rpm), and the sera obtained were analyzed for total protein (TP), albumin (Alb), Alb/globulin ratio (Alb/GLB), aspartate aminotransferase (AST), alanine aminotransferase (ALT), and blood urea nitrogen (BUN) using an automatic biochemical analyzer (Modular DDP; Hoffman-La Roche Ltd., Basel, Switzerland).
Organ coefficient
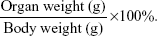
After taking the blood samples, the 24 mice were sacrificed by cervical dislocation, and then organs including the liver, spleen, kidney, and lung were dissected and weighed with an electronic balance after blotting the blood and body fluids with filter paper. The organ coefficient of an organ was calculated as follows:
|
|
Measurement of oxidation and antioxidation indicators
The liver, spleen, lung, and kidney were each cut into two pieces immediately after weighing them. One piece of every organ was washed with 4°C physiological saline three times, blotted dry with filter paper, and weighed. Then, the tissues were homogenized with mechanical homogenizer in an ice bath after 4°C physiological saline was added to the homogenate tube as follows:
|
|
The homogenates were centrifuged for 10 minutes (4°C, 3,000 rpm), and then the supernatants were used to measure the TP concentration with the Coomassie Brilliant Blue binding method.33 The total superoxide dismutase (SOD) activity, glutathione (GSH), and malondialdehyde (MDA) content of each organ was measured separately using the total SOD test kit (A001; Nanjing Jiancheng Bioengineering Institute, Nanjing, People’s Republic of China), MDA test kit (A003-1; Nanjing Jiancheng Bioengineering Institute) and GSH test kit (A006-1; Nanjing Jiancheng Bioengineering Institute). Every experiment was carried out according to the instructions of the corresponding test kit. The detailed operational steps were reported in previous papers.33,34
Histopathology
The other piece of every organ was fixed in 4% paraformaldehyde for 6 hours, embedded in paraffin, and cut into 4 μm tissue slices. The slices were stained with hematoxylin and eosin (HE) and observed under a light microscope (Leica DMI4000 B; Leica Microsystems, Wetzlar, Germany).
Statistical methods
One-way analysis of variance was performed using SPSS version 13.0 software (IBM Corporation, Armonk, NY, USA) and the results were expressed as means ± standard deviation. P<0.05 was considered statistically significant.
Results
Characteristics of QD800-RGD and QD800
The QD800-RGD concentration obtained in this experiment was 1.2 μM. Under transmission electron microscope, both QD800-RGD and QD800 dispersed well without agglomeration (Figure 1). The average hydrodynamic diameters of QD800-RGD and QD800 were 23.83±5.24 nm and 16.67±3.81 nm, respectively.
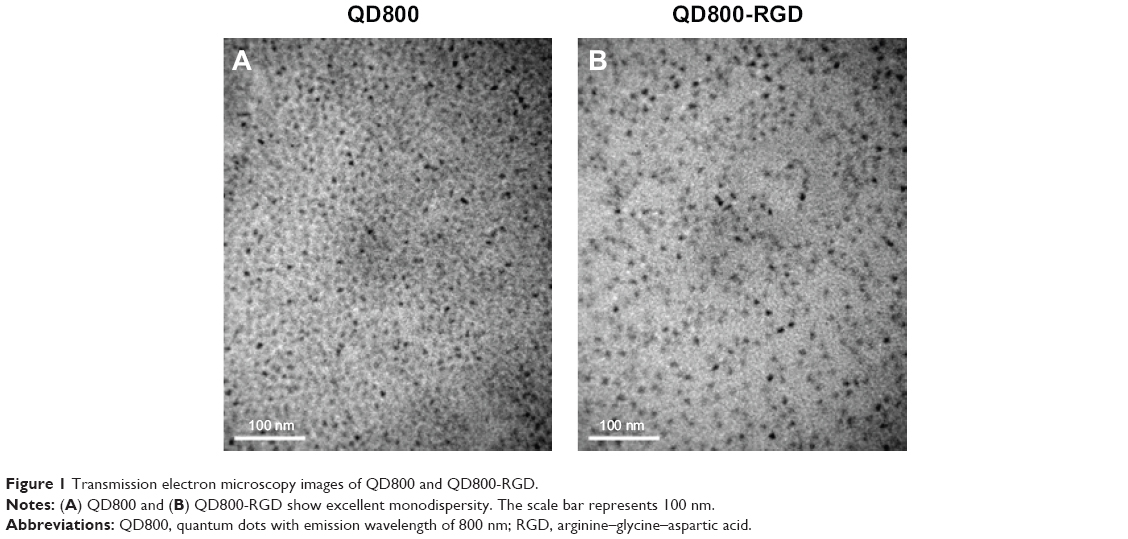 | Figure 1 Transmission electron microscopy images of QD800 and QD800-RGD. |
In vivo distribution
Twenty-four hours after injection via the tail vein, strong fluorescence signals of QD800 were detected in the liver, spleen, and lungs, but not in the brain, heart, kidney, tibia, and stomach (Figure 2), indicating that QD800-RGD and QD800 had similar distribution patterns in the organs in vivo after the intravenous injection (Figure 2).
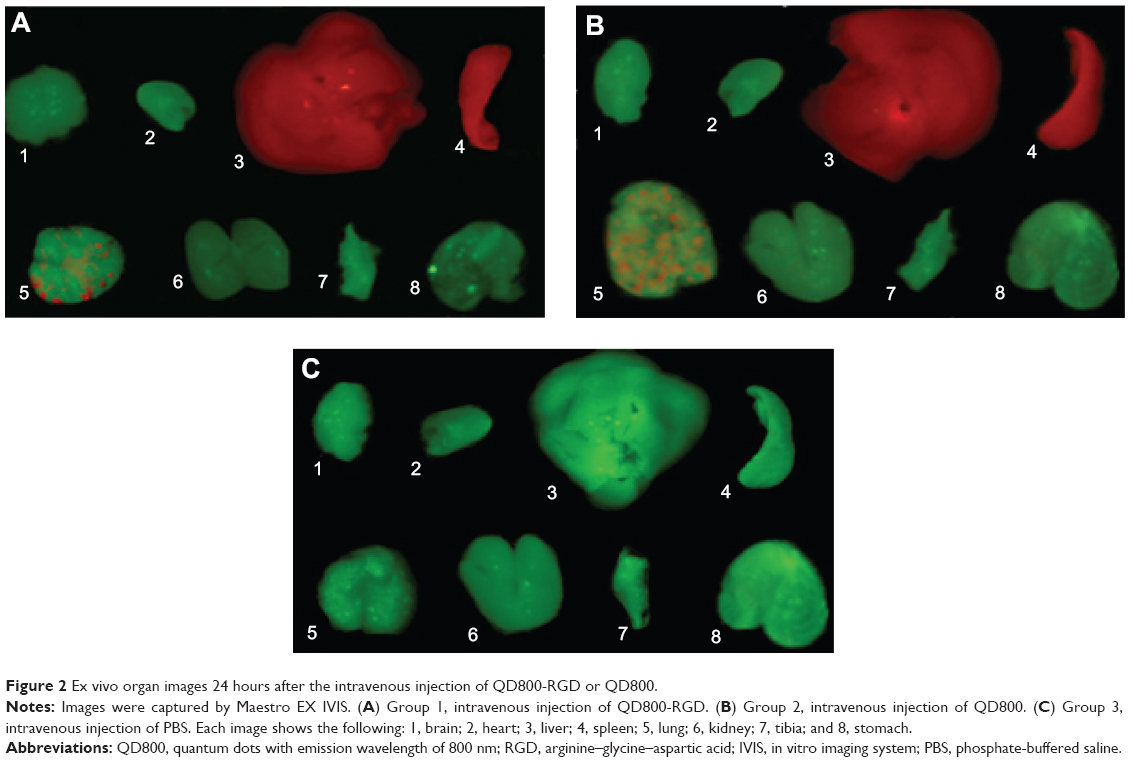 | Figure 2 Ex vivo organ images 24 hours after the intravenous injection of QD800-RGD or QD800. |
General reactions
All mice survived and ate and drank normally with normal urine and feces. No tail lift, skin and hair color change, or abnormal behaviors were observed. No excitatory or inhibitory response was noticed.
Coefficients of organs
The coefficients of liver, spleen, kidney, and lung weight to body weight following the one or two intravenous injections of QD800-RGD or PBS are shown in Table 1. The organ coefficients of mice in the four groups showed no statistical difference (P>0.05), indicating that the one or two injections of QD800-RGD did not cause changes in the relative weight of these organs.
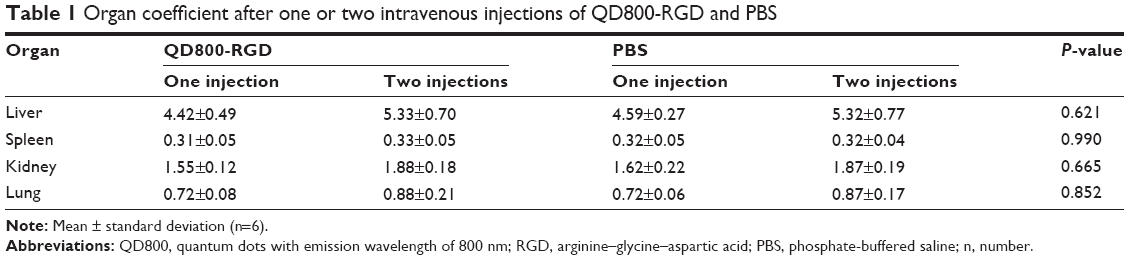 | Table 1 Organ coefficient after one or two intravenous injections of QD800-RGD and PBS |
Complete blood count
The numbers of WBC, RBC, Hb, PLT, LYM#, and NEUT# in the peripheral blood of the mice in the four groups are shown in Table 2. These counts were not significantly different among the groups (P>0.05), indicating that the one or two injections of QD800-RGD did not cause any hematologic toxicity.
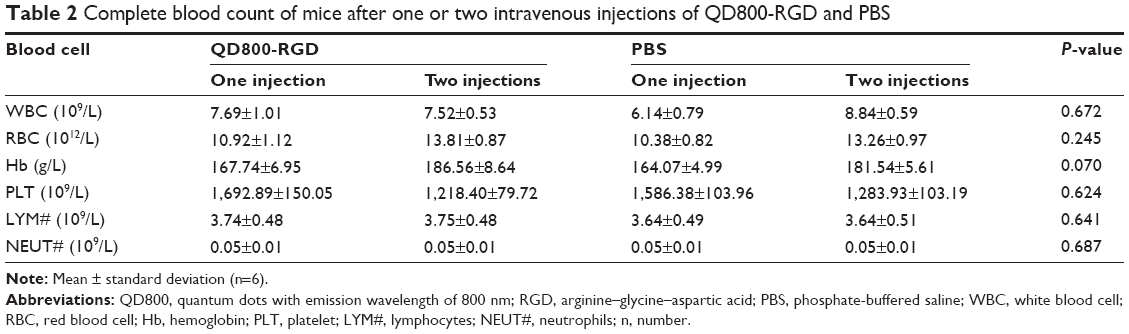 | Table 2 Complete blood count of mice after one or two intravenous injections of QD800-RGD and PBS |
Serum biochemical parameters
The serum biochemical parameters of the mice in the four groups are shown in Table 3. The measurements of TP, Alb, the Alb/GLB ratio, AST, ALT, and BUN were not significantly different among the groups (P>0.05), indicating that the one or two injections of QD800-RGD did not damage the functions of the liver and kidney.
 | Table 3 Serum biochemical measurements of mice after one or two intravenous injections of QD800-RGD and PBS |
SOD activity, GSH, and MDA content
The measurements of SOD, GSH, and MDA in the liver, spleen, kidney, and lung of the four groups of mice are shown in Table 4. No significant difference in these measurements was found among the four groups (P>0.05), indicating that the injections of QD800-RGD did not cause oxidative damage to the liver, spleen, kidney, and lung.
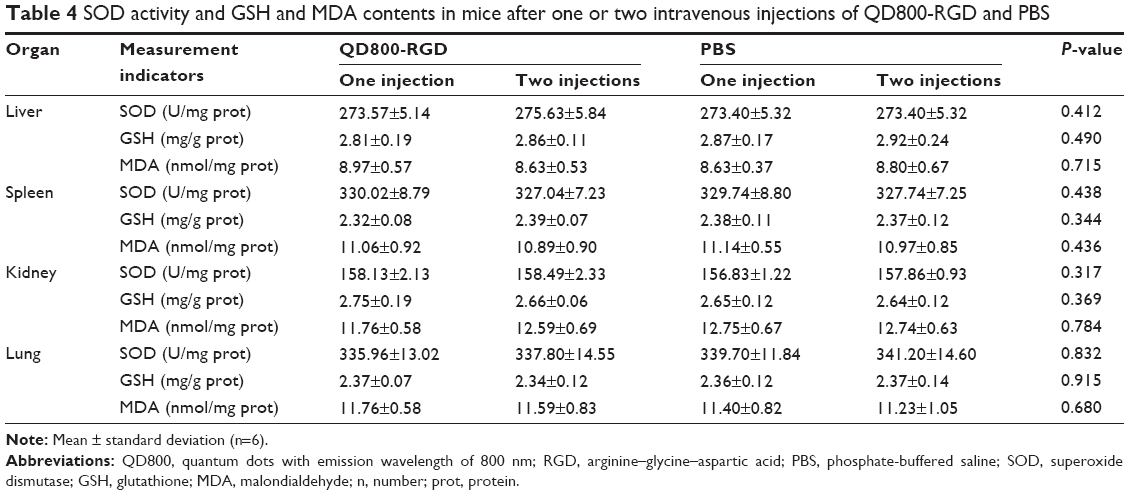 | Table 4 SOD activity and GSH and MDA contents in mice after one or two intravenous injections of QD800-RGD and PBS |
Histopathology
HE-stained tissue slices under light microscope showed that the cell morphology, number, and distribution in the mice liver, spleen, lung, and kidney tissues after the one or two QD800-RGD injections were not obviously different from those in the control samples. There was no necrosis or other abnormality, demonstrating that the QD800-RGD injections did not cause damage to these organs (Figure 3).
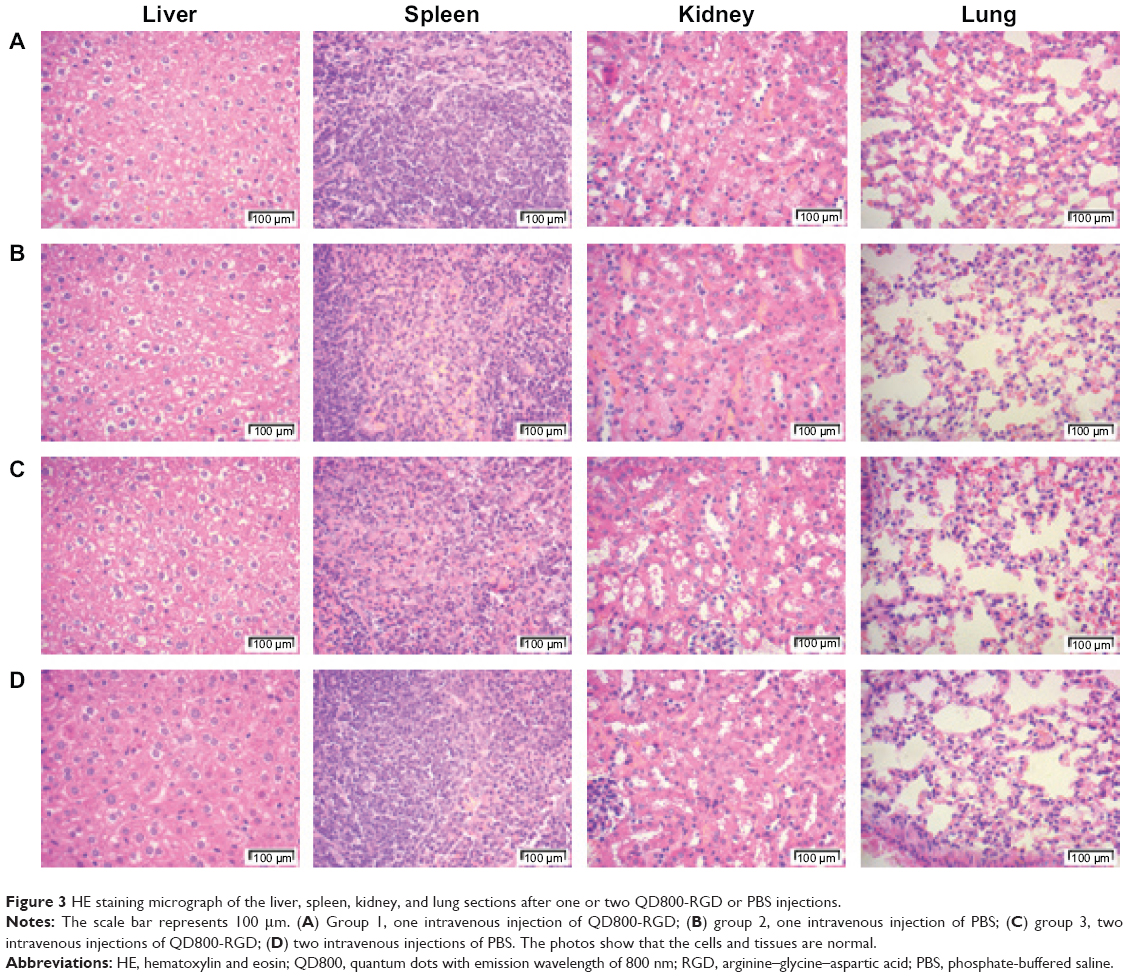 | Figure 3 HE staining micrograph of the liver, spleen, kidney, and lung sections after one or two QD800-RGD or PBS injections. |
Discussion
The toxicity of QDs is influenced by many factors and varies considerably among different types of functionalized QDs.15–24 In this study, the outer coating of QD800 is amino-derivatized polyethylene glycol; therefore, QD800 is highly cationic under physiological conditions.30 On the basis of the size of QD800, we estimated that there are about 80–100 amino groups on the surface of each QD800.30,31 Since the maximum ligand coupling efficiency of the amino groups and RGD peptides is 40%–50%,35 about half of the amino groups conjugated with RGD peptides; therefore, the overall charge of the QD800-RGD is much less.
Studies show that after intravenous injection, QDs could react first with the blood components, causing inflammation and changes in the blood factors (such as WBC, PLT, RBC, and so on).10,36 QDs-RGD containing 150–200 pmol equivalent of QDs intravenously injected to mice weighing 20–25 g have been shown to be adequate doses for clear in vivo tumor imaging.27,30–32 In our study, mice weighing 17–20 g were intravenously injected once or twice with QD800-RGD containing 200 pmol equivalent of QD800, which exceeds the maximum dose of QD800-RGD for achieving in vivo tumor imaging.27,30,31 The results indicate that the single and repeated injections did not cause any hematologic toxicity 14 days after the injection.
The QD toxicity is believed to be due to the released heavy metal ions of the QD core (such as Cd2+, Se2−, and so on) and the QD-induced reactive oxygen free radicals in the cells.9–11 This and earlier studies have demonstrated that following intravenous injection, QD800-RGD was mainly distributed in the liver, spleen, and lung.27,30,31 Since the kidney is the main excretory organ in vivo, we focused our toxicity assay in the liver, spleen, lung, and kidney.
Serum proteins (such as TP and Alb) and some unique enzymes (such as AST, ALT, and BUN) are important indicators for liver and kidney function. When the liver and kidney undergo inflammation or damage, these indicators will change significantly.37 The results of this study show that single or repeated injections of 200 pmol QD800-RGD did not cause any damage to liver and kidney function.
Reactive oxygen free radicals are closely associated with cell proliferation, differentiation, apoptosis, and other pathological processes.9 Increased reactive oxygen free radicals can cause lipid peroxidation injury, resulting in cell membrane damage, apoptosis, or cell death.9,38,39 MDA is a representative product of lipid peroxidation, and its content can be used to measure the rate and intensity of lipid peroxidation. The production and cleavage of cellular reactive oxygen free radicals depend on a redox system comprising a variety of enzymes. SOD and GSH are two key enzymes that clear reactive oxygen free radicals. Therefore, MDA, SOD, and GSH are often used in the study of oxidative stress and antioxidant defense.40 Our results show that single and repeated intravenous injections of 200 pmol QD800-RGD did not cause significant changes in the activity of SOD, or in the contents of MDA and GSH in the liver, spleen, kidney, and lung tissues. Histopathologically, no cell necrosis or damage was observed in the mice after the injections.
Conclusion
In summary, the individualized evaluation of functional QDs is necessary for the accurate assessment of their biotoxicity, given the vast types of functional QDs available.15–24 Our study demonstrates for the first time that at the dose needed to produce in vivo tumor imaging, there is no short-term toxicity of QD800-RGD in mice after repeated intravenous injections, which provides invaluable information for the clinical application of QD800-RGD. Additional study is needed to further elucidate the dose–toxicity relationship of QD800-RGD in mice and its long-term toxicity and metabolic fates.
Acknowledgment
This study was supported by the National Natural Science Foundation of China (No 81172205).
Disclosure
The authors report no conflicts of interest in this work.
References
Fu PP. Introduction to the special issue: nanomaterials – toxicology and medical applications. J Food Drug Anal. 2014;22(1):1–2. | ||
Li J, Chang X, Chen X, et al. Toxicity of inorganic nanomaterials in biomedical imaging. Biotechnol Adv. 2014;32(4):727–743. | ||
Li J, Zhu JJ. Quantum dots for fluorescent biosensing and bio-imaging applications. Analyst. 2013;138(9):2506–2515. | ||
Rizvi SB, Ghaderi S, Keshtgar M, Seifalian AM. Semiconductor quantum dots as fluorescent probes for in vitro and in vivo bio-molecular and cellular imaging. Nano Rev. 2010:1. | ||
Chien CY, Lai WT, Chang YJ, Wang CC, Kuo MH, Li PW. Size tunable Ge quantum dots for near-ultraviolet to near-infrared photosensing with high figures of merit. Nanoscale. 2014;6(10):5303–5308. | ||
Shi Y, Liu L, Pang H, et al. Facile preparation of highly luminescent CdTe quantum dots within hyperbranched poly(amidoamine)s and their application in bio-imaging. Nanoscale Res Lett. 2014;9(1):115. | ||
Pierobon P, Cappello G. Quantum dots to tail single bio-molecules inside living cells. Adv Drug Deliv Rev. 2012;64(2):167–178. | ||
Singh G, Zaidi NH, Soni U, et al. Detection of bioconjugated quantum dots passivated with different ligands for bio-applications. J Nanosci Nanotechnol. 2011;11(5):3834–3842. | ||
Kauffer FA, Merlin C, Balan L, Schneider R. Incidence of the core composition on the stability, the ROS production and the toxicity of CdSe quantum dots. J Hazard Mater. 2014;268:246–255. | ||
Katsumiti A, Gilliland D, Arostegui I, Cajaraville MP. Cytotoxicity and cellular mechanisms involved in the toxicity of CdS quantum dots in hemocytes and gill cells of the mussel Mytilus galloprovincialis. Aquat Toxicol. 2014;153:39–52. | ||
Wu T, Tang M. Toxicity of quantum dots on respiratory system. Inhal Toxicol. 2014;26(2):128–139. | ||
Zhang Y, Zhang Y, Hong G, et al. Biodistribution, pharmacokinetics and toxicology of Ag2S near-infrared quantum dots in mice. Biomaterials. 2013;34(14):3639–3646. | ||
Zhang T, Stilwell JL, Gerion D, et al. Cellular effect of high doses of silica-coated quantum dot profiled with high throughput gene expression analysis and high content cellomics measurements. Nano Lett. 2006;6(4):800–808. | ||
Sun D, Yang K, Zheng G, Li Z, Cao Y. Study on the effect of peptide-conjugated near-infrared fluorescent quantum dots on the clone formation, proliferation, apoptosis, and tumorigenicity ability of human buccal squamous cell carcinoma cell line BcaCD885. Int J Nanomedicine. 2010;5:401–405. | ||
Tang JH, Xie L, Zhang B, Qiu T, Qi B, Xie HP. Preparation of strongly fluorescent silica nanoparticles of polyelectrolyte-protected cadmium telluride quantum dots and their application to cell toxicity and imaging. Anal Chim Acta. 2012;720:112–117. | ||
Smith WE, Brownell J, White CC, et al. In vitro toxicity assessment of amphiphillic polymer-coated CdSe/ZnS quantum dots in two human liver cell models. ACS Nano. 2012;6(11):9475–9484. | ||
Yan M, Zhang Y, Xu K, Fu T, Qin H, Zheng X. An in vitro study of vascular endothelial toxicity of CdTe quantum dots. Toxicology. 2011;282(3):94–103. | ||
Zhang LW, Bäumer W, Monteiro-Riviere NA. Cellular uptake mechanisms and toxicity of quantum dots in dendritic cells. Nanomedicine (Lond). 2011;6(5):777–791. | ||
Zhao Y, Lin K, Zhang W, Liu L. Quantum dots enhance Cu2+-induced hepatic L02 cells toxicity. J Environ Sci (China). 2010;22(12):1987–1992. | ||
Lovrić J, Bazzi HS, Cuie Y, Fortin GR, Winnik FM, Maysinger D. Differences in subcellular distribution and toxicity of green and red emitting CdTe quantum dots. J Mol Med (Berl). 2005;83(5):377–385. | ||
Marmiroli M, Pagano L, Savo Sardaro ML, Villani M, Marmiroli N. Genome-wide approach in Arabidopsis thaliana to assess the toxicity of cadmium sulfide quantum dots. Environ Sci Technol. 2014;48(10):5902–5909. | ||
Peng L, He M, Chen B, et al. Cellular uptake, elimination and toxicity of CdSe/ZnS quantum dots in HepG2 cells. Biomaterials. 2013;34(37):9545–9558. | ||
Nguyen KC, Willmore WG, Tayabali AF. Cadmium telluride quantum dots cause oxidative stress leading to extrinsic and intrinsic apoptosis in hepatocellular carcinoma HepG2 cells. Toxicology. 2013;306:114–123. | ||
Hardman R. A toxicologic review of quantum dots: toxicity depends on physicochemical and environmental factors. Environ Health Perspect. 2006;114(2):165–172. | ||
Yang K, Cao YA, Shi C, et al. Quantum dot-based visual in vivo imaging for oral squamous cell carcinoma in mice. Oral Oncol. 2010;46(12):864–868. | ||
Cao Y, Yang K, Li Z, Zhao C, Shi C, Yang J. Near-infrared quantum-dot-based non-invasive in vivo imaging of squamous cell carcinoma U14. Nanotechnology. 2010;21(47):475104. | ||
Huang H, Bai YL, Yang K, Tang H, Wang YW. Optical imaging of head and neck squamous cell carcinoma in vivo using arginine-glycine-aspartic acid peptide conjugated near-infrared quantum dots. Onco Targets Ther. 2013;6:1779–1787. | ||
Bergers G, Benjamin LE. Tumorigenesis and the angiogenic switch. Nat Rev Cancer. 2003;3(6):401–410. | ||
Xiong JP, Stehle T, Zhang R, et al. Crystal structure of the extracellular segment of integrin alpha Vbeta3 in complex with an Arg-Gly-Asp ligand. Science. 2002;296(5565):151–155. | ||
Cai W, Shin DW, Chen K, et al. Peptide-labeled near-infrared quantum dots for imaging tumor vasculature in living subjects. Nano Lett. 2006;6(4):669–676. | ||
Gao J, Chen K, Xie R, et al. In vivo tumor-targeted fluorescence imaging using near-infrared non-cadmium quantum dots. Bioconjug Chem. 2010;21(4):604–609. | ||
Lu Y, Zhong Y, Wang J, et al. Aqueous synthesized near-infrared-emitting quantum dots for RGD-based in vivo active tumour targeting. Nanotechnology. 2013;24(13):135101. | ||
Qiu J, Feng M, Wei Z, Wang C, Wang X. Antioxidant responses in Carassius auratus and Lolium perenne exposed to the laboratory pollution. Environ Toxicol Pharmacol. 2014;37(2):536–542. | ||
Ren M, Yang S, Li J, Hu Y, Ren Z, Ren S. Ginkgo biloba L. extract enhances the effectiveness of syngeneic bone marrow mesenchymal stem cells in lowering blood glucose levels and reversing oxidative stress. Endocrine. 2013;43(2):360–369. | ||
Gao X, Cui Y, Levenson RM, Chung LW, Nie S. In vivo cancer targeting and imaging with semiconductor quantum dots. Nat Biotechnol. 2004;22(8):969–976. | ||
Karmakar R, Bhattacharya R, Chatterjee M. Biochemical, haematological and histopathological study in relation to time-related cadmium-induced hepatotoxicity in mice. Biometals. 2000;13(3):231–239. | ||
Dufour DR, Lott JA, Nolte FS, Gretch DR, Koff RS, Seeff LB. Diagnosis and monitoring of hepatic injury. II. Recommendations for use of laboratory tests in screening, diagnosis, and monitoring. Clin Chem. 2000;46(12):2050–2068. | ||
Prestwich EG, Roy MD, Rego J, Kelley SO. Oxidative DNA strand scission induced by peptides. Chem Biol. 2005;12(6):695–701. | ||
Oberdörster G, Maynard A, Donaldson K, et al; ILSI Research Foundation/Risk Science Institute Nanomaterial Toxicity Screening Working Group. Principles for characterizing the potential human health effects from exposure to nanomaterials: elements of a screening strategy. Part Fibre Toxicol. 2005;2:8. | ||
Levent G, Ali A, Ahmet A, et al. Oxidative stress and antioxidant defense in patients with chronic hepatitis C patients before and after pegylated interferon alfa-2b plus ribavirin therapy. J Transl Med. 2006;4:25. |
 © 2014 The Author(s). This work is published and licensed by Dove Medical Press Limited. The full terms of this license are available at https://www.dovepress.com/terms.php and incorporate the Creative Commons Attribution - Non Commercial (unported, v3.0) License.
By accessing the work you hereby accept the Terms. Non-commercial uses of the work are permitted without any further permission from Dove Medical Press Limited, provided the work is properly attributed. For permission for commercial use of this work, please see paragraphs 4.2 and 5 of our Terms.
© 2014 The Author(s). This work is published and licensed by Dove Medical Press Limited. The full terms of this license are available at https://www.dovepress.com/terms.php and incorporate the Creative Commons Attribution - Non Commercial (unported, v3.0) License.
By accessing the work you hereby accept the Terms. Non-commercial uses of the work are permitted without any further permission from Dove Medical Press Limited, provided the work is properly attributed. For permission for commercial use of this work, please see paragraphs 4.2 and 5 of our Terms.