Back to Journals » Drug Design, Development and Therapy » Volume 20
Towards Personalized Tacrolimus Dosing Using an Algorithm-Driven Prediction Pipeline for Kidney Transplant
Authors Min J ![]() , Li Q
, Li Q ![]() , Lai W, Liu Z, Chen G
, Lai W, Liu Z, Chen G
Received 17 October 2025
Accepted for publication 29 December 2025
Published 7 January 2026 Volume 2026:20 575125
DOI https://doi.org/10.2147/DDDT.S575125
Checked for plagiarism Yes
Review by Single anonymous peer review
Peer reviewer comments 2
Editor who approved publication: Professor Anastasios Lymperopoulos
Jianliang Min,1– 3,* Qihao Li,1,3,* Weijie Lai,1,3,* Zi Liu,4 Guodong Chen1,3
1Department of Organ Transplantation Center, The First Affiliated Hospital of Sun Yat-Sen University, Guangzhou, People’s Republic of China; 2School of Medicine, Jiaying University, Meizhou, People’s Republic of China; 3Guangdong Provincial Key Laboratory of Organ Medicine, The First Affiliated Hospital of Sun Yat-Sen University, Guangzhou, People’s Republic of China; 4School of Information Engineering, Jingdezhen Ceramic University, Jingdezhen, People’s Republic of China
*These authors contributed equally to this work
Correspondence: Guodong Chen, Email [email protected]
Background: Tacrolimus (TAC) dosing presents a persistent challenge in postoperative care owing to its narrow therapeutic window and high inter‑patient variability, which often leads to suboptimal exposure with increasing risks of nephrotoxicity or graft rejection. Algorithm‑based personalized dosing strategies offer a promising approach to support clinical decision and improve long‑term outcomes.
Methods: Unlike approaches relying on a wide range of variables and local clinical scopes, this study proposed a novel and versatile algorithm-driven strategy to predict TAC doses. A hybrid optimization method was first employed to identify a minimal set of key clinical factors. These factors were then used to construct a cascaded deep forest model capable of predicting both follow‑up and initial TAC doses in adult kidney transplant recipients.
Results: When validated on 615 patients using leave-one-subject-out cross-validation, it achieved predictions within ± 20% of actual values, with an accuracy of 89.8% for follow-up doses and 83.2% for initial doses. Independent external validation confirmed its robustness. A Shapley additive explanation analysis revealed significant correlations between input features and predictive doses. To support real-time clinical use, an open‑access web platform was provided (http://www.jcu-qiulab.com/tacp/).
Conclusion: This approach offers a practical, effective, and algorithm-driven pipeline for automated drug dose analysis and prediction in clinical practice.
Keywords: renal transplant, tacrolimus, cascaded deep forest, personalized dosing, artificial intelligence, AI
Introduction
TAC is the cornerstone of immunosuppressive therapy after kidney transplantation, yet its dosing is challenging due to its narrow therapeutic window and high pharmacokinetic variability.1 Inaccurate dosing carries severe clinical consequences: subtherapeutic levels increase the risk of acute rejection and graft loss, whereas supratherapeutic levels can lead to toxicity, including nephrotoxicity, neurotoxicity, hypertension, and opportunistic infections.2,3 Long-term under- or overexposure to TAC puts transplant recipients at great risk of death. Consequently, therapeutic drug monitoring (TDM) is routinely employed to guide dosing during stable graft function.4 However, TDM is inherently reactive and has no predictive power. Clinicians must therefore adjust doses iteratively based on monitoring results – a repetitive but essential task to maintain target therapeutic levels such as 5–10 ng/mL.5,6 Adding to the complexity, TAC pharmacokinetics vary considerably between and within patients,7,8 influenced by demographics, genetics, laboratory data and drug combinations, etc. Early approaches to dose prediction relied on pharmacokinetic (PK) models, particularly population PK (popPK) models.9,10 For instance, Zhu et al developed a genotype-informed popPK model based on CYP3A5, CYP3A4, and POR polymorphisms.11 While such models have been extensively reviewed,12 their application requires specialized pharmacodynamic knowledges. Importantly, a key challenge is how to investigate and leverage vast electronic medical data to address the variability and achieve precise TAC dosing. To enhance precision and reduce repetitive workload, there is growing interest in developing automated personalized dosing strategies.13,14
With its strength in pattern recognition and machine learning from diversified data, AI is a powerful tool capable of presenting a transformative approach to these challenges. AI-based models have emerged as a promising alternative to traditional popPK models, as they can use any amount and type of factors without predefined assumptions to enhance its predictive capacity.15,16 Recently, traditional machine learning techniques such as linear regression (LR), random forest (RF), support vector regression (SVR), and multi-model comparison, have been widely applied to predict TAC doses.17–20 However, the outcomes of related studies often vary greatly owing to random dataset division.18,21 Moreover, in clinical practice, it is essential to prioritize a limited set of key variables for dosing prediction. Instead of indiscriminately including numerous variables merely to improve model performance, a focused approach should ensure few clinical factors that are available and applicable. This not only improves model stability and generalization across different settings but also builds clinical credibility through interpretable variables to enable dosing decisions. Thus, strategies to confirm and synthesize numerous factors require further investigation to avoid model designs burdened by excessive variables or poor clinical applicability. Furthermore, dosing models should account for variations in target therapeutic ranges across different clinical centers and treatment phases. For example, a typical trough concentration (C0) target after transplantation is suited at 5–10 ng/mL during the first month and 6–8 ng/mL thereafter.22 However, others may adopt a higher (8–12) or lower (4–7) target.6,23 Very few studies have addressed this limitation. Additionally, numerous studies lack tools that are usable in clinical practice, which limits model implementation, broader validation, and iterative updates.
This study aimed to develop a clinical-oriented prediction pipeline for forecasting both follow-up and initial doses of TAC in adult kidney recipients (Figure 1). We also investigated whether key factors derived from various variables could effectively predict dosing requirements. The key contribution of this study is the development of a clinically applicable pipeline that achieves significant predictive accuracy with minimal variables. A limited number of factors were initially identified through a genetic algorithm (GA) combined with a random restart hill climbing (RRHC) algorithm, which integrated global optimization and local refinement. On this basis, the cascaded deep forest (CDF) model was developed to achieve superior predictive performance. Unlike traditional deep models, this tree-based ensemble approach is robust, and does not require large samples or high-dimensional features. Motivated by the literatures,24–26 it integrated three estimators: categorical boosting regression (CBR), gradient boosting regression (GBR) and natural gradient boosting regression (NGBR). In particular, the leave-one-subject-out (LOSO) validation was used to evaluate the proposed method. Finally, a web platform that provided real-time dosage predictions was available at http://www.jcu-qiulab.com/tacp/.
 |
Figure 1 A flow framework of algorithm-based personalized TAC dosing. |
Materials and Methods
Study Recipients
The record of 1013 Chinese kidney transplant patients at Sun Yat-sen University First Affiliated Hospital from Jan 2015 to Apr 2019 was retrospectively collected. Eligible patients received TAC as part of an immunosuppressive regimen after transplantation and underwent TAC twice a day, that is every 12 h. A flow diagram of the data-collection process is presented in Figure 2. A sample of 143 patients with missing or incorrect data was excluded (eg, CYP3A5), along with 135 patients who did not adhere to TAC medication instructions (dosage, frequency, and record). These patients accounted for 69.8% of excluded patients. A further 62 patients were excluded for not receiving TAC, preoperative use, or combined cyclosporine (CsA). A small number of samples with abnormal data were not considered. The current analysis also excluded TAC use in pediatric patients, given the limited sample size and its significant differences from the adult population. Finally, 615 qualified patients with 2927 cases of TAC daily doses were included. This retrospective study utilized anonymized data with strict measures, and the requirement for informed consent was waived by the Ethics Committee of the First Affiliated Hospital of Sun Yat-sen University (Approval No. 2022–166). The study was conducted in accordance with the principles of the Declaration of Helsinki. In addition, all organs were donated voluntarily with written informed consent in accordance with the Declaration of Istanbul.
 |
Figure 2 The data collection flowing. |
Data Preparation
Continuous and categorical factors were collected from the electronic and recontact records, gathering 26 and 33 variables per patient for follow-up and initial dose prediction, respectively. Collected variables included demographics (age, sex, and weight), metabolic genotypes, drug combination, surgical details (operation time/type, transfusion, and induction therapy), adverse events, and laboratory data, as shown in Table 1. Laboratory data corresponding to multiple time points included the last preoperative data, the first postoperative data, and the nearest neighbor data. All recorded data must have a unified format by removing spaces, abnormal characters, and repeated/outlier values. One-hot encoding was used for categorical variables, with a special value of −1 assigned to missing data. The initial model included all variables except complications/adverse events, particularly the last preoperative and first postoperative laboratory data. Conversely, the follow-up dose model incorporated all factors along with the nearest neighbor lab data. In addition, it also adopts prior knowledge of dosing, such as the previous dose, its corresponding C0, and the postoperative days (POD) of C0. In particular, both models included the target C0 and its corresponding POD. Finally, the features were normalized using RobustScaler based on the interquartile range (IQR; 25th to 75th percentiles) to ensure algorithm convergence and model robustness.27
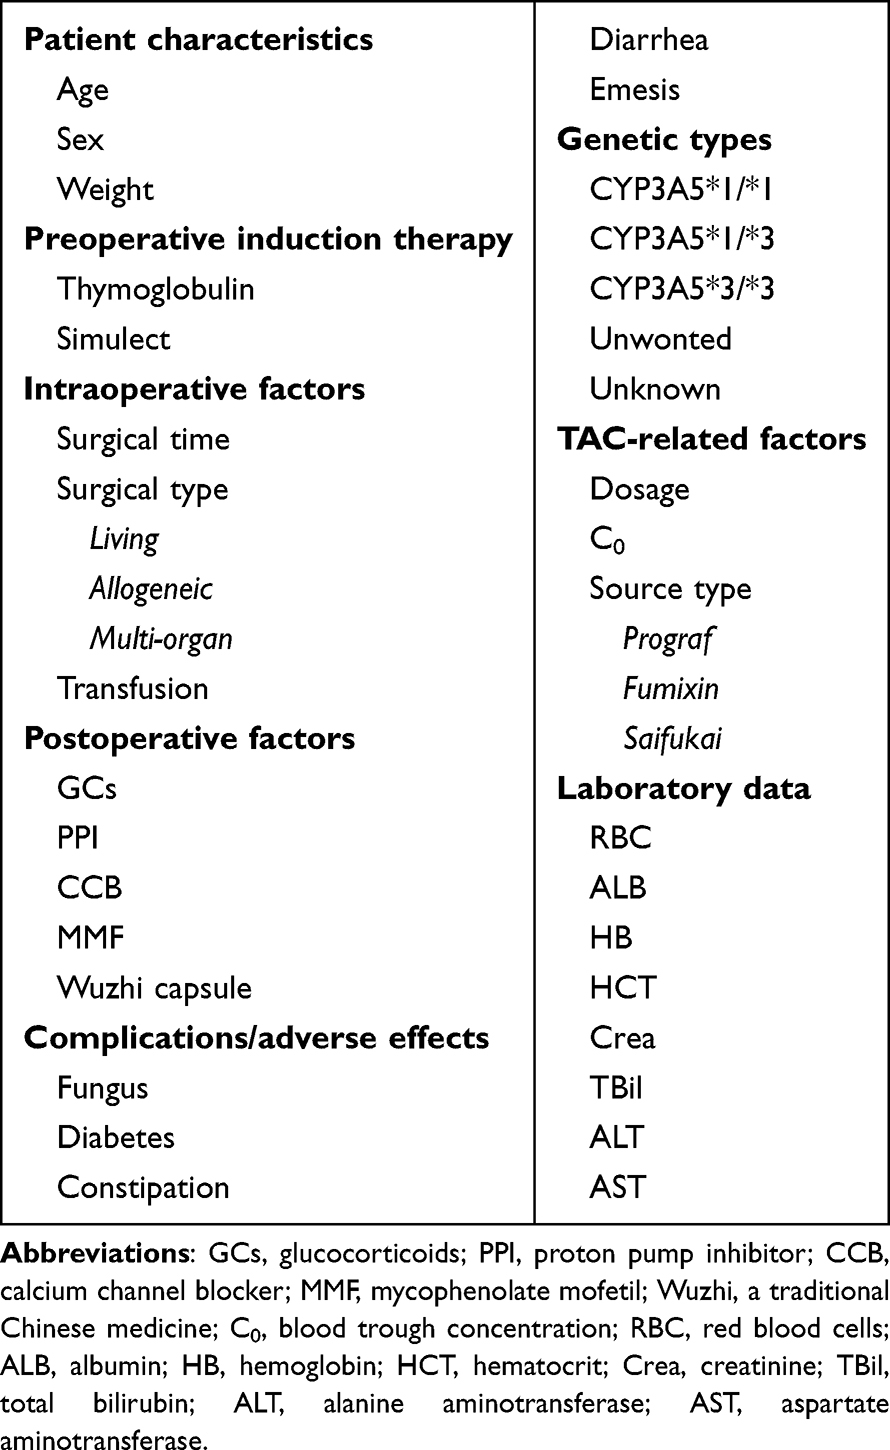 |
Table 1 Collected Clinical Factors for the Inputs |
Model Development
To identify clinically applicable variables, we designed a hybrid approach that combined GA with RRHC (Figure 3). GA simulates natural evolution to search for an optimal solution in large spaces, enabling robust global optimization across various fields.28,29 For each individual, a fitness function was used to evaluate the selection performance. Three boosting regressors, CBR, GBR, and NGBR, sequentially served as the fitness function to identify the top candidates, with the optimal individual selected by majority voting. Table 2 lists the parameters of these three regressors. RRHC was then used for a local fine search. Its restart operation enhances the global optimum by generating diverse starting points; this is a simple yet effective search strategy.30 The final best choice was also confirmed by voting. R-square (R2) was introduced to measure the performance as follows:
 |
Table 2 The Parameters of the Used Algorithms in Both Models |

 |
Figure 3 The GA-RRHC algorithm for few key clinical variables. It employs binary encoding to represent feature selection status. The GA toolbox is achieved using the DEAP python library (DEAP 1.4.1 available at https://pypi.org/project/deap/), with the core steps including population, fitness, selection, crossover and mutation. For RRHC, it is a simple, greedy, and easy-to-implement heuristic optimizer. |
where  is the predicted dose,
  the actual dose,
  the mean value of the actual dose, and n the sample number.
The CDF predictive model has its own unique structure and characteristics31 (Figure 4). Unlike traditional models, this tree-based ensemble method eliminates extensive sample/feature requirements owing to its deep cascading architecture, which makes it ideal for limited clinical data. By outperforming most algorithms in terms of speed and efficiency, CDF can achieve excellent prediction at a manageable cost. As illustrated, it adopts a multilayer structure with each layer comprising multiple estimators. These estimators learn feature information from the input features and pass the processed information to the next layer. Each layer incorporates various estimators to enhance the model robustness. First, a Binner is used to reduce the number of split candidates when constructing decision trees. Subsequently, different variant estimators were trained using the binned data in the first cascaded layer. The generated augmented features are concatenated with the original features of the binned data to serve as new training features for the next layer. Before the final cascaded layer, the predicted values from multiple learners are aggregated to determine the final prediction result.
 |
Figure 4 The framework of cascaded deep forest (CDF). In this model, each layer consists of two CBR, two GBR and two NGBR, with different layers sharing the same structure. The number of cascade layers can be adaptively determined by data complexity and sample size. The corresponding toolbox (deep-forest 0.1.7) is available at https://pypi.org/project/deep-forest/. |
In addition, the core parameters (n_estimators/learning_rate) for CBR, GBR, and NGBR were optimized via a grid search (Table 2), whereas the others retained library default values. All experiments were carried out in Python 3.7.1, employing scikit-learn for data-driven modeling.32 The other metrics used to measure model performance were as follows:
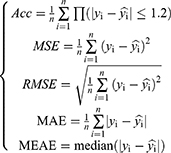
where  is the indicator function, which takes the value 1 if the condition inside the parentheses is true and 0 otherwise, due to the minimum TAC is 0.5 mg in our transplant department. Similarly, the percentage of predicted doses within ±20% of the actual dose was calculated. Moreover, a Shapley additive explanation (SHAP) was used to show each feature contributing to pushing the model output, providing a reasonable explanation for clinical variables.33 It is a popular method for interpreting the prediction of machine learning algorithms and is available at https://pypi.org/project/shap/ (shap 0.42.1).
Validation Technique
LOO (Leave-one-out) is a special form of K-fold cross-validation, where K = N, and N is the total number in the dataset. In each iteration, one sample was used as the testing set and the remaining N-1 samples were used as the training set. This process was repeated N times and the final performance was averaged. Although this approach provides a robust evaluation of the model performance, it fails to measure the generalization capability of the model for new individuals. LOSO is a variant of LOO.34 In each iteration, all samples from one subject were used as the testing set, whereas the data from the remaining subjects constituted the training set. This technique can accurately reflect clinical practice, requiring that the model be generalized to novel patient cases.
Results
Selection of Factors to Be Suitable for Clinical Usage
As illustrated in Table 3, the GA-RRHC algorithm reduces the feature dimension by filtering out approximately 60% of the non-essential factors. This enables clinically actionable TAC dosing decisions for both follow-up and initial prediction, based on a concise set of features. Specifically, variables TC0, TC0_POD, preC0, preC0_POD, and preDose24h required no additional measures, whereas only the clinical factors Wuzhi, Crea_NN, ALT_NN, and AST_NN required continuous monitoring in follow-up dose prediction. Wuzhi is a binary indicator of Wuzhi capsules prior to the current TAC. Meanwhile, initial dose prediction typically requires more variables because of multiple influencing factors. Beyond the same factors (TC0, TC0_POD, Wuzhi, and Crea) included demographics (age, weight, and sex), concomitant drugs (CCB and MMF), operational details (firstT_POH and surgType), genotype CYP3A5, and lab data(HB). Similarly, although 13 clinical factors inform the initial dose model, only Crea, HB, and CYP3A5 levels require laboratory testing. The clinical significance and model contributions of these factors were discussed in detail.
 |
Table 3 The Clinical Variables Selected by GA-RRHC for Both Models |
Model Performance of Selected vs Original Variables
Model performance should be preserved with reduced clinical variables, confirming the efficacy of the selected features in Table 4. Three base estimators assessed predictive performance using both the original and selected key factors. Both variable sets achieved mean follow-up predictions with Acc > 90% and R2 > 0.80. The mean performance was lower for the initial dosing with smaller samples (Acc: 76.7% vs 79.0%; R: 0.369 vs 0.407). Follow-up dose prediction maintained the performance despite feature reduction, while initial dose prediction improved significantly, with the main metrics (Acc, R2) increasing by 2.3% and 0.038, respectively. This further indicates that redundant features can impair the initial dose prediction. It is intrinsically more challenging than follow-up prediction because of numerous underlying factors, making rigorous feature selection essential.
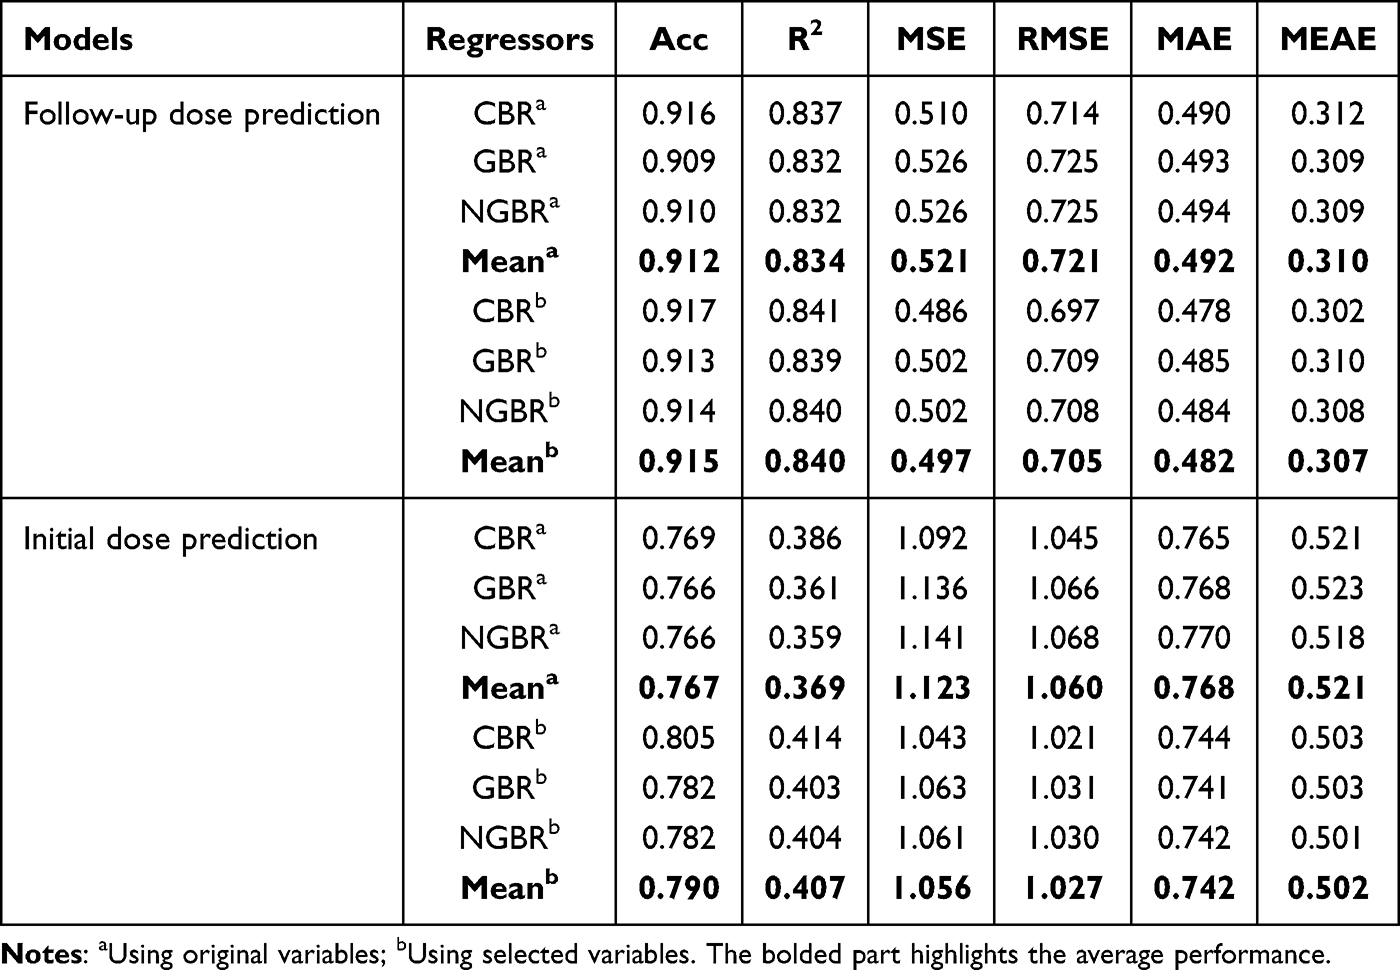 |
Table 4 Performance Comparison of Original vs Selected Variables |
In addition, for other metrics such as MSE, RMSE, MAE and MEAE, the predictive follow-up TAC dosing errors remained within 0.5 mg daily, while initial dose deviations reached ≤1.0 mg daily [0.5 mg per TAC in our center]. This further demonstrated the efficacy of the proposed GA-RRHC algorithm in the selection of pivotal clinical features. For a single estimator, CBR exhibited optimal predictive performance in both models, indicating its inherent superiority in feature processing and prediction capabilities. However, ensemble learning, which integrates these estimators, can yield more robust and stable dosing predictions.
Selected Variable Results Using CDF and LOSO
Ensemble learning is a powerful machine-learning paradigm that can effectively address the limitations of individual estimators. Owing to the cascaded deep structure, CDF was used to predict the final dosages based on selected factors. Using LOSO, Figure 5a reveals a strong positive correlation between the predicted and actual values in follow-up dose prediction. As shown in Figure 5b, the accuracies reached 0.918 and 0.915 for both validation methods, with R2 values of 0.850 and 0.849, respectively. This indicates minimal performance degradation when using rigorous cross-validation, demonstrating both the validity of the GA-RRHC-based variable selection and the generalization capability of the CDF. In addition, Figure 5c illustrates the proportion of predicted doses over time, which falls within an error of ±20% compared to the actual doses with both validation methods. Follow-up dose prediction during different periods yielded an accuracy of >85%, implying that our proposed method can be applied for dose prediction in different TAC dosing periods.
 |
Figure 5 LOSO-validated performance using selected factors in follow-up dose prediction: (a) Relationship between the predicted and actual doses by LOSO; (b) Comparison of key metrics using CDF based on selected variables by LOO/LOSO; (c) Accuracies over periods within ±20% of actual doses, divided into 3 periods: up to day 3, from day 4 to 7, and beyond day 8. |
We also applied CDF to predict the initial doses using LOSO based on a few selected factors. As shown in Table 5, the model achieved an Acc of 0.812 and R2 of 0.423, with other metrics of 0.998, 0.999, 0.729, and 0.496. Although the initial dose prediction showed inferior performance to the follow-up dose prediction, it still achieved significant enhancements compared to the manual decision of TAC dosing. The model accuracy and stability are expected to improve with additional samples, particularly for the initial doses. The results of the LOSO validation confirmed the robustness of both the models based on a few selected clinical variables.
 |
Table 5 Initial Dose Prediction Performance Using Selected Factors by LOSO |
Discussion
TAC-based immunosuppressive drugs significantly reduce acute, corticosteroid-resistant, and chronic rejection post-transplant while improving graft function and lowering viral infection rates.1,35 However, a narrow therapeutic window is required to prevent nephrotoxicity against the risk of rejection. This complex process faces uncertainties due to individual variability, clinical expertise, and treatment duration. Precision dosing strategies are essential for long-term TAC therapy, rather than relying solely on clinicians’ repetitive subjective decisions. Indeed, 50–70% of dosing was reportedly outside the target range, especially in the early posttransplant period.36,37 Instead, the algorithm-based approach has great potential for solving the issue of personalized drug administration. This study proposes an algorithmic pipeline to optimize variable selection for the clinical-oriented dosing prediction of TAC using a flexible and universal framework. The LOSO-validated results confirmed good performance of the proposed model: follow-up dose prediction achieved an accuracy and R2 of 0.915 and 0.849, respectively, compared with 0.812 and 0.423 for the initial dose prediction. The accuracies within ±20% of the actual values were 89.8% and 83.2%, respectively. These results were superior to those of a recent study using a deep learning algorithm to predict TAC doses in kidney transplant recipients.17 As shown in Figure 6, our model outperformed others across all evaluation metrics, except for a comparable MAE in the Chinese population. The proposed method provides an effective recommendation while utilizing fewer factors and LOSO validation, particularly demonstrating high accuracy in follow-up dose prediction.
 |
Figure 6 Comparative performance in follow-up dose prediction. |
We further compared two previous models for initial dose prediction in the Chinese population.38,39 All samples with CYP3A5 genotype data were included in the verification queue. The initial dose algorithms were appropriately modified by multiplying a correction factor to achieve a reasonable range for target C0 of 5–10 ng/mL.12,40 As shown in Table 6, our initial model achieved the accuracies of 0.832, 0.890, and 0.927 within ±20%, ±30%, and ±40% of actual doses, respectively, surpassing all other initial dose algorithms. Moreover, the algorithm incorporated the Wuzhi factor, aligning with the report that Wuzhi capsules elevate TAC concentration in the Chinese population.41 Although the initial model outperformed other methods, its performance (Acc/R2 = 0.812/0.423) remains significantly lower than that of the follow-up dose model, suggesting a considerable predictive uncertainty during the initial dosing phase. It indicates that the model has a limited capability to capture individual variations at the initial stage, which may lead to potential bias in real-world applicability and require more cautious cooperation by clinicians. The model could be further refined by updates based on larger sample pools and expanded clinical data from both donors and recipients.42 In addition, future iterations could explore incorporating deeper mechanistic or dynamic factors. For instance, incorporating factors such as the gut microbiome profile or major drug-drug interactions may help explain residual PK variability in initial dosing.
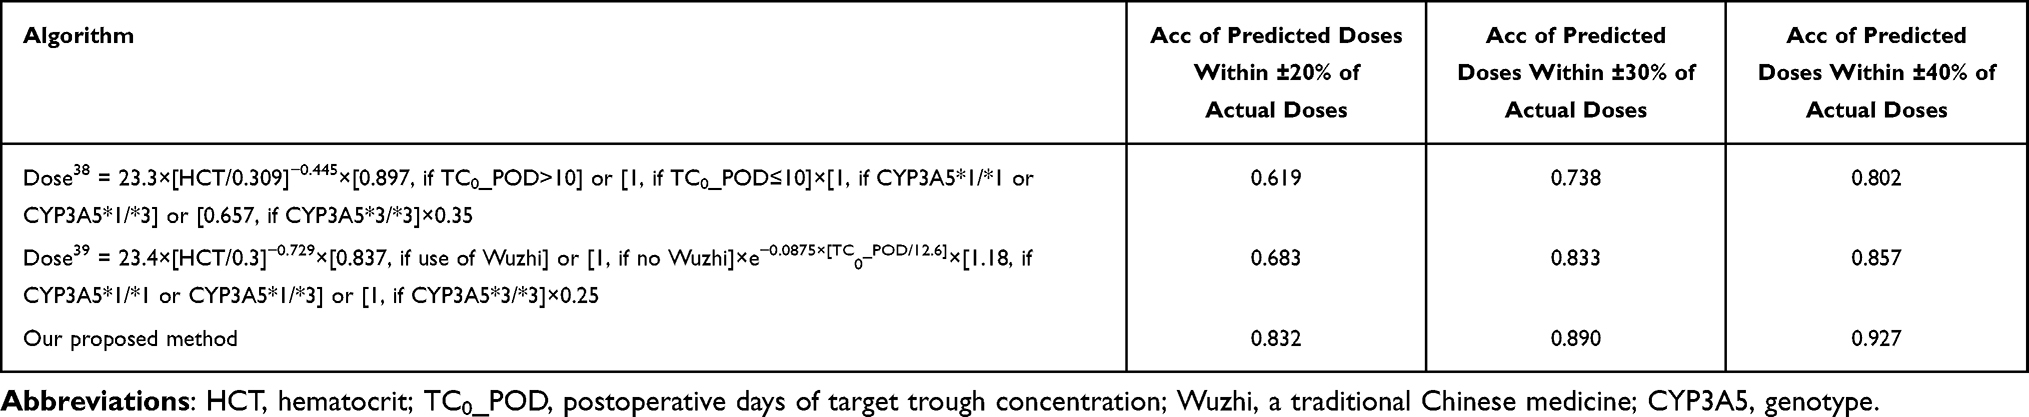 |
Table 6 The Comparison for Initial Dose Prediction with Previous Studies |
The CDF achieved optimal prediction performance using the feature factors selected by the GA-RRHC. The GA’s global search capability thoroughly explores the feature space to avoid local optima, whereas RRHC refines key feature selection through iterative local optimization. Their synergy optimizes feature selection efficiency, enabling the rapid identification of highly predictive clinical variables for improved model accuracy. In addition, CDF is an effective and powerful tool for data-driven prediction. Its cascade architecture and ensemble learning enable a potent data representation with minimal hyperparameters and features. The base evaluator comprises trees, as shown in Figure 4. Tree-based approaches offer enhanced interpretability and facilitate reliable clinical decision-making.43 Under unique settings in the clinical application of kidney transplants, the GA-RRHC-CDF algorithm provides an automated pipeline that delivers superior performance in selecting few critical factors and predicting dosages. The algorithm was also applied for the first time to predict the TAC dosage.
SHAP was used to further explain the contribution of the input clinical variables. It uses the Shapley values from game theory to explain model output.44 Figure 7A shows that the previous daily dose (preDose24h) and its corresponding C0 (preC0) significantly influenced the follow-up dose, accounting for nearly 80% of the total dose. This explains why follow-up dose prediction is easier than initial dose prediction, because it incorporates prior knowledge. Additionally, Wuzhi capsules significantly reduced TAC dosing in Chinese patients (observed as left-shifted red dots in both models in Figure 7), which is consistent with numerous previous reports.45 Notably, target C0 (TC0) can critically define different rational ranges of C0, whereas the postoperative days of both target C0 and C0 positively influence the dosing phases. These are crucial for establishing a holistic personalized dosing framework for TAC across clinical centers and treatment phases. Analysis revealed that higher target C0 correlates with increased dosing tendency; longer postoperative days of previous C0 correspond to reduced dosing; and dosing for postoperative days of target C0 follows an inverted U-shaped pattern, escalating and then decreasing during the mid-interval period. Our findings also verified that an increase in Crea, AST, and ALT enabled TAC dose reduction in a follow-up model.40,46,47 Follow-up dosing is pivotal to maintain a stable concentration and ensure therapeutic safety. This provides potential guidance for dosage decisions based on a few clinical factors. Initial dose prediction faces a more complex challenge owing to multiple underlying factors. Six key variables, namely target C0 (TC0), weight, Wuzhi capsules, Crea, postoperative hours of first TAC administration (firstT_POH), and postoperative days of target C0 (TC0_POD) collectively accounted for 80% of the contribution as primary factors identified in our analysis (Figure 7B). Additionally, variables such as sex, CYP3A5, HB, and CCB each contributed >3% as secondary factors. Our summary plot also indicated that the increase in target C0, weight, postoperative hours of first TAC administration, postoperative days of target C0, CCB, male sex, living transplant, and CYP3A5*1 enabled the TAC dose to increase in the initial model. These factors can provide clinical guidance for TAC initial dosing.
 |
Figure 7 SHAP feature importance and summary plot: (A) In follow-up dose prediction; (B) In initial dose prediction. The mean (|SHAP| value) represents the average influence of features on model outputs. The higher the importance of the mean, the more likely that a factor contributes to the model. While the summary plot helps to understand the direction of the influence of clinical factors on model output. The positive SHAP value has an upward influence on the prediction of dose, while the negative has a downward influence. Among, the red dots and blue dots respectively describe the high and low values of the corresponding features. [CYP3A5_A, *1/*1; CYP3A5_B, *1/*3; CYP3A5_C, *3/*3; CYP3A5_D, unwonted; CYP3A5_O, unknown; Sex_A, male; Sex_B, female; surgType_A, allogeneic; surgType_B, living; surgType_C, multi-organ.]. |
Although LOSO-based cross-validation yielded good results, extensive external validation is a crucial step for promoting the clinical application of algorithm-based TAC dosing.48 Thus, we collected a completely new independent external test set comprising 116 transplant patients (May 2023–August 2023). In the independent external validation, the follow-up dose prediction achieved an Acc of 0.904 and an R2 of 0.828, whereas the initial dose prediction results were 0.784 and 0.395, respectively. Furthermore, a Bland-Altman plot was drawn for both models. This statistical method was used to assess the agreement between the two measures. As shown in Figure 8, the mean biases for two models were −0.10 mg and −0.11 mg (red dashed lines), respectively, indicating a slight systematic underestimation tendency, albeit to a minor degree. The 90% limits of agreement (LoA) were [−1.32, 1.13] mg and [−1.65, 1.43] mg (solid purple lines), indicating that 90% of the prediction differences fell within these ranges. Moreover, the clinically acceptable daily dose difference range (light green area) covered the majority of data points (approximately 92%~94%), indicating that the overwhelming majority of single-dose errors were controlled within 1 TAC tablet for follow-up dose prediction and within 1.5 TAC tablets for initial dose prediction (0.5 mg/tablet). The above analysis demonstrated that the training prediction model performed well in independent external validation.
 |
Figure 8 Bland-Altman plot for external validation of dosage prediction model: (A) In follow-up dose prediction; (B) In initial dose prediction. |
Despite encouraging results, particularly in follow-up dose prediction, this clinical-oriented, algorithm-based framework for personalized TAC dosing presents several limitations. Though LOSO was adopted to validate the model, it is still necessary to conduct multi-center prospective validation and broader external validation, especially for initial dosage prediction. The model’s applicability to patient subgroups, such as those with comorbid liver dysfunction or other complications, requires further investigation with larger samples. Furthermore, the lack of clinical assessment and formal evaluation of therapeutic outcomes such as rejection rates, toxicity reduction, or graft survival prevents the broadly usage of algorithm in real-world clinical utility. The usage of algorithms still requires the cooperation with professional clinicians. In conclusion, this study provides an efficient and accessible framework for TAC dose prediction, available through an online platform at http://www.jcu-qiulab.com/tacp/. This tool can help reduce repetitive workload and support precision dosing for clinicians. The algorithmic strategies for personalized dosing represent a promising direction and will continue to receive increasing attention.
Conclusion
To streamline the clinical workload and enable precision dosing, this study proposes an automated pipeline based on the GA-RRHC-CDF algorithm to predict both follow-up and initial doses of TAC based on a few selected factors in kidney transplants. The results demonstrate that the proposed methodology exhibits good performance. The follow-up dose prediction achieved high Acc (0.915) and R2 values (0.849). While the initial dose prediction yielded lower metrics (Acc = 0.812, R2 = 0.423), it still outperformed the manual dosing performance. Meanwhile, it yielded a prediction within ±20% of the actual values with accuracies of 89.8% and 83.2%, respectively. Based on these results, a user-friendly prediction platform has been developed and made publicly available to support clinical usage. It should be noted, however, that the proposed model operates on a selected set of variables and does not account for the full complexity of individual patients, such as dynamic complications or detailed drug-drug interactions. Its predictions should therefore be interpreted with caution and integrated into clinical decision by clinicians. Future prospective validation studies should include more diverse populations, such as pediatric patients and multi-ethnic cohorts from various geographical regions. These studies would benefit from being conducted within larger, multi-center or international cohorts. In short, the proposed method has the potential to be extended to other therapeutic areas that require algorithm-based dose prediction.
Availability of Supporting Data
Data will be made available by Guodong Chen upon reasonable request.
Ethics Approval and Consent to Participate
This retrospective study utilized anonymized data with strict measures, and the requirement for informed consent was waived by the Ethics Committee of the First Affiliated Hospital of Sun Yat-sen University (Approval No. 2022-166). The study was conducted in accordance with the principles of the Declaration of Helsinki. In addition, all organs were donated voluntarily with written informed consent in accordance with the Declaration of Istanbul.
Funding
This study was supported by the Guangdong Provincial Natural Science Foundation (2024A1515010473) and “Keling New Star” Talent Project of the First Affiliated Hospital of Sun Yat-sen University (Y50176). Guangdong Provincial Key Laboratory Construction Projection on Organ Donation and Transplant Immunology (2017B030314018), Guangdong Provincial International Cooperation Base of Science and Technology (Organ Transplantation) (2015B050501002), and the Startup Foundation for Talents of Jiaying University (2023RC32).
Disclosure
The authors report no conflicts of interest for this work.
References
1. Staatz CE, Tett SE. Clinical pharmacokinetics and pharmacodynamics of tacrolimus in solid organ transplantation. Clin Pharmacokinet. 2004;43(10):623–16. doi:10.2165/00003088-200443100-00001
2. Verona P, Edwards J, Hubert K, et al. Tacrolimus-induced neurotoxicity after transplant: a literature review. Drug Safety. 2024;47(5):419–438. doi:10.1007/s40264-024-01398-5
3. Hooks MA. Tacrolimus, a new immunosuppressant—a review of the literature. Ann Pharmacother. 1994;28(4):501–511. doi:10.1177/106002809402800414
4. Leino AD, Takyi-Williams J, Pai MP. Volumetric absorptive microsampling to enhance the therapeutic drug monitoring of tacrolimus and mycophenolic acid: a systematic review and critical assessment. Therapeutic Drug Monitoring. 2023;45(4):463–478. doi:10.1097/FTD.0000000000001066
5. Borra LC, Roodnat JI, Kal JA, et al. High within-patient variability in the clearance of tacrolimus is a risk factor for poor long-term outcome after kidney transplantation. Nephrol Dial Transplant. 2010;25(8):2757–2763. doi:10.1093/ndt/gfq096
6. Meziyerh S, van Gelder T, Kers J, et al. Tacrolimus and mycophenolic acid exposure are associated with biopsy‐proven acute rejection: a study to provide evidence for longer‐term target ranges. Clin Pharmacol Ther. 2023;114(1):192–200. doi:10.1002/cpt.2915
7. Undre NA. Pharmacokinetics of tacrolimus‐based combination therapies. Nephrol Dial Transplant. 2003;18(suppl_1):i12–i15. doi:10.1093/ndt/gfg1029
8. Degraeve AL, Moudio S, Haufroid V, et al. Predictors of tacrolimus pharmacokinetic variability: current evidences and future perspectives. Expert Opin Drug Metab Toxicol. 2020;16(9):769–782.
9. Andrews LM, Hesselink DA, van Gelder T, et al. A population pharmacokinetic model to predict the individual starting dose of tacrolimus following pediatric renal transplantation. Clin Pharmacokinet. 2018;57(4):475–489. doi:10.1007/s40262-017-0567-8
10. Hoffert Y, Dia N, Vanuytsel T, et al. Model-informed precision dosing of tacrolimus: a systematic review of population pharmacokinetic models and a benchmark study of software tools. Clin Pharmacokinet. 2024;63(10):1407–1421.
11. Zhu W, Xue L, Peng H, et al. Tacrolimus population pharmacokinetic models according to CYP3A5 / CYP3A4 / POR genotypes in chinese han renal transplant patients. Pharmacogenomics. 2018;19(13):1013–1025. doi:10.2217/pgs-2017-0139
12. Schagen MR, Volarevic H, Francke MI, et al. Individualized dosing algorithms for tacrolimus in kidney transplant recipients: current status and unmet needs. Expert Opin Drug Metab Toxicol. 2023;19(7):429–445. doi:10.1080/17425255.2023.2250251
13. Arjmandmazidi S, Heidari HR, Ghasemnejad T, et al. An In-depth overview of artificial intelligence (AI) tool utilization across diverse phases of organ transplantation. J Transl Med. 2025;23(1):678.
14. Li QY, Tang B-H, Wu Y-E, et al. Machine learning: a new approach for dose individualization. Clin Pharmacol Ther. 2024;115(4):727–744. doi:10.1002/cpt.3049
15. Rajpurkar P, Chen E, Banerjee O, et al. AI in health and medicine. Nature Med. 2022;28(1):31–38. doi:10.1038/s41591-021-01614-0
16. Abdalla Y. Applying Machine Learning Methods to Pharmaceutical Datasets for Developing Personalised Medicinal Products. UCL (University College London); 2025.
17. Zhang Q, Tian X, Chen G, et al. A prediction model for tacrolimus daily dose in kidney transplant recipients with machine learning and deep learning techniques. Front Med. 2022;9:813117. doi:10.3389/fmed.2022.813117
18. Choshi H, Miyoshi K, Tanioka M, et al. Long short-term memory algorithm for personalized tacrolimus dosing: a simple and effective time series forecasting approach post-lung transplantation. J Heart Lung Transplant. 2025;44(3):351–361. doi:10.1016/j.healun.2024.10.026
19. Leard LE, Blebea C. The transformation of transplant medicine with artificial intelligence-assisted tacrolimus dosing. J Heart Lung Transplant. 2025;44(3):362–363. doi:10.1016/j.healun.2024.11.029
20. Liang H, Xuan Q, Liu C, et al. Machine learning-assisted tacrolimus dose optimization in childhood-onset systemic lupus erythematosus through population pharmacokinetic modeling. Comput Biol Med. 2025;196:110782. doi:10.1016/j.compbiomed.2025.110782
21. Min J, Li Q, Lai W, et al. Clinical-oriented tacrolimus dosing algorithms in kidney transplant based on genetic algorithm and deep forest. Front Pharmacol. 2025;16:1656197. doi:10.3389/fphar.2025.1656197
22. Jia J-J, Lin BY, He JJ, et al. “Minimizing tacrolimus”strategy and long-term survival after liver transplantation. World J Gastroenterol. 2014;20(32):11363. doi:10.3748/wjg.v20.i32.11363
23. Lloberas N, Grinyó JM, Colom H, et al. A prospective controlled, randomized clinical trial of kidney transplant recipients developed personalized tacrolimus dosing using model-based Bayesian prediction. Kidney Int. 2023;104(4):840–850. doi:10.1016/j.kint.2023.06.021
24. Lin W, Wu L, Zhang Y, et al. An enhanced cascade-based deep forest model for drug combination prediction. Briefings Bioinf. 2022;23(2):bbab562. doi:10.1093/bib/bbab562
25. Su R, Liu X, Wei L, et al. Deep-Resp-Forest: a deep forest model to predict anti-cancer drug response. Methods. 2019;166:91–102. doi:10.1016/j.ymeth.2019.02.009
26. Chu Y, Kaushik AC, Wang X, et al. DTI-CDF: a cascade deep forest model towards the prediction of drug-target interactions based on hybrid features. Briefings Bioinf. 2021;22(1):451–462. doi:10.1093/bib/bbz152
27. Thara D, PremaSudha B, Xiong F. Auto-detection of epileptic seizure events using deep neural network with different feature scaling techniques. Pattern Recognit Lett. 2019;128:544–550. doi:10.1016/j.patrec.2019.10.029
28. Tan F, Fu X, Zhang Y, et al. A genetic algorithm-based method for feature subset selection. Soft Comput. 2008;12(2):111–120. doi:10.1007/s00500-007-0193-8
29. Gen M, Lin L. Genetic algorithms and their applications. In: Springer Handbook of Engineering Statistics. Springer; 2023:635–674.
30. Kato ERR, Tsunaki RH. A New Approach to Solve the Flexible Job Shop Problem Based on a Hybrid Particle Swarm Optimization and Random-Restart Hill Climbing. Vol. 125. Computers & Industrial Engineering; 2018:178–189.
31. Zhou Z-H, Feng J. Deep forest. National Sci Rev. 2019;6(1):74–86. doi:10.1093/nsr/nwy108
32. Pedregosa F, Varoquaux G, Gramfort A, et al. Scikit-learn: machine learning in python. J Mach Learn Res. 2011;12:2825–2830.
33. Salih AM, Raisi‐Estabragh Z, Galazzo IB, et al. A perspective on explainable artificial intelligence methods: SHAP and LIME. Adv Intell Sys. 2025;7(1):2400304. doi:10.1002/aisy.202400304
34. Esterman M, Tamber-Rosenau BJ, Chiu Y-C, et al. Avoiding non-Independence in fMRI data analysis: leave one subject out. Neuroimage. 2010;50(2):572–576. doi:10.1016/j.neuroimage.2009.10.092
35. Bowman LJ, Brennan DC. The role of tacrolimus in renal transplantation. Exp Opinion Pharmacother. 2008;9(4):635–643.
36. Shah PB, Ennis J, Cunningham P, et al. The epidemiologic burden of tacrolimus variability among kidney transplant recipients in the United States. Am J Nephrol. 2019;50(5):370–374. doi:10.1159/000503167
37. Sikma MA, Hunault CC, Van Maarseveen EM, et al. High variability of whole-blood tacrolimus pharmacokinetics early after thoracic organ transplantation. Eur J Drug Metabol Pharmacokinetics. 2020;45(1):123–134. doi:10.1007/s13318-019-00591-7
38. Ling J, Dong -L-L, Yang X-P, et al. Effects of CYP3A5, ABCB1 and POR* 28 polymorphisms on pharmacokinetics of tacrolimus in the early period after renal transplantation. Xenobiotica. 2020;50(12):1501–1509. doi:10.1080/00498254.2020.1774682
39. Jing Y, Kong Y, Hou X, et al. Population pharmacokinetic analysis and dosing guidelines for tacrolimus co‐administration with Wuzhi capsule in Chinese renal transplant recipients. J Clin Pharm Therapeutics. 2021;46(4):1117–1128. doi:10.1111/jcpt.13407
40. Staatz CE, Willis C, Taylor PJ, et al. Population pharmacokinetics of tacrolimus in adult kidney transplant recipients. Clin Pharmacol Ther. 2002;72(6):660–669. doi:10.1067/mcp.2002.129304
41. Li J, Chen S, Qin X, et al. Wuzhi tablet (Schisandra sphenanthera extract) is a promising tacrolimus-sparing agent for renal transplant recipients who are CYP3A5 expressers: a two-phase prospective study. Drug Metab Dispos. 2017;45(11):1114–1119. doi:10.1124/dmd.117.076737
42. Rojas LE, Herrero MJ, Bosó V, et al. Meta-analysis and systematic review of the effect of the donor and recipient CYP3A5 6986A>G genotype on tacrolimus dose requirements in liver transplantation. Pharmacogenetics Genomics. 2013;23(10):509–517. doi:10.1097/FPC.0b013e3283642fb3
43. Alzubaidi L, Zhang J, Humaidi AJ, et al. Review of deep learning: concepts, CNN architectures, challenges, applications, future directions. J Big Data. 2021;8(1):53. doi:10.1186/s40537-021-00444-8
44. Winter E. The Shapley Value. In Handbook of Game Theory with Economic Applications. 2002;3:2025–2054.
45. Lu T, Zhu X, Xu S, et al. Dosage optimization based on population pharmacokinetic analysis of tacrolimus in Chinese patients with nephrotic syndrome. Pharm Res. 2019;36(3):45. doi:10.1007/s11095-019-2579-6
46. Gonschior A-K, Christians U, Winkler M, et al. Tacrolimus (FK506) metabolite patterns in blood from liver and kidney transplant patients. Clin Chem. 1996;42(9):1426–1432. doi:10.1093/clinchem/42.9.1426
47. Tang J-T, Andrews LM, van Gelder T, et al. Pharmacogenetic aspects of the use of tacrolimus in renal transplantation: recent developments and ethnic considerations. Expert Opinion Drug Metabol Amp. 2016;12(5):555–565. doi:10.1517/17425255.2016.1170808
48. Hazenbroek M, Pengel LHM, Sassen SDT, et al. Removing the physician from the equation: patient‐controlled, home‐based therapeutic drug self‐monitoring of tacrolimus. Br J Clin Pharmacol. 2025;91(6):1560–1568. doi:10.1111/bcp.16121
 © 2026 The Author(s). This work is published and licensed by Dove Medical Press Limited. The
full terms of this license are available at https://www.dovepress.com/terms
and incorporate the Creative Commons Attribution
- Non Commercial (unported, 4.0) License.
By accessing the work you hereby accept the Terms. Non-commercial uses of the work are permitted
without any further permission from Dove Medical Press Limited, provided the work is properly
attributed. For permission for commercial use of this work, please see paragraphs 4.2 and 5 of our Terms.
© 2026 The Author(s). This work is published and licensed by Dove Medical Press Limited. The
full terms of this license are available at https://www.dovepress.com/terms
and incorporate the Creative Commons Attribution
- Non Commercial (unported, 4.0) License.
By accessing the work you hereby accept the Terms. Non-commercial uses of the work are permitted
without any further permission from Dove Medical Press Limited, provided the work is properly
attributed. For permission for commercial use of this work, please see paragraphs 4.2 and 5 of our Terms.
Recommended articles
Population Pharmacokinetic/Pharmacodynamic Modeling of Tacrolimus in Renal Transplant Recipients: Impact of CYP3A5 Genotype and Wuzhi Capsule Co-Medication

Xiang Q, Yang Y, Li G, Chen S, Yang Y, Liu L, Yu X
Drug Design, Development and Therapy 2025, 19:8375-8389
Published Date: 16 September 2025
An Integrated Population Pharmacokinetic and Machine Learning Model for Predicting Tacrolimus Exposure in Adult Patients with Nephrotic Syndrome
Zhou Y, Zhou Z, Chen S, Zhu L, Yun Y, Yuan Y, Chen C, Zou J, Zhao J
Drug Design, Development and Therapy 2026, 20:576598
Published Date: 23 March 2026