
Back to Journals » Drug Design, Development and Therapy » Volume 19
Population Pharmacokinetic/Pharmacodynamic Modeling of Tacrolimus in Renal Transplant Recipients: Impact of CYP3A5 Genotype and Wuzhi Capsule Co-Medication
Authors Xiang Q, Yang Y, Li G  , Chen S, Yang Y, Liu L, Yu X
Received 11 June 2025
Accepted for publication 20 August 2025
Published 16 September 2025 Volume 2025:19 Pages 8375—8389
DOI https://doi.org/10.2147/DDDT.S542786
Checked for plagiarism Yes
Review by Single anonymous peer review
Peer reviewer comments 3
Editor who approved publication: Prof. Dr. Tin Wui Wong
Qiulin Xiang,1 Yi Yang,1 Guoxing Li,1 Song Chen,1,2 Yingying Yang,1,3 Ling Liu,4 Xian Yu1
1Department of Phase I Clinical Trial Center, The Second Affiliated Hospital of Chongqing Medical University, Chongqing, People’s Republic of China; 2Pharmacy Department, The People’s Hospital of Liangjiang New Area, Chongqing, People’s Republic of China; 3College of Pharmacy, Chongqing Medical University, Chongqing, People’s Republic of China; 4Urinary Nephrophathy Center, The Second Affiliated Hospital of Chongqing Medical University, Chongqing, People’s Republic of China
Correspondence: Ling Liu, Email [email protected] Xian Yu, Email [email protected]
Object: Tacrolimus is a crucial immunosuppressant used to prevent renal transplant rejection. While, long-term application of tacrolimus can lead to several adverse reactions that worsen patient prognosis, such as posttransplantation diabetes mellitus and renal injury. This study developed population pharmacokinetic/pharmacodynamic (PK/PD) models from clinical data to investigate the relationships between tacrolimus dose, exposure, and adverse effects in renal transplant recipients.
Methods: Demographics, the CYP3A5 genotype, laboratory results, and co-medications were tested as covariates, and dose simulations were performed based on the final models. The population PK model was described by a one-compartment model with first-order elimination and a fixed absorption rate. The CYP3A5 genotype, Wuzhi (WZ) capsule, and postoperative days were significant covariates of tacrolimus clearance. Fasting plasma glucose (FPG) and estimated glomerular filtration rate (eGFR) were characterized by the trough concentration (C0) of tacrolimus in a PK/linear model and maximal inhibitory effect, respectively. Age significantly influenced the baseline FPG and eGFR. The initial eGFR was strongly affected by hemoglobin.
Results: The simulations revealed that patients with CYP3A5*1 treated without WZ capsule, for whom no less than 3 mg q12 h as the initial dose was needed, whereas patients with CYP3A5*3/*3 combined with WZ capsule might experience kidney damage even if the dose is 2 mg q12 h; thus, patients with the CYP3A5*3/*3 genotype combined with WZ capsule are not recommended.
Conclusion: The population PK/PD models quantified the relationships between tacrolimus dose, exposure, and adverse effects in renal transplant patients, which could serve as a reference for optimizing the individualized dosage of tacrolimus.
Keywords: tacrolimus, PK/PD model, exposure‒response analysis, renal transplant, individualized treatment
Graphical Abstract:

Introduction
The rational application of immunosuppressive agents is the key factor for the success of renal transplantation.1 Tacrolimus has been widely used as a first-line immunosuppressant in clinical practice, but it can cause adverse effects under long-term application.2 Compared with cyclosporine, tacrolimus has a 10~100 times stronger immunosuppressive effect, significantly improves graft survival, and reduces the incidence of rejection.3,4 However, it causes more adverse effects, including posttransplantation diabetes mellitus (PTDM) and renal dysfunction, which may adversely affect the long-term prognosis.5–7 PTDM is a common and serious complication following solid organ transplantation, with an incidence rate of 20% to 30% in kidney transplant recipients,8 tacrolimus is the most frequent cause of PTDM among immunosuppressants.9 On the other hand, studies have shown that the incidence of nephrotoxicity in renal transplant patients with long-term use of tacrolimus can arrive at 30%~40%,10 may be slightly higher than that of cyclosporine.11
Tacrolimus has a narrow therapeutic range (5~15 ng) and a highly variable bioavailability of 5%~93%.12,13 Therapeutic drug monitoring (TDM) is an approach used to adjust the trough concentration (C0) of tacrolimus to achieve the target TDM range.14 However, TDM alone is insufficient due to its inherent lag time. Quantitative pharmacology-based modeling can help address this limitation by leveraging prior data to develop personalized dosing regimens for patients in advance. Population pharmacokinetic (PK) modeling is currently the most widely used approach for achieving tacrolimus precision dosing in solid organ transplant recipients.15 Numerous studies have explored the influence of tacrolimus pharmacokinetics in different demographic, genomic, and pathophysiologic scenarios as well as other aspects. Postoperative days (POD), the CYP3A5 genotype, and hematocrit impact the clearance of tacrolimus.16–18 Chinese scholars reported that the use of Wuzhi (WZ) capsules reduced the clearance of tacrolimus.19 The Clinical Pharmacogenetics Implementation Consortium guidelines recommend CYP3A5 genotyping to determine initial tacrolimus doses for kidney transplant recipients.20 In Chinese practice, WZ capsules are commonly added to maintenance regimens as they slow tacrolimus metabolism. However, when combined with WZ capsules, standard tacrolimus doses lead to more frequent adverse effects in CYP3A5 poor metabolizers. This makes it crucial to understand how both factors influence tacrolimus exposures and effects for proper dose individualization. In addition, body weight is a significant covariate of the apparent volume of distribution of tacrolimus in patients with renal transplant.21 Nevertheless, most of the current literature has focused on the factors influencing tacrolimus PK but has not linked tacrolimus exposure with clinical outcomes. Campagne et al examined the relationships between tacrolimus exposure and extrarenal adverse effects, such as gastrointestinal reactions and neurotoxicities.22 The relationships between tacrolimus exposure and adverse reactions such as PTDM and renal injury remain to be explored.
Therefore, this study developed population PK/pharmacodynamics (PD) models of tacrolimus to reveal the factors that influence tacrolimus’s PK properties and the relationship between tacrolimus exposure and adverse reactions in renal transplant patients. Moreover, simulations based on PK/PD models may provide references for individual tacrolimus regimens in patients with renal transplant.
Methods
Patients and Study Design
This study retrospectively collected data from 126 renal transplant recipients in the Second Affiliated Hospital of Chongqing Medical University from September 2021 to March 2024; these patients were randomly divided at a ratio of 4:1 into an index group and a validation group. Patients were recruited if they were aged more than 18 years with renal transplant and underwent treatment with tacrolimus-based regimens. Those who could not have an accurate tacrolimus dosage or who had serious diseases were excluded. Tacrolimus was administered within 24 hours after renal transplantation, with an initial dose of 0.05~0.15 mg/kg/day, and the dosing interval was 12 hours. The subsequent dose was adjusted on the basis of C0 to achieve the target TDM range of tacrolimus; the adjustments were 8~12 ng/mL in the first 1 month, 6~10 ng/mL from 1 to 3 months and 4~10 ng/mL from 3 to 12 months after transplantation.14 Tacrolimus was monitored twice a week within 2 weeks after surgery, once a week for the next 3~4 weeks, and then every 2 weeks thereafter.23 This study was conducted in accordance with the principles of the Declaration of Helsinki. Approval was granted by the Ethics Committee of the Second Affiliated Hospital of Chongqing Medical University (2023–50), and the National Clinical Trial number presented at clinicaltrials.gov is NCT05872815.
Biological Analysis and Data Collection
Whole-blood trough concentrations of tacrolimus were measured via an enzyme-amplified immunoassay via the Syva Viva-ProE® System (Zhu Hai Livzon Diagnostics Inc., China). C0 was obtained from TDM, and the demographic information of patients, such as sex, age, weight, and blood type, was collected from hospital electronic medical records. CYP3A5 gene categories and laboratory test results, including hemoglobin (HB), hematocrit, white blood cell count, total bilirubin, aspartate aminotransferase, alanine aminotransferase, alkaline phosphatase, γ-glutamyl transpeptidase, uric acid, and creatinine, were also collected. The co-medications (amlodipine, WZ capsule, metoprolol, omeprazole) were recorded to investigate their potential interactions with tacrolimus. Moreover, fasting plasma glucose (FPG) and the estimated glomerular filtration rate (eGFR) were used as indicators of the level of blood glucose and renal function, respectively.
Population PK Modeling
Because only C0 of tacrolimus was available in this study, a one-compartment model with first-order conditional estimation was selected to describe the PK parameters using a nonlinear mixed effects model (NLME) in Phoenix (version 8.3.5). In addition, the absorption rate constant (Ka) was 3.09 h−1 and 4.5 h−1 on the basis of previous studies.16,24 An exponential random effect model was applied to describe the interindividual variability (IIV):

where Pi represents the parameter estimate for the ith individual, tvP is the population typical value of the parameter, and ηi is a random variable of assumed normal distribution with a mean of zero and variance of ω2. Additive residual, proportional, and mixed error models were tested separately to account for residual variability.
After the base population PK model was determined, the potential covariates were analyzed, including demographic information, genotype of CYP3A5, and laboratory tests, as well as co-medications. Fewer than 10% of the patients were not of Han nationality, and fewer than 5% of patients were not treated with omeprazole; thus, ethnicity and omeprazole were not included in the covariate analysis. Genotypes of CYP3A5*1/*1 and CYP3A5*1/*3 seem to accelerate tacrolimus metabolism in renal transplant patients;16,17 therefore, both genotypes were mixed as CYP3A5*1. The investigated covariates were analyzed using the stepwise approach, and those whose objective function values (OFVs) decreased by more than 6.64 (p < 0.01, df = 1) in forward inclusion and increased by more than 10.83 (p < 0.001, df = 1) in backward elimination were considered significant. Apart from the statistical significance, the biological and clinical implications of the covariates were also considered when developing the covariate model.
Goodness-of-fit (GOF) plots were drawn to evaluate the model fits, and the relative standard error (RSE) was used to evaluate the precision of the parameter estimates for the final PK model. Additionally, a bootstrap method with 1000 replicates was applied to assess the model’s stability and robustness. Moreover, a prediction-corrected visual prediction check (pcVPC) with 1000 replicates and external data was performed to evaluate the predictive performance of the final model.
Exposure‒Response Analysis
To investigate the relationships between tacrolimus exposure and adverse effects, FPG and the eGFR were used as PD indicators to establish PK/PD models. The PK/PD models were sequentially built following the population PK model. The following models were tried out to correlate C0 with FPG and eGFR: direct effect, indirect effect, and linear model. Ultimately, the PK/linear model and the maximal inhibitory effect (Imax) model described the relationships between C0 and FPG and eGFR, respectively, as follows:


where FPG is the estimate of fasting plasma glucose in patients with renal transplant; FPG0 represents the baseline FPG before renal transplantation; and β is the slope. The eGFR is the patient’s estimated glomerular filtration rate; eGFR0 is the eGFR at baseline, which is the time at which renal function reaches stability after transplant; Imax represents the maximum renal injury that tacrolimus might cause; IC50 is the concentration required to achieve half of Imax; and Cp,t is the trough concentration of tacrolimus at time t.
The IIVs of the PK/PD models were utilized via an exponential random effect model, and additive, proportional and mixed residual error models were tested for residual variability. In addition, the covariate screening process and the evaluation of the two PK/PD models were similar to those of the population PK model. Selected PD parameters (β, IC50, and Imax) were fixed in the final model, and we assessed the robustness of this approach through sensitivity analyses examining ±30% variations in these parameters and their effects on key output metrics.
Simulations
Patients were divided into four subpopulation groups based on the significant covariate of the PK model: the CYP3A5*1 genotype combined with or without the WZ capsule and the CYP3A5*3/*3 genotype combined with or without the WZ capsule. For the C0-FPG model, simulations were first conducted to display the time courses of C0 and FPG in four subpopulations given dosing regimens of 1~4 mg q12 h for one month after renal transplantation. In clinical treatment, the dose of tacrolimus is often adjusted early based on C0 to rapidly reach the target TDM range and reduce adverse effects. The TDM range was set at 6~10 ng/mL on the basis of Chinese guidance14 and the doctor’s experience. Therefore, we simulated tacrolimus dose gradually increasing or decreasing by 0.5 mg on day 3, 7, 11, 14 after first dose (day 1) in the base of monitor frequency and finally stopped at a maintenance dose in different subgroups. When FPG is greater than 7.0 mmol/L, PTDM might be more likely to occur.25
For the C0-eGFR model, the relative estimated glomerular filtration rate (ReGFR) was utilized as an index to evaluate the degree of renal injury.26 When the ReGFR decreased by more than 20%, renal function impairment was considered. The ReGFR can be described by the following equation:

where eGFR is the observation at a given time and eGFR0 is the eGFR when renal function reached stability after renal transplant, we assumed that the time was the seventh day after surgery on the basis of the phenomenon that most patients’ renal function returned to stability on the seventh day after transplantation in our study. Similarly, 1~4 mg dosing regimens of tacrolimus were firstly simulated in the four subgroups to explore the effect of covariates on PK curves and ReGFR. Then the dose was gradually adjusted by 0.5 mg on each of postoperative day 7, 11, 14, and 21, at which point adjusts stopped and patients received the maintenance dose.
Results
Patient Characteristics
The total dataset of 126 renal transplant recipients with 2279 C0 samples, 2055 FPG points and 2334 eGFR values was analyzed in this study. The characteristics of the patients in the index group and validation group are presented in Table 1. The median age of the index population was 38 years, and more than half of the patients had the CYP3A5*3/*3 genotype. Nearly one-third of the population took WZ capsules. The C0 values of tacrolimus, FPG, and eGFR used in the population PK model and PK/PD models are displayed in Figure 1.
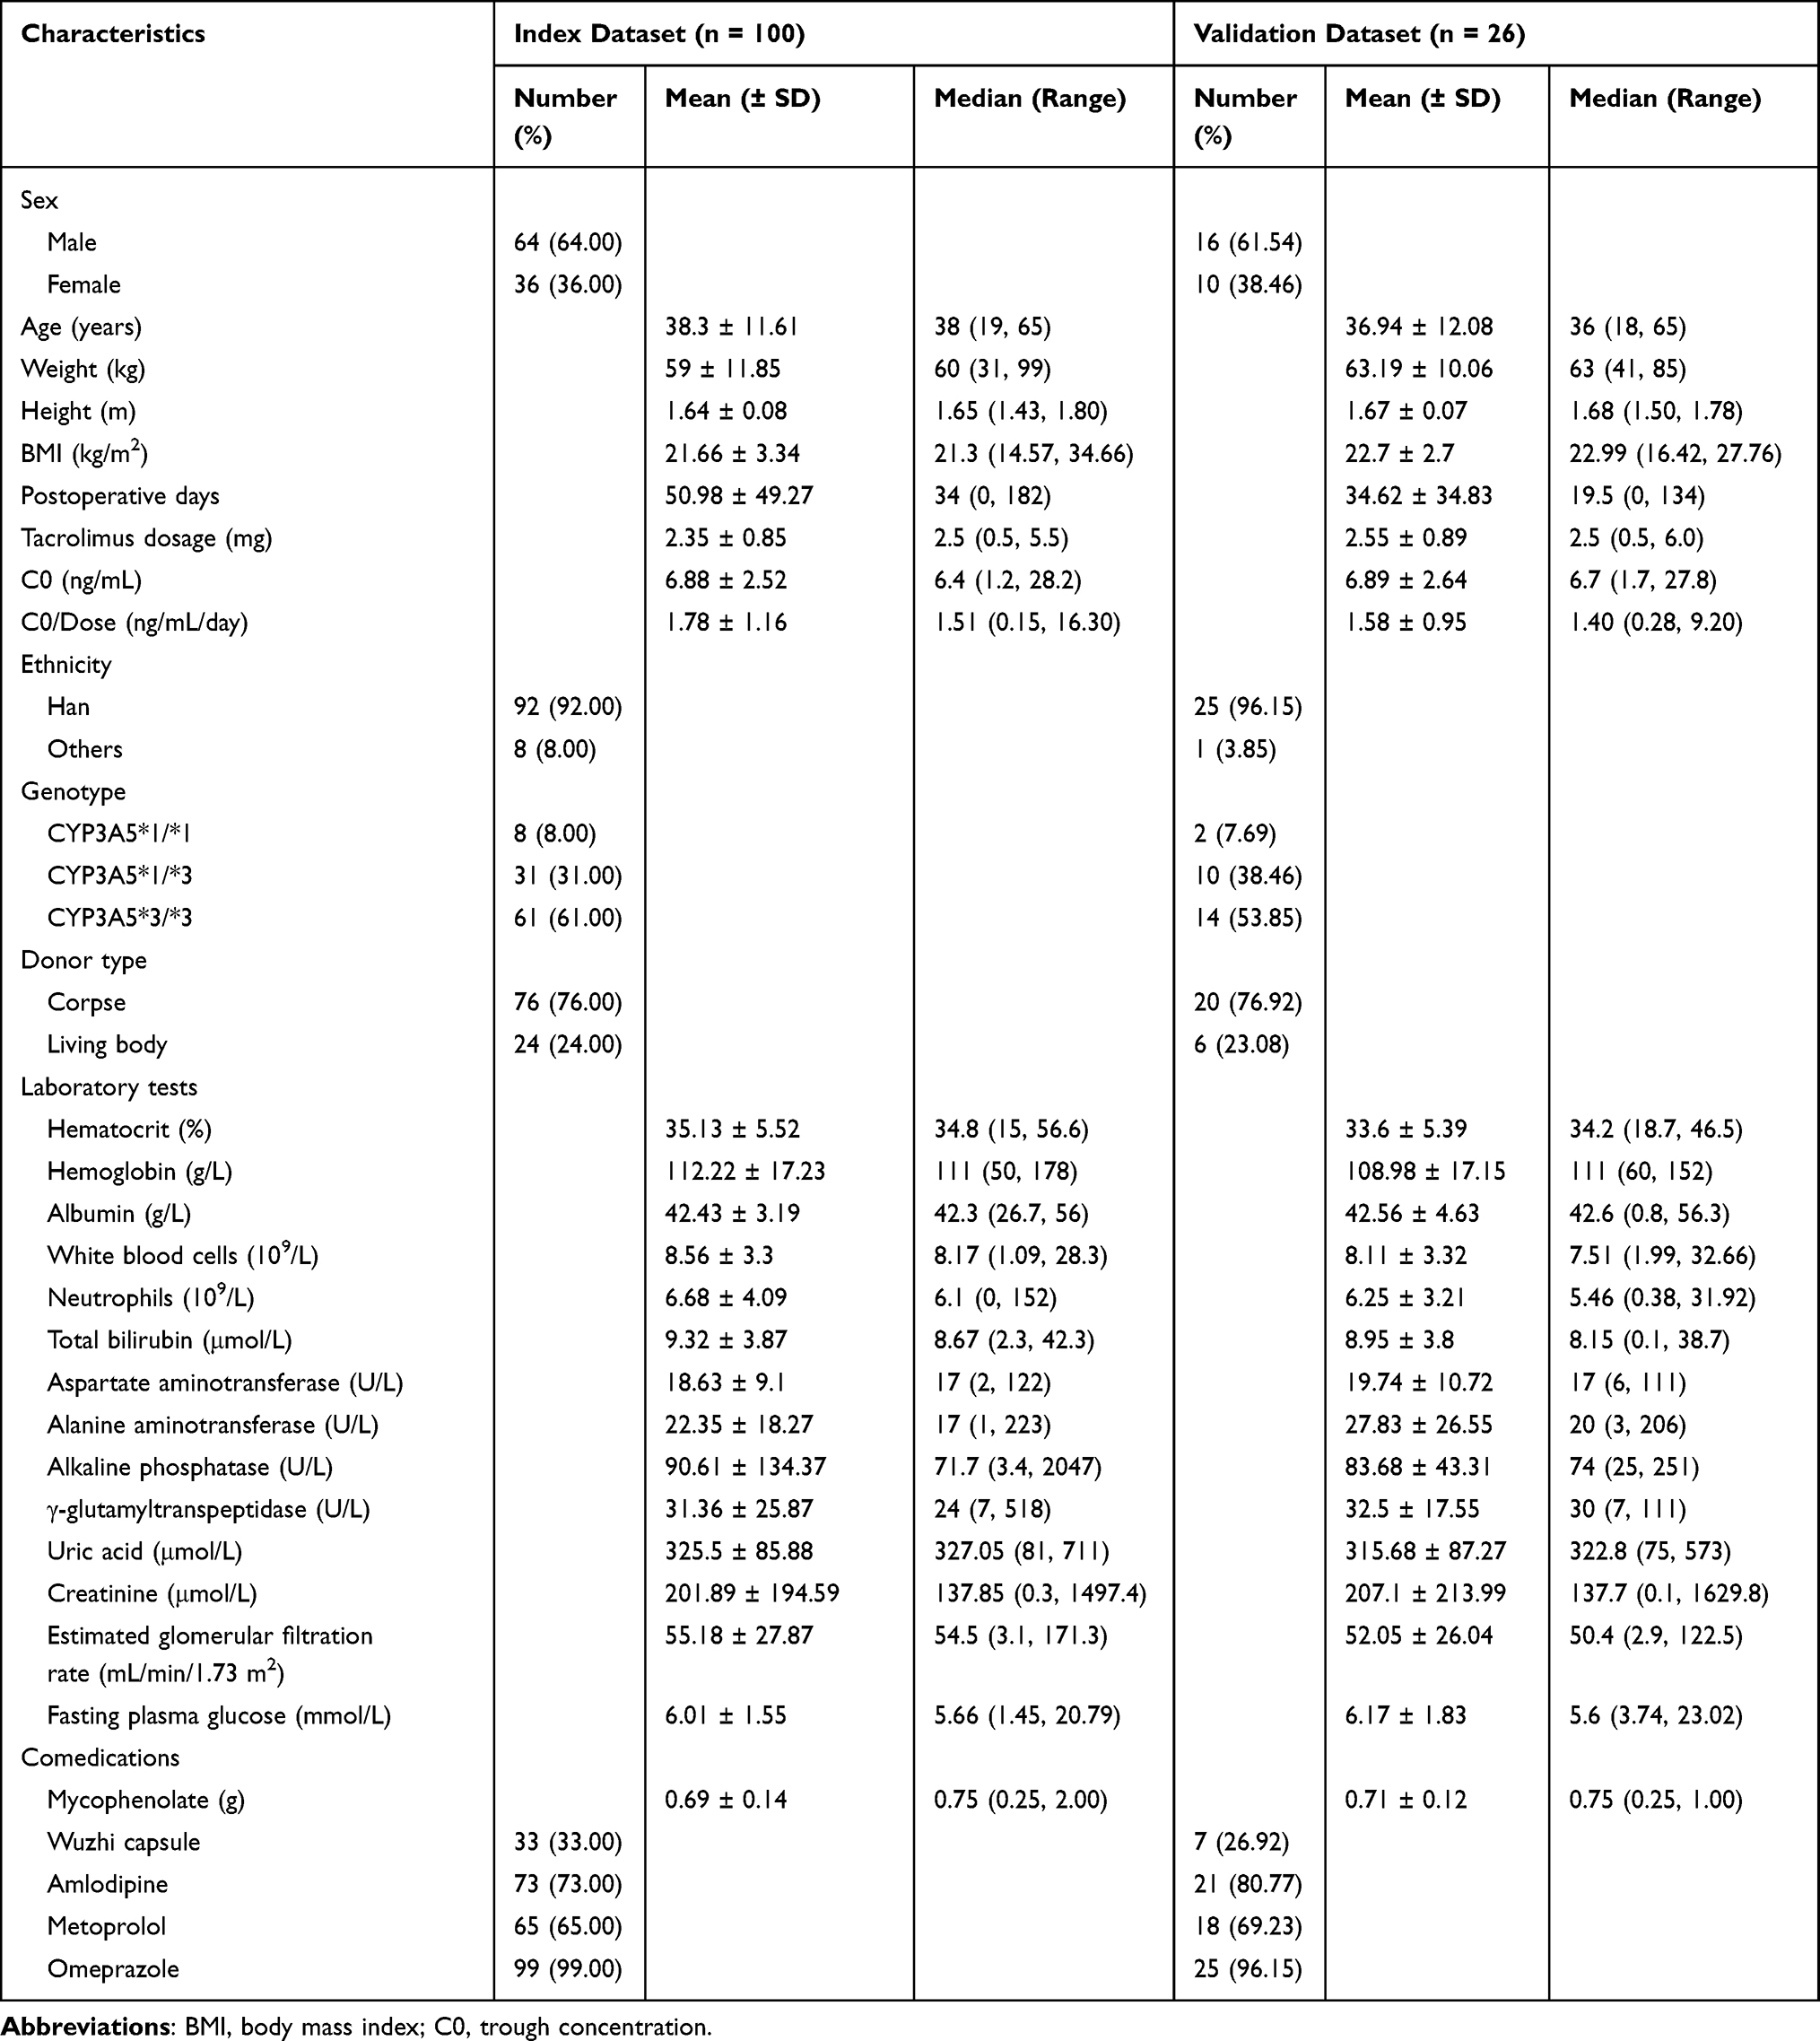 |
Table 1 Summary of Characteristics of Renal Transplant Patients |
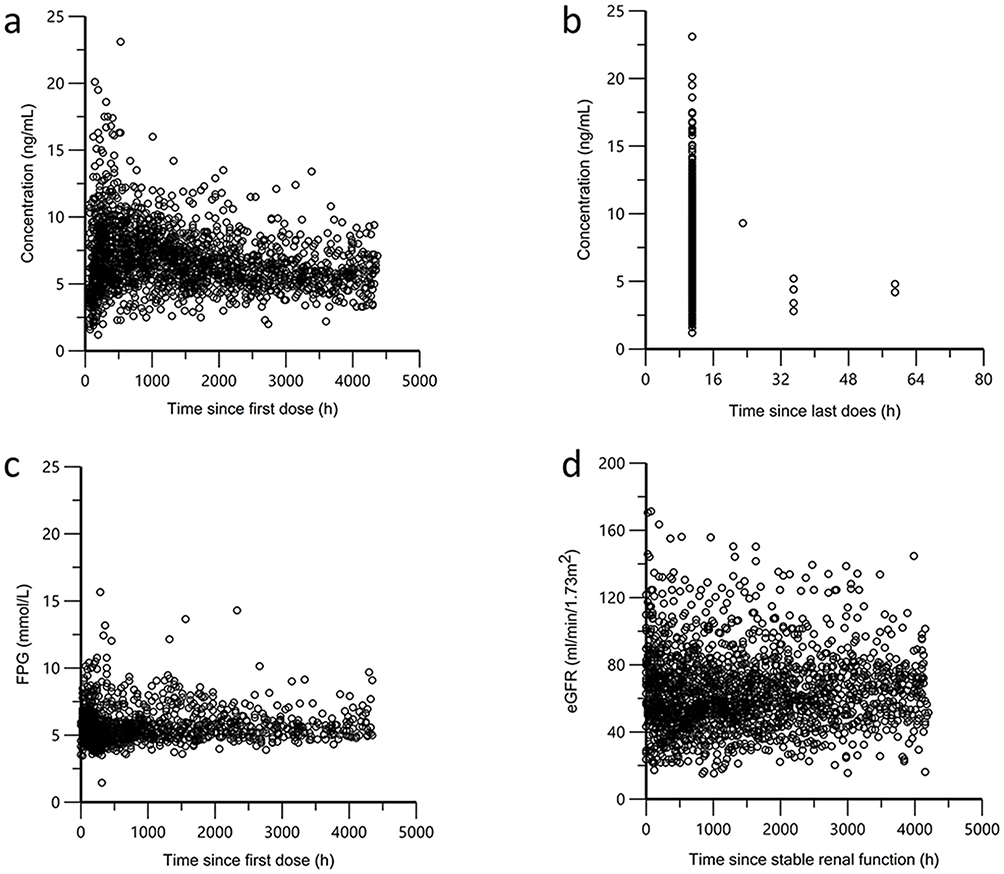 |
Figure 1 Trough concentrations of tacrolimus and FPG and eGFR versus time. Concentration versus time since first dose (a) and time since last dose (b), FPG versus time since first dose (c) and eGFR versus time since stable renal function (d). Abbreviations: FPG, fasting plasma glucose; eGFR, estimated glomerular filtration rate. |
Population PK Model
In this study, the PK properties of tacrolimus were described by a one-compartment model with a first-order conditional estimation in renal transplant patients, and the Ka was fixed to 3.9 h−1 on the basis of the OFV value and GOF plots. The additive error model best described the residuals of the PK model. Furthermore, the parameter estimates of the base model and final model are listed in Table 2, and the GOF plots for the final PK model are shown in Supplementary Figure 1. The CYP3A5 genotype, WZ capsule, and POD significantly affected the apparent clearance (CL/F) of tacrolimus after covariate screening. A brief summary of the covariate screening process is displayed in Supplementary Table 1. The PK parameters of the final model for tacrolimus were as follows:


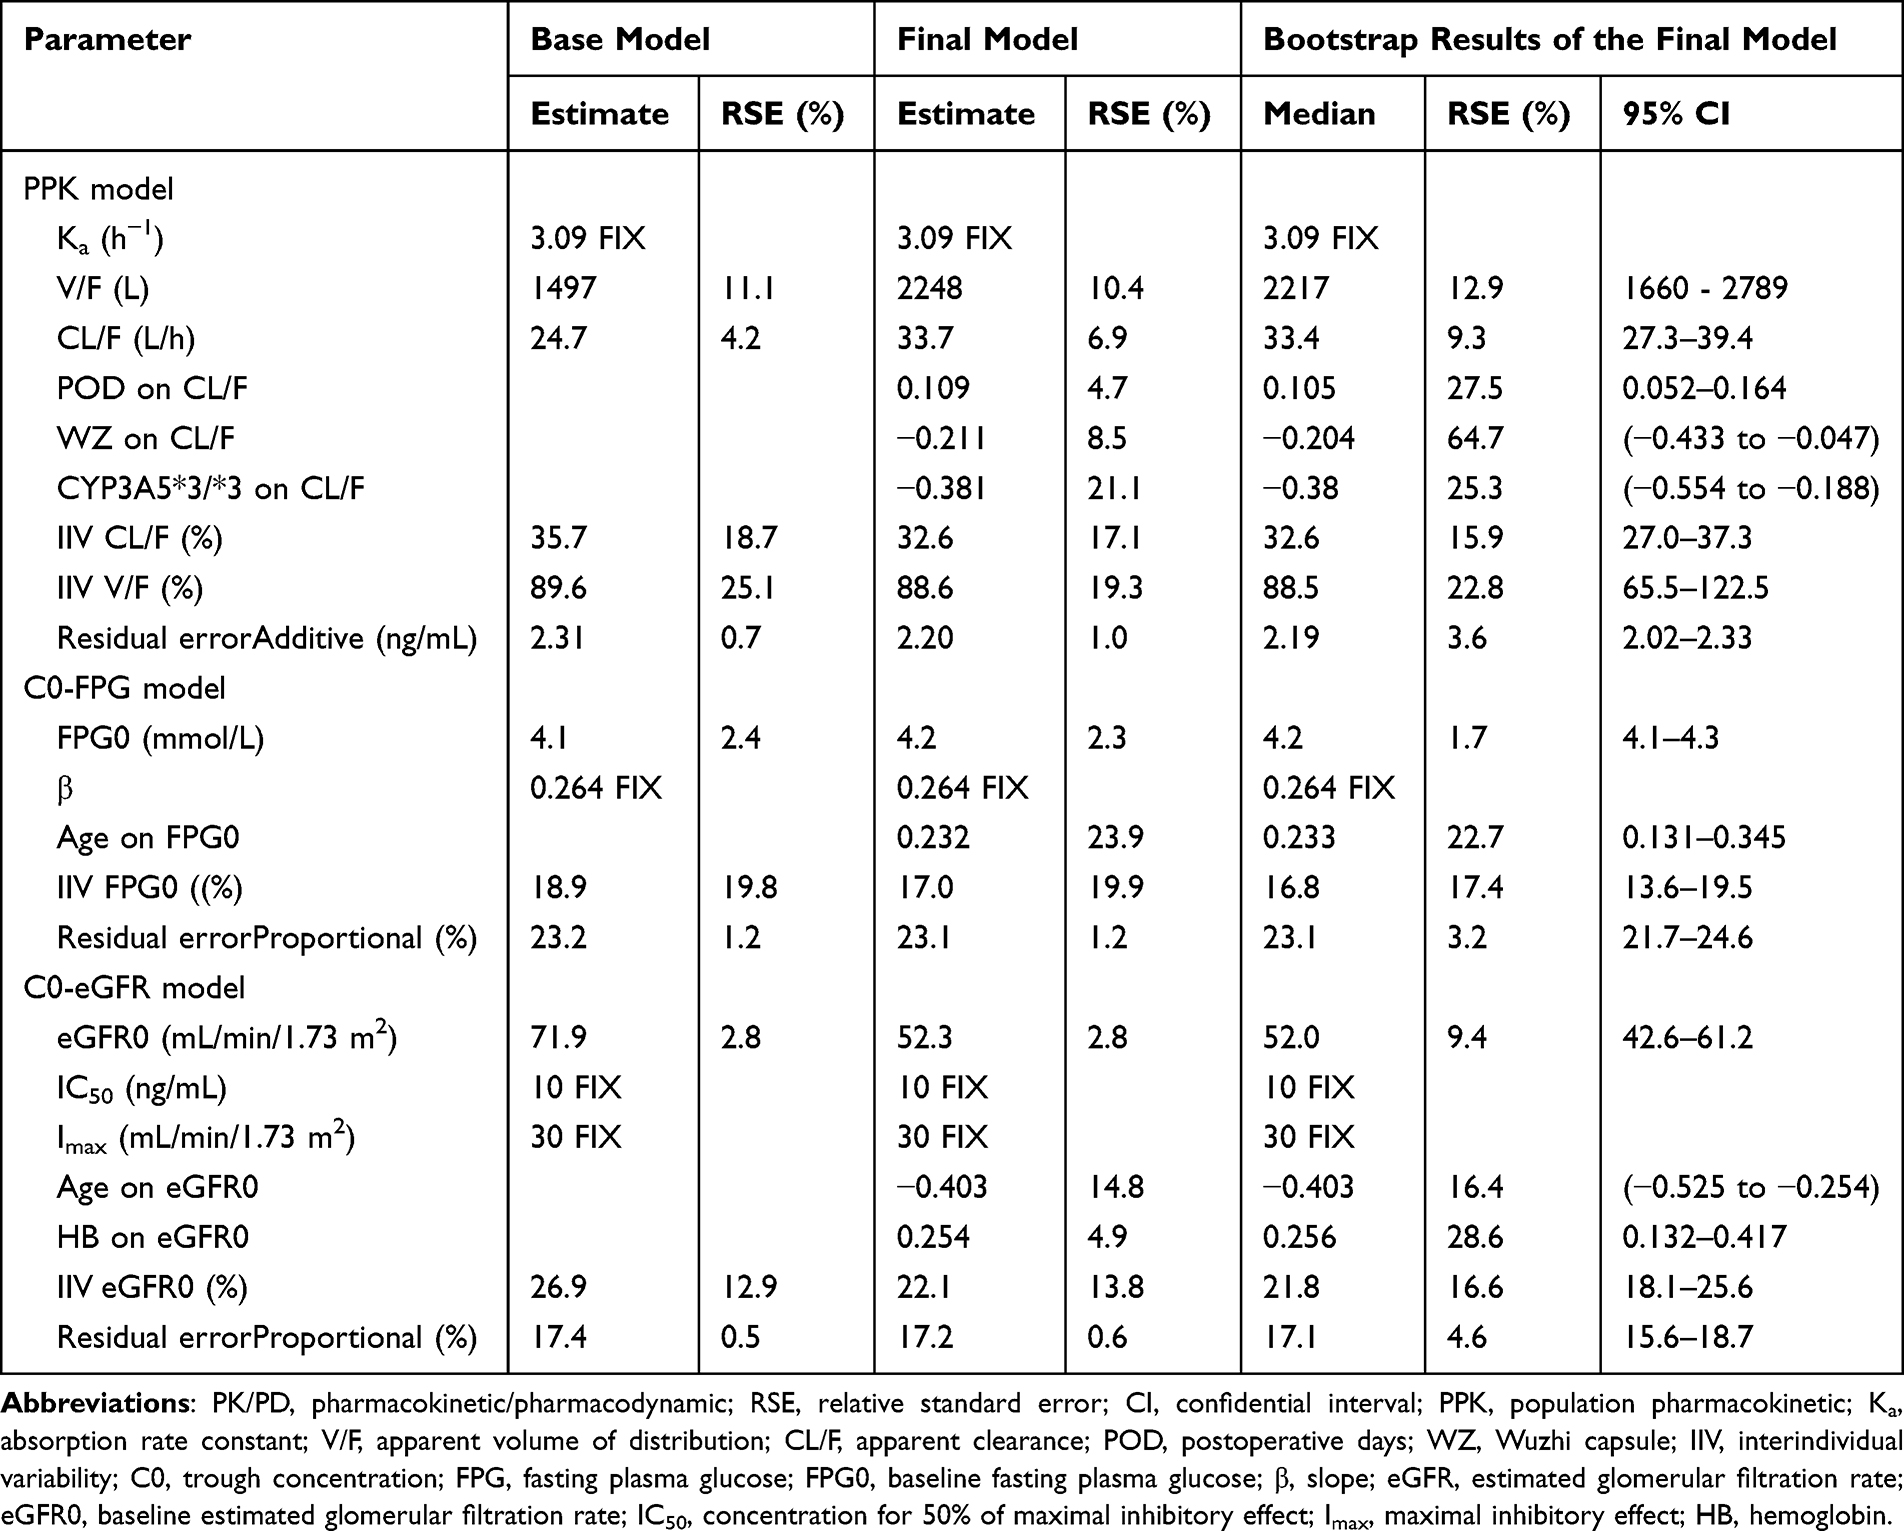 |
Table 2 Parameter Estimates of the Population PK/PD Models and the Bootstrap Results |
WZ = 1 if WZ is present; otherwise=0
Genotype = 1 if the genotype is CYP3A5*3/*3; otherwise, it = 0
where 2248 L is the tacrolimus apparent volume of distribution (V/F). No significant covariate was found for V/F. The CL/F typical value of tacrolimus was 33.7 L/h, CL/F increased with POD, while WZ capsule usage and CYP3A5*3/*3 genotype reduced the tacrolimus CL/F. Bootstrap results of the final population PK model are presented in Table 2. The results demonstrated that the model was robust, with a 100% success rate of simulation in Phoenix NLME. The estimate of WZ capsule alone was not precise enough (RSE > 30%), but the 95% confidential interval did not cross zero, which indicated that this parameter was relatively stable. The pcVPC plot in Supplementary Figure 2 and the external validation result in Supplementary Table 2 indicated that the final population PK model had good predictive performance.
Exposure‒Response Analysis
Equations 2 and 3 were applied to describe the relationships between tacrolimus C0 and FPG and eGFR, respectively. The proportional error model was found to best describe the residuals of the PK/PD models. In the C0-FPG model, β was fixed at 0.264, and in the C0-eGFR model, Imax was fixed at 30 mL/min/1.73 m2, and the IC50 was fixed at 10 ng/mL. The results of the parameter estimates are presented in Table 2, and the covariate screening process of the PK/PD models is summarized in Supplementary Tables 3 and 4. Only age had a significant effect on FPG0 (ΔOFV = 18.765, df = 1, p < 0.001), the relationship of which is described below.

where 4.2 is the typical value of FPG before transplantation and 38 is the median age of renal transplant patients in the index group. FPG0 increased with age.
Additionally, age (ΔOFV = 39.013, df = 1, p < 0.001) and HB (ΔOFV = 17.784, df = 1, p < 0.001) significantly affected the eGFR0 in the C0-eGFR model. This relationship can be described as follows:

where 52.3 is the typical value of the baseline eGFR when renal function has recovered to stability after renal transplant, and 111 represents the median HB value of the index population.
The parameter estimates of the final PK/PD models and the bootstrap results listed in Table 2 indicated that all the parameters were estimated precisely (RSE < 30%). The GOF plots of the final models are shown in Figure 2, and the external validation results are presented in Supplementary Table 2. As shown in Figure 3a, the pcVPC results showed that the FPG predictions might be greater than the observations 500 h after the first administration of tacrolimus in the C0-FPG model. Most of the observations were within the 90% forecast range, the eGFR could be well predicted in Figure 3b. The fixed PD parameters demonstrated less than 15% impact on effect values (Supplementary Table 5), and combined with the diagnostic plot results presented above, we conclude that the fixed PK parameters are acceptable for this model.
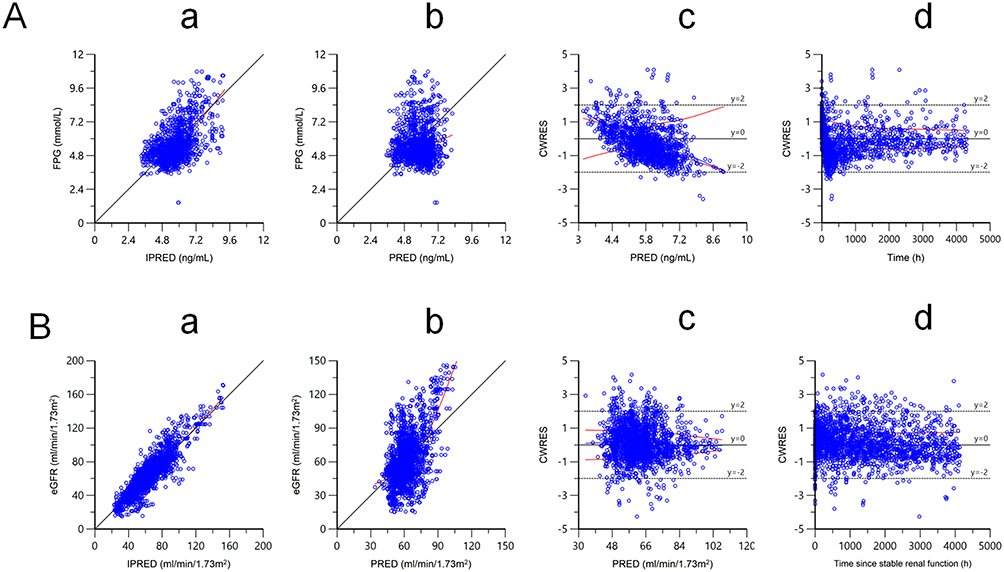 |
Figure 2 GOF plots for the final PK/PD models of tacrolimus in patients with renal transplant. (A) is for C0-FPG model, (B) is for C0-eGFR model. (A and B) both show observations versus IPRED (a); observations versus PRED (b); CWRES versus PRED (c); CWRES versus time after first dose or stable renal function (d). Abbreviations: GOF, goodnessof-fit; PK/PD, pharmacokinetics/pharmacodynamics; C0, trough concentration; FPG, fasting plasma glucose; eGFR, estimated glomerular filtration rate; IPRED, individual predictions; PRED, population predictions; CWRES, conditional weighted residual error. |
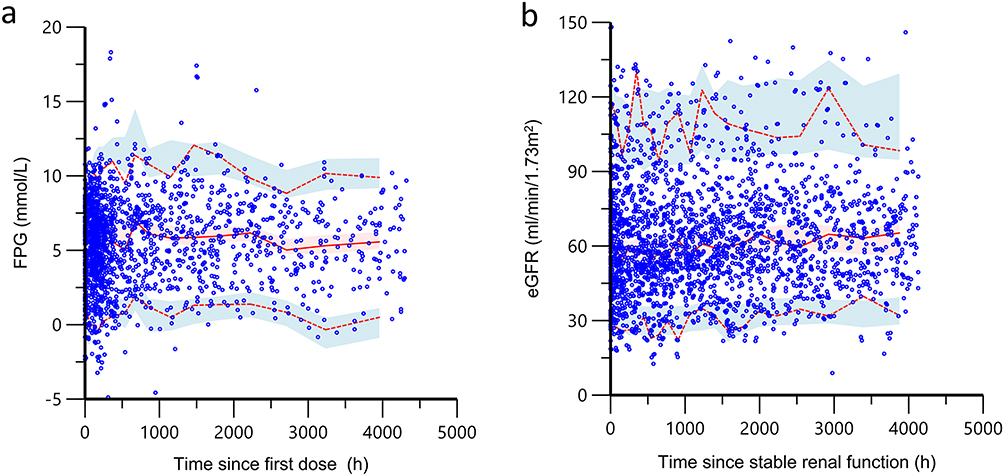 |
Figure 3 Prediction-corrected visual predictive checks based on 1000 simulations of the final PK/PD models. (a) is for C0-FPG model, (b) is for C0-eGFR model. The red solid line is the median line of observations, the red shaded area stands for its 90% prediction interval. The red dashed lines are the 5% and 95% percentile of the observations, and the blue shaded area stand for their 90% prediction intervals, respectively. The blue circles refer to observations. Abbreviations: PK/PD, pharmacokinetics/pharmacodynamics; C0, trough concentration; FPG, fasting plasma glucose; eGFR, estimated glomerular filtration rate. |
Simulations
The profiles of tacrolimus C0 and the FPG of the four subpopulation groups were derived from simulations (Figure 4). C0 and FPG increased with increasing tacrolimus dosage. Additionally, C0 decreased with time after transplantation in the simulations because the CL/F of tacrolimus increased with POD. Because the CYP3A5*3/*3 genotype and WZ capsule were associated with a lower CL/F of tacrolimus, the other three subgroups needed a larger dose to reach the target TDM range than did the subgroup of patients with CYP3A5*3/*3 who took WZ capsules. In addition, an FPG higher than 7.0 mmol/L could not be detected when tacrolimus was dosed at 1~2 mg q12 h in the four subpopulations. Nevertheless, when dosed at 4 mg q12 h, PTDM was more likely to occur in almost all the groups.
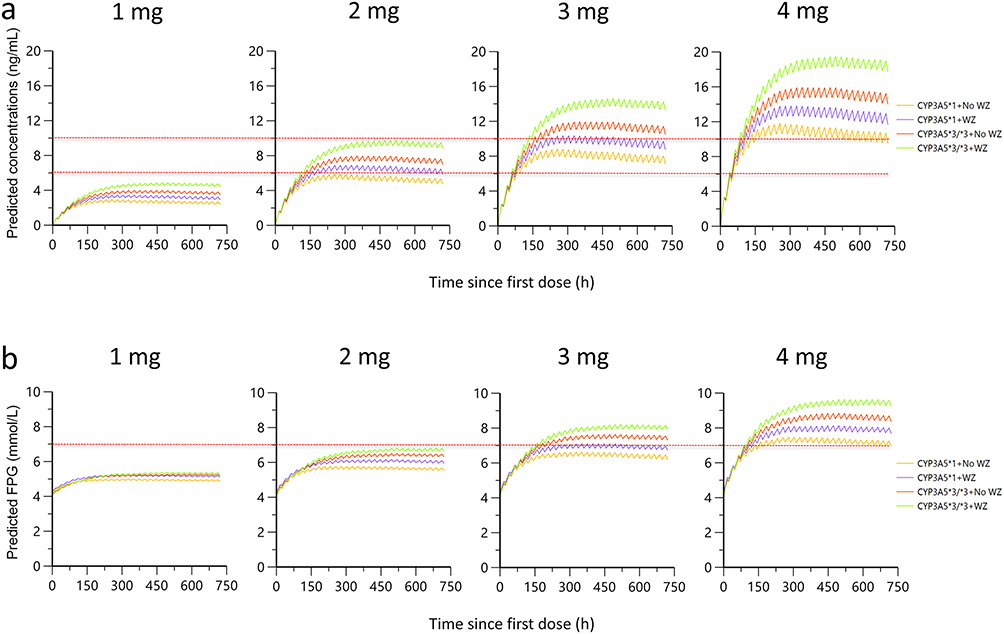 |
Figure 4 Simulations for the time course of tacrolimus trough concentrations (a) and FPG (b) in the four subpopulation groups under various daily doses. The dash lines in (a) represent the criteria of 6~10 ng/mL, and the dashed line in (b) stands for the 7.0 mmol/L. Abbreviation: FPG, fasting plasma glucose. |
The adaptive simulations shown in Figure 5 demonstrate that that individuals with the CYP3A5*3/*3 genotype treated with the WZ capsule should start with an initial dose of 2~3 mg q12h and maintain a dose of 2 mg q12 h to achieve TDM range quickly and with a low probability of PTDM; individuals with CYP3A5*3/*3 who are not treated with the WZ capsules should be dosed with 2~3 mg q12 h and be maintained at 2~2.5 mg q12 h; the dose selection range for the group of the CYP3A5*1 genotype combined with the WZ capsules is relatively broad, it can start with 2~3 mg q12 h and maintain a dose of 2~3 mg q12 h; and patients with CYP3A5*1 not treated with the WZ capsule, starting with an initial dose of 2 mg, are difficult to reach the TDM range within 7 days of administration, therefore, it is necessary to start with an initial dosage of 3~4 mg q12 h, and the maintenance dose can be selected at 2.5~3.5 mg.
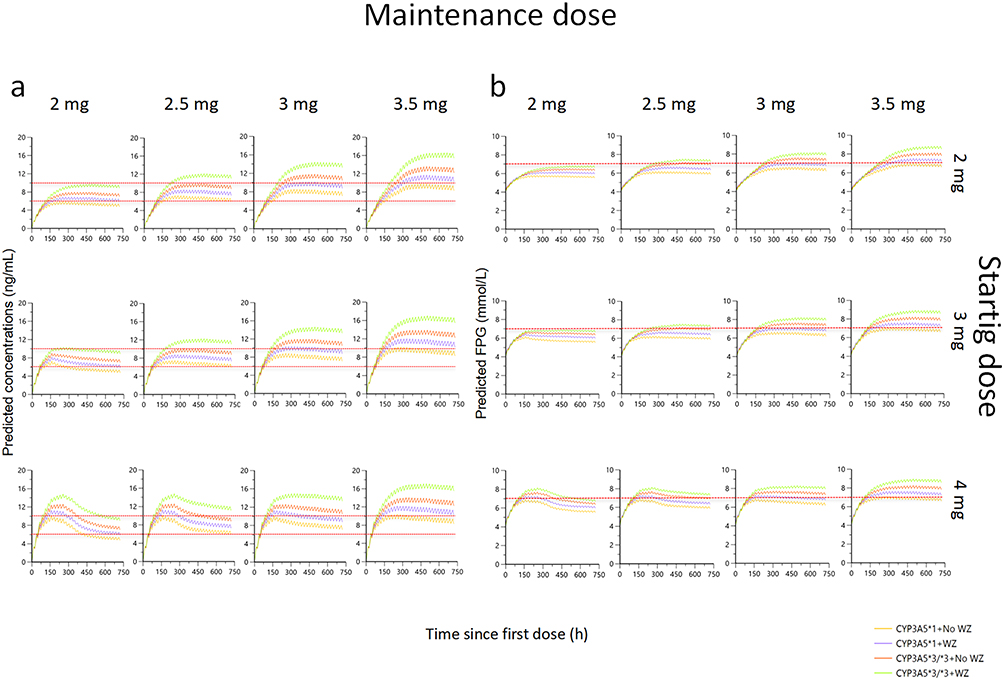 |
Figure 5 Simulations for the time course of tacrolimus trough concentrations (a) and FPG (b) in the four subpopulation groups under adaptive dosing regimen. After 3 days at a single dose level, the tacrolimus daily doses were increased or decreased by 0.5 mg and finally stopped at a maintaining dose. The dash lines in (a) represent the criteria of 6~10 ng/mL, and the dashed line in (b) stands for the 7.0 mmol/L. Abbreviation: FPG, fasting plasma glucose. |
Simulations were conducted in the C0-eGFR model with different dose regimens for one month beginning 7 days after surgery to explore the relationship between tacrolimus exposure and renal toxicity. As illustrated in Supplementary Figure 3, in concordance with the results of simulations in the C0-FPG model, the probability of renal damage in the four subgroups was very small, but the TDM range was not reached when tacrolimus was dosed at 1 mg q12 h. Additionally, renal function could fall by 20% in four subgroups at a 4 mg q12 h of tacrolimus. For all the subgroups, it is difficult to keep a balance between achieving the TDM range and avoiding renal injury (Supplementary Figure 4), and the group of CYP3A5*3/*3 combined with the WZ capsules can occur renal damage even with a low dose of 2 mg q12 h. In any case, avoiding the problem of rejection is the priority. Therefore, individuals with CYP3A5*3/*3 combined without the WZ capsule, 2~3 mg q12 h as the initial dose regimen and 2 mg as the maintaining dose were acceptable; patients with CYP3A5*1 who were treated with the WZ capsule could start with 2~3 mg q12 h and maintain a dose of 2~2.5 mg q12 h; and those with CYP3A5*1 who were not treated with the WZ capsule using a starting dose of 3~4 mg and maintaining a dose of 2.5~3 mg were better (Supplementary Figure 4).
Discussion
Because of the high individual variability and narrow therapeutic range of tacrolimus, C0 is monitored in the clinical treatment of renal transplant. Some covariates that significantly influence tacrolimus PK parameters have been found and multiple population PK models for tacrolimus have been established and utilized in dose adjustment for kidney transplant patients.15,27,28 In addition, several studies have revealed the relationship of tacrolimus PKs and therapeutic effect biomarkers using exposure-response analysis, including such measures as calcineurin and activated T lymphocytes.29–31 However, how to integrate the PK parameters and clinical outcomes remains to be solved, and solving that problem will make bigger difference for clinical treatment. The pioneering work by Campagne’s group linked tacrolimus exposure (dose-adjusted AUCss,0–12h and CL) to specific non-renal toxicities (diarrhea, dyspepsia, insomnia) in renal transplant patients.22 Notably, critical exposure–response relationships for PTDM and nephrotoxicity still await systematic investigation. In this study, we sequentially developed a population PK model for tacrolimus and established exposure-response models linking C0 to FPG and eGFR to quantitatively demonstrate the relationships between tacrolimus exposure and adverse effects to optimize tacrolimus dose adjustments in early vs late post-transplantation phases in patients with different genotypes and co-medications.
Because only trough concentrations of tacrolimus were collected and absorption phase data were lacking in this cohort, a one-compartment model was selected. Previous studies lacking absorption-phase data typically fixed the Ka at either 3.09 h−¹ or 4.5 h−¹.16,24 In developing our population pharmacokinetic model, we evaluated both values. Both tested values yielded acceptable precision for the model-estimated volume of distribution and clearance (RSE < 30%). However, when Ka was set at 3.09 h−¹, the OFV value and GOF plots demonstrated significantly better performance compared to Ka = 4.5 h−¹. We therefore fixed Ka at 3.09 h−¹ as the final parameter. Three genotypes of CYP3A5 were initially investigated in the covariate screening process of the population PK model, and the results showed that they all significantly influenced the tacrolimus CL/F, while the parameters could not be well estimated (RSE >30%). Previous researchers have reported that CYP3A5 genotype strongly affects tacrolimus clearance, in which CYP3A5*1/*1 and CYP3A5*1/*3 accelerate metabolism and individuals with CYP3A5*3/*3 have the lowest clearance rate.16,17,24 Therefore, we combined CYP3A5*1/*1 and CYP3A5*1/*3 as CYP3A5*1 to go through the screening; as a result, the parameters were finally estimated precisely.
Population differences may be the reason for the somewhat larger value of V/F in the final PK model in this study (2248 L) compared to earlier investigations.24,32 Additionally, as our model was developed using C0 without absorption-phase or distribution-phase sampling, this could potentially introduce some bias in the V/F estimation. However, our sensitivity analysis demonstrated that varying V/F by ±30% resulted in predicted concentration changes ranging from −6% to +8%, all within the pre-defined acceptable threshold of ±15%. When combined with the diagnostic plots from the final population PK model and external validation results, we conclude that the estimated V/F remains pharmacologically plausible and clinically reasonable for our study population. Some potential covariates that had a significant influence on V/F in other reports, such as body weight, hematocrit, and co-medications, were also tested in this study. However, none of the variables was included in the population PK model after covariate screening, which process is summarized in Supplementary Table 1. For the CL/F of tacrolimus, three significant covariates (CYP3A5 genotype, WZ capsule, POD) were discovered, consistent with previous studies.19,24,33
To investigate the relationship between tacrolimus exposure and adverse drug reactions, PK/PD models were developed using FPG and eGFR as PD biomarkers. Research shows PTDM significantly raises cardiovascular risks and mortality in transplant patients.34 A Spanish study found that kidney transplant recipients with impaired glucose tolerance or elevated FPG within the first year had higher cardiovascular event rates.35 Furthermore, patients showing consistently high FPG (≥7.0 mmol/L) or abnormal glucose tolerance tests (≥11.1 mmol/L) in the initial 10 postoperative weeks faced increased mortality risk.36 For practical clinical application, this study uses FPG as the primary glucose monitoring parameter. Additionally, current quantitative pharmacology models typically assess kidney function in transplant recipients using either eGFR or serum creatinine. However, creatinine’s variable reference ranges based on age and gender limit its comparability across populations.37 To ensure consistent renal function evaluation, this study employs eGFR as the primary metric for post-transplant kidney function assessment. C0 was correlated with FPG and eGFR by direct effect, indirect effect, and linear models. However, none of the models could estimate well (RSE < 30%) and explain reasonably for all PD parameters simultaneously. Therefore, some PD parameters were fixed to avoid overparametrization as well as to obtain fitting models. Some PK/PD models reported in the past also fixed the PD parameter or fixed the IIV value of the PD parameter to zero.26,38 The FPG prior to renal transplantation was used as the baseline in the C0-FPG model, and the cumulative incidence rate of PTDM within six months following renal transplantation (0.264) was set as the slope β.39 Because most of the FPG observations were collected 3 months after transplantation in our study and we did not rule out the possibility that blood glucose might increase as a stress response after renal transplantation,40 the model might overestimate FPG, which is a limitation of this study. As the pcVPC plot in Figure 3a illustrates, the model might predict that FPG is higher than that observed in the first 500 hours after the first dose of tacrolimus.
Approximately 2% of tacrolimus is excreted in the urine, and bile is the main elimination route; thus, tacrolimus exposure is not significantly affected by renal function.41 However, high concentrations of tacrolimus may cause renal injury.42 Renal function improved a few days after transplantation, and the nephrotoxicity of tacrolimus could not be reflected at that time. Therefore, the eGFR at the time of renal function recovery stabilization after transplantation was regarded as the baseline rather than the eGFR after the first dose of tacrolimus in the C0-eGFR model. The time to get stable renal function varies from person to person due to individual differences, in our data, the vast majority of patients returned to stable state by day 7 after surgery. Different effect models were explored to link C0 and eGFR, but it was discovered that the parameter estimates of IC50 and Imax cannot be reasonably interpreted in clinical practice. As previous studies reported that the incidence of nephrotoxicity will greatly increase when the C0 of tacrolimus is higher than 10 ng/mL,43 10 ng/mL was assumed to be the IC50. Additionally, Imax was fixed at 30 mL/min/1.73 m2 because if the eGFR was lower than 30 mL/min/1.73 m2, the patient would reach stage 4 chronic kidney disease,44 implying severe renal impairment, which also occurred in several patients in this study. By fixing these parameters, the model was successfully established, but to some extent it also made it difficult to estimate the inter-individual variation of PD indicators. Furthermore, eGFR is going to be affected by the compound too; therefore, it is essential to explore a more physiologically relevant model that assesses the impact of both the transplant and tacrolimus on eGFR changes in the future.
Age was a significant covariate of the baseline FPG and eGFR in the PK/PD models. FPG0 increased with age, while eGFR0 decreased with age, which could be explained by the biological fact that blood glucose metabolism and renal function decline with age.45,46 In addition, eGFR0 also increased with increasing HB. Erythropoietin (EPO), which is secreted by kidney, participates in the production of red blood cells; thus, as renal function is damaged, EPO secretion decreases, and HB is eventually reduced. HB is an indirect predictor of renal function.47 As Supplementary Table 3 and 4 presented, amlodipine showed a significant effect on FPG0 (ΔOFV = −8.613, p < 0.01), POD and body weight significantly influenced on eGFR0 in forward inclusion respectively (ΔOFV = −8.000 for POD, ΔOFV = −8.451 for body weight, p < 0.01), but none of them was ultimately included in the final model because they did not meet the criteria for backward exclusion (p < 0.001). More information is needed to quantify the relationships between demographics, drug combinations, and PK or PD parameters.
In the simulations, the target TDM range of tacrolimus was set at 6~10 ng/mL 3 months after renal transplant, on the basis of the Chinese kidney transplantation guidelines14 and clinical experience. FPG was set to 7.0 mmol/L by the diagnostic criteria of diabetes after renal transplant,25 and the decrease in eGFR relative to eGFR0 was taken as an indication of the degree of renal function damage. WZ capsule is often prescribed for patients with CYP3A5*1/*1 but rarely for patients with CYP3A5*3/*3, while patients with CYP3A5*1/*3 may or may not be treated with it in clinical practice. As we pooled CYP3A5*1/*1 and CYP3A5*1/*3 into the CYP3A5*1 group in this study, there were individuals with CYP3A5*1 combined with WZ capsule or not. In addition, as shown in Supplementary Table 6, 11 individuals had CYP3A5*3/*3 combined with WZ capsule, therefore, we decided to run simulations for the four subgroups. Although age and HB influenced FPG0 and eGFR0 significantly, they did not affect the FPG and eGFR values after tacrolimus treatment, so these two covariates were not simulated in subgroups.
A limitation of this study is that the population PK model was established only from trough concentrations of tacrolimus and lacked the necessary information to estimate the absorption parameters, which could compromise the model’s predictive performance. Previous reports including intensive blood sampling data have shown that the Area Under the Curve (AUC) may be a more appropriate PK indicator for establishing PK/PD models,17,22 Our next work will employ Bayesian estimation of AUC from limited samples or incorporate early-phase PK sampling to better characterize the dose-exposure-response relationship. On the other hand, since the stress response after transplantation could not be excluded and the observed values of FPG at 3~6 months did not collect sufficient data in the C0-FPG model, the model might overestimate the FPG value. Furthermore, the parameters associated with changes (β for FPG and Imax/IC50 for eGFR) are fixed, and there is no way to account for individual variability in PD, limiting the model’s ability to provide accurate predictions; thus, more reasonable models still need to be explored and we will prospectively evaluate whether model-informed dosing achieves target drug concentrations while mitigating adverse effects for clinical implementation. It should be noted that this is a single-center study, so its broader applicability across ethnic groups, especially in populations where WZ capsules are not administered or CYP3A5 genotypes cannot be known warrants further investigation. Moreover, clinical implementation of the models presents several practical challenges, including licensing requirements, specialized technical infrastructure, and the need for dedicated personnel training. The model’s dosing simulations and real-world clinical implementation require further validation. Nevertheless, this study developed population PK/PD models that could quantitatively describe the relationship between tacrolimus exposure and adverse reactions in renal transplant patients, which might provide some insights into choosing individual tacrolimus regimens.
Conclusion
In summary, this is the first study to quantitatively reveal the relationship between the dose, exposure, and adverse effects of tacrolimus in patients with renal transplant through PK/PD models. The CYP3A5 genotype and WZ capsule are crucial for choosing the appropriate dose of tacrolimus. Individuals with CYP3A5*3/*3 who not combined with the WZ capsule or with CYP3A5*1 combined with the WZ capsule have the advantage of quickly reaching the TDM range while reducing the risk of PTDM and nephrotoxicity. Patients with the CYP3A5*1 genotype who are not treated with WZ capsules should be given a dose of no less than 3 mg to reach the TDM range within 7 days after administration. The group of CYP3A5*3/*3 patients treated with the WZ capsule achieved the TDM range, and the FPG value was at a controllable level within 1 month after surgery under the tacrolimus dosage regimen of 2 mg q12h, while the eGFR decreased by 20% compared with the baseline value. Patients with a CYP3A5*3/*3 mutation treated with the WZ capsule should be aware of nephrotoxicity even when tacrolimus is administered at a low dose.
Data Sharing Statement
The authors do not intend to share de-identified individual participant data due to concerns regarding participant privacy and confidentiality, as well as restrictions imposed by the ethical review board that approved the study. While the model codes for phoenix and NLME files will be made available on request.
Acknowledgments
The authors would like to express their gratitude to the participants of this study for their time and selfless contribution to this research.
Disclosure
This paper has been uploaded to Authorea as a preprint: https://www.authorea.com/doi/full/10.22541/au.174611898.88028142/v1. The authors report no conflicts of interest in this work.
References
1. Knoll G, Campbell P, Chassé M, et al. Immunosuppressant medication use in patients with kidney allograft failure: a prospective multicenter Canadian cohort study. J Am Soc Nephrol. 2022;33:1182–1192. doi:10.1681/ASN.2021121642
2. Wojciechowski D, Wiseman A. Long-term immunosuppression management: opportunities and uncertainties. Clin J Am Soc Nephrol. 2021;16:1264–1271. doi:10.2215/CJN.15040920
3. Vincenti F, Jensik SC, Filo RS, Miller J, Pirsch J. A long-term comparison of tacrolimus (FK506) and cyclosporine in kidney transplantation: evidence for improved allograft survival at five years. Transplantation. 2002;73:775–782. doi:10.1097/00007890-200203150-00021
4. Ekberg H, Tedesco-Silva H, Demirbas A, et al; ELITE-Symphony Study. Reduced exposure to calcineurin inhibitors in renal transplantation. N Engl J Med. 2007;357:2562–2575. doi:10.1056/NEJMoa067411
5. Chadban S. New-onset diabetes after transplantation--should it be a factor in choosing an immunosuppressant regimen for kidney transplant recipients. Nephrol Dial Transplant. 2008;23:1816–1818. doi:10.1093/ndt/gfn052
6. Liu J-Y, You R-X, Guo M, et al. Tacrolimus versus cyclosporine as primary immunosuppressant after renal transplantation: a meta-analysis and economics evaluation. Am J Ther. 2016;23:e810–824. doi:10.1097/MJT.0000000000000150
7. U.S. Multicenter FK506 Liver Study Group. A comparison of tacrolimus (FK 506) and cyclosporine for immunosuppression in liver transplantation. N Engl J Med. 1994;331:1110–1115. doi:10.1056/NEJM199410273311702
8. Porrini EL, Díaz JM, Moreso F, et al. Clinical evolution of post-transplant diabetes mellitus. Nephrol Dial Transplant. 2016;31:495–505. doi:10.1093/ndt/gfv368
9. Rodriguez-Rodriguez AE, Porrini E, Torres A. Beta-cell dysfunction induced by tacrolimus: a way to explain type 2 diabetes? Int J Mol Sci. 2021;22:10311. doi:10.3390/ijms221910311
10. Bentata Y. Tacrolimus: 20 years of use in adult kidney transplantation. What we should know about its nephrotoxicity. Artif Organs. 2020;44:140–152. doi:10.1111/aor.13551
11. Azarfar A, Ravanshad Y, Mehrad-Majd H, et al. Comparison of tacrolimus and cyclosporine for immunosuppression after renal transplantation: an updated systematic review and meta-analysis. Saudi J Kidney Dis Transpl. 2018;29:1376–1385. doi:10.4103/1319-2442.248292
12. Venkataramanan R, Jain A, Warty VS, et al. Pharmacokinetics of FK 506 in transplant patients. Transplant Proc. 1991;23:2736–2740.
13. Jain A, Venkataramanan R, Todo S, et al. Intravenous, oral pharmacokinetics, and oral dosing of FK 506 in small bowel transplant patients. Transplant Proc. 1992;24:1181–1182.
14. Branch of Organ Transplantation, Chinese Medical Association. Technical specification for clinical application of immunosuppressants for organ transplantation. Organ Transpl. 2019;10:213–226.
15. Hoffert Y, Dia N, Vanuytsel T, et al. Model-informed precision dosing of tacrolimus: a systematic review of population pharmacokinetic models and a benchmark study of software tools. Clin Pharmacokinet. 2024;63:1407–1421. doi:10.1007/s40262-024-01414-y
16. Han N, Yun H, Hong J, et al. Prediction of the tacrolimus population pharmacokinetic parameters according to CYP3A5 genotype and clinical factors using NONMEM in adult kidney transplant recipients. Eur J Clin Pharmacol. 2013;69:53–63. doi:10.1007/s00228-012-1296-4
17. Passey C, Birnbaum AK, Brundage RC, Oetting WS, Israni AK, Jacobson PA. Dosing equation for tacrolimus using genetic variants and clinical factors. Br J Clin Pharmacol. 2011;72:948–957. doi:10.1111/j.1365-2125.2011.04039.x
18. Woillard J-B, de Winter BCM, Kamar N, Marquet P, Rostaing L, Rousseau A. Population pharmacokinetic model and Bayesian estimator for two tacrolimus formulations--twice daily Prograf and once daily Advagraf. Br J Clin Pharmacol. 2011;71:391–402. doi:10.1111/j.1365-2125.2010.03837.x
19. Wang -D-D, Chen X, Li Z-P. Wuzhi capsule and haemoglobin influence tacrolimus elimination in paediatric kidney transplantation patients in a population pharmacokinetics analysis: a retrospective study. J Clin Pharm Ther. 2019;44:611–617. doi:10.1111/jcpt.12828
20. Birdwell KA, Decker B, Barbarino JM, et al. Clinical pharmacogenetics implementation consortium (CPIC) Guidelines for CYP3A5 genotype and tacrolimus dosing. Clin Pharmacol Ther. 2015;98:19–24. doi:10.1002/cpt.113
21. Golubović B, Vučićević K, Radivojević D, Kovačević SV, Prostran M, Miljković B. Total plasma protein effect on tacrolimus elimination in kidney transplant patients--population pharmacokinetic approach. Eur J Pharm Sci. 2014;52:34–40. doi:10.1016/j.ejps.2013.10.008
22. Campagne O, Mager DE, Brazeau D, Venuto RC, Tornatore KM. The impact of tacrolimus exposure on extrarenal adverse effects in adult renal transplant recipients. Br J Clin Pharmacol. 2019;85:516–529. doi:10.1111/bcp.13811
23. Shi, bing-yi, Yuan, Ming. Chinese guidelines for immunosuppressive therapy in renal transplant recipients (2016 edition. Organ Transpl. 2016;7:327–331.
24. Zuo X, Ng CM, Barrett JS, et al. Effects of CYP3A4 and CYP3A5 polymorphisms on tacrolimus pharmacokinetics in Chinese adult renal transplant recipients: a population pharmacokinetic analysis. Pharmacogenet Genomics. 2013;23:251–261. doi:10.1097/FPC.0b013e32835fcbb6
25. Sharif A, Hecking M, de Vries APJ, et al. Proceedings from an international consensus meeting on posttransplantation diabetes mellitus: recommendations and future directions. Am J Transplant. 2014;14:1992–2000. doi:10.1111/ajt.12850
26. Chen D, Yao Q, Chen W, et al. Population PK / PD model of tacrolimus for exploring the relationship between accumulated exposure and quantitative scores in myasthenia gravis patients. CPT Pharmacometrics Syst Pharmacol. 2023;12:963–976. doi:10.1002/psp4.12966
27. Faelens R, Luyckx N, Kuypers D, Bouillon T, Annaert P. Predicting model-informed precision dosing: a test-case in tacrolimus dose adaptation for kidney transplant recipients. CPT Pharmacometrics Syst Pharmacol. 2022;11:348–361. doi:10.1002/psp4.12758
28. Schagen MR, Volarevic H, Francke MI, et al. Individualized dosing algorithms for tacrolimus in kidney transplant recipients: current status and unmet needs. Expert Opin Drug Metab Toxicol. 2023;19:429–445. doi:10.1080/17425255.2023.2250251
29. Fontova P, Rigo-Bonnin R, Vidal-Alabró A, et al. Measurement of calcineurin activity in peripheral blood mononuclear cells by ultra-high performance liquid chromatography-tandem mass spectrometry. Renal transplant recipients application (pharmacodynamic monitoring. Clin Chim Acta. 2019;495:287–293. doi:10.1016/j.cca.2019.04.079
30. Allard M, Puszkiel A, Conti F, et al. Pharmacokinetics and pharmacodynamics of once-daily prolonged-release tacrolimus in liver transplant recipients. Clin Ther. 2019;41:882–896.e3. doi:10.1016/j.clinthera.2019.03.006
31. Djaelani YA, Giese T, Sommerer C, Czock D. Pharmacodynamic monitoring of ciclosporin and tacrolimus: insights from nuclear factor of activated T-cell-regulated gene expression in healthy volunteers. Ther Drug Monit. 2023;45:87–94. doi:10.1097/FTD.0000000000001046
32. Staatz CE, Willis C, Taylor PJ, Tett SE. Population pharmacokinetics of tacrolimus in adult kidney transplant recipients. Clin Pharmacol Ther. 2002;72:660–669. doi:10.1067/mcp.2002.129304
33. Antignac M, Barrou B, Farinotti R, Lechat P, Urien S. Population pharmacokinetics and bioavailability of tacrolimus in kidney transplant patients. Br J Clin Pharmacol. 2007;64:750–757. doi:10.1111/j.1365-2125.2007.02895.x
34. Hecking M, Sharif A, Eller K, Jenssen T. Management of post-transplant diabetes: immunosuppression, early prevention, and novel antidiabetics. Transplant Int. 2021;34:27–48. doi:10.1111/tri.13783
35. Porrini E, Díaz JM, Moreso F, et al. Prediabetes is a risk factor for cardiovascular disease following renal transplantation. Kidney Int. 2019;96:1374–1380. doi:10.1016/j.kint.2019.06.026
36. Eide IA, Halden TAS, Hartmann A, et al. Mortality risk in post-transplantation diabetes mellitus based on glucose and HbA1c diagnostic criteria. Transpl Int. 2016;29:568–578. doi:10.1111/tri.12757
37. Wang LP, Hamaker E, Bergeman CS. Investigating inter-individual differences in short-term intra-individual variability. Psychol Methods. 2012;17:567–581. doi:10.1037/a0029317
38. Liu Y-O, Xie Q-F, Liu Z-Y, et al. Population pharmacokinetic analysis for dabigatran etexilate in Chinese patients with non-valvular atrial fibrillation. Front Cardiovasc Med. 2022;9:998751. doi:10.3389/fcvm.2022.998751
39. Bayer ND, Cochetti PT, Anil Kumar MS, et al. Association of metabolic syndrome with development of new-onset diabetes after transplantation. Transplantation. 2010;90:861–866. doi:10.1097/TP.0b013e3181f1543c
40. Ortega-Camarillo C, Guzmán-Grenfell AM, García-Macedo R, et al. Hyperglycemia induces apoptosis and p53 mobilization to mitochondria in RINm5F cells. Mol Cell Biochem. 2006;281:163–171. doi:10.1007/s11010-006-0829-5
41. Venkataramanan R, Swaminathan A, Prasad T, et al. Clinical pharmacokinetics of tacrolimus. Clin Pharmacokinet. 1995;29:404–430. doi:10.2165/00003088-199529060-00003
42. Kershner RP, Fitzsimmons WE. Relationship of FK506 whole blood concentrations and efficacy and toxicity after liver and kidney transplantation. Transplantation. 1996;62:920–926. doi:10.1097/00007890-199610150-00009
43. Rodríguez-Perálvarez M, Germani G, Darius T, Lerut J, Tsochatzis E, Burroughs AK. Tacrolimus trough levels, rejection and renal impairment in liver transplantation: a systematic review and meta-analysis. Am J Transplant. 2012;12:2797–2814. doi:10.1111/j.1600-6143.2012.04140.x
44. Stevens PE, Levin A. Kidney disease: improving global outcomes chronic kidney disease guideline development work group members, evaluation and management of chronic kidney disease: synopsis of the kidney disease: improving global outcomes 2012 clinical practice guideline. Ann Intern Med. 2013;158:825–830. doi:10.7326/0003-4819-158-11-201306040-00007
45. Wang T, Zhao Z, Wang G, et al. Age-related disparities in diabetes risk attributable to modifiable risk factor profiles in Chinese adults: a nationwide, population-based, cohort study. Lancet Healthy Longev. 2021;2:e618–e628. doi:10.1016/S2666-7568(21)00177-X
46. Sato Y, Yanagita M. Immunology of the ageing kidney. Nat Rev Nephrol. 2019;15:625–640. doi:10.1038/s41581-019-0185-9
47. Palmer SC, Saglimbene V, Mavridis D, et al. Erythropoiesis-stimulating agents for anaemia in adults with chronic kidney disease: a network meta-analysis. Cochrane Database Syst Rev. 2014;2014:CD010590. doi:10.1002/14651858.CD010590.pub2
 © 2025 The Author(s). This work is published and licensed by Dove Medical Press Limited. The
full terms of this license are available at https://www.dovepress.com/terms
and incorporate the Creative Commons Attribution
- Non Commercial (unported, 4.0) License.
By accessing the work you hereby accept the Terms. Non-commercial uses of the work are permitted
without any further permission from Dove Medical Press Limited, provided the work is properly
attributed. For permission for commercial use of this work, please see paragraphs 4.2 and 5 of our Terms.
© 2025 The Author(s). This work is published and licensed by Dove Medical Press Limited. The
full terms of this license are available at https://www.dovepress.com/terms
and incorporate the Creative Commons Attribution
- Non Commercial (unported, 4.0) License.
By accessing the work you hereby accept the Terms. Non-commercial uses of the work are permitted
without any further permission from Dove Medical Press Limited, provided the work is properly
attributed. For permission for commercial use of this work, please see paragraphs 4.2 and 5 of our Terms.
Recommended articles
Towards Personalized Tacrolimus Dosing Using an Algorithm-Driven Prediction Pipeline for Kidney Transplant
Min J, Li Q, Lai W, Liu Z, Chen G
Drug Design, Development and Therapy 2026, 20:575125
Published Date: 7 January 2026