Back to Journals » Drug Design, Development and Therapy » Volume 20
An Integrated Population Pharmacokinetic and Machine Learning Model for Predicting Tacrolimus Exposure in Adult Patients with Nephrotic Syndrome
Authors Zhou Y, Zhou Z, Chen S, Zhu L, Yun Y, Yuan Y, Chen C, Zou J ![]() , Zhao J
, Zhao J
Received 24 October 2025
Accepted for publication 13 March 2026
Published 23 March 2026 Volume 2026:20 576598
DOI https://doi.org/10.2147/DDDT.S576598
Checked for plagiarism Yes
Review by Single anonymous peer review
Peer reviewer comments 2
Editor who approved publication: Prof. Dr. Tin Wui Wong
Yehui Zhou,1,2,* Zhou Zhou,2,* Shiting Chen,1,2,* Lili Zhu,3,* Yuting Yun,1,2 Yuan Yuan,4 Chen Chen,2 Jianjun Zou,2 Jun Zhao5,6
1School of Basic Medicine and Clinical Pharmacy, China Pharmaceutical University, Nanjing, Jiangsu, People’s Republic of China; 2Department of Pharmacy, Nanjing First Hospital, Nanjing Medical University, Nanjing, Jiangsu, People’s Republic of China; 3Pharmacy Laboratory Centre, School of Pharmacy, Xinjiang Second Medical College, Karamay, Xinjiang, People’s Republic of China; 4Department of Pharmacy, First Affiliated Hospital of Xinjiang Medical University, Urumqi, Xinjiang, People’s Republic of China; 5Xinjiang Key Laboratory of Clinical Drug Research, The First Affiliated Hospital of Xinjiang Medical University, Urumqi, Xinjiang, People’s Republic of China; 6Ministry of Education Engineering Research Center of Xinjiang and Central Asian Medicine Resources, Urumqi, Xinjiang, People’s Republic of China
*These authors contributed equally to this work
Correspondence: Jun Zhao, Xinjiang Key Laboratory of Clinical Drug Research, The First Affiliated Hospital of Xinjiang Medical University, Urumqi, 830000, People’s Republic of China, Email [email protected] Jianjun Zou, Department of Pharmacy, Nanjing First Hospital, Nanjing Medical University, No. 68 Changle Road, Nanjing, 210006, People’s Republic of China, Email [email protected]
Purpose: Tacrolimus (TAC) is a calcineurin inhibitor widely used for immunosuppressive therapy. It has a narrow therapeutic window and substantial interindividual variability, making therapeutic drug monitoring (TDM) essential. Traditional population pharmacokinetic (PPK) models have limited capacity to capture complex nonlinear relationships and multifactorial interactions. This study aimed to integrate PPK and machine learning (ML) to predict TAC plasma concentration.
Patients and Methods: A total of 182 consecutive patients with nephrotic syndrome (NS) who received oral TAC therapy and underwent TDM and CYP3A5 genotyping at the First Affiliated Hospital of Xinjiang Medical University between January 2018 and December 2023 were enrolled. Individual PK parameters derived from the PPK model were incorporated as new features into ML models. Feature selection was performed using recursive feature elimination with cross-validation (RFECV), and the union of features selected by the three models with the highest R2 was used to construct the final feature set. Nine ML models were then developed, and the three best-performing models were combined into a weighted ensemble. Model performance was assessed by R2, mean absolute error (MAE), and root mean square error (RMSE). SHAP (SHapley Additive exPlanations) was used to interpret feature contributions.
Results: Incorporating PK parameters resulted in a consistent improvement in predictive performance compared with the model without PK parameters (R2: 0.633 vs. 0.602). The weighted ensemble of CatBoost, AdaBoost, and GraBoost (5:3:2) achieved the best performance (R2 = 0.633, MAE = 1.081, RMSE = 1.377), whereas the optimal weighting without PK parameters was 3:6:1 (R2 = 0.602, MAE = 1.139, RMSE = 1.432). SHAP analysis indicated that PK parameters was the most influential feature, exceeding conventional biochemical indicators.
Conclusion: Incorporating PK parameters enhanced model predictive performance, providing quantitative support for individualized TAC dosing and facilitating safer and more precise clinical applications.
Keywords: tacrolimus, population pharmacokinetics, machine learning, RFECV, plasma concentration prediction
Introduction
Nephrotic syndrome (NS) is a common clinical glomerular disease.1 The treatment of adult NS mainly relies on glucocorticoids combined with immunosuppressants.2 Tacrolimus (TAC), a calcineurin inhibitor (CNI), not only is it widely used in immunosuppressive therapy for NS, but it also serves as the first-line drug for preventing rejection following solid organ transplantation.3 Although TAC serves as a core immunosuppressive agent in both NS and kidney transplant patients,4 significant differences exist in their pathophysiological mechanisms, therapeutic targets, and pharmacokinetic characteristics. Consequently, dosing strategies and target concentration ranges established in kidney transplantation cannot be directly applied to NS patients. Current research on TAC has been limited to children, with no corresponding studies conducted on adults.5 This study aims to fill this gap, providing direct evidence for precision medication in this population. However, TAC not only has a narrow therapeutic window but also exhibits significant interindividual variability in its biological metabolism.6,7 The metabolism of TAC is primarily mediated by the CYP3A4 enzyme in the liver and intestines, and variations in the activity of this enzyme are one of the key factors contributing to interindividual pharmacokinetic variability.8 The expression and function of CYP3A4 are regulated by multiple factors, including genetic polymorphisms, drug interactions, and disease states, further exacerbating interindividual variability in TAC metabolism.9 Simultaneously, factors such as route of administration and formulation type also exert substantial influence on its plasma concentrations.10 Therefore, it is of great clinical significance to identify fluctuations in TAC plasma concentration at an early stage after administration in adult NS patients, as this helps truly achieve individualized therapy.
Currently, although therapeutic drug monitoring (TDM) can be used to adjust individualized medication regimens, it exhibits a time lag when reflecting changes in blood concentration.11 In contrast, a population pharmacokinetics (PPK) model can utilize clinical data to obtain PPK parameters for different patients, while also having the power to verify the effect of multiple factors on pharmacokinetics, thereby providing the possibility of determining the optimal dose schedule.12 Nevertheless, most PPK models for predicting plasma concentration of TAC were derived from pediatric populations, and none exist for adults. In recent years, machine learning (ML) has effectively addressed multicollinearity and interaction effects among multiple variables, and accurately predicted plasma drug concentrations promptly based on patients’ multidimensional features.13 Unfortunately, the integration of the PPK model with ML algorithms to improve model performance has not yet been explored in adult NS patients.
Therefore, this study aims to integrate the PPK model with ML algorithms to construct an accurate and interpretable plasma concentration prediction model, thereby providing a safer and effective personalized dose schedule for adult NS patients. Additionally, it seeks to explore whether and to what extent incorporating PPK parameters can enhance predictive performance.
Materials and Methods
Study Population
This study included consecutive adult patients diagnosed with NS at the First Affiliated Hospital of Xinjiang Medical University between January 2018 and December 2023 who received oral TAC therapy and underwent TDM for TAC as well as CYP3A5 genotyping. Patients enrolled between January 2018 and December 2019 constituted the internal dataset, whereas those enrolled between January 2020 and December 2023 formed the external validation dataset. All included patients received the original immediate-release tacrolimus formulation (TAC capsules) administered orally. The initial total daily dose is 0.05–0.1 mg/kg, administered orally in two divided doses (morning and evening), and was subsequently adjusted according to therapeutic drug monitoring (TDM) results and clinical response. Patients were excluded if they met any of the following criteria: (1) Patients aged <18 years; (2) Patients with TAC trough concentrations (Cmin) not reaching steady state as monitored by TDM; (3) Patients with significant gaps in clinical documentation; (4) Patients experiencing transplantation, malignancy, or severe infections arising from sepsis/septicaemia/organ dysfunction/surgical intervention. Multiple blood samples from the same patient collected over >7 days may be treated as independent specimens.6 This study complied with the principles of the Declaration of Helsinki and was approved by the Ethics Committee of the First Affiliated Hospital of Xinjiang Medical University (Approval No.: K201912-07; Approval Date: December 25, 2019). The research involved retrospective analysis of medical records obtained during prior clinical diagnosis and treatment, without involving human biological samples. All data are accessible through the hospital’s Electronic Medical Record System (EMRS). Consequently, the Ethics Committee agreed to waive the requirement for informed consent.
Data Collection
This study retrospectively collected patient demographic characteristics and relevant clinical data during medication periods through the Jiahe 6.0 medical record system at the First Affiliated Hospital of Xinjiang Medical University. The final categories of variables collected included: (1) Basic demographic information; (2) Genetic information; (3) Laboratory test items; (4) Concomitant medications; (5) TAC administration information.
Measurement of TAC Plasma Concentration
Patients should take the medication in the morning and evening on an empty stomach to minimize the potential impact of food on TAC absorption. Steady-state plasma concentrations are typically achieved after 5–7 half-lives (approximately 12 hours per half-life). To ensure steady-state levels, blood samples should be collected after continuous administration for at least 3 days. The collected blood samples were then delivered by nursing staff to the laboratory for analysis. All laboratory test values were based on the most recent measurement taken on the same day as the steady-state concentration blood draw, and these values were used for subsequent clinical analysis. TAC plasma concentrations were quantified using the Chemiluminescent Microparticle Immunoassay (CMIA). The fully automated immunoluminescent analyzer ARCHITECT i1000sr (Diagnostics Division, Abbott Laboratories, USA) was used in conjunction with the TAC measurement kit (ARCHITECT Tacrolimus Reagent Kit, USA) to determine TAC plasma concentrations.
Determination of CYP3A5 Genotype
The CYP3A5 (rs776746) genotype was determined by polymerase chain reaction (PCR) and sequencing methods. PCR was performed with specific primers for CYP3A5 (F: 5′-CCTAGTTGTACGACACACAGCA-3′, R: 5′-ACTGCCCTTGCAGCATTTAGTC-3′). The reaction mixture (25 μL) consisted of 1 μL of genomic DNA, 12.5 μL 2×Tap PCR MasterMix, and 1 μL of each primer. The reaction conditions included initial denaturation at 94°C for 5 minutes, followed by 30 cycles of 94°C for 30 seconds, 57°C for 30 seconds, and 72°C for 40 seconds, with a final extension at 72°C for 5 minutes. The PCR products were purified and analyzed using ABI 3730XL DNA sequencer (Applied Biosystems, USA). The sequence data were processed and analyzed using Chromas software.
Data Processing
First, after excluding variables with missing rates exceeding 20%, continuous and categorical variables were imputed using the K-nearest neighbor (KNN) method and the mode imputation method.14 Subsequently, with TAC plasma concentrations as the target variable, the internal dataset was randomly split into training and testing cohorts in a 7:3 ratio.15 The training cohort was used for model construction, while the testing cohort served to evaluate model performance and provide internal validation. The external dataset was utilized for external validation. Finally, each continuous variable underwent preprocessing for Z-score normalization, while each categorical variable was transformed using one-hot encoding.
Population Pharmacokinetic Model Analysis
Non-linear mixed-effects modelling software NONMEM® (Version 7.3, Icon Inc, PA, USA) and the gFortran compiler (Version 4.60, https://gcc.gnu.org/fortran/) were employed for PPK analysis. R version 4.2.2 and Xpose (Version 4.5.0, Uppsala University, Sweden, https://xpose.sourceforge.net) were used for plotting and visualization. The PPK modelling approach utilized the first-order conditional estimation (FOCE) method.
The objective function value (OFV) was calculated for both the one-compartment and two-compartment baseline models, incorporating first-order absorption and elimination. The optimal model was selected as the baseline model. Variables were screened using stepwise regression. When adding a variable to the baseline model resulted in a decrease in the model’s OFV value exceeding 3.84 (P<0.05), it was retained in the model; otherwise, it was excluded. After screening each variable sequentially, the full regression model was obtained. Using backward elimination, variables were sequentially removed from the full regression model. If the resulting model exhibited an increase in OFV greater than 6.63 (P < 0.01) compared to the full model, it was retained; otherwise, it was discarded. This process yielded the final model.
The final model was evaluated using goodness-of-fit (GOF), non-parametric bootstrap methods, and normalized prediction distribution error (NPDE). The goodness-of-fit plot examined scatter plots of observed values (DV) and conditional weighted residuals (CWRES) against population predicted concentrations (PRED) and individual predicted concentrations (IPRED). The Bootstrap method assessed model stability and internal validity by generating 500 repeated samples with replacement and conducting statistical testing. The Monte Carlo method generated 1000 simulated datasets to evaluate NPDE and validate the model’s predictive performance.
Modeling of Machine Learning
Modelling was performed using nine common machine learning algorithms, including categorical boosting (CatBoost), random forest (RF), light gradient boosting machine (LightGBM), gradient boosting (GraBoost), adaptive boosting (AdaBoost), eXtreme Gradient BoostingX (XGBoost), support vector regression (SVR), multilayer perceptron (MLP) and K-Nearest Neighbors (KNN). All model hyperparameters were optimized via grid search combined with 5-fold cross-validation. All machine learning models were constructed using “sklearn 1.7.0”, “catboost 1.2.7”, “xgboost 2.1.3”, and “lightgbm 4.5.0” within Python 3.12.4.
Recursive feature elimination with cross-validation (RFECV) is a feature selection algorithm that automatically selects the optimal subset of features through cross-validation to enhance model performance and generalization capability.16 This study employed the union of features obtained from the top three algorithms ranked by R2 value as the preliminary feature selection cohort. Subsequently, the variance inflation factor (VIF) was used to assess multicollinearity among the features. Features exhibiting severe multicollinearity were removed, with the final retained features constituting the definitive feature selection cohort.
Each algorithm underwent parameter tuning via 5-fold cross-validation. Model predictive performance was evaluated using R-squared (R2), mean absolute error (MAE), mean square error (MSE), and root mean square error (RMSE), metrics previously employed in relevant literature.11,17 The top three algorithms, ranked by R2 value, were selected to construct the ensemble model. The Voting algorithm was used for further model integration, whose core principle lies in reducing variance and bias compared to single models, thereby enhancing prediction robustness and accuracy.
Finally, to enhance the interpretability of the ensemble model, the SHAP (SHapley Additive exPlanations) method was employed to analyze the contribution of each variable. The final model was deployed as an online calculator for use in clinical practice.
Statistical Analysis
A two-tailed p-value < 0.05 is considered statistically significant. All statistical analyses in this study were conducted using R version 4.2.2 and Python 3.12.4. First, the Shapiro–Wilk test was employed to assess the normality of continuous variables. Based on Shapiro–Wilk results, continuous variables were described as mean ± standard deviation (SD) or median ± interquartile range (IQR). Categorical variables were reported as counts (frequencies). Differences in continuous variables between the two groups were assessed using t-tests for normally distributed data or the Mann–Whitney U-test for non-normally distributed data. For categorical variables, differences between groups were compared as appropriate to use χ2-tests or Fisher’s exact tests.
Results
Participants and Baseline Characteristics
This study strictly adhered to inclusion and exclusion criteria, ultimately incorporating 141 patients and 410 blood samples into the internal dataset for analysis. The median age of participants was 44 years (IQR: 31–53 years), with males constituting 58.5% of the cohort. Patients were randomly assigned to a training cohort (n = 287) and a testing cohort (n = 123), with no significant differences between the groups in any variables (p ≥ 0.05). Analysis of baseline characteristics demonstrated overall balance between groups (Table 1). The workflow for data processing, algorithm selection, and modelling was illustrated in Figure 1.
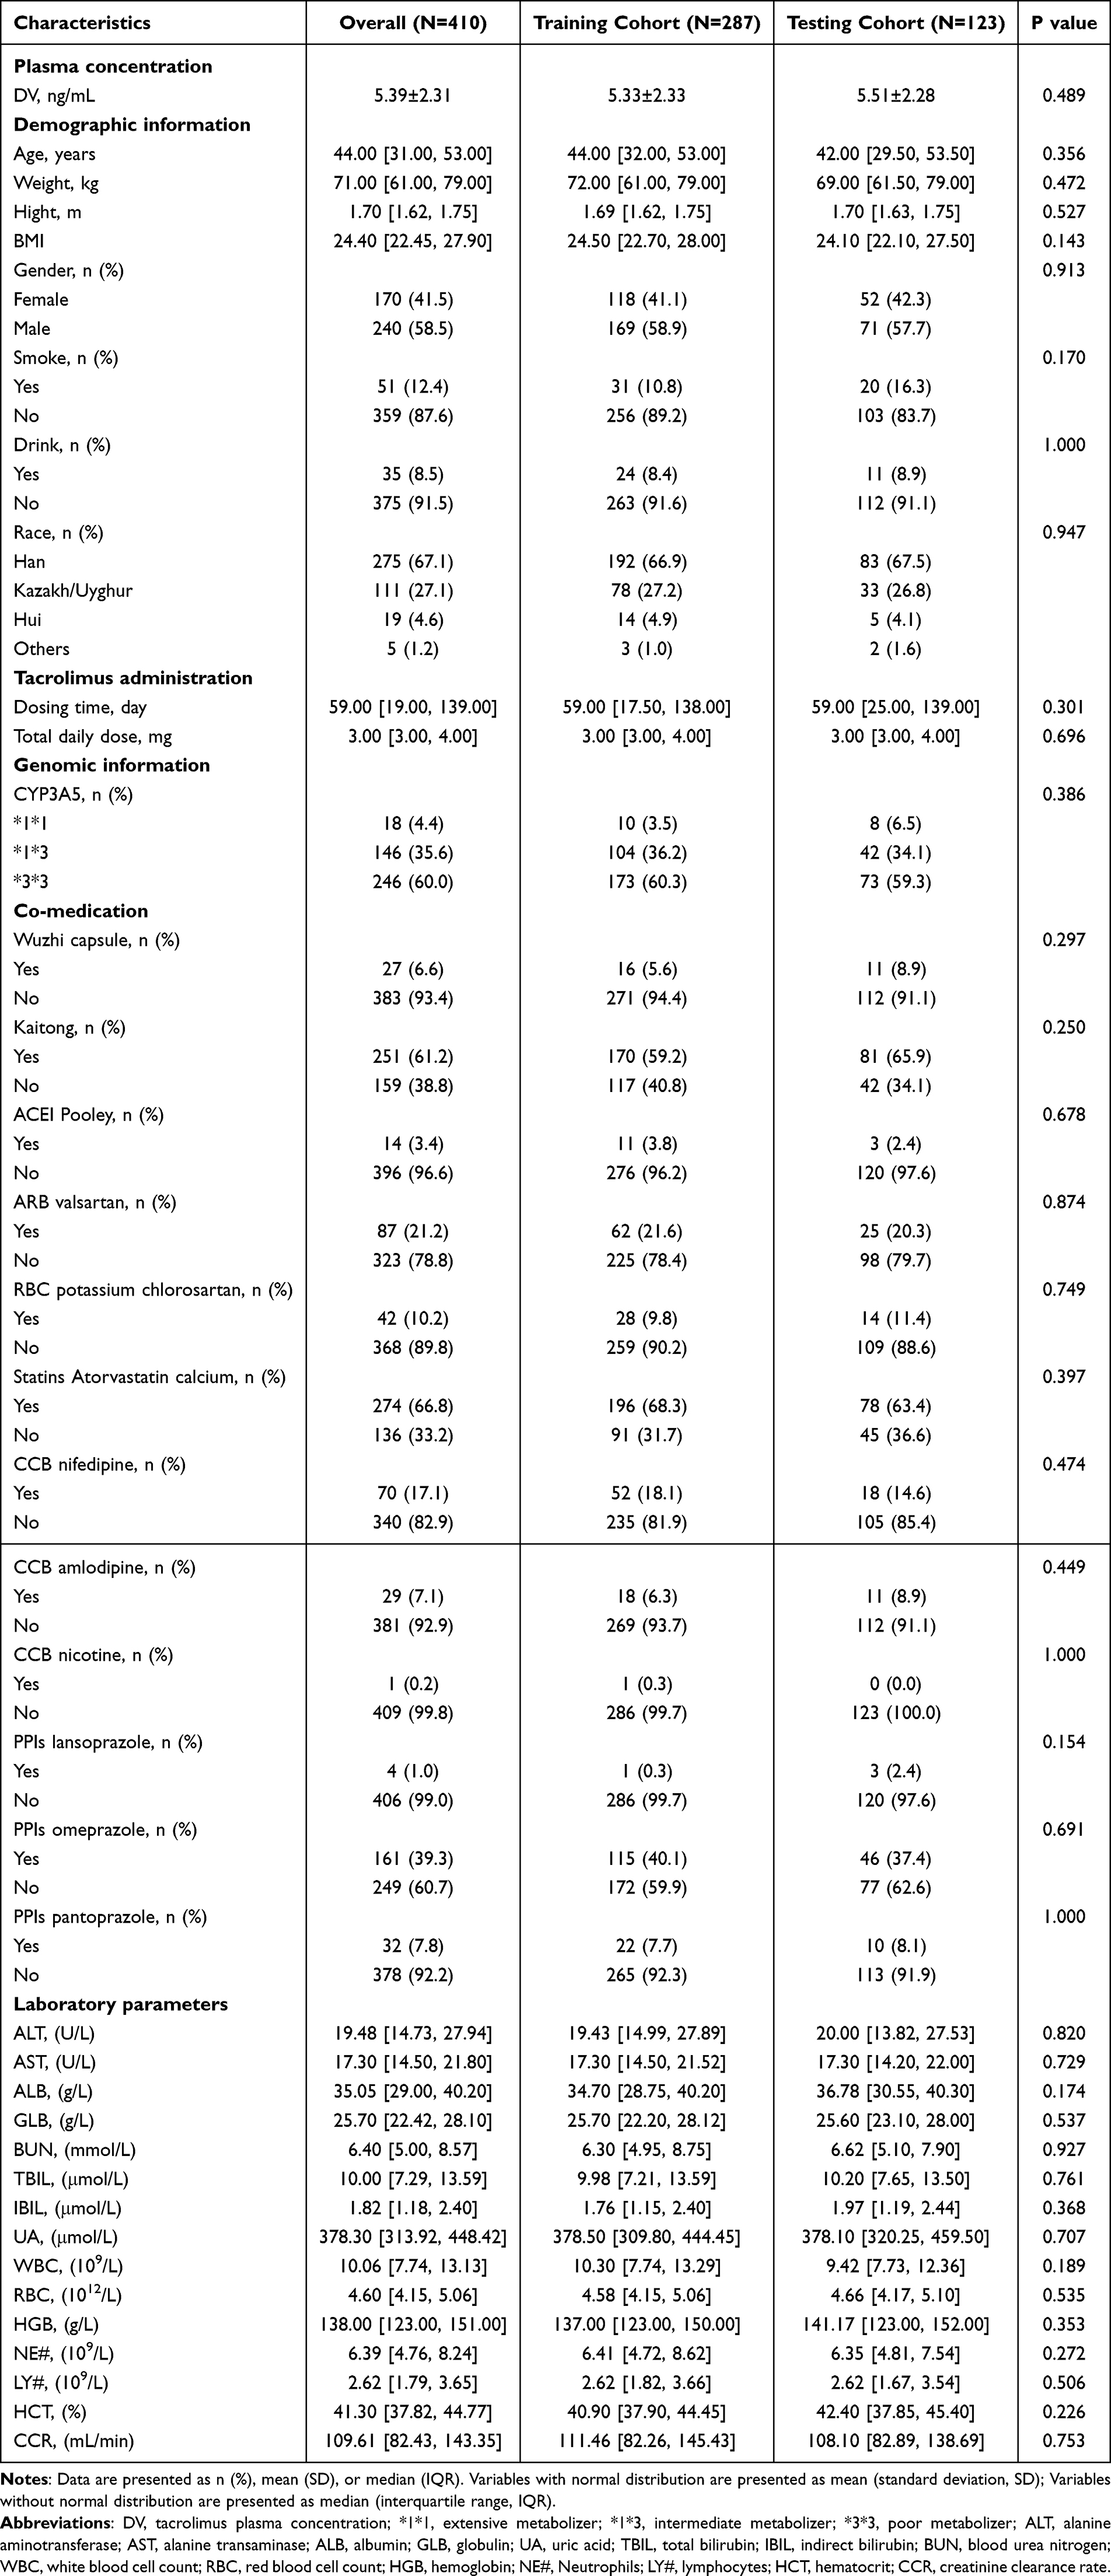 |
Table 1 The Difference of Characteristics Between the Training and Testing Cohorts |
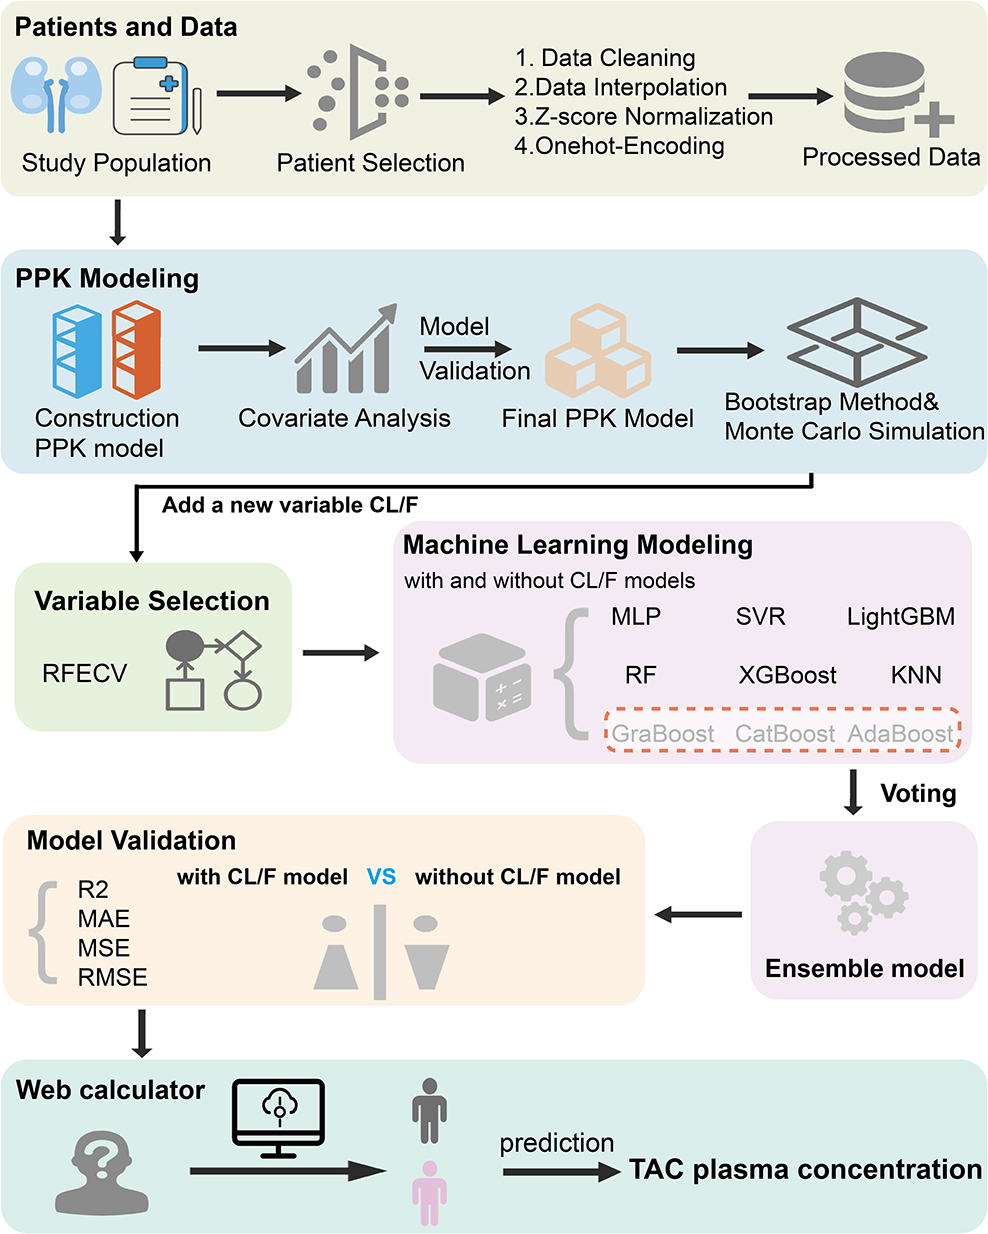 |
Figure 1 Schematic of the study workflow. Each colored box represents a step in the workflow, and the entire research workflow proceeds in the order indicated by the arrows. Abbreviations: TAC, tacrolimus; PPK, population pharmacokinetic; RFECV, Recursive feature elimination with cross-validation; CatBoost, categorical boosting; RF, random forest; LightGBM, light gradient boosting machine; GraBoost, gradient boosting; AdaBoost, adaptive boosting; XGBoost, eXtreme Gradient BoostingX; SVR, support vector regression; MLP, multilayer perceptron; KNN, K-Nearest Neighbors; R2, R-squared; MAE, mean absolute error; MSE, mean square error; RMSE, root mean square error. |
Population Pharmacokinetic Model
The peak time for TAC is 1–2 hours. As all data in this study represented trough concentrations following steady-state dosing, accurate fitting of absorption parameters was unfeasible. Therefore, based on reference,18 Ka was fixed at 4.5 h−1. The optimal model was selected as the baseline model based on the OFV value, where a lower OFV value indicates a superior fitting quality. The one-compartment model yielded an OFV of 871.437, while the two-compartment model produced an OFV of 870.304. With ΔOFV < 5.99 (P > 0.05, υ = 4), no significant difference existed between the two models’ OFV values. Consequently, the one-compartment model with fewer parameters was selected as the baseline model, employing a proportional residual model. The final model was constructed using forward stepwise regression and backward elimination. Covariate analysis revealed that inclusion of CYP3A5*3 and Wuzhi capsule (WZC, compound Salvia miltiorrhiza polyphenolic acid capsule) significantly influenced CL/F in the PPK model. The following equation represented the final PPK model:  , If combined with WZC, θ WZC = 0.731; if not combined with WZC, θ WZC = 1; if CYP3A5 genotype is *3*3, θ CYP3A5 = 0.768; if CYP3A5 genotype is *1*1/*1*3, θ CYP3A5= 1.
The parameters of the final model were comparable to those estimated via the Bootstrap method, with all relevant deviations falling within 5%, indicating that the parameter estimates from the final model were reliable and stable The Normalized prediction distribution errors (NPDE) diagnostic plot for the final PPK model is shown in Figure 2, while the parameter estimates and Bootstrap results are presented in Table S1.
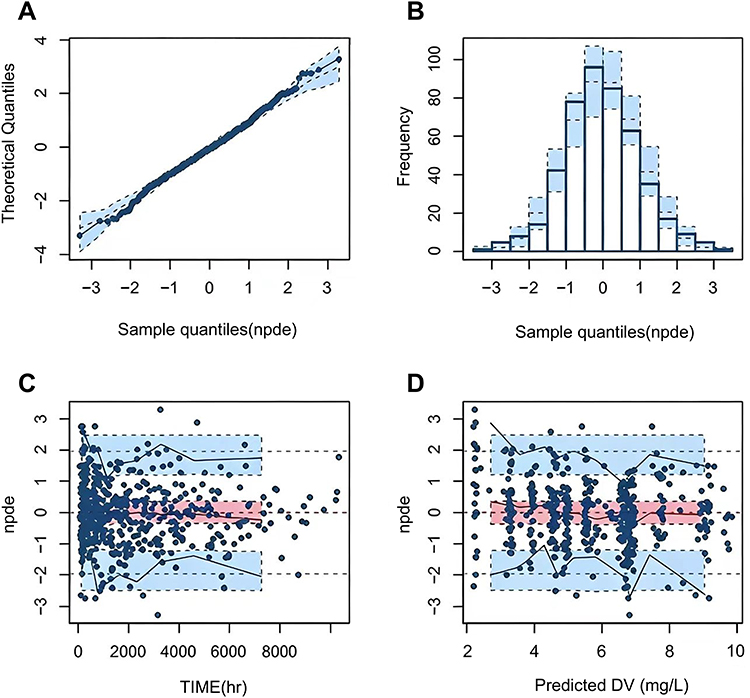 |
Figure 2 Normalized prediction distribution errors (NPDE) of the final population pharmacokinetic model. (A) Q-Q plot of the NPDE. (B) Histogram of the NPDE. (C) NPDE versus time after the last dose. (D) NPDE versus predicted concentration (PRED). Abbreviations: DV, tacrolimus plasma concentration. |
Feature Selection
In Table S2, when incorporating PK parameters (CL/F), RF, GraBoost, and AdaBoost demonstrated superior predictive performance (R2 values of 0.62, 0.57, and 0.51 respectively); without PK parameters, RF, CatBoost, and GraBoost yielded better results (R2 values of 0.57, 0.54, and 0.53 respectively). Consequently, the union of algorithms performing best under each condition was selected as the feature cohort. VIF testing revealed a high correlation between weight and BMI (VIF weight = 4.94, VIF BMI = 4.93). Considering BMI’s broader coverage, BMI was retained. Similarly, CL/F showed a higher correlation with CYP3A5 (VIF CL/F=4.79, VIF CYP3A5=4.85). As CYP3A5 and WZC jointly determined the clearance (CL/F), CL/F was retained, while CYP3A5 was excluded from the calculation. Feature VIF values for both scenarios were presented in Table S3. Ultimately, the model incorporating CL/F included nine features: total daily dose, CL/F, ALB, dosing time, NE#, BUN, CCR, IBIL, and BMI. The model without CL/F incorporated ten features: total daily dose, CYP3A5, ALB, dosing time, NE#, BUN, CCR, TBIL, IBIL, and BMI.
Machine Learning Model Construction and Validation
Based on the feature set obtained, three ML algorithms with the highest R2 values after parameter tuning were selected to construct an ensemble model. The weighting scheme was optimized through a Voting algorithm across 36 weight combinations (ranging from 8:1:1 to 1:1:8) to build the optimal ensemble model. Ultimately, when incorporating CL/F, the CatBoost, AdaBoost, and GraBoost combination (5:3:2) demonstrated optimal performance (R2 = 0.633, MAE = 1.081, MSE = 1.896, RMSE =1.377). Without CL/F, the CatBoost, AdaBoost, and GraBoost combination (3:6:1) yielded the best performance (R2=0.602, MAE=1.139, MSE=2.053, RMSE=1.432). It can be observed that models incorporating PK parameters outperform those without PK parameters across all performance metrics. The corresponding regression plots are detailed in Figure 3. Notably, despite feature reduction through screening, model performance improved relative to full feature cohorts (with CL/F: 0.633 vs. 0.62; without CL/F: 0.602 vs. 0.57). Performance comparisons of the TAC concentration prediction models on the training and testing cohorts were presented in Table S4 and Table 2 respectively.
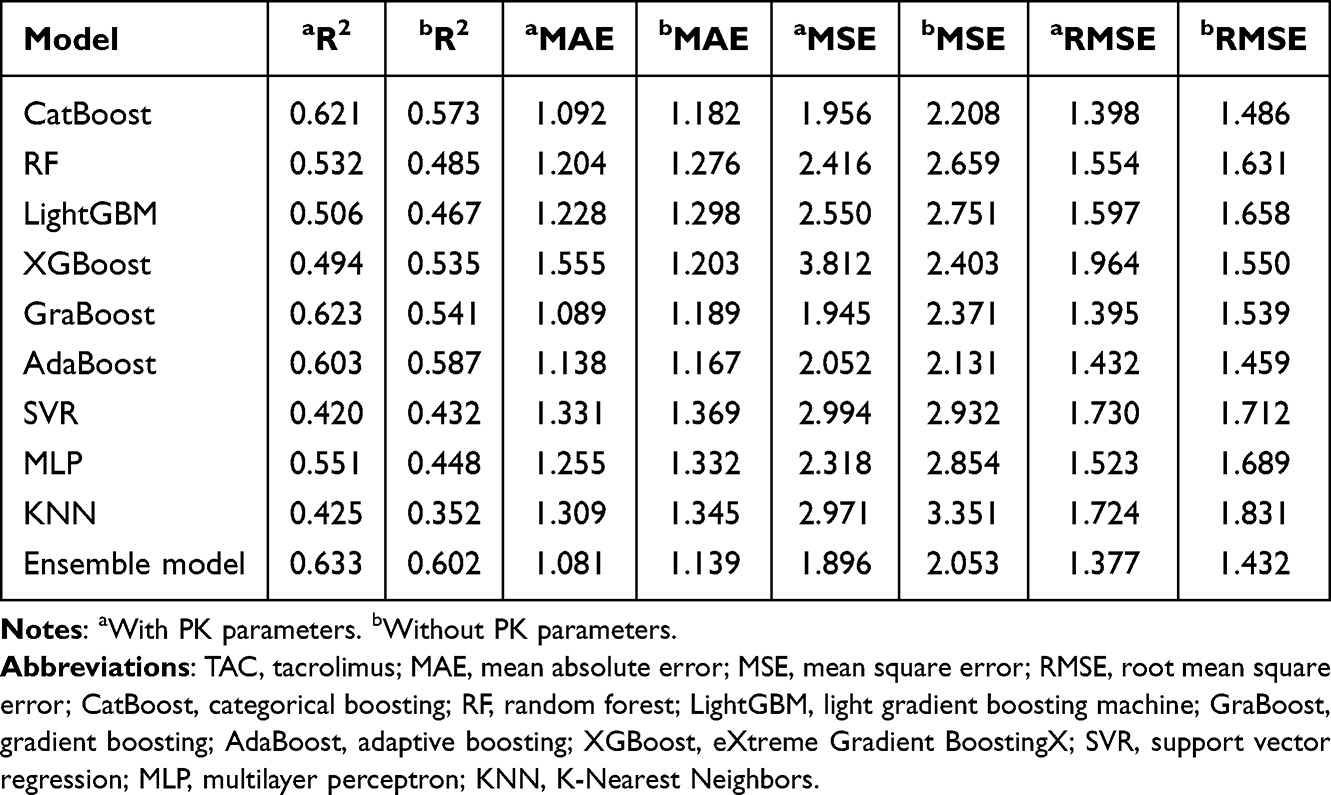 |
Table 2 Performance of the TAC Plasma Concentration Prediction Model in the Testing Cohort |
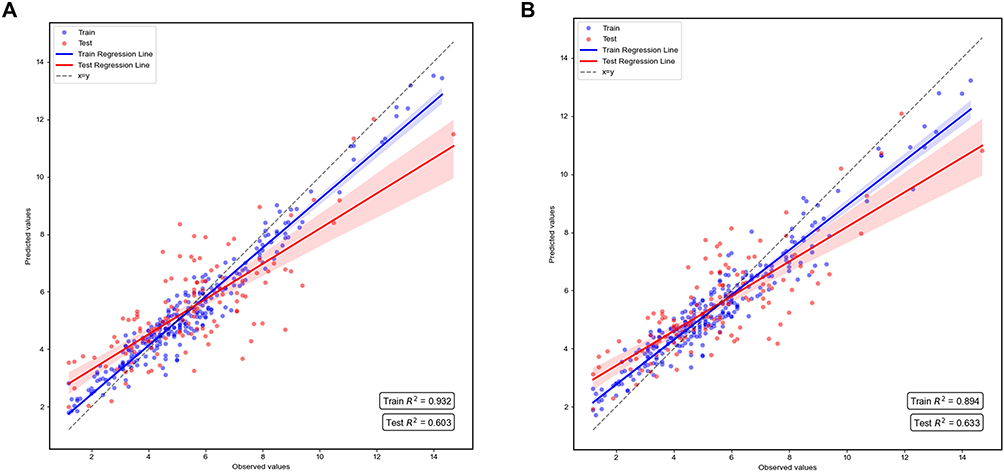 |
Figure 3 Regression Plots for Different Models. (A) without PK parameters. (B) with PK parameters. |
Interpretation and Application of the Ensemble Model
The SHAP algorithm was employed to elucidate the importance of each feature within the two ensemble models and their contribution to predicting plasma concentrations (Figure 4). Feature importance is measured by the mean absolute SHAP value and displayed in descending order. Each feature’s distinct value corresponds to a SHAP value (x-axis), representing its positive or negative contribution to the predicted TAC plasma concentration relative to the baseline value. The sum of all features’ SHAP values plus the baseline value equals the model’s predicted outcome. Point color indicates the magnitude of feature values, with red denoting higher values and blue denoting lower values. It was evident that the total daily dose and CL/F exert the most significant influence on model predictions. Statistical comparison (see Table S5) demonstrated that the mean absolute SHAP value of CL/F was significantly higher than that of BUN, the second-ranked biochemical indicator (mean difference = 0.98, 95% CI 0.91–1.05, p < 0.001). Higher values of total daily dose, BUN, ALB, IBIL, NE#, and TBIL correlate positively with elevated predicted concentrations, whereas higher CL/F, BMI, and dosing time correlate negatively with higher predicted concentrations.
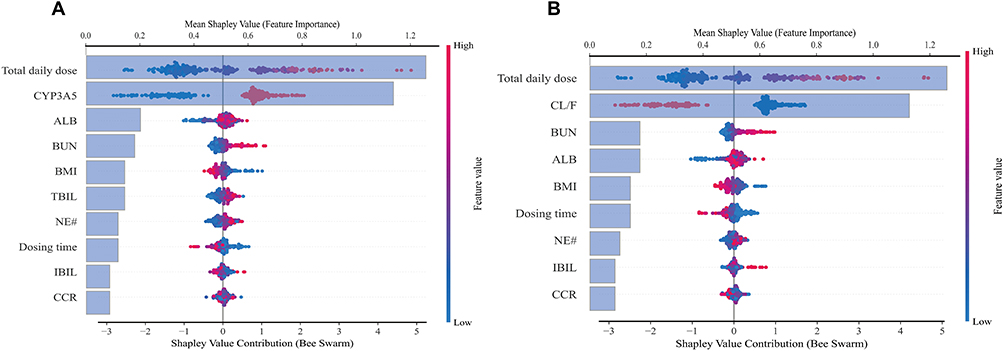 |
Figure 4 SHAP summary plots for model interpretation. (A) Feature importance and SHAP value distributions for model without PK parameters. (B) Feature importance and SHAP value distributions for model with PK parameters. Each feature’s distinct value corresponds to a SHAP value, representing the positive or negative contribution of that feature to the predicted TAC plasma concentration relative to the baseline value. The sum of all SHAP values, along with the baseline, equals the model’s predicted outcome. Abbreviations: SHAP, SHapley Additive exPlanations; ALB, albumin; NE#, Neutrophils; BUN, blood urea nitrogen; CCR, creatinine clearance rate; IBIL, indirect bilirubin; TBIL, total bilirubin; CL/F, apparent clearance. |
To facilitate clinical adoption and accessibility of the developed prediction model, the real-time TAC plasma concentration predictor has been deployed to the cloud for use across different stages (with PK parameters: ppk-tac-plasma-concentration-predictor.streamlit.app; without PK parameters: without-ppk-tac-plasma-concentration-predictor.streamlit.app). As illustrated in Figure 5, this web-based, user-friendly tool enables clinicians to obtain predictive outcomes by inputting relevant patient information. Concurrently, the waterfall plot visually demonstrates the specific contribution of each feature to the model’s output, providing intuitive evidence for understanding the predictive process.
 |
Figure 5 Real-time prediction network calculator for TAC plasma concentration. (A) without PK parameters. (B) with PK parameters. Users can predict plasma concentrations by clicking the “Predict Tacrolimus Plasma Concentration” button via the online link. The accompanying SHAP waterfall plot also enables clinicians or patients to conveniently visualize the specific impact of each feature on the outcome. The forecast results include a range of ±20% around the predicted value, and any actual value within this forecast range is considered a reasonable fluctuation. Abbreviations: ALB, albumin; NE#, Neutrophils; BUN, blood urea nitrogen; CCR, creatinine clearance rate; IBIL, indirect bilirubin; TBIL, total bilirubin; CL/F, apparent clearance. |
Comparison of Predictive Performance Across TDM Subgroups
To compare the predictive performance of model with PK parameters across TDM subgroups, patients were categorized into three groups based on the reasonable TAC therapeutic target range for adult patients with NS (5–10 ng/mL):19 below the therapeutic window (<5 ng/mL), within the therapeutic window (5–10 ng/mL), and above the therapeutic window (>10 ng/mL). Results indicated that predictive performance was best within the therapeutic window (R2 = 0.678, MAE = 0.554, MSE = 0.510, RMSE = 0.714), followed by below the therapeutic window (R2 = 0.620, MAE = 0.516, MSE = 0.372, RMSE = 0.610), with the poorest performance above the therapeutic window. This disparity stems from the fact that in this study, only 4.1% of patients were above the therapeutic window, 46.6% were below, and 49.3% were within the therapeutic window. Consequently, the model exhibited a bias toward patients below and within the therapeutic window, demonstrating poorer predictive performance for those above the window. Based on this, we recommend developing a dedicated data model for patients exceeding the therapeutic window to enhance predictive accuracy and clinical applicability.
Evaluation of Ethnic Differences in CYP3A5 Genotype Distribution
The Hardy–Weinberg equilibrium (HWE) test results (Table 3) indicated that the CYP3A5 genotype distribution in the overall population showed no significant deviation from the theoretical expectation (χ2 = 0.395, P = 0.821), suggesting that the sample complies with HWE at the population level. This confirms the reliability of genotyping results, with no significant sampling bias or genotyping errors observed. Given that the study sample encompassed multiple ethnic groups, it possessed greater representativeness compared to a single-ethnic cohort, whilst the proportions of each genotype also accurately reflected the overall genetic structure of the population. Considering the reliability of the study design and data collection, the temporal and regional characteristics covered further ensured the equilibrium and representativeness of the collected samples within the scope above. This enabled the generalizability of the findings to populations exhibiting genetic diversity and provided a reliable basis for the individualized application of CYP3A5-related medications.
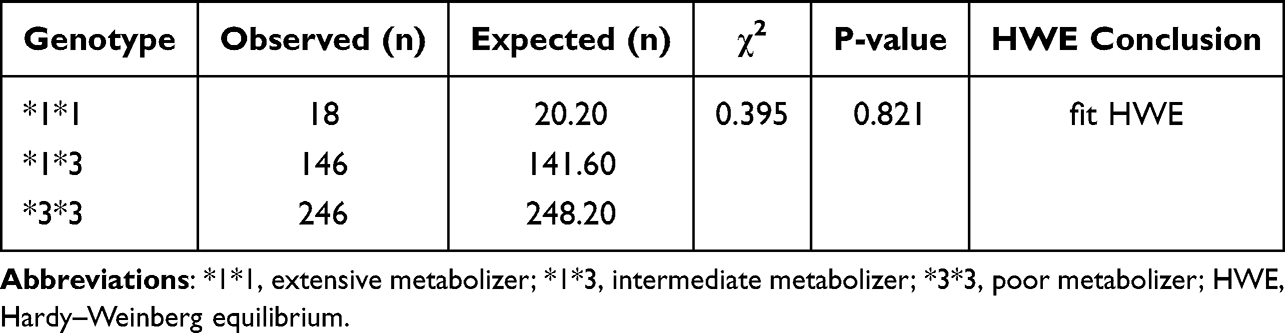 |
Table 3 Hardy–Weinberg Equilibrium Analysis of CYP3A5 Genotypes in the Study Population |
Temporal External Validation
The external dataset comprised 34 patients and 149 blood samples. Following rigorous inclusion and exclusion criteria, 12 patients and 41 blood samples were ultimately analyzed. Consistent with internal validation, models incorporating PK parameters demonstrated superior performance metrics compared to those without PK parameters (with CL/F: R2=0.61, MAE=1.529, MSE=3.703, RMSE=1.924; without CL/F: R2=0.56, MAE=1.580, MSE=4.019, RMSE=2.005). Predictive performance was assessed using absolute accuracy (±2 ng/mL) and relative accuracy (±20%) (see Figure 6). Results indicated that the predicted values from both models broadly encompassed the observed values. This demonstrated that the models achieve favorable predictive performance regardless of whether specific PK parameters were incorporated.
 |
Figure 6 Comparison of predicted and observed value in external validation. (A) without PK parameters. (B) with PK parameters. The blue dots indicated the observed values, and red dots indicated the predicted values. The Orange shade represented within ±20% of the observed values, and the green shade represented within ±2 ng/mL of the observed values. |
Discussion
As the first study integrating population PPK models with ML algorithms, it selected the three ML algorithms with the highest R2 values from the obtained feature cohort, constructed a voting ensemble model, and ultimately achieved successful prediction of TAC plasma concentrations in adult NS patients. Comparative evaluation metrics revealed that the ensemble model achieved optimal performance with a 5:3:2 combination of CatBoost, AdaBoost, and GraBoost, yielding an R2 value of 0.633. Conversely, without CL/F parameters, the ensemble model demonstrated best performance using a 3:6:1 combination of CatBoost, AdaBoost, and GraBoost, achieving an R2 value of 0.602. Finally, the model was deployed as an online calculator for convenient bedside use.
CYP3A5 gene polymorphisms and their inter-ethnic distribution variations have been confirmed as key factors influencing the individualized medication regimens of TAC. This is readily understandable for two primary reasons. On the one hand, CYP3A5 gene polymorphisms determine enzyme activity, thereby affecting the metabolic efficiency of TAC. As the primary metabolic enzyme for TAC, CYP3A5 activity is regulated by genetic polymorphisms. Common variants such as the CYP3A5*3 allele can lead to significantly reduced or absent enzyme activity. Patients carrying active alleles exhibit robust metabolic capacity, resulting in rapid TAC clearance and requiring higher doses to achieve therapeutic blood concentrations. Conversely, patients with low-activity or non-functional alleles exhibit reduced metabolic capacity and slower drug clearance, achieving target concentrations at lower doses. This perspective was validated in previously publication.20 On the other hand, the distribution of CYP3A5 gene polymorphisms exhibits marked ethnic variations, resulting in distinct overall metabolic profiles across different ethnic groups. Existing research has confirmed that the frequency of the low-activity allele for CYP3A5 varies significantly across different ethnic.21 More importantly, the sample selection is not limited to a single ethnicity. It encompasses not only the Han Chinese but also multiple ethnic minority groups including Kazakh, Uyghur, and Hui populations. We are confident that incorporating multi-ethnic samples could significantly enhance the extrapolation reliability of predictive models. Furthermore, the Hardy-Weinberg equilibrium (HWE) test revealed no significant deviation between the CYP3A5 genotype distribution in the study population and theoretical expectations. This finding provides intuitive and reliable evidence.
The emerging technological pipeline, which integrates both the PPK model and ML algorithms, serves as a highly accessible predictive tool in clinical practice. The PPK model precisely reveals pharmacokinetic characteristics and variation patterns in specific populations, such as the impact of factors like the combined use of WZC and CYP3A5 genotype on TAC clearance rates. It further elucidates the mechanisms by which covariates influence blood concentrations through population variability analysis. Meanwhile, ML algorithms, with their built-in advantages, enable fast and accurate data analysis for handling large-scale and high-dimensional datasets. Thus, further study of the differences in performance between the PPK model and ML algorithms uncovered an interesting phenomenon: the predictive ability of pure ML is not significantly reduced compared to the ensemble PPK-ML model. Integrating both approaches ensures the model adheres to pharmacokinetic logic while enhancing its clinical applicability.
Furthermore, this study demonstrated that multiple factors may alter TAC plasma concentrations, with their influence on protein binding being the underlying mechanism. TAC exhibits approximately 99% plasma protein binding, whilst blood urea can elevate free drug levels by promoting protein N-acetylation. This implies that patients with elevated blood urea nitrogen levels exhibit significantly increased plasma free TAC concentrations, accompanied by a corresponding rise in TAC plasma concentrations. Coincidentally, this result has been clearly verified in previous studies.22 In addition to plasma protein binding, total bilirubin is also closely associated with TAC plasma concentrations. Firstly, TAC intracellular transport relies on P-glycoprotein (P-gp), which facilitates drug clearance by transporting it out of cells.23 Secondly, elevated total bilirubin typically indicates impaired liver function. As the liver is the primary metabolic organ for TAC, relying on the CYP3A enzyme system, reduced liver function diminishes CYP3A enzyme activity. This slows the metabolic rate of TAC and weakens its clearance capacity, further elevating plasma drug concentrations. The study by Bellarosa et al also confirmed.6 Furthermore, this study observed a negative correlation between BMI and TAC plasma concentrations. TAC is fat-soluble; patients with a higher BMI possess a greater proportion of adipose tissue, facilitating drug accumulation within fat deposits and consequently reducing free drug concentrations in plasma. It is worth emphasizing that TAC is also a crucial medication for treating NS in children, exhibiting significant differences in pharmacokinetic characteristics compared to adults. This further underscores the importance of this study in optimizing individualized TAC therapy across different populations, providing valuable reference for precision medication in pediatric patients.5
Importantly, within the specific pathophysiological context of NS, monitoring TAC disposition should also consider the influence of the following additional factors. First, severe hypoalbuminemia could significantly increase the free drug concentration in total apparent concentration, potentially elevating both therapeutic efficacy and toxicity risks even when total drug concentration remains within the therapeutic window. This phenomenon complicates the interpretation of TDM, as routine assays measure total rather than free drug concentrations.24 Second, substantial proteinuria, particularly when the glomerular filtration membrane loses its protein selectivity, may lead to urinary loss of albumin-bound drugs. This could explain the low total exposure observed in some patients.25 Third, intestinal mucosal oedema, frequently observed during active disease phases, may theoretically impair TAC absorption and contribute to both inter- and intra-individual variability in drug exposure.26 Fourth, drug-drug interactions must not be overlooked. As confirmed by this study, concomitant use of Wuzhi capsules significantly reduced TAC clearance, consistent with findings that Wuzhi capsules inhibit CYP3A and P-gp activity, thereby decreasing drug metabolism.27 Briefly, the aforementioned multifactorial influences associated with NS collectively reflect the complexity of TAC pharmacokinetics in this population. This further underscored the value of integrating PK parameters with ML algorithms to enhance the accuracy of therapeutic drug concentration predictions and facilitate personalized treatment guidance.
Our study also has certain limitations. Firstly, this study used a retrospective design, which means it may be difficult to draw causal inferences. However, the constructed model partially mitigates this limitation by incorporating data from diverse racial groups and undergoing external validation. We were confident that it is representative of the Chinese population due to its ethnic diversity. Secondly, NS encompasses various etiologies, eg., focal segmental glomerulosclerosis, membranous nephropathy, that may differentially affect TAC pharmacokinetics through pathophysiological mechanisms. Due to incomplete etiological data, we could not stratify by etiology or include it as a covariate, which may introduce unmeasured confounding. Finally, inherent data completeness limitations and laboratory testing sensitivity constraints in routine clinical practice may lead to measurement errors or data missingness. Future prospective studies should incorporate more detailed patient characteristics and more comprehensive data resources to evaluate the predictive performance and clinical utility of the model.
Conclusions
Overall, this study represented the first application of a population pharmacokinetic model combined with machine learning algorithms to predict plasma concentrations of TAC in adult NS patients. Results from the ensemble model (CatBoost, AdaBoost, GraBoost) demonstrated further improved predictive performance when incorporating CL/F (R2: 0.633 vs. 0.602). Furthermore, CL/F contributed more substantially to the model than conventional biochemical indicators such as BUN, TBIL, BMI, ALB, and NE#, further validating its pivotal role in the metabolic process of TAC. Concurrently, this study established a web-based platform for real-time prediction of TAC plasma concentrations, facilitating convenient access for clinicians and patients. By integrating pharmacokinetic parameters with clinical characteristics, the predictive model enabled dynamic, individualized forecasting of TAC exposure levels. This provided reliable evidence for precision dosing and dose optimization, laying the foundation for safe and effective personalized immunosuppressive therapy in clinical practice. Future prospective, multicenter cohort studies may further validate the model’s generalizability and clinical utility.
Abbreviations
TAC, tacrolimus; TDM, therapeutic drug monitoring; PPK, population pharmacokinetic; ML, machine learning; NS, nephrotic syndrome; RFECV, recursive feature elimination with cross-validation; DV, tacrolimus plasma concentration; ALT, alanine aminotransferase; AST, alanine transaminase; ALB, albumin; GLB, globulin; UA, uric acid; TBIL, total bilirubin; IBIL, indirect bilirubin; BUN, blood urea nitrogen; WBC, white blood cell count; RBC, red blood cell count; HGB, hemoglobin; NE#, Neutrophils; LY#, lymphocytes; HCT, hematocrit; CCR, creatinine clearance rate; CL/F, apparent clearance; HWE, Hardy–Weinberg equilibrium; CatBoost, categorical boosting; RF, random forest; LightGBM, light gradient boosting machine; GraBoost, gradient boosting; AdaBoost, adaptive boosting; XGBoost, eXtreme Gradient BoostingX; SVR, support vector regression; MLP, multilayer perceptron; KNN, K-Nearest Neighbors; VIF, Variance Inflation Factor; SHAP, SHapley Additive exPlanations.
Data Sharing Statement
All generated datasets or code can be obtained by contacting Director Jun Zhao.
Ethics Approval and Informed Consent
This study was approved by the Ethics Committee of the First Affiliated Hospital of Xinjiang Medical University (Approval No.: K201912-07) and complies with the principles of the Declaration of Helsinki. All patient data were anonymized prior to analysis, and strict confidentiality was maintained throughout the study in accordance with institutional regulations. The research involves retrospective analysis of medical records obtained during prior clinical diagnosis and treatment, and does not involve human biological samples. Consequently, the Ethics Committee has agreed to waive the requirement for informed consent.
Consent for Publication
All named authors agreed to submit the manuscript for publication.
Acknowledgments
The author would like to express gratitude to the First Affiliated Hospital of Xinjiang Medical University for providing data and financial support.
Author Contributions
All authors made a significant contribution to the work reported, whether that is in the conception, study design, execution, acquisition of data, analysis and interpretation, or in all these areas; took part in drafting, revising or critically reviewing the article; gave final approval of the version to be published; have agreed on the journal to which the article has been submitted; and agree to be accountable for all aspects of the work.
Funding
This work was supported by National Natural Science Foundation of China (82173899), Jiangsu Pharmaceutical Association (H202108, A2021024, Q202202, JY202207, Z04JKM2023E040), Jiangsu Research Hospital Association for Precision Medication (SYHKJ-JY-2025-15), Tianshan Elites Cultivation Program for High-Level Talents in Medicine and Health Care: Leading Talent Project of Xinjiang Uygur Autonomous Region (TSYC202301A051) and Targeted Research Project of the Engineering Research Center of Xinjiang and Central Asian Traditional Medicine Resources, Ministry of Education (GCZX2024-03).
Disclosure
The authors report no conflicts of interest in this work.
References
1. Downie ML, Gallibois C, Parekh RS, Noone DG. Nephrotic syndrome in infants and children: pathophysiology and management. Paediatr Int Child Health. 2017;37(4):248–16. doi:10.1080/20469047.2017.1374003
2. Von Groote TC, Williams G, Au EH, et al. Immunosuppressive treatment for primary membranous nephropathy in adults with nephrotic syndrome. Cochrane Database Syst Rev. 2021;11(11):CD004293. doi:10.1002/14651858.CD004293.pub4
3. Araya AA, Tasnif Y. Tacrolimus. In: StatPearls. StatPearls Publishing Copyright © 2025, StatPearls Publishing LLC; 2025.
4. Chua JCM, Mount PF, Lee D. Lower versus higher starting tacrolimus dosing in kidney transplant recipients. Clin Transplant. 2022;36(6):e14606. doi:10.1111/ctr.14606
5. Chan EY, Boyer O. Childhood idiopathic nephrotic syndrome: recent advancements shaping future guidelines. Pediatr Nephrol. 2025;40(8):2431–2442. doi:10.1007/s00467-024-06634-9
6. Zheng P, Yu Z, Li L, et al. Predicting blood concentration of tacrolimus in patients with autoimmune diseases using machine learning techniques based on real-world evidence. Front Pharmacol. 2021;12:727245. doi:10.3389/fphar.2021.727245
7. Braithwaite HE, Darley DR, Brett J, Day RO, Carland JE. Identifying the association between tacrolimus exposure and toxicity in heart and lung transplant recipients: a systematic review. Transplant Rev. 2021;35(2):100610. doi:10.1016/j.trre.2021.100610
8. De Jonge H, Elens L, De Loor H, Van Schaik RH, Kuypers DR. The CYP3A4*22 C>T single nucleotide polymorphism is associated with reduced midazolam and tacrolimus clearance in stable renal allograft recipients. Pharmacogenomics J. 2015;15(2):144–152. doi:10.1038/tpj.2014.49
9. Yu M, Liu M, Zhang W, Ming Y. Pharmacokinetics, pharmacodynamics and pharmacogenetics of tacrolimus in kidney transplantation. Curr Drug Metab. 2018;19(6):513–522. doi:10.2174/1389200219666180129151948
10. Patel N, Cook A, Greenhalgh E, Rech MA, Rusinak J, Heinrich L. Overview of extended release tacrolimus in solid organ transplantation. World J Transplant. 2016;6(1):144–154. doi:10.5500/wjt.v6.i1.144
11. Huang Q, Lin X, Wang Y, et al. Tacrolimus pharmacokinetics in pediatric nephrotic syndrome: a combination of population pharmacokinetic modelling and machine learning approaches to improve individual prediction. Front Pharmacol. 2022;13:942129. doi:10.3389/fphar.2022.942129
12. Wang D, Lu J, Li Q, Li Z. Population pharmacokinetics of tacrolimus in pediatric refractory nephrotic syndrome and a summary of other pediatric disease models. Exp Ther Med. 2019;17(5):4023–4031. doi:10.3892/etm.2019.7446
13. Chang L, Hao X, Yu J, et al. Developing a machine learning model for predicting venlafaxine active moiety concentration: a retrospective study using real-world evidence. Int J Clin Pharm. 2024;46(4):899–909. doi:10.1007/s11096-024-01724-y
14. Altman NS. An introduction to kernel and nearest-neighbor nonparametric regression. Am Stat. 1992;46(3):175–185. doi:10.1080/00031305.1992.10475879
15. Steyerberg EW, Harrell FE, Borsboom GJ, Eijkemans MJ, Vergouwe Y, Habbema JD. Internal validation of predictive models: efficiency of some procedures for logistic regression analysis. J Clin Epidemiol. 2001;54(8):774–781. doi:10.1016/S0895-4356(01)00341-9
16. Mustaqim AZ, Adi S, Pristyanto Y, Astuti Y. The effect of recursive feature elimination with cross-validation (RFECV) feature selection algorithm toward classifier performance on credit card fraud detection. 2021;270–275.
17. Ma P, Liu R, Gu W, et al. Construction and interpretation of prediction model of teicoplanin trough concentration via machine learning. Front Med. 2022;9:808969. doi:10.3389/fmed.2022.808969
18. Lu T, Zhu X, Xu S, et al. Dosage optimization based on population pharmacokinetic analysis of tacrolimus in Chinese patients with nephrotic syndrome. Pharm Res. 2019;36(3):45. doi:10.1007/s11095-019-2579-6
19. Hao GX, Song LL, Zhang DF, Su LQ, Jacqz-Aigrain E, Zhao W. Off-label use of tacrolimus in children with glomerular disease: effectiveness, safety and pharmacokinetics. Br J Clin Pharmacol. 2020;86(2):274–284. doi:10.1111/bcp.14174
20. Hesselink DA, Bouamar R, Elens L, van Schaik RH, van Gelder T. The role of pharmacogenetics in the disposition of and response to tacrolimus in solid organ transplantation. Clin Pharmacokinet. 2014;53(2):123–139. doi:10.1007/s40262-013-0120-3
21. Iwasaki K. Metabolism of tacrolimus (FK506) and recent topics in clinical pharmacokinetics. Drug Metab Pharmacokinet. 2007;22(5):328–335. doi:10.2133/dmpk.22.328
22. Chen YS, Liu ZQ, Chen R, et al. Population pharmacokinetic analysis of tacrolimus in Chinese myasthenia gravis patients. Acta Pharmacol Sin. 2017;38(8):1195–1204. doi:10.1038/aps.2016.174
23. Bellarosa C, Bortolussi G, Tiribelli C. The role of ABC transporters in protecting cells from bilirubin toxicity. Curr Pharm Des. 2009;15(25):2884–2892. doi:10.2174/138161209789058246
24. Lai FF, Chan EY, Tullus K, Ma AL. Therapeutic drug monitoring in childhood idiopathic nephrotic syndrome: a state of the art review. Pediatr Nephrol. 2024;39(1):85–103. doi:10.1007/s00467-023-05974-2
25. Idasiak-Piechocka I, Lewandowski D, Świgut W, et al. Effect of hypoalbuminemia on drug pharmacokinetics. Front Pharmacol. 2025;16:1546465. doi:10.3389/fphar.2025.1546465
26. Sofue T, Inui M, Kiyomoto H, et al. Excess fluid distribution affects tacrolimus absorption in peritoneal dialysis patients. Clin Experi Nephrol. 2013;17(5):743–749. doi:10.1007/s10157-012-0764-6
27. Xiang Q, Yang Y, Li G, et al. Population pharmacokinetic/pharmacodynamic modeling of tacrolimus in renal transplant recipients: impact of CYP3A5 genotype and wuzhi capsule co-medication. Drug Des Devel Ther. 2025;19:8375–8389. doi:10.2147/DDDT.S542786
 © 2026 The Author(s). This work is published and licensed by Dove Medical Press Limited. The
full terms of this license are available at https://www.dovepress.com/terms
and incorporate the Creative Commons Attribution
- Non Commercial (unported, 4.0) License.
By accessing the work you hereby accept the Terms. Non-commercial uses of the work are permitted
without any further permission from Dove Medical Press Limited, provided the work is properly
attributed. For permission for commercial use of this work, please see paragraphs 4.2 and 5 of our Terms.
© 2026 The Author(s). This work is published and licensed by Dove Medical Press Limited. The
full terms of this license are available at https://www.dovepress.com/terms
and incorporate the Creative Commons Attribution
- Non Commercial (unported, 4.0) License.
By accessing the work you hereby accept the Terms. Non-commercial uses of the work are permitted
without any further permission from Dove Medical Press Limited, provided the work is properly
attributed. For permission for commercial use of this work, please see paragraphs 4.2 and 5 of our Terms.
Recommended articles
A Real-Time Plasma Concentration Prediction Model for Voriconazole in Elderly Patients via Machine Learning Combined with Population Pharmacokinetics
Liu R, Ma P, Chen D, Yu M, Xie L, Zhao L, Huang Y, Shang S, Chen Y
Drug Design, Development and Therapy 2025, 19:4021-4037
Published Date: 17 May 2025
Towards Personalized Tacrolimus Dosing Using an Algorithm-Driven Prediction Pipeline for Kidney Transplant
Min J, Li Q, Lai W, Liu Z, Chen G
Drug Design, Development and Therapy 2026, 20:575125
Published Date: 7 January 2026
An Interpretable PK-Informed Hybrid Model for Voriconazole Exposure Prediction: Roles of CYP2C19 Genotype and Inflammation
Zhou Y, Yun Y, Chen S, Liu X, Liu H, Ren J, Lu M, Ling J, Yang X, Zhou Z, Osei JA, Soheili R, Zou J, Hu N
Drug Design, Development and Therapy 2026, 20:489712
Published Date: 7 May 2026