Back to Journals » Journal of Multidisciplinary Healthcare » Volume 14
Total Clinical Chemistry Laboratory Errors and Evaluation of the Analytical Quality Control Using Sigma Metric for Routine Clinical Chemistry Tests
Authors Teshome M ![]() , Worede A, Asmelash D
, Worede A, Asmelash D ![]()
Received 14 October 2020
Accepted for publication 6 January 2021
Published 15 January 2021 Volume 2021:14 Pages 125—136
DOI https://doi.org/10.2147/JMDH.S286679
Checked for plagiarism Yes
Review by Single anonymous peer review
Peer reviewer comments 4
Editor who approved publication: Dr Scott Fraser
Mulugeta Teshome,1 Abebaw Worede,2 Daniel Asmelash2
1Department of Medical Laboratory, Dessie Comprehensive Specialized Hospital, Dessie, Ethiopia; 2Department of Clinical Chemistry, School of Biomedical and Laboratory Sciences, College of Medicine and Health Sciences, University of Gondar, Gondar, Ethiopia
Correspondence: Daniel Asmelash
Department of Clinical Chemistry, School of Biomedical and Laboratory Sciences, College of Medicine and Health Sciences, University of Gondar, P.O Box 196, Gondar, Ethiopia
Email [email protected]
Background: Currently, the use of clinical laboratory tests is growing at a promising rate and about 80% of the clinical decisions made are based on the laboratory test results. Therefore, it is a major task to achieve quality service. This study was conducted to assess the magnitude of errors in the total testing process of Clinical Chemistry Laboratory and to evaluate analytical quality control using sigma metrics.
Methods: A cross-sectional study was conducted at Dessie Comprehensive Specialized Hospital Clinical Chemistry Laboratory, Northeast Ethiopia, from 10 February 2020 to 10 June 2020. All Clinical Chemistry Laboratory test requests with their respective samples, external quality control and all daily internal quality control data during the study period were included in the study. Data were collected using a prepared checklist and analyzed using SPSS version 21.
Results: A total of 4719 blood samples with their test requests were included in the study. Out of 145,383 quality indicators, an error rate of 22,301 (15.3%) was identified in the total testing process. Of the total errors, 76.3% were pre-analytical, 2.1% were analytical and 21.6% were post-analytical errors (p< 0.0001). Of the total 14 analytes in the sigma metric evaluation, except ALP, all routine clinical chemistry tests were below the standard (< 3). In multivariate logistic regression, the location of patients in the inpatient department was significantly associated with the specimen rejection ((AOR=1.837, 95% CI (1.288– 2.618), p=0.001).
Conclusion: The study found a higher frequency of errors in the total testing process in the Clinical Chemistry Laboratory and almost all test parameters had an unsatisfactory sigma metric value.
Keywords: analytical errors, Clinical Chemistry Laboratory, post-analytical errors, pre-analytical errors, sigma metrics, Ethiopia
Introduction
The use of clinical laboratory test results in clinical decisions has become an integral part of clinical medicine and studies showed that laboratory medicine determines 70% of clinical decisions; however, small variations around this figure (60–80%) were reported.1,2 The quality laboratory service ensures accurate, precise and timely results. The total testing process (TTP) of a laboratory is a complex procedure that includes three phases: the pre-analytical, analytical and the post-analytical. In all phases of TTP, quality indicators (QIs) are used by health laboratories based on the requirements of the International Organization for Standardization (ISO) 15,189:2012.3,4
Laboratory errors can occur at any stage of the pre-analytical phase to the post-analytical phase of the TTP.5 Pre-analytical errors include all errors that occur prior to analysis. Some of the pre-analytical errors include hemolyzed sample, insufficient sample, incorrect label, incorrect requisition, clotted sample and tube broken in centrifuges. The impact of pre-analytical error occurs in the analytical and the post-analytical stage. At the analytical phase where analysis takes place, non-conformity with quality control, calibration failure, random and systematic errors can be occurred.6 Common post-analytical errors include failure to report test results, delay in reporting, incorrect calculation, critical results not reported or delayed, and results sent to the wrong patient.7
Sigma metric quantifies the analytical performance of a laboratory process as a rate of Defects-Per-Million Opportunities (DPMO). The evaluation of laboratory errors in terms of sigma metric is more meaningful than the number of defects alone. For the analytical process of the laboratory system, the sigma metric analysis identifies errors in quality indicators of the process and provides error corrections based on results. Using the Six Sigma principles, it is possible to assess the quality of laboratory testing processes and the number of quality controls needed to ensure the desired quality.8
Attainment of Six Sigma performance represents 3.4 DPMO and the achievement of 3 sigma values is the minimum acceptable quality for a process to be applied.9 A higher sigma metric value means fewer analytical errors and fewer acceptable test results are falsely rejected, a lower sigma metric value of the parameters indicates higher analytical errors and many acceptable test results are falsely rejected, which is more difficult to use in the analysis of patient samples. However, low sigma metrics could also mean that there are high true rejections that may occur as a result of inadequate QC data and the short study period.10
Laboratory errors that occur at any phase of the TTP can directly contribute to increased healthcare costs, decreased patient satisfaction, delayed diagnosis, misdiagnosis and a serious risk to the patient’s health.11 Studies showed that 6.4% to 12% risk of inappropriate care and death occurs due to laboratory errors.12 Studies in the United States indicated that diagnostic errors occur in 5% of the outpatients and about half of the errors may cause severe harm to patients. This is supported by a study conducted in Malaysia with 3.6% errors.13,14
Although analytical errors contain fewer errors than pre-and post-analytical phases, analytical quality is still a major issue. For example, studies in Ghana revealed unsatisfactory sigma level (<3) for all analytes.15 Laboratory personnel should control the whole TTP using QIs and focus on improving extra-laboratory procedures, in particular test selection and interpretation in coordination with other medical staff.16
The achievement of sustainable laboratory performance in accreditation has also been a major challenge in African countries and there are still gaps in strengthening laboratory services.17 According to previous studies, the majority of Ethiopian clinical laboratories provide sub-optimal service and the quality of the service is severely compromised, which may lead to the occurrence of several laboratory errors.18 Despite very few studies on the overall distribution of laboratory errors in Clinical Chemistry, no studies have yet been conducted to evaluate analytical performance using sigma metric in Ethiopia.19,20 Therefore, the current study will assess the distribution of errors in each phase of the clinical chemistry testing process and the analytical performance of routine chemistry tests using sigma metric.
Materials and Methods
Study Design and Setting
A cross-sectional study was conducted at the Dessie Comprehensive Specialized Hospital Clinical Chemistry Laboratory from 10 February 2020 to 10 June 2020. Dessie Comprehensive Specialized Hospital laboratory was involved in the Stepwise Laboratory Quality Improvement Process towards Accreditation, although its performance was not satisfactory.
Study Variables
The study variables included all phlebotomists, laboratory professionals in the Clinical Chemistry laboratory, Clinical Chemistry test requests with their respective blood samples for routine Clinical Chemistry tests, quarterly external quality control (EQC) and all daily internal quality control (IQC) data from the Clinical Chemistry laboratory during the specified study period. Therefore, the study covered the pre-analytical, analytical and post-analytical phases of the TTP in the Clinical Chemistry Laboratory. However, body fluids other than venous blood samples and not routine clinical chemistry tests were excluded from the sigma metric evaluation.
Data Collection Procedure
A standardized pre-tested assessment checklist was used to evaluate the pre-analytical, analytical and post-analytical phases of the Clinical Chemistry Laboratory. The checklist was prepared using variables from different studies and International Federation of Clinical Chemistry.21 The selected data collectors were trained on how to collect all the necessary data in the assessment of the completeness of the standard laboratory request forms (such as, patient age, gender, signature of physicians, location, date and authorized request formats), in the assessment of specimen quality, analytical and post-analytical QIs based on the checklist.
All required data were collected using a checklist in all phases of the TTP. In addition, face-to-face interviews were also used to collect socio-demographic data. Data on pre-analytical variables, specifically laboratory specimens, were collected through observation. Color charts were used to assess the quality of the specimens, which were used to standardize the reports of each data collector.
Furthermore, a routine automatic biochemistry analyzer (DIRU CS-T240, Dirui Industrial Co., Ltd. China) was evaluated by sigma metric and important data generated by the analyzer were extracted by using observation. Daily IQC data collected during the analytical phase were entered in the checklist and record formats. The laboratory was involved in the EQC program by analyzing five different concentration proficiency test samples provided by one world Accuracy and the most recent quarterly EQC laboratory performance report was taken and transferred to the checklist. Post-analytical QI outcomes were collected before the results were delivered to clients, and each variable was entered as a record in the checklist.
Data Quality and Statistical Analysis
The standardized data collection checklist was pre-tested on 30 venous blood specimens with their corresponding test requests for Clinical Chemistry at Boru-Meda Hospital to check its feasibility and ensure the validity of the study tool.22 The checklist was modified based on the pre-test results. The investigator undertook a continuous monitoring and support to ensure complete, consistent, clear and accurate data.
The data were checked for completeness and reliability. After ensuring this, data were entered to EPI info version 7 and transferred to SPSS version 21 (IBM Corporation, Armonk, NY, USA) for analysis. The overall distribution of errors in the Clinical Chemistry Laboratory was summarized by descriptive statistics using frequency tables. The sigma metrics value of each analyte was summarized in tables after extracting Total Allowable Error (%TEa) value of each analyte from Clinical Laboratory Improvement Amendment (CLIA).23 A chi square test was used to check the presence of statistical difference between the three phases of Clinical Chemistry testing process.
In addition, the chi square test was also used to assess the association between selected independent variables with pre-analytical and post-analytical errors. Bivariate and multivariate logistic regression were used to assess the association between work shift and location of patients with prolonged turnaround time (TAT). The strength of the association was measured using the adjusted odds ratio (AOR) and 95% confidence interval (CI). The p-value <0.05 was considered statistically significant. The chi square test and logistic regression were conducted for selected independent variables (work shift and patient location) because the assumptions were not fulfilled by other independent variables.
Analytical quality control performance for routinely tested 14 analytes [aspartate transaminase (AST), alanine transaminase (ALT), alkaline phosphatase (ALP), urea (UR), creatinine (CRE), glucose (GLU), total cholesterol (TC), triglyceride (TG), high-density lipoprotein (HDL), low-density lipoprotein (LDL), total protein (TP), albumin (ALB), total bilirubin (TBIL) and uric acid (UA)] was evaluated using a sigma metric quality monitoring tool. The TEa source for each of the analytes was CLIA. The bias of all analytes except LDL was calculated using the performance of the Laboratory in the EQC and the peer groups mean. Since LDL was not properly documented in the EQC documentation chart, its bias was calculated using the observed mean from the daily IQC and the target value from the manufacturer. The CV for all analytes was calculated from the observed mean and SD of the daily IQC in the study period. For all analytes, two levels (normal and pathological) of IQC materials were used, and sigma metrics value was calculated separately. The estimates of sigma metrics were optimistic because the quality control materials were not from third parties. The cause of low sigma value (<6) in all parameters was identified using the calculated Quality goal index (QGI). The sigma metrics was calculated with the Sigma = (TEa – Bias%)/CV. In addition, the QGI ratio was calculated using a Bias%/1.5 × CV%.24 A sigma value between 3 and 4 quality requires a multi-rule procedure 13S/22S/R4S/41S/10x, with four levels of control measurement in two runs (N=4, R=2) or two levels of control measurement in four runs (N=2, R=4). However, <3-sigma cannot be controlled with statistical QC protocols of Westgard rules and the method must be rechecked.25
Results
General Information of the Study
A total of 4719 test requests with venous blood samples were included and 18,636 tests were analyzed in the study. Of the total test requests, 153 (3.2%) were from Emergency department, 879 (18.6%) were from outpatient department (OPD) and 545 (11.6%) were from the impatient department (IPD), but the remaining 3142 (66.6%) test requests were with unknown location. The majority 3423 (72.5%) of the samples were analyzed during the first work shift (morning) from 7 AM to 1 PM and equal number of laboratory professionals were assigned in both shifts. Performance of 14 routine clinical chemistry tests with two levels of IQC material was evaluated using the sigma metric monitoring tool.
Missed Information on Test Requests
Of the total of 4719 clinical chemistry test requests, there were 100% completeness of medical record number (MRN) and test ordered, but the clinical data (100%) of the patients and (77.5%) the signature of physicians was missed in the test request form. Of the total test requests assessed, 16,703 defects (more than 3 defects per request) were found. In addition, of the total number of QIs (42,471) evaluated, 16,703 (39.3%) showed missed information on the laboratory test request (Table 1).
 |
Table 1 Frequency of Missed Information on Laboratory Request Forms |
Pre-Analytical Errors Related to Specimen Quality
In the assessment of the quality of the specimens, 111 (2.4%) of the specimens were hemolyzed and 97 (2.1%) of the specimens were icteric. In addition, 45 (1%) of the specimens were incorrectly labelled. Of a total of 51,909 QIs, 314 (0.6%) specimen quality-related errors were observed. Of the total sample-related errors, 35.4% were due to hemolysis and 30.9% were due to excessive icteric sample. For one or more reasons, 223 (4.7%) specimens were not suitable for analysis. Of the total pre-analytical QIs (94,380), 17,017 (18%) pre-analytical errors were identified (Table 2).
 |
Table 2 Analysis of Errors in Pre-Analytical Quality Indicators |
Analytical Errors
Of the estimated total 1382 daily IQC, 73 (5.3%) were not performed. Of the 1317 IQC data, 81 (6.2%) were out of the acceptable range. In addition, 15 (23.1%) of the EQC performance was reported as unacceptable. Of the total samples analyzed, 141 (3%) tests were interrupted due to electricity fluctuations and all (100%) non-linearity patient test results were released without retesting. Of the total QIs (13,206) in the analytical phase, 457 (3.5%) analytical errors were identified (Table 3).
 |
Table 3 Analysis of Errors in Analytical Quality Indicators |
Post-Analytical Errors
Of the total critical test results, 6 (13.3%) were not immediately reported to physicians. Almost all (99.5%) laboratory test results were not verified and signed. It was also found that 62 (1.3%) and 53 (1.1%) laboratory results were unrecorded and reported out of the established TAT, respectively. Of the total post-analytical QIs (37,797), 4827 (12.8%) post-analytical errors were identified (Table 4).
 |
Table 4 Analysis of Errors in Post-Analytical Quality Indicators |
Overall Clinical Chemistry Laboratory Errors
Of the total 145,383 quality indicators, an error rate of 22,301 (15.3%) was found in the three phases of the testing process. The chi square test revealed that there was a statistically significant difference between the error frequency of the three phases (χ2=2153, p <0.0001). The highest frequency of Clinical Chemistry Laboratory errors was 17,017 (76.3%) in the pre-analytical phase, while the second observed error was 4827 (21.6%) in the post-analytical phase, but the lowest frequency 457 (2.1%) was identified in the analytical phase (Table 5).
 |
Table 5 Distribution of Errors Frequency in the Total Testing Process |
Location of Sample Collection with Pre- and Post-Analytical Errors
Using the chi square analysis, the location of sample collection was found to be statistically associated with missed information on Clinical Chemistry Laboratory request formats (p<0.0001), hemolysis (p=0.04), icteric (p<0.0001), specimen rejection (p=0.001) and failure to record results (p=0.01) (Table 6).
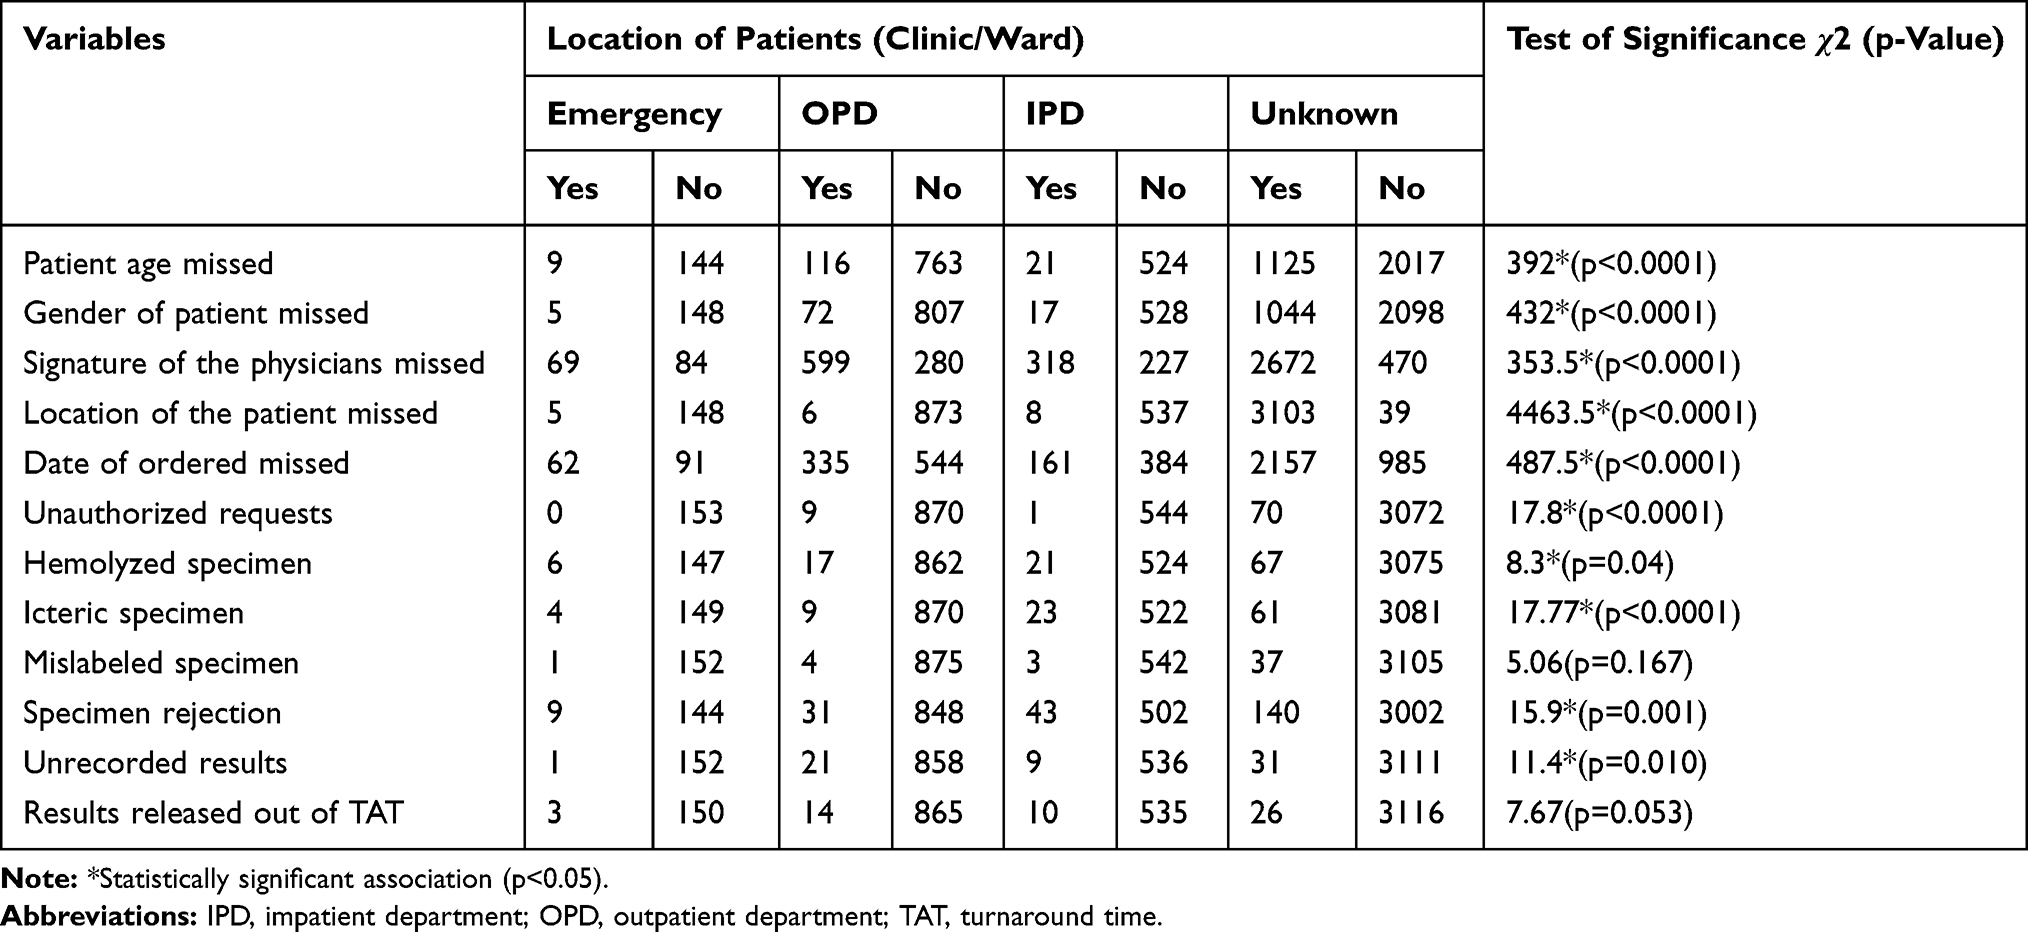 |
Table 6 Association of Patient Location with Pre-Analytical and Post-Analytical Errors |
Factors Associated with Prolonged TAT
The multivariate logistic regression showed that prolonged TAT was independently associated with the second shift (AOR=8.354, 95% CI (4.453–15.670), p< 0.0001) in which the occurrence of prolonged TAT was 8 times higher in the second shift workers compared to the first shift workers (Table 7).
 |
Table 7 Factors Associated with Prolonged TAT |
Sigma Value and Quality Goal Index (QGI) of the Clinical Chemistry Tests
Using CLIA as a source of TEa, the sigma metric values of 14 routine analytes were measured. Based on the measured values, only one analyte (ALP) had above 3 sigma values and the remaining 13 analytes were found to be below 3 sigma values. The lowest sigma value (0.01) was observed in ALB (level-I). In addition, the calculated QGI showed that the presence of imprecision, inaccuracy and both imprecision and inaccuracy. It was found that the majority of the poor performance of analytes in the sigma value was due to the imprecision of the QC (Table 8).
 |
Table 8 Total Allowable Error (TEa), CV, Bias, Sigma Value and QGI of the Routine Clinical Chemistry Tests |
Quality Control Strategy Based on Sigma Values
Of all the analytes, only ALP had a sigma value of >3. The Westgard rule was established for ALP only and the remaining analytes showed poor performance in which the methods should be rechecked prior to the analysis of patient samples. The Westgard multi rule selected for ALP was 13S/22S/R4S/41S/10x. Although a multi rule was applied for ALP, the QGI indicated an imprecision that requires a close monitoring and troubleshooting in the daily IQC (Table 9).
 |
Table 9 Quality Control Strategy Based on the Sigma Value of the Test Parameters |
Discussion
Although most modern medical laboratories have joined automation, it remains a challenge to ensure accurate and precise laboratory results.26 Therefore, the current study used relatively comprehensive QIs to assess the total errors in the Clinical Chemistry Laboratory.
In the current study, the majority of the pre-analytical errors found were incompleteness of the required information on the test request form (39.3%). This finding was consistent with the study conducted in Hawassa, Ethiopia27 (39.4%), but lower than a study conducted in Gondar, Ethiopia20 with an overall incompleteness of 49.9%. In contrast, the current finding was much higher than studies in Nigeria,28 Kenya29 and Uganda30 with an incompleteness rate of 14.3%, 22.7% and 17.9%, respectively. This disparity may be due to variation in quality indicators, study designs, study periods, awareness and experience of clinicians on the value of patient information.
Of the total number of QIs, 39.3% showed missed information on Clinical Chemistry test requests. This finding was higher than the study conducted in Ethiopia31 and Nigeria28 with an overall incompleteness of 8.7% and 10.5%, respectively. This large variation may be due to differences in sample size, operational definition, test requests ordered by inexperienced staffs and lack of commitment to complete the required information.
Based on our study, the clinical history of the patient was not stated in all 4719 (100%) requests which were consistent with the study conducted in Gondar, Ethiopia with 99% incompleteness,20 but higher than studies conducted in Addis Ababa, Ethiopia (72.6%).19 In addition, signature of physicians (77.5%) and location of patients (66.2%) information were also incomplete in the test request. These findings showed a wide difference from previous studies conducted in Gondar (38.7% and 1.8%),20 Addis Ababa (30.4% and 1.1%)19 and Nigeria (19.8% and 20.1%)32 respectively. The higher incomplete information in the current study may be due to lack of commitment, failure to create awareness and workload.
In this study, hemolysis was the major cause of sample rejection (35.4%) which was inconsistent with studies conducted in Ghana (17.6%).33 The increased percentage of hemolysis may be due to untrained phlebotomists, high workload and lack of regular monitoring and support.
According to this study, the prevalence of sample rejection was 4.7%, which was consistent with studies in Egypt34 with a rejection rate of 4.6%. However, it was higher than studies conducted in India (3.45%),35 South Africa (1.46%),36 Turkey (0.65%),37 Saudi Arabia (2.07%)38 and Ethiopia (1.4%).39 The higher rate of rejection may be due to untrained phlebotomists, lack of cooperation and communication, incompetence, improper processing of specimens.
In the current study, the total pre-analytical error (18%) was lower than studies conducted in Iraq (39%)40 and Egypt (43.7%),41 but it was much higher than studies in Ghana (3.7%),33 Saudi Arabia (3.15%),42 Tunisia (7.7%),43 Greece (1.94%)44 and India (0.15%).45 This may be due to differences in the QIs, sample size, laboratory facilities and the experience of health professionals.
Our study found a lower frequency of 6.2% IQC failure compared to the study conducted in Pakistan (32%),46 but higher than the study conducted in Ethiopia (2.95%)19 and India (0.6%).47 The difference between findings may be due to variation in equipment and laboratory personnel performance, storage condition of QC materials, the reconstitution of lyophilized QC materials and availability of in-house mean/SD.
The current study found a 23.1% failure of the proficiency testing, which was inconsistent with a study conducted in Pakistan (5.4%).48 This higher level of non-conformity with EQC proficiency testing may be due to improper transport/storage of EQC samples, improper reconstitution of the samples, analyzing by faulty instruments, untrained and incompetent laboratory staffs, reporting with unacceptable unit.
In the current study, 99.5% of the test results were not verified and signed by independent reviewers. This finding was far higher than the study conducted in Kenya (13.1%).49 This may be related to non-committed laboratory staffs, the workload of the laboratory and failure to adhere to the laboratory quality policy. In addition, 1.1% of laboratory results were reported out of the established TAT, which was higher than the frequency of delayed TAT in Pakistan (0.003%).48 The prolonged TAT in this study may be due to the unavailability of Laboratory Information System (LIS), electric interruption, equipment malfunction and stock out of distilled waters.
The current study found that the prevalence of errors in the TTP was 15.3%. This finding was lower than the study conducted in Addis Ababa, Ethiopia (33.1%)19 but higher than the study conducted in Saudi Arabia (4.35%)42 and Ghana (4.7%).33 This may be due to difference in the infrastructure of the laboratory, regular monitoring and evaluation, availability of functional LIS, competency of laboratory staffs, in-house mean/SD, variation in the study designs, operationalization of variables and QIs.
Although IQC ensures a continuous monitoring of the analytical method, the exact number of errors that occurred during the analytical phase cannot be evaluated.50 As a result, an effective quantifying sigma metrics tool was selected and the sigma metrics value for each test parameter showed that analytical quality is still a major issue.
In the current study, the sigma metric value of most analytes was unsatisfactory. ALP (Level-I (3.9) and II (3.8) IQC) was the only analyte with a sigma value above 3. The remaining 13 analytes (AST, ALT, UR, CRE, GLU, TG, TC, HDL, LDL, TP, ALB, TBIL and UA) had low sigma values <3. This finding was inconsistent with a study conducted in China51 that reported >3 sigma values for all test parameters (AST, ALT, ALP, UR, CRE, GLU, TC, TG, HDL, LDL, TBIL, UA, TP and ALB). This may be due to differences in the performance of analyzer, poorly stored reagents and QC materials, study period, failure to perform regular maintenance of analyzers and competency of laboratory staffs. In addition, the calculated QGI showed that the presence of imprecision, inaccuracy and both imprecision and inaccuracy. This may be due to power fluctuation, incorrect calibration, improper reconstitution of QC/calibration materials and interferences.
The current study found <2 sigma value for 11 test parameters at two IQC levels for (UR, CRE, GLU, TG, TC, HDL, LDL, TP, ALB, TBIL and UA). This result was consistent with a study conducted in Ghana15 for (GLU, TG, TC, HDL, UR, CRE, TP and AST) and in Sudan52 for UR and CRE. It was also comparable to the study conducted in India53 for ALT (Level-I), TBIL (Level-I), CRE (Level-I) and UR (Level-I and II). In contrast, higher sigma values >3 were reported in China51 and Turkey54 for ALB, GLU, UA, TC, TG and CRE. This disparity in the sigma metrics value may be due to differences in analytical methods, different IQC materials, different proficiency testing bodies and manufacturers.
Conclusion
The study found a high frequency of errors in the Clinical Chemistry Laboratory and most of the errors were observed in the pre-analytical phase. The majority of pre-analytical errors were significantly associated with the location of the sample collection. In addition, with the exception of the ALP, the sigma metric values for all routine clinical chemistry tests were below the standard (<3). Although the sigma metric value of ALP was within an acceptable range, a multi-Westgard rule (13S/22S/R4S/41S/10x) should be implemented under close monitoring rather than a single rule.
Specimen collectors, particularly in the IPD should be trained in the laboratory quality management system. Besides the existing manual recording system, the laboratory should provide an electronic backup recording system. In addition, the sigma metric should be included as one of the quality indicators of the Clinical Chemistry Laboratory and the DMAIC Process (Define, Measure, Analyze, Improve and Control) for the improvement of the laboratory services. A regular monitoring and evaluation should be carried out in compliance with 15,189 ISO standards of the clinical laboratory. In addition, the clinicians should be encouraged to use the reference change value to help overcome all the noise generated by poor instrument performance.
Abbreviations
AOR, adjusted odds ratio; ALT, alanine transaminase; ALB, albumin; ALP, alkaline phosphatase; AST, aspartate transaminase; CI, confidence interval; CRE, creatinine; CLIA, Clinical Laboratory Improvement Amendment; DPMO, defects per million opportunities; EQC, external quality control; GLU, glucose; HDL, high density lipoprotein; IQC, internal quality control; IPD, inpatient department; ISO, International Organization for Standardization; LIS, laboratory information system; LDL, low density lipoprotein; MRN, medical record number; OPD, outpatient department; QGI, quality goal index ratio; Qs, quality indicators; SD, standard deviation; SPSS, Statistical Package for Social Sciences; TAT, turnaround time; TEa, total allowable error; TBIL, total bilirubin; TC, total cholesterol; TP, total protein; TG, triglyceride; TTP, total testing process; TV, true value; UR, urea; UA, uric acid.
Data Sharing Statement
Most of the data generated during this study are included in this published article and additional data will be made available upon request to the corresponding author.
Ethics Approval and Consent to Participate
Ethical approval was obtained from the Research and Ethical Review Committee of School of Biomedical and Laboratory Sciences, University of Gondar. Moreover, letter of support was secured from Dessie Comprehensive Specialized Hospital. All participants provided written informed consent to the study.
Consent for Publication
All participants provided written informed consent to publish this study.
Acknowledgments
We would like to thank the staff members of Dessie Comprehensive Specialized Hospital Laboratory.
Author Contributions
All authors made a significant contribution to the work reported, whether that is in the conception, study design, execution, acquisition of data, analysis and interpretation, or in all these areas; took part in drafting, revising or critically reviewing the article; gave final approval of the version to be published; have agreed on the journal to which the article has been submitted; and agree to be accountable for all aspects of the work.
Funding
No specific funding was obtained for this study.
Disclosure
Authors declare that they have no competing interests.
References
1. Kalra J, Kopargaonkar A. Quality improvement in clinical laboratories: a six sigma concept. Pathol Lab Med. 2016;1(1):11–20.
2. Hallworth MJ. The ‘70% claim’: what is the evidence base? Ann Clin Biochem. 2011;48(6):487–488. doi:10.1258/acb.2011.011177
3. Sciacovelli L, Aita A, Chiozza ML. Harmonization of pre-analytical quality indicators. Biochem Med. 2014;24(1):105–113.
4. Plebani M. Laboratory errors: how to improve pre-and post-analytical phases? Biochem Med. 2007;17(1):5–9. doi:10.11613/BM.2007.001
5. Aakre KM, Langlois MR, Watine J, et al. Critical review of laboratory investigations in clinical practice guidelines: proposals for the description of investigation. Clin Chem Lab Med. 2013;51(6):1217–1226. doi:10.1515/cclm-2012-0574
6. Kale S, Gumber R, Mahajan M, Mulay S. Identifying errors involving clinical laboratory: a 1 year study. Int J Health Sci Res. 2014;4(8):48–53.
7. Walz SE, Darcy TP. Patient safety & post-analytical error. Clin Lab Med. 2013;33(1):183–194. doi:10.1016/j.cll.2012.10.001
8. Westgard S, Westgard Q. Six sigma metric analysis for analytical testing processes. Abott Lab MS-09. 2009;4:7907.
9. Vivekananthamoorthy N and Sankar S. Lean Six Sigma, Six Sigma Projects and Personal Experiences, Abdurrahman Coskun, IntechOpen. 2011 Jul 14. Available from: https://www.intechopen.com/books/six-sigma-projects-and-personal-experiences/lean-six-sigma?
10. Hens K, Berth M, Armbruster D, Westgard S. Sigma metrics used to assess analytical quality of clinical chemistry assays: importance of the allowable total error (TEa) target. Clin Chem Lab Med. 2014;52(7):973–980. doi:10.1515/cclm-2013-1090
11. Goswami B, Singh B, Chawla R, Mallika V. Evaluation of errors in a clinical laboratory: a one-year experience. Clin Chem Lab Med. 2010;48(1):63–66. doi:10.1515/CCLM.2010.006
12. Lippi G, Simundic A-M, Mattiuzzi C. Overview on patient safety in healthcare and laboratory diagnostics. Biochem Med. 2010;20(2):131–143. doi:10.11613/BM.2010.015
13. WHO. Patient safety and risk management service delivery and safety; 2019(Patient Safety Fact File).
14. M.V R. Are diagnostic and laboratory errors causing fatal deaths? Int J Curr Adv Res. 2017;7(1(A)).
15. Afrifa J, Gyekye SA, Owiredu WK, et al. Application of sigma metrics for the assessment of quality control in clinical chemistry laboratory in Ghana: a pilot study. Niger Med J. 2015;56(1):54. doi:10.4103/0300-1652.149172
16. Mrazek C, Lippi G, Keppel MH, et al. Errors within the total laboratory testing process, from test selection to medical decision-making - A review of causes, consequences, surveillance and solutions. Biochem Med. 2020;30(2):020502. doi:10.11613/BM.2020.020502
17. Mate KS, Rooney AL, Supachutikul A, Gyani G. Accreditation as a path to achieving universal quality health coverage. Global Health. 2014;10(1):68. doi:10.1186/s12992-014-0068-6
18. Girma M, Desale A, Hassen F, Sisay A, Tsegaye A. Survey-defined and interview-elicited challenges that faced Ethiopian Government Hospital Laboratories as they applied ISO 15189 accreditation standards in resource-constrained settings in 2017. Am J Clin Pathol. 2018;150(4):303–309. doi:10.1093/ajcp/aqy049
19. Tadesse H, Desta K, Kinde S, Hassen F, Gize A. Clinical chemistry laboratory errors at St. Paul’s Hospital Millennium Medical College (SPHMMC), Addis Ababa, Ethiopia. BMC Res Notes. 2018;11(1):789. doi:10.1186/s13104-018-3893-5
20. Ambachew S, Adane K, Worede A, et al. Errors in the total testing process in the clinical chemistry laboratory at the University of Gondar Hospital, Northwest Ethiopia. Ethiop J Health Sci. 2018;28(2):235–244. doi:10.4314/ejhs.v28i2.15
21. Plebani M, Sciacovelli L, Aita A. Quality indicators for the total testing process. Clin Lab Med. 2017;37(1):187–205. doi:10.1016/j.cll.2016.09.015
22. Bolarinwa OA. Principles and methods of validity and reliability testing of questionnaires used in social and health science researches. Niger Postgrad Med J. 2015;22(4):195. doi:10.4103/1117-1936.173959
23. Westgard JO, Westgard SA. The quality of laboratory testing today: an assessment of sigma metrics for analytic quality using performance data from proficiency testing surveys and the CLIA criteria for acceptable performance. Am J Clin Pathol. 2006;125(3):343–354. doi:10.1309/V50H4FRVVWX12C79
24. Kumar BV, Mohan T. Sigma metrics as a tool for evaluating the performance of internal quality control in a clinical chemistry laboratory. J Lab Physicians. 2018;10(2):194. doi:10.4103/JLP.JLP_102_17
25. Mahmood B, Rasheed MK, Khazal A, Rasheed MK. Assessment of sigma metric results of serum parameters of liver and kidney function tested by automated chemistry analyzer in Medical City Hospital. Iraqi Acad Sci J. 2018;17(3):307–314.
26. Abdollahi A, Saffar H, Saffar H. Types and frequency of errors during different phases of testing at a clinical medical laboratory of a teaching hospital in Tehran, Iran. N Am J Med Sci. 2014;6(5):224. doi:10.4103/1947-2714.132941
27. Ali M Assessment of medical laboratory request form completeness and non-communicated result to clinicians in the two public hospitals found in Hawassa city, Southern Ethiopia: Addis Ababa University; 2015.
28. Jegede F, Mbah HA, Dakata A, Gwarzo DH, Abdulrahman SA, Kuliya-Gwarzo A. Evaluating laboratory request forms submitted to haematology and blood transfusion departments at a hospital in Northwest Nigeria. Afr J Lab Med. 2016;5(1):1–6. doi:10.4102/ajlm.v5i1.381
29. Kipkulei JC, Lotodo TC. Evaluation of the completeness in the filling of laboratory request forms submitted to the haematology laboratory at a Tertiary Hospital in Kenya. Health. 2019;11(7):862–868. doi:10.4236/health.2019.117069
30. Namwase B Pre-analytical errors affecting quality of final results at the pathology laboratory college of health sciences, Makerere University Kampala Uganda: international health sciences university; 2018.
31. Addis Z, Wondimagegn T, Tachebele B. Types and frequency of pre-analytical errors at University of Gondar hospital laboratory. Elective Med . 2015;2(4):363–365. doi:10.18035/emj.v2i4.160
32. Oladeinde BH, Omoregie R, Osakue EO, Onifade AA. Evaluation of laboratory request forms for incomplete data at a rural tertiary hospital in Nigeria. N Z J Med Lab Sci. 2012;66(2):39.
33. Sakyi A, Laing E, Ephraim R, Asibey O, Sadique O. Evaluation of analytical errors in a clinical chemistry laboratory: a 3 year experience. Ann Med Health Sci Res. 2015;5(1):8–12. doi:10.4103/2141-9248.149763
34. Rizk MM, Zaki A, Hossam N, Aboul-Ela Y. Evaluating laboratory key performance using quality indicators in Alexandria University Hospital Clinical Chemistry Laboratories. J Egypt Public Health Assoc. 2014;89(3):105–113. doi:10.1097/01.EPX.0000453262.85383.70
35. Sushma B, Shrikant C. Study on “pre-analytical errors in a clinical biochemistry laboratory”: the hidden flaws in total testing. Biochem Anal Biochem. 2019;8(374):2161–1009.19.
36. Jacobsz LA, Zemlin AE, Roos MJ, Erasmus RT. Chemistry and haematology sample rejection and clinical impact in a tertiary laboratory in Cape Town. Clin Chem Lab Med. 2011;49(12):2047–2050. doi:10.1515/CCLM.2011.743
37. Atay A, Demir L, Cuhadar S, et al. Clinical biochemistry laboratory rejection rates due to various types of preanalytical errors. Biochem Med. 2014;24(3):376–382. doi:10.11613/BM.2014.040
38. Zaini R, Dahlawi H, Siddiqi A. Identification of the types and frequencies of pre-analytical errors in the clinical biochemistry laboratory: 1-year study at Hera’a General Hospital. Archiv Med. 2016;8(4):1. doi:10.21767/1989-5216.1000152
39. Tesfaw HM, Segaye A, Hassen F. Frequency of Specimen Rejection and A ssociated F actors at St. Paul’s Hospital Millennium Medical College, Addis Ababa Ethiopia. J Multidiscip Healthc. 2015;2(1):1–16. doi:10.15415/jmrh.2015.21001
40. Najat D, Szecsi PB. Prevalence of pre-analytical errors in clinical chemistry diagnostic labs in Sulaimani city of Iraqi Kurdistan. PLoS One. 2017;12(1):1. doi:10.1371/journal.pone.0170211
41. Sharaki O, Abouzeid A, Hossam N, Elsherif Y. Self assessment of pre, intra and post analytical errors of urine analysis in clinical chemistry laboratory of Alexandria Main University Hospital. Saudi J Health Sci. 2014;3(2):96. doi:10.4103/2278-0521.134863
42. Pothula Y, Al-Marzooq YM, Salem RA, Al-Jasem W, Al-Hajji A. A retrospective study of quality improvement in clinical biochemistry laboratory. Parameters. 2016;2017:2018.
43. Bouzid K, Zrelli S, Rebeh A, et al. Preanalytical phase management: identification and control of nonconformities in the sampling room of a clinical laboratory in Tunisia. J Lab Precis Med. 2018;3:38. doi:10.21037/jlpm.2018.03.14
44. Englezopoulou A, Kechagia M, Chatzikiriakou R, Kanellopoulou M, Valenti M, Masedu F. Pre analytical errors as quality indicators in clinical laboratory. Austin J Public Health Epidemiol. 2016;3(5):8.
45. Tiwari E, Pallipady A, Mishra S. Preanalytical, analytical and postanalytical errors in chemical laboratory. Int j Sci Res. 2015;4(3):2279–2281.
46. Sadiq F, Yasmeen F, Mumtaz A, et al. Frequency of errors in clinical laboratory practice. Iran J Pathol. 2014;9(1):45–49.
47. Trivedi P, Shah N, Ramani K Managing clinical laboratories: monitor and control lab errors to improve lab performance: Indian Institute of Management Ahmedabad; 2011.
48. Jafri L, Khan AH, Ghani F, Shakeel S, Raheem A, Siddiqui I. Error identification in a high-volume clinical chemistry laboratory: five-year experience. Scand J Clin Lab Invest. 2015;75(4):296–300. doi:10.3109/00365513.2015.1010175
49. Kimengech KK, Waithaka SK, Onyuka J, Kigondu CS. Determination of errors that compromise the quality of laboratory service in a tertiary hospital. Asian J Med Sci. 2017;8(1):64–70. doi:10.3126/ajms.v8i1.14740
50. Sayeed S, Ganji SB, Mopuri R. A Short-term assessment of routine chemistry parameters by sigma metrics and quality goal index ratio in a tertiary care hospital laboratory. J Evol Med Dent Sci. 2019;8(29):2303–2306. doi:10.14260/jemds/2019/505
51. Mao X, Shao J, Zhang B, Wang Y. Evaluating analytical quality in clinical biochemistry laboratory using six sigma. Biochem Med. 2018;28(2):253–256. doi:10.11613/BM.2018.020904
52. Affram K, Udofot O, Cat A, Agyare E. Application of sigma metrics for the assessment of analytical quality in clinical biochemistry laboratories in Sudan: a pilot study. Int J Adv Res. 2015;3(Issue 10):859–874.
53. Adiga US, Preethika A, Swathi K. Sigma metrics in clinical chemistry laboratory-A guide to quality control. Al Ameen J Med Sci. 2015;8(4):281–287.
54. Gülbahar Ö, Kocabıyık M, Çıracı MZ, et al. The use of six sigma methodology to evaluate the analytical performances of clinical chemistry analyzers. Turk J Biochem. 2016;43(1):1–8. doi:10.1515/tjb-2016-0223
 © 2021 The Author(s). This work is published and licensed by Dove Medical Press Limited. The
full terms of this license are available at https://www.dovepress.com/terms
and incorporate the Creative Commons Attribution
- Non Commercial (unported, 3.0) License.
By accessing the work you hereby accept the Terms. Non-commercial uses of the work are permitted
without any further permission from Dove Medical Press Limited, provided the work is properly
attributed. For permission for commercial use of this work, please see paragraphs 4.2 and 5 of our Terms.
© 2021 The Author(s). This work is published and licensed by Dove Medical Press Limited. The
full terms of this license are available at https://www.dovepress.com/terms
and incorporate the Creative Commons Attribution
- Non Commercial (unported, 3.0) License.
By accessing the work you hereby accept the Terms. Non-commercial uses of the work are permitted
without any further permission from Dove Medical Press Limited, provided the work is properly
attributed. For permission for commercial use of this work, please see paragraphs 4.2 and 5 of our Terms.