
Back to Journals » Risk Management and Healthcare Policy » Volume 19

Tivozanib versus Sorafenib as Subsequent-Line Therapy for Advanced Renal Cell Carcinoma: A Cost-Effectiveness Analysis from a US Healthcare Perspective
Authors Zhang X  , Liu R , Hu Y, Ye J, Yang M, Xu J , Yang H , Yang X, Xu Z, Dai H , Xu H
Received 25 April 2026
Accepted for publication 12 July 2026
Published 23 July 2026 Volume 2026:19 617441
DOI https://doi.org/10.2147/RMHP.S617441
Checked for plagiarism Yes
Review by Single anonymous peer review
Peer reviewer comments 2
Editor who approved publication: Dr Gulsum Kaya
Xiaoyu Zhang,1,* Ruming Liu,2,* Yani Hu,1,* Jiaxi Ye,3 Mingdong Yang,1 Junjun Xu,1 Houci Yang,1 Xiaomin Yang,1 Zhiheng Xu,1 Haibin Dai,1 Huimin Xu1
1Department of Pharmacy, The Second Affiliated Hospital, Zhejiang University School of Medicine, Hangzhou, People’s Republic of China; 2Department of Clinical Pharmacy, The First Affiliated Hospital of Kunming Medical University, Kunming, People’s Republic of China; 3School of Pharmaceutical Sciences, Wenzhou Medical University, Wenzhou, People’s Republic of China
*These authors contributed equally to this work
Correspondence: Huimin Xu, Department of Pharmacy, The Second Affiliated Hospital, Zhejiang University School of Medicine, No. 88 Jiefang Road, Shangcheng District, Hangzhou, Zhejiang, 310009, People’s Republic of China, Email [email protected] Haibin Dai, Department of Pharmacy, The Second Affiliated Hospital, Zhejiang University School of Medicine, No. 88 Jiefang Road, Shangcheng District, Hangzhou, Zhejiang, 310009, People’s Republic of China, Email [email protected]
Purpose: The incidence of advanced renal cell carcinoma (aRCC) continues to rise in the United States. While first-line combinations of immune checkpoint inhibitors and tyrosine kinase inhibitors have improved outcomes, most patients eventually require subsequent-line therapy. The Phase III TIVO-3 trial demonstrated that tivozanib significantly prolongs progression-free survival (PFS) compared to sorafenib in relapsed or refractory aRCC, though without overall survival advantage. However, its economic value remains unestablished. This study aimed to evaluate the cost-effectiveness of tivozanib versus sorafenib from a US healthcare perspective.
Patients and Methods: A Partitioned Survival Model was developed using TreeAge Pro 2022 to simulate clinical outcomes over a 10-year lifetime horizon. Survival data were reconstructed from TIVO-3 trial Kaplan-Meier curves and extrapolated using standard parametric distributions. The model incorporated direct medical costs, including drug acquisition, monitoring, adverse event management, and terminal care. Health utilities were sourced from published literature. Costs and quality-adjusted life years (QALYs) were discounted at 3% annually. Sensitivity and scenario analyses were performed to assess model robustness.
Results: In the base-case analysis, tivozanib yielded 1.65 QALYs at a cost of $634,441.98, compared to 1.61 QALYs and $438,239.46 for sorafenib, corresponding to an incremental QALY gain of 0.04. The incremental cost-effectiveness ratio (ICER) was $4,865,127.00 per QALY, substantially exceeding the $150,000 per QALY threshold. Probabilistic sensitivity analysis indicated that tivozanib was unlikely to be cost-effective at current pricing. Scenario analysis revealed that tivozanib only achieves cost-effectiveness if its acquisition cost is reduced by more than 49%.
Conclusion: Despite superior PFS, tivozanib is unlikely to be a cost-effective subsequent-line therapy for aRCC compared to sorafenib at its current US market price. The high ICER is primarily driven by substantial drug costs relative to modest incremental health gains. Substantial price reductions are necessary to improve its value proposition within the US healthcare system.
Keywords: cost-effectiveness, tivozanib, sorafenib, partitioned survival model, advanced renal cell carcinoma
Introduction
The incidence of renal cell carcinoma (RCC) continues to rise in the United States, with approximately 30% of patients diagnosed at an advanced stage, and an additional 20–40% of localized cases developing postoperative metastases.1 In recent years, first-line regimens represented by immune checkpoint inhibitors (ICIs) combined with tyrosine kinase inhibitors (TKIs) have significantly improved survival outcomes in advanced renal cell carcinoma (aRCC), becoming the standard of care.2–4 However, the vast majority of patients will eventually face disease progression, necessitating effective subsequent treatment options. Currently, there is a lack of unified standards for second-line and subsequent-line therapies, and the selection of treatment regimens is significantly influenced by multiple factors such as prior treatment, patient physical status, and drug accessibility, constituting one of the major challenges in the clinical management of aRCC.5,6
Among existing second-line therapeutic agents, multi-target TKIs play a pivotal role. Although contemporary guidelines from the National Comprehensive Cancer Network (NCCN) list cabozantinib, lenvatinib/everolimus, and belzutifan as active options in the post-ICI era, no preferred subsequent therapy has been identified due to the lack of high-level comparative evidence, and the efficacy of these agents remains limited in patients with progression after ICI therapy, with a median PFS typically ranging from 3 to 6 months.7,8 In this context, sorafenib, despite no longer being a preferred first-line agent, remains a relevant benchmark for later-line trials, as the first TKI approved for aRCC and a standard reference drug in clinical practice and trials,9,10 thus providing a valid reference for economic comparison. Tivozanib, a potent and highly selective vascular endothelial growth factor receptor (VEGFR)-1, −2, and −3 TKI, has recently garnered significant attention. Compared to earlier TKIs like sorafenib, tivozanib offers more targeted inhibition with reduced off-target toxicities, theoretically providing a superior risk-benefit profile for patients who have already endured multiple lines of systemic therapy.1
The pivotal Phase III TIVO-3 trial provided the high-level evidence necessary to position tivozanib in the later-line setting. This head-to-head study compared tivozanib directly with sorafenib in patients with aRCC who had progressed after two or more prior systemic therapies. The results demonstrated that tivozanib significantly prolonged median PFS (5.6 vs 3.9 months; HR = 0.73; p = 0.016) and improved the objective response rate (18% vs 8%) with better tolerability.11 A recent long-term follow-up confirmed tivozanib’s PFS benefit over sorafenib in Immune Checkpoint Inhibitor (CPI) pretreated patients (median PFS: 7.4 vs 5.6 months; HR = 0.55; P = 0.016), despite the absence of an overall survival (OS) benefit (median OS: 18.1 vs 20.9 months; HR = 0.73; P = 0.099).12 This role has been further recognized by the NCCN, which in December 2024 removed the prior restriction limiting tivozanib to patients with >2 prior systemic therapies.13 Based on these findings, the US Food and Drug Administration (FDA) approved tivozanib for adult patients with relapsed or refractory advanced RCC following two or more prior systemic therapies.14
However, there is a significant gap in pharmacoeconomic research for post-line therapy of aRCC. Existing health technology assessments predominantly focus on first-line combination regimens or comparisons of different TKIs in first-line treatment,15,16 while specialized post-line therapy economic evaluations based on high-quality head-to-head trial data for treated populations remain extremely limited. This evidence gap is becoming increasingly critical, particularly within healthcare systems facing growing expenditure pressures. Although the clinical efficacy of tivozanib has been established, the economic implications of its use remain an important consideration for healthcare decision makers in the United States. Oncology therapies often involve substantial treatment costs, and economic evaluations are increasingly used to inform value-based decision making by payers and health technology assessment bodies. Cost-effectiveness analyses provide a systematic approach to evaluating whether the additional clinical benefits of a therapy justify its incremental costs. Furthermore, given that the United States represents the largest pharmaceutical market globally and often sets benchmarks for international drug pricing, evaluating the economic value of tivozanib from a US perspective is equally essential.
Therefore, given the absence of direct comparative economic evaluations in subsequent-line treatment, this study aims to conduct a long-term cost-effectiveness analysis of tivozanib versus sorafenib for aRCC based on the phase III TIVO-3 trial. The primary objective of this study is to evaluate whether tivozanib provides favorable economic value compared with sorafenib for previously treated aRCC from the perspective of the US healthcare system. Such an analysis provides evidence to support value-based decision-making in the US healthcare setting and allows assessment of cost-effectiveness under alternative willingness-to-pay (WTP) thresholds.
Methods
Population and Interventions
Based on the TIVO-3 phase III clinical trial, the model simulated patients with aRCC who had received at least two prior systemic regimens, including one vascular endothelial growth factor receptor tyrosine kinase inhibitor (VEGFR TKI). Participants were adults with histologically or cytologically confirmed metastatic RCC (with a clear‑cell component), measurable disease per Response Evaluation Criteria in Solid Tumors version 1.1, and an Eastern Cooperative Oncology Group performance status of 0 or 1. Patients were randomly assigned (1:1) to either the tivozanib arm or the sorafenib arm. The tivozanib arm received oral tivozanib 1.5 mg once daily in 4‑week cycles (21 days on, 7 days off), while the sorafenib arm received oral sorafenib 400 mg twice daily continuously. Treatment continued until radiological disease progression or unacceptable toxicity. Upon radiographically confirmed disease progression, the model explicitly accounted for the proportion of patients receiving subsequent anticancer therapies, as observed in the TIVO-3 trial. During the active treatment phase, monitoring adhered to the TIVO-3 protocol with tumor assessments every 8 weeks; following progression, surveillance transitioned to routine clinical practice. Treatment continued in the model until death, discontinuation due to adverse events, or until the final data cutoff of the study. This TIVO-3 trial is registered with ClinicalTrials.gov, NCT02627963.
Model Construction
A Partitioned Survival Model was developed to simulate the clinical and economic outcomes of patients with advanced renal cell carcinoma receiving tivozanib or sorafenib (Figure 1). The model was built using TreeAge Pro 2022 software (TreeAge Software, Williamstown, MA, USA).
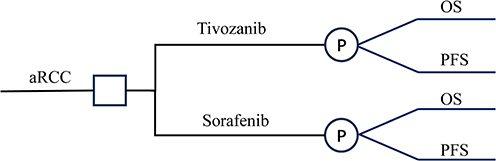 |
Figure 1 The structure of the partitioned survival model. Abbreviations: aRCC, advanced renal cell carcinoma; PFS, progression-free survival; OS, overall survival. |
In this simulation, patients began in the progression-free survival (PFS) health state immediately following treatment initiation. Over successive model cycles, they could remain in this state, experience progressive disease (PD), or transition to the absorbing state of Death. A 28-day cycle length was implemented to align with the dosing regimen of tivozanib, with a 10-year time horizon to ensure that more than 99% of the simulated cohort entered the death state, thereby fully capturing long-term survival and economic outcomes. The economic outcomes assessed included total lifetime costs, quality-adjusted life years (QALYs), and the resulting incremental cost-effectiveness ratio (ICER). An intervention is deemed cost-effective if its ICER is below a predefined societal WTP threshold.
This evaluation was conducted in accordance with the updated Consolidated Health Economic Evaluation Reporting Standards 2022 (CHEERS 2022). A detailed checklist of compliance is provided in Table S1.
Survival Extrapolation
A partitioned survival analysis framework was employed to estimate the proportion of patients in each health state over time. The model comprised three mutually exclusive health states: progression-free (PF), progressed disease (PD), and death. The proportion of patients in each state at any given time t was derived directly from the independently fitted survival curves for progression-free survival SPFS(t) and overall survival SOS(t). Specifically, the probability of being in the PF state was defined by SPFS(t), while the proportion of patients in the PD state was calculated as the difference between the OS and PFS curves (SOS(t) - SPFS(t)). The proportion of deceased patients was determined by 1-SOS(t).
Given that individual patient-level data from the TIVO-3 trial were not accessible, survival estimates for overall survival and progression-free survival were reconstructed from published Kaplan-Meier curves. Digitization of the survival curves was performed using GetData Graph Digitizer software (Version 2.26), and R software (Version 4.3.2) was employed to reconstruct pseudo-individual patient data following the algorithm developed by Guyot et al.17
To extrapolate long-term survival trajectories, five standard parametric survival functions were fitted to the reconstructed data: Exponential, Weibull, Log-logistic, Log-normal, and Gompertz distributions. Model selection was guided by a combination of statistical criteria and clinical plausibility. Specifically, the Akaike Information Criterion (AIC) and Bayesian Information Criterion (BIC) were calculated for each distribution, and visual inspection of the fitted curves against the original Kaplan-Meier data was conducted to assess goodness-of-fit and clinical reasonableness. Table S2 and Figure S1 present the model selection criteria and goodness-of-fit visualizations. The log-normal distribution was identified as the optimal fit for both the OS and PFS survival curves for tivozanib and sorafenib. Detailed fitting results can be found in Table 1 and Figure S2.
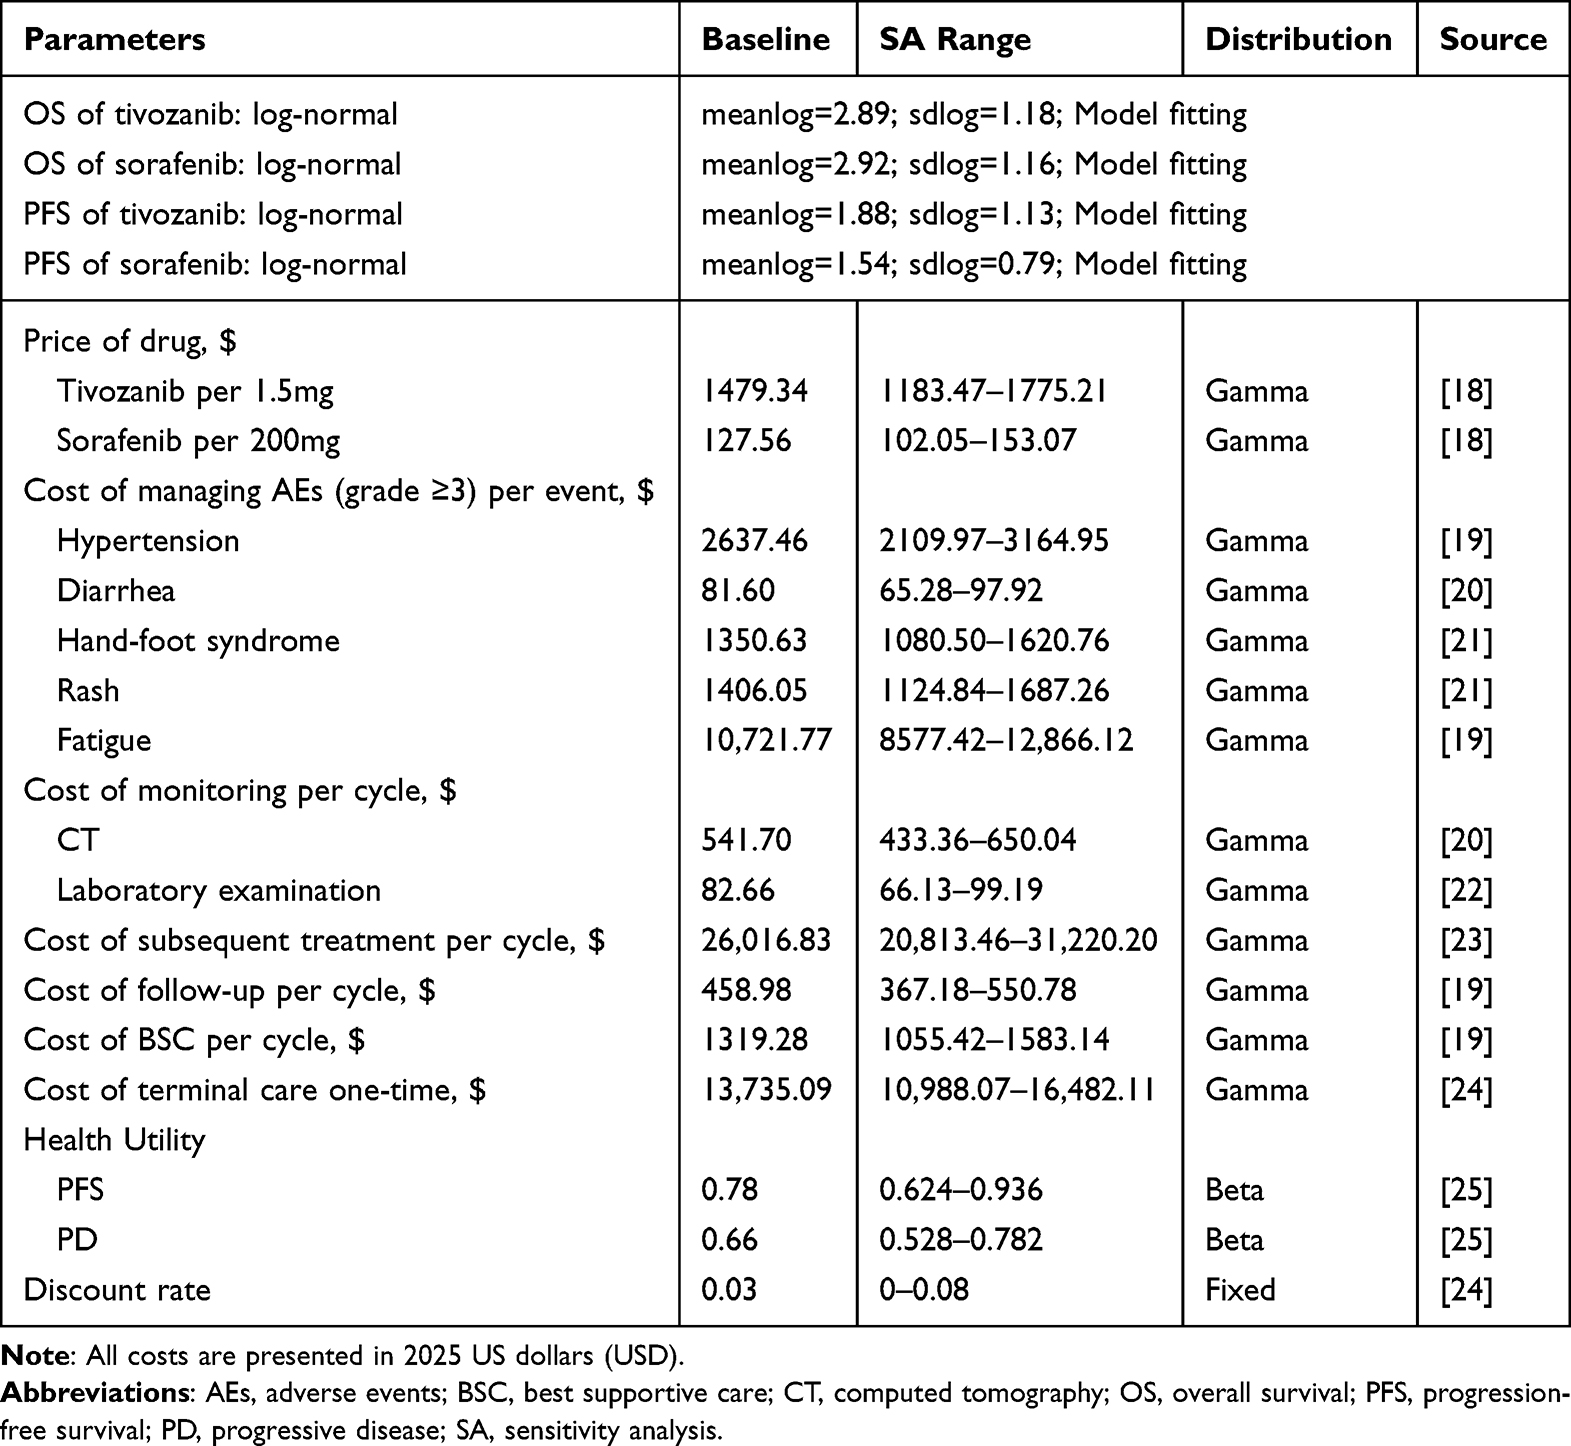 |
Table 1 Parameters Input |
Cost and Utility Parameters
The analysis was conducted from a third-party payer perspective in the United States, incorporating direct medical costs only. Captured costs included drug acquisition, routine disease monitoring (imaging and laboratory tests), management of severe (grade ≥3) treatment-related adverse events (AEs), best supportive care (BSC), follow-up and terminal care expenses. Follow-up costs apply to all alive health states, whether or not disease progression has occurred. Best supportive care costs apply after progression, during the post-progression survival period. Terminal care costs apply exclusively at the death state.
Drug acquisition costs were based on the dosing regimens from the TIVO-3 trial. Patient body surface area (BSA) was applied for dose calculation, assumed to be 1.90 m2,26 based on national health statistics for advanced cancer populations. The drug price of tivozanib and sorafenib in the United States was obtained from the query results on National Drug Code (NDC) Directory via the IBM Micromedex Red Book, using the Wholesale Acquisition Cost (WAC) to represent the US market price.18 Reflecting real-world practice, the model included costs for anticancer therapy received after radiological progression. In the TIVO-3 trial, 40% of patients in the tivozanib arm and 47% in the sorafenib arm received further treatment.10 In line with contemporary guidelines (NCCN), common subsequent regimens include agents such as cabozantinib, nivolumab, everolimus or axitinib.8,27 Post-progression treatment patterns and costs were derived from a US real-world claims analysis of mRCC patients receiving second-line therapy after prior Immune-Oncology (IO) and/or VEGF inhibitor treatment (Optum Clinformatics Data Mart, 2015–2022)23. Based on the reported distribution across the second to fourth line settings, our model assumed that patients who progress receive the most common subsequent regimens: cabozantinib (38.5%), lenvatinib plus everolimus (15.5%), or axitinib (10.5%). The remaining patients were assumed to receive other active agents. The same study provided a weighted average monthly cost of $23,605 (2022 USD) for subsequent treatment, which we inflated to $26,016.83 (2025 USD) using the medical care component of the Consumer Price Index (see Table 1).
Costs for managing severe AEs were calculated on a per-cycle basis. We included all Grade ≥3 AEs with an incidence ≥5% in either arm of the TIVO-3 trial. The total AE cost per cycle was the sum of each AE’s management cost multiplied by its probability of occurrence, conservatively assumed to be incurred in the first cycle. BSC and routine follow-up were modeled as fixed per-cycle costs, while terminal care was applied as a one-time cost in the cycle of death.
All historical costs were adjusted for inflation to 2025 values using US Bureau of Labor Statistics Consumer Price Index via https://www.inflationtool.com and subsequently converted to 2025 US dollars. The model applied a weighted monthly cost for this phase, based on reported usage patterns and unit costs from published literature and national formularies.19–22,24 All final cost parameters used in the model are presented in Table 1.
Health utilities, representing quality of life on a scale from 0 (death) to 1 (full health), were assigned to the model’s health states. Utilities were sourced from published literature on aRCC: a utility of 0.78 was assigned to the PFS state and 0.66 to the PD state.25 Disutilities associated with severe AE management were applied in the cycle of occurrence28–31 (Table 2).
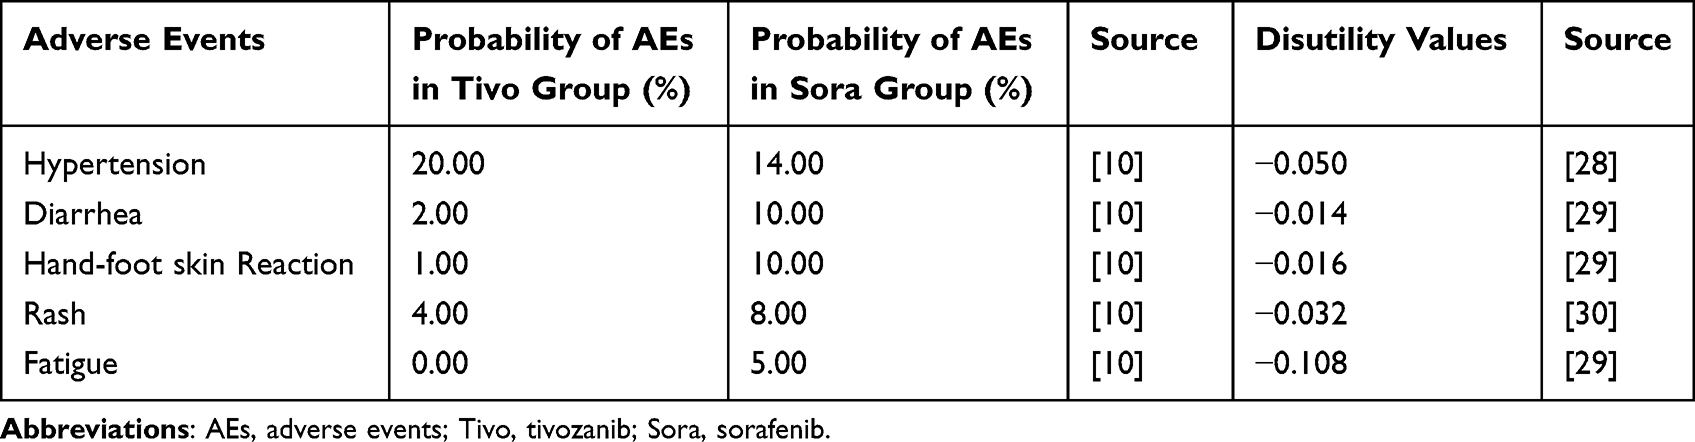 |
Table 2 Grade AEs ≥3–5 and Disutility Values |
All future costs and health outcomes were discounted at an annual rate of 3% for the United States.19 The primary outcome was the ICER and incremental net monetary benefit (INMB), evaluated against a WTP threshold of $150,000 per QALY, the standard benchmark for oncology interventions in the United States.19
Sensitivity Analysis
The uncertainty in the model was evaluated using one-way sensitivity analysis (OWSA) and probabilistic sensitivity analysis (PSA). In the OWSA, key parameters were individually varied across a plausible range (±20% of baseline or based on 95% confidence intervals), while holding others constant. The results are presented in a tornado diagram, highlighting the parameters with the greatest influence on the ICER. A PSA was performed using 10,000 Monte Carlo simulations. Within each simulation, all uncertain parameters were varied simultaneously according to their predefined statistical distributions. Specifically, cost parameters followed Gamma distributions, while adverse event probabilities, utility values, and disutilities followed Beta distribution. The results are summarized in an incremental cost-effectiveness scatterplot and a cost-effectiveness acceptability curve (CEAC). The CEAC illustrates the probability of each treatment being cost-effective across a range of WTP thresholds. For the United States, a threshold of US $150,000/QALY was applied.
Scenario Analysis
To address the potential impact of pharmaceutical pricing strategies and market competition on the economic viability of tivozanib, we performed a series of price reduction scenario analyses. Given that high acquisition costs for novel TKIs often serve as a primary barrier to cost-effectiveness in the US market, we simulated the economic outcomes of tivozanib under several price depreciation scenarios: 20%, 40%, 50%, 60%, and 80% reductions from the current WAC. The analysis compared changes in the ICER and the INMB.
Ethics Statement
This study is a secondary analysis of aggregate data from the TIVO-3 trial (ClinicalTrials.gov identifier: NCT02627963). As reported in the original trial publication, the TIVO-3 trial was approved by the institutional review board or ethics committee at every participating centre and was conducted in accordance with the Declaration of Helsinki and Good Clinical Practice guidelines. All patients provided written informed consent. Specific ethical approval numbers were not reported in the publication. This cost-effectiveness analysis uses only previously published, anonymized, summary-level data. No individual patient data were accessed. Therefore, no additional ethical approval or informed consent was required for this retrospective, non-interventional study.
Results
Baseline Analysis
The results of the base-case analysis, simulated over a 10-year lifetime horizon, are presented in Table 3. In the US healthcare perspective, the total lifetime cost for patients in the tivozanib group was $634,441.98, compared to $438,239.46 in the sorafenib group. This resulted in an incremental cost of $196,202.51 for tivozanib.
 |
Table 3 Model Outputs in Baseline Analysis |
Regarding health outcomes, tivozanib yielded 1.65 QALYs, while sorafenib yielded 1.61 QALYs, providing a modest incremental survival benefit of 0.04 QALYs. Consequently, the calculated ICER was $4,865,127.00/QALY. This ICER significantly exceeds the established WTP threshold of $150,000/QALY. Furthermore, the INMB was negative ($-190,153.26), collectively indicating that at current pricing, tivozanib is not a cost-effective subsequent-line therapeutic option compared to sorafenib from the US healthcare perspective.
Sensitivity Analysis
The robustness of the model results was evaluated through univariate and probabilistic sensitivity analyses. In the one-way sensitivity analysis, the results are illustrated in the tornado diagram (Figure 2). The analysis revealed that the cost of tivozanib per 1.5 mg had the most significant impact on the INMB, followed by the proportion of patients receiving subsequent treatment in both the sorafenib and tivozanib groups. Other parameters, such as the utility of the PD state, the discount rate, and the costs of managing specific adverse events like fatigue or hand-foot skin reaction, had a relatively minor influence on the overall economic outcomes. Notably, across the variation of all key parameters within their plausible ranges, the INMB remained below zero, suggesting that the base-case conclusion is stable.
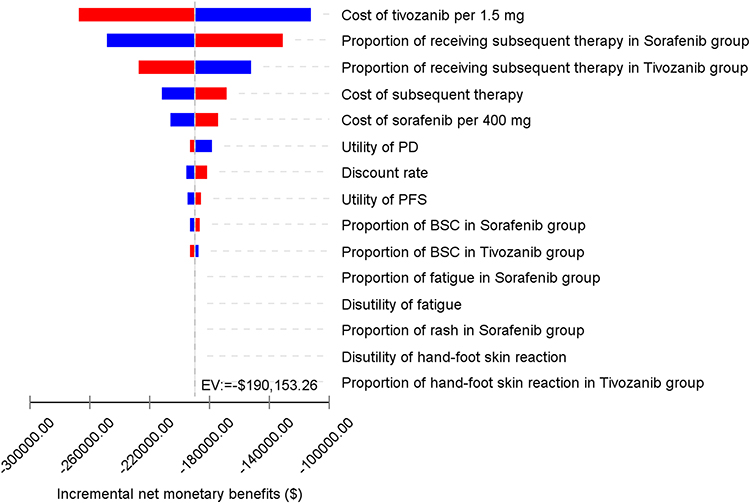 |
Figure 2 Tornado diagram of one-way sensitivity analysis of tivozanib versus sorafenib. Blue bars represent the lower bound of the INMB resulting from parameter uncertainty, while red bars represent the upper bound. Abbreviations: PD, progressive disease; PFS, progression-free survival; BSC, best supportive care; INMB, incremental net monetary benefit. |
For the probabilistic sensitivity analysis, 10,000 Monte Carlo simulations were performed. The incremental cost-effectiveness scatter plot (Figure 3) showed that the vast majority of simulated points were located above the WTP threshold line of $150,000/QALY. This indicated an extremely low probability of tivozanib being cost-effective at this threshold in the US context. A small proportion of the simulations yielded incremental QALYs below zero, suggesting that tivozanib could be less effective than sorafenib. The cost-effectiveness acceptability curve (Figure 4) further demonstrates the probability of each strategy being cost-effective across various WTP thresholds. At a WTP of $0/QALY, sorafenib has a 100% probability of being the cost-effective choice. As the WTP threshold increases, the probability of tivozanib being cost-effective gradually rises, reaching a 50% “break-even” point only when the WTP threshold approaches approximately $5,000,000/QALY. At the standard US threshold of $150,000/QALY, the probability of tivozanib being cost-effective remains negligible, consistent with its lack of economic advantage under current market pricing.
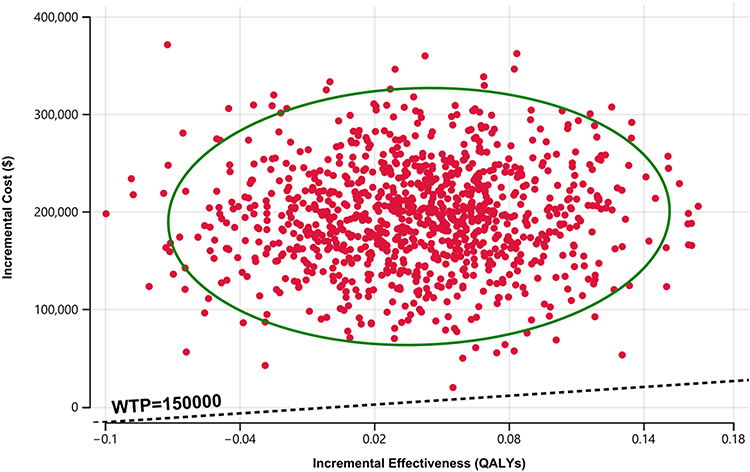 |
Figure 3 Incremental cost-effectiveness scatter plot of tivozanib versus sorafenib. The horizontal axis denotes the incremental utility value, while the vertical axis indicates the incremental cost. The diagonal line represents the WTP. Ellipse: 95% confidence interval. Abbreviations: QALY, quality-adjusted life year; WTP, willingness-to-pay. |
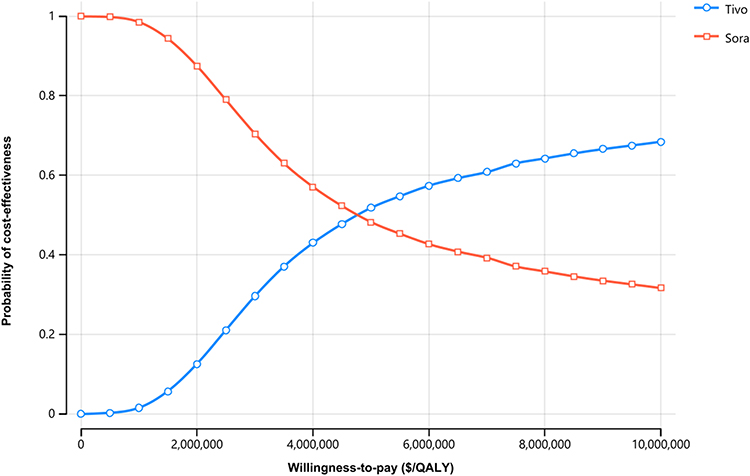 |
Figure 4 Cost-effectiveness acceptability curves of tivozanib versus sorafenib. Abbreviations: Tivo, tivozanib; Sora, sorafenib; QALY, quality-adjusted life year; WTP, willingness-to-pay. |
Scenario Analysis
To further explore the economic impact of drug pricing, we conducted scenario analyses simulating various price reductions for tivozanib, ranging from 0% (baseline) to 80%. As shown in Table 4, the cost-effectiveness of tivozanib improves as the price reduction increases. At baseline (0% reduction), tivozanib had an ICER of $4,865,127.00 per QALY, far exceeding the WTP threshold of $150,000.00 per QALY. A 20% price reduction lowered the ICER to $2,947,972.40 per QALY, and a 40% reduction further reduced it to $1,030,817.80 per QALY. At a 49% price reduction (tivozanib cost reduced to $754.46 per 1.5 mg), the ICER fell to $148,926.69 per QALY, just below the $150,000.00 threshold, with a positive INMB of $43.29. At a 50% price reduction, the ICER decreased further to $72,240.51 per QALY, with an INMB of $3135.92. At 60% and 80% reductions, tivozanib became dominant with negative incremental costs and ICERs. These findings indicate that a price reduction of at least 49% is required for cost-effectiveness from a US healthcare perspective.
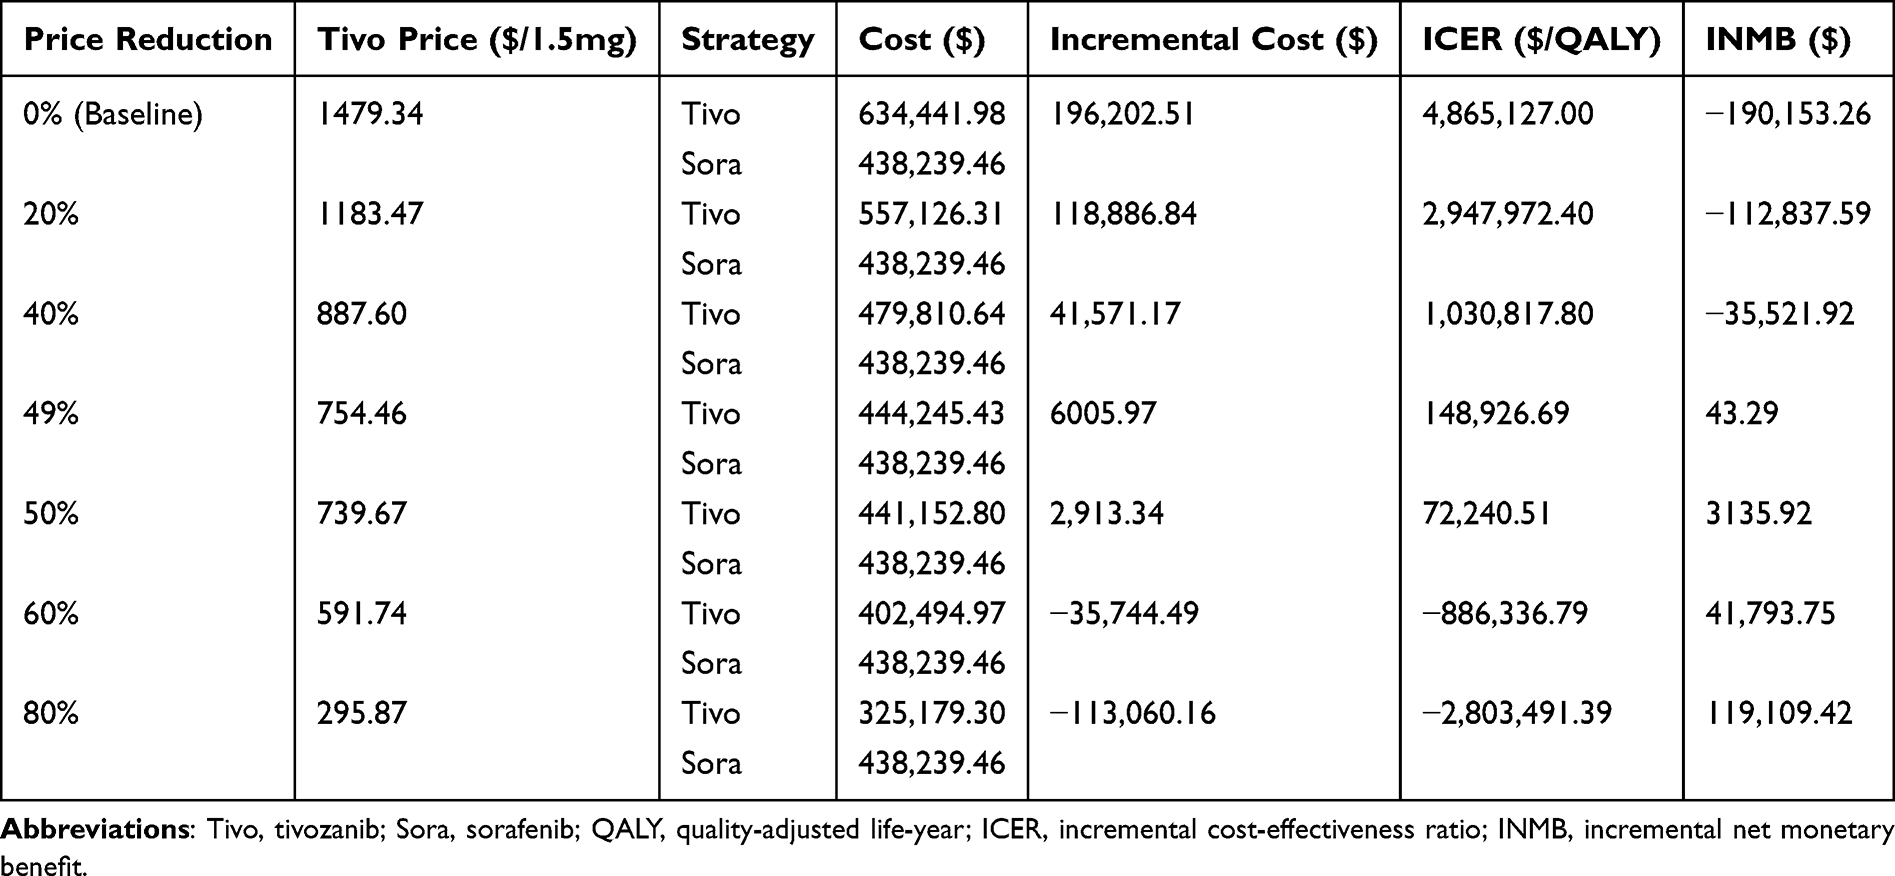 |
Table 4 Result of Scenario Analysis |
Discussion
Renal cell carcinoma remains a significant global health burden, with a rising incidence and a complex treatment landscape for advanced stages. The TIVO-3 trial addressed this clinical gap by demonstrating that tivozanib, a highly selective VEGF receptor TKI, extended median PFS to 5.6 months compared to 3.9 months with sorafenib, while maintaining a more favorable safety profile. However, our base-case analysis revealed an incremental cost of $196,202.51 for an additional 0.04 QALYs, resulting in an ICER of $4,865,127.00/QALY, which substantially surpasses the standard US WTP threshold of $150,000/QALY. Our investigation suggests that under base-case assumptions, the current pricing presents a significant challenge to its economic viability from the US healthcare perspective.
OWSA identified the unit cost of tivozanib as the primary driver of the ICER, followed by the proportion of patients receiving subsequent treatment and the utility value of the PFS state. This finding underscores that the lack of cost-effectiveness is largely driven by high drug costs relative to modest QALY gains. Our simulations indicate that a price reduction of at least 49% is required for cost-effectiveness, with dominance achieved at 60% reduction. These results suggest that without substantial price negotiations or generic competition following patent expiration, tivozanib’s role as a value-based therapeutic option in the US remains precarious.
Besides the high price of tivozanib, several factors may explain this discordance between PFS benefit and QALY gain. First, in heavily pretreated populations, baseline health-related quality of life is already substantially diminished. Second, the absolute PFS gain observed in TIVO-3 (1.7 months) is modest. Third, the updated OS analysis of TIVO-3 showed that median OS numerically favored sorafenib over tivozanib (20.9 vs 18.1 months) in CPI-pretreated patients, suggesting that PFS advantage may not reliably predict OS or QALY benefits.12 Fourth, the 10-year time horizon dilutes any quality-of-life advantage in the PFS state by time spent in progressive disease states.
It should also be noted that the findings are subject to uncertainty associated with long-term OS extrapolation. In our analysis, the log-normal distribution was selected as the best-fitting parametric model based on AIC, BIC, and visual inspection of the Kaplan-Meier data. However, we did not perform sensitivity analyses using alternative distributions (eg, Weibull, Gompertz, log-logistic), which could yield different long-term survival projections beyond the observed trial period. Therefore, our base-case findings are conditional on the choice of the log-normal assumption. Furthermore, as the RCC treatment landscape shifts toward IO+TKI or dual IO combinations, the biological characteristics of “subsequent-line” tumors are evolving, potentially narrowing the efficacy window for later-line TKIs like tivozanib. This trend, coupled with the emergence of novel agents such as belzutifan, poses real-world challenges for tivozanib’s implementation. Future research should focus on identifying biomarkers to select patients likely to derive more pronounced survival benefits.
This study has several limitations. First, regarding the choice of comparator, we acknowledge that contemporary NCCN guidelines preferentially recommend cabozantinib, lenvatinib/everolimus, nivolumab, and belzutifan over sorafenib.27 A network meta-analysis by Hahn et al demonstrated that cabozantinib provided the strongest PFS benefit among later-line options (HR 0.51, 95% CrI: 0.41–0.63).32 While sorafenib was the appropriate reference based on the TIVO-3 trial design, these newer agents may represent the actual clinical alternatives to tivozanib in many US practices. Thus, our ICER estimates may not reflect the value of tivozanib relative to the current standard of care. A formal indirect comparison linking tivozanib to these newer agents would be a valuable extension of this work.
Second, the utility values utilized in the model were derived from published literature and clinical trial data rather than direct patient elicitation, which may not perfectly capture the real-world health-related quality of life of patients in later lines of therapy. Third, our model simplified the costs of adverse event management; although we included major AEs like fatigue and hypertension, the full economic burden of low-grade but chronic toxicities might be underestimated. Fourth, the 10-year lifetime horizon requires the extrapolation of survival data beyond the TIVO-3 trial’s follow-up period, introducing inherent uncertainty regarding long-term OS benefits. Finally, while we addressed the US perspective, regional variations in healthcare delivery and negotiated drug discounts were not considered, which might result in different ICERs in specific institutional contexts.
Despite these limitations, our study provides a robust economic framework for assessing the value of tivozanib in the increasingly crowded aRCC treatment market.
Conclusion
In conclusion, from the US healthcare perspective, tivozanib is unlikely to demonstrate cost-effectiveness compared with sorafenib as subsequent-line therapy for aRCC at current pricing, with a base-case ICER of $4,865,127 per QALY and an incremental gain of only 0.04 QALYs. A price reduction of at least 49% would be required to reach the $150,000/QALY WTP threshold. However, these findings should be interpreted with caution given the small incremental QALY gain and the inherent uncertainty in long-term survival extrapolations beyond the observed trial period.
Data Sharing Statement
The original contributions presented in the study are included in the article/supplementary material. For any additional data requests, please contact the corresponding author Huimin Xu by Email at [email protected].
Ethics Approval
This article is based on previously conducted studies and does not contain any studies with human participants or animals performed by any of the authors.
Author Contributions
All authors made a significant contribution to the work reported, whether that is in the conception, study design, execution, acquisition of data, analysis and interpretation, or in all these areas; took part in drafting, revising or critically reviewing the article; gave final approval of the version to be published; have agreed on the journal to which the article has been submitted; and agree to be accountable for all aspects of the work.
Funding
The authors declare that no funds, grants, or other support were received during the preparation of this manuscript.
Disclosure
Xiaoyu Zhang, Ruming Liu and Yani Hu are co-first authors for this study. The authors have no competing interests or relevant affiliations with any organization or entity with the subject matter or materials discussed in the manuscript.
References
1. Bahadoram S, Davoodi M, Hassanzadeh S, Bahadoram M, Barahman M, Mafakher L. Renal cell carcinoma: an overview of the epidemiology, diagnosis, and treatment. Giornale Italiano Di Nefrologia. 2022;39(3):2022–12.
2. Rini BI, Plimack ER, Stus V, et al. Pembrolizumab plus Axitinib versus Sunitinib for advanced renal-cell carcinoma. New Engl J Med. 2019;380(12):1116–1127. doi:10.1056/NEJMoa1816714
3. Choueiri TK, Powles T, Burotto M, et al. Nivolumab plus Cabozantinib versus Sunitinib for advanced renal-cell carcinoma. New Engl J Med. 2021;384(9):829–841. doi:10.1056/NEJMoa2026982
4. Escudier B, Porta C, Schmidinger M, et al. Renal cell carcinoma: ESMO Clinical Practice Guidelines for diagnosis, treatment and follow-up. Ann Oncol. 2014;25(Suppl 3):iii49–56. doi:10.1093/annonc/mdu259
5. Barragan-Carrillo R, Saad E, Saliby RM, et al. First and second-line treatments in metastatic renal cell carcinoma. Europ Urol. 2025;87(2):143–154. doi:10.1016/j.eururo.2024.10.019
6. Powles T, Albiges L, Bex A, et al. Renal cell carcinoma: ESMO Clinical Practice Guideline for diagnosis, treatment and follow-up. Ann Oncol. 2024;35(8):692–706. doi:10.1016/j.annonc.2024.05.537
7. Albiges L, McGregor BA, Heng DYC, et al. Vascular endothelial growth factor-targeted therapy in patients with renal cell carcinoma pretreated with immune checkpoint inhibitors: a systematic literature review. Cancer Treat Rev. 2024;122:102652. doi:10.1016/j.ctrv.2023.102652
8. Motzer RJ, Jonasch E, Agarwal N, et al. Kidney cancer, Version 3.2022, NCCN clinical practice guidelines in oncology. J Natl Compr Canc Netw. 2022;20(1):71–90. doi:10.6004/jnccn.2022.0001
9. Escudier B, Eisen T, Stadler WM, et al. Sorafenib in advanced clear-cell renal-cell carcinoma. New Engl J Med. 2007;356(2):125–134. doi:10.1056/NEJMoa060655
10. Rini BI, Pal SK, Escudier BJ, et al. Tivozanib versus sorafenib in patients with advanced renal cell carcinoma (TIVO-3): a Phase 3, multicentre, randomised, controlled, open-label study. Lancet Oncol. 2020;21(1):95–104. doi:10.1016/s1470-2045(19)30735-1
11. Jacob A, Shook J, Hutson TE. Tivozanib, a highly potent and selective inhibitor of VEGF receptor tyrosine kinases, for the treatment of metastatic renal cell carcinoma. Future Oncol. 2020;16(28):2147–2164. doi:10.2217/fon-2020-0443
12. Zugman M, McDermott DF, Escudier BJ, et al. Updated overall survival in patients with prior checkpoint inhibitor therapy in the phase III TIVO-3 study. Oncologist. 2025;30(2). doi:10.1093/oncolo/oyae369
13. Panel NKC. Transparency document: NCCN clinical practice guidelines in oncology (NCCN Guidelines) for kidney cancer version 1. 2026. Available from: https://www.nccn.org/guidelines/guidelines-detail?category=1&id=1460.
14. Chang E, Weinstock C, Zhang L, et al. FDA approval summary: tivozanib for relapsed or refractory renal cell carcinoma. Clin Cancer Res. 2022;28(3):441–445. doi:10.1158/1078-0432.Ccr-21-2334
15. Kilonzo M, Hislop J, Elders A, et al. Pazopanib for the first-line treatment of patients with advanced and/or metastatic renal cell carcinoma: a NICE single technology appraisal. PharmacoEconomics. 2013;31(1):15–24. doi:10.1007/s40273-012-0006-5
16. McDermott DF, Huseni MA, Atkins MB, et al. Clinical activity and molecular correlates of response to atezolizumab alone or in combination with bevacizumab versus sunitinib in renal cell carcinoma. Nat Med. 2018;24(6):749–757. doi:10.1038/s41591-018-0053-3
17. Guyot P, Ades AE, Ouwens MJ, Welton NJ. Enhanced secondary analysis of survival data: reconstructing the data from published Kaplan-Meier survival curves. BMC Med Res Methodol. 2012;12:9. doi:10.1186/1471-2288-12-9
18. Corporation IBM. Data From: IBM Micromedex Red Book. Greenwood Village, CO: Micromedex Solutions; 2025.
19. Zhu J, Li Z, Ding Y, Xu Q. Cost-effectiveness of talazoparib plus enzalutamide as first-line therapy in metastatic castration-resistant prostate cancer. Ther Adv Med Oncol. 2025;17:17588359251367329. doi:10.1177/17588359251367329
20. Li X, Bao J, Ma J. Cost-effectiveness analysis of FOLFOXIRI/FOLFOXIRI and mFOLFOX6/FOLFIRI treatment in first-line and second-line chemotherapy for metastatic colorectal cancer. BMJ Open. 2025;15(3):e086372. doi:10.1136/bmjopen-2024-086372
21. Niraula S, Amir E, Vera-Badillo F, Seruga B, Ocana A, Tannock IF. Risk of incremental toxicities and associated costs of new anticancer drugs: a meta-analysis. J Clin Oncol. 2014;32(32):3634–3642. doi:10.1200/jco.2014.55.8437
22. Wu B, Shi L. Cost-effectiveness of maintenance olaparib for germline BRCA-mutated metastatic pancreatic cancer. J Natl Compr Canc Netw. 2020;18(11):1528–1536. doi:10.6004/jnccn.2020.7587
23. Shah NJ, Shinde R, Bhattacharya R, et al. Postimmunotherapy and vascular endothelial growth factor inhibitor landscape in advanced renal cell carcinoma: treatment patterns, costs, and outcomes. JCO Oncol Pract. 2025:Op2500278. doi:10.1200/op-25-00278
24. Wu B, Zhang Q, Sun J. Cost-effectiveness of nivolumab plus ipilimumab as first-line therapy in advanced renal-cell carcinoma. J Immunother Cancer. 2018;6(1):124. doi:10.1186/s40425-018-0440-9
25. Edwards SJ, Wakefield V, Cain P, et al. Axitinib, cabozantinib, everolimus, nivolumab, sunitinib and best supportive care in previously treated renal cell carcinoma: a systematic review and economic evaluation. Health Technol Assess. 2018;22(6):1–278. doi:10.3310/hta22060
26. Xu Y, Xu B, Guan H, Zhao Z. Cost-effectiveness analysis of 11 pharmacotherapies for recurrent glioblastoma in the USA and China. Ther Adv Med Oncol. 2024;16:17588359241264727. doi:10.1177/17588359241264727
27. Bex A, Ghanem YA, Albiges L, et al. European association of urology guidelines on renal cell carcinoma: the 2025 update. Eur Urol. 2025;87(6):683–696. doi:10.1016/j.eururo.2025.02.020
28. Wan X, Luo X, Tan C, Zeng X, Zhang Y, Peng L. First-line atezolizumab in addition to bevacizumab plus chemotherapy for metastatic, nonsquamous non-small cell lung cancer: a United States-based cost-effectiveness analysis. Cancer. 2019;125(20):3526–3534. doi:10.1002/cncr.32368
29. Kobayashi M, Kudo M, Izumi N, et al. Cost-effectiveness analysis of Lenvatinib treatment for patients with unresectable hepatocellular carcinoma (uHCC) compared with sorafenib in Japan. J Gastroenterol. 2019;54(6):558–570. doi:10.1007/s00535-019-01554-0
30. Porte F, Granghaud A, Chang J, et al. Cost-effectiveness of avelumab first-line maintenance therapy for adult patients with locally advanced or metastatic urothelial carcinoma in France. PLoS One. 2024;19(5):e0302548. doi:10.1371/journal.pone.0302548
31. Yorio JT, Asnis-Alibozek AG, Kasturi V, Hutson TE. Estimated cost of VEGFR TKI associated adverse events in metastatic renal cell carcinoma patients. BMC Health Serv Res. 2024;24(1):1283. doi:10.1186/s12913-024-11587-8
32. Hahn AW, Klaassen Z, Agarwal N, et al. First-line treatment of metastatic renal cell carcinoma: a systematic review and network meta-analysis. Eur Urol Oncol. 2019;2(6):708–715. doi:10.1016/j.euo.2019.09.002
 © 2026 The Author(s). This work is published and licensed by Dove Medical Press Limited. The
full terms of this license are available at https://www.dovepress.com/terms
and incorporate the Creative Commons Attribution
- Non Commercial (unported, 4.0) License.
By accessing the work you hereby accept the Terms. Non-commercial uses of the work are permitted
without any further permission from Dove Medical Press Limited, provided the work is properly
attributed. For permission for commercial use of this work, please see paragraphs 4.2 and 5 of our Terms.
© 2026 The Author(s). This work is published and licensed by Dove Medical Press Limited. The
full terms of this license are available at https://www.dovepress.com/terms
and incorporate the Creative Commons Attribution
- Non Commercial (unported, 4.0) License.
By accessing the work you hereby accept the Terms. Non-commercial uses of the work are permitted
without any further permission from Dove Medical Press Limited, provided the work is properly
attributed. For permission for commercial use of this work, please see paragraphs 4.2 and 5 of our Terms.