Back to Journals » Diabetes, Metabolic Syndrome and Obesity » Volume 19
Tissue Iron Predicts Metformin Responsiveness in a Mouse Model and in Humans with Type 2 Diabetes
Authors Harrison AV, Usoh CO, Sink S ![]() , Jain S, Berry-Price HM, Lorenzo FR
, Jain S, Berry-Price HM, Lorenzo FR ![]() , McClain DA
, McClain DA ![]()
Received 14 November 2025
Accepted for publication 9 February 2026
Published 5 March 2026 Volume 2026:19 580024
DOI https://doi.org/10.2147/DMSO.S580024
Checked for plagiarism Yes
Review by Single anonymous peer review
Peer reviewer comments 2
Editor who approved publication: Dr Rebecca Baqiyyah Conway
Alexandria V Harrison,1,* Chinenye O Usoh,1,2,* Sandy Sink,1 Shalini Jain,1 Holly M Berry-Price,1 Felipe R Lorenzo,1 Donald A McClain1,2
1Department of Internal Medicine, Division of Endocrinology, Diabetes and Metabolism, Wake Forest School of Medicine, Winston-Salem, NC, 27157, USA; 2Research Service, W. G. (Bill) Hefner VA Medical Center, Salisbury, NC, 28144, USA
*These authors contributed equally to this work
Correspondence: Donald A McClain, Wake Forest University School of Medicine, 1 Medical Center Boulevard, Winston-Salem, NC, 27157, USA, Email [email protected]
Purpose: Action of metformin, the preferred pharmacologic treatment for type 2 diabetes (T2D), remains incompletely understood. Metformin induces an iron starvation response in yeast, suggesting tissue iron might be related to metformin responsiveness. We therefore examined the effects of different levels of tissue iron on metformin action.
Subjects and Methods: We examined glycemic responses to metformin and effects on downstream targets of metformin in mice on diabetogenic diets with different iron contents and performed a retrospective study of metformin effectiveness as a function of serum ferritin, a reliable marker of tissue iron, in human patients after initiation of metformin therapy.
Results: Metformin provided the most glycemic benefit to mice on the normal-iron diet, compared to high or low iron. The low-iron diet itself provided glycemic benefit, and on low iron, metformin provided no additional benefit. These results were parallelled by effects of dietary iron on downstream targets of metformin action, including AMP-dependent kinase and glycerol-3-phosphate dehydrogenase 2. Increased protein modification by O-linked N-acetylglucosamine (O-GlcNAc) mimicked lower iron levels, abrogated the effect of high iron, and resulted in smaller relative metformin responses on glycemia and downstream reporters. Humans with higher or lower levels of the iron biomarker ferritin also exhibited a decreased HbA1c response to metformin.
Conclusion: Dietary iron and serum ferritin predict the glycemic response to metformin in mouse models and humans with T2D. Protein O-GlcNAcylation has effects paralleling low iron and may play a role in mediating these interactions.
Keywords: glucose tolerance, hemoglobinA1c, ferritin, O-linked-N-acetyl glucosamine
Introduction
Metformin is the first-line treatment for type 2 diabetes (T2D), with a strong record of safety and efficacy.1 30–40% of patients treated with metformin, however, can be classified as “non-responders”.2 Thus, knowledge of the specific factors influencing metformin action and responsiveness is important to maximizing the benefits of metformin. Metformin inhibits hepatic gluconeogenesis, yet its precise molecular target remains controversial.3 Plausible cases have been made for, among others, inhibition of mitochondrial complex I,4 complex IV,5 activation of AMP-dependent kinase (AMPK),6 and inhibition of mitochondrial glycerol-3-phosphate dehydrogenase 2 (GPD2).7 Each hypothesis has been challenged: For example, metformin affects hepatic gluconeogenesis in AMPK knockout mice,8 some studies have used suprapharmacologic doses of the drug that may lead to “off-target” effects,9 and inhibition of GPD2 is not universally observed.10
High tissue iron, manifest as elevated serum ferritin levels, is a recognized risk factor for diabetes.11–14 Conversely, an unbiased study in yeast demonstrated that the cellular response to metformin resembles that of iron starvation.15 Although there is no canonical “iron starvation response” in mammals that is completely analogous to that seen in yeast, individual aspects of the response in yeast (eg effects on mTOR, DNA repair, and single carbon metabolism, see Discussion) are also observed in mouse and human cells and tissues deficient in iron. We therefore hypothesized that iron status might predict metformin responsiveness in a bimodal fashion. High tissue iron might overwhelm the ability of metformin to induce the iron starvation response, resulting in impaired pharmacologic responsiveness, while also resulting in direct oxidative damage to insulin-producing β-cells.11,12 Tissue iron levels low enough to induce responses that might mimic analogous aspects of the yeast iron starvation response in mammals, on the other hand, might mimic metformin action and at the same time lead to a decrease in the additive response to the drug. We tested this hypothesis in mouse models and in a retrospective chart review of electronic health records of patients initiating metformin therapy.
As stated above, the mechanism of metformin action remains controversial. While there are data to suggest specific molecular targets such as GPD2 and AMPK, metformin exerts diverse effects on multiple pathways and in multiple conditions other than diabetes including metabolism associated steatohepatitis (MASH),16 Parkinson’s and Alzheimer’s diseases,17 colon/breast cancer,18 and cardiovascular disease.19 One possible explanation for the diversity in responses to metformin is that it might act upstream of more than one signaling pathway, for example, in a pathway regulating multiple proteins or genes such as a posttranslational protein modification. The antidiabetic effects of iron, likewise, are mediated by multiple pathways including AMPK, sirtuins, mitochondrial function, hypoxia sensing, and by the activity of several transcription factors that are central to metabolic regulation, including cAMP response element binding protein (CREB), forkhead box O1 (FOXO1), the peroxisome proliferator activated receptors (PPAR), and the PPARγ coactivator 1α (PGC-1α).20–23 These proteins are highly regulated by multiple inputs, but they all share being regulated by protein modification by O-linked N-acetyl glucosamine (O-GlcNAc), a widespread and pleiotropic nutrient sensing pathway.24 In the case of CREB, the critical step in iron-responsive regulation of leptin is mediated directly by O-GlcNAc.21 We therefore tested if manipulation of this pathway would also affect iron and metformin responses.
Materials and Methods
Experimental Design
To study effects of iron on metformin responsiveness, we employed mice on three levels of iron that lead to phenotypes consistent with the broad range of normal tissue iron.25 Diabetes was induced by a so-called “fast-food” (FF) diet,26 and the mice were treated or not with metformin. Effects of altered levels of protein O-GlcNAc were studied in mice with heterozygous deletion targeted to liver of the only enzyme that removes O-GlcNAc from proteins, OGA. Glycemia, as well as various downstream markers of metformin action, were analyzed to determine the interactions among iron and O-GlcNAc modification on the therapeutic response to metformin. Finally, to demonstrate relevance of these findings to human type 2 diabetes, we performed a retrospective chart review of the effects of initiation of metformin in individuals with diabetes who also had prior determination of serum ferritin, a marker of tissue iron stores.
Experimental Animals
ARRIVE guidelines were adhered to. Numbers of test animals (individual mice) are described for each study. Data from a total of 167 mice were included, and sample sizes were calculated from the variances observed in the past for the individual assays, with predicted effect sizes of 10–20% (eg 20% for metformin effects on fasting glucose) based on the literature. Mice were removed if the veterinarian or animal technician detected signs of illness or unexpected weight loss of >10%. In all cases, when this occurred it was before the final analysis so specific data points were not affected. Mice were assigned to treatment groups randomly. The order of assays was kept consistent to minimize variation. The studies were not blinded because labeling of treatment groups was required to ensure adherence to the treatments (eg metformin in the water). Euthanasia was by CO2 inhalation. Animals were maintained at ambient temperature, 20°C with a 12 hr light/dark cycle. Animal studies and procedures were approved by the Wake Forest Institutional Animal Care and Use Committee (protocol A23-047).
Male and female 6 week old C57BL/6J mice (Jackson Laboratory) were fed a normal laboratory diet for 3 months followed by a “fast-food” (FF) diet26 containing either 4 mg/kg, 35mg/kg or 2000mg/kg elemental iron (Harlan Teklad TD 140525, TD.140526 and TD.140527) for 12 weeks (N=10-37/group). 35 mg/kg is widely used in “normal” mouse chow and will be referred to as “normal” iron. FF diets contained 49.2% carbohydrate, 21.2% fat, and 17.3% protein by weight. While on the FF diet, although not while being treated with metformin, fructose (23.1 g/L) and glucose (18.1 g/L) were added to the drinking water. After 12 weeks on the diets, half of the mice were randomized to receive 8 weeks of metformin treatment, delivered in their water at a dose of 300mg/kg/day based on measured water consumption. We noted no changes in fluid intake among the different iron diets or as a function of metformin treatment. During the treatment period body weight and 6hr fasting glucose were determined weekly.
Analyses: Western Blotting
Mouse livers were homogenized with radioimmunoprecipitation assay lysis buffer (Thermo Scientific) and protein concentrations were determined using Pierce BCA protein assay kit (Thermo Scientific). Proteins were then separated by 4–15% SDS-PAGE and transferred to a polyvinylidene difluoride membrane. Membranes were blocked with TBST containing 5% (w/v) nonfat dried milk, or BSA for detection of phosphorylated proteins, for 1 h at room temperature. Membranes were incubated with primary antibody overnight at 4 °C. Membranes were then washed with TBST and incubated with secondary antibody for 1 h at room temperature. Protein signal was detected using SuperSignal West Femto Maximum Sensitivity Substrate (Thermo Scientific, 34096). Band intensities were quantified using ImageJ, with β-actin as loading control. All groups were normalized to the control group (placebo-treated C57BL/6J on the FF35mg diet).
Antibodies
Antibodies used from Cell Signaling Technology include: OGT (24083; 1:1000), β-actin (3700; 1:1000), Acetyl-CoA Carboxylase 1 (4190; 1:200), Phospho-Acetyl-CoA Carboxylase (Ser79; 11,818; 1:200), HRP-linked Anti-mouse IgG (7076; 1:5000), and HRP-linked Anti-rabbit IgG (7074; 1:5000). Additional antibodies include O-linked N-acetylglucosamine (O-GlcNAc; Thermo Scientific; MA1-072; 1:1000) and MGEA5 (OGA; Abcam; ab197389; 1:500).
GPD2 Activity
GPD2 activity was measured in mouse liver mitochondrial lysates using a Glycerol-3-Phosphate Dehydrogenase (GPDH) assay kit (University at Buffalo Biomedical Research Service Center; E-122) according to the manufacturer’s instructions. Samples were normalized to protein and groups were then normalized to the control group.
OGA Activity
OGA activities were measured in mouse liver whole-cell lysates using an O-GlcNAcase assay kit (University at Buffalo Biomedical Research Service Center; E-130) according to the manufacturer’s instructions. Samples were normalized to protein and groups were then normalized to the control group.
Lactate Levels and NAD+/NADH
Mouse liver whole-cell lysates were deproteinated using 10kD spin columns (Abcam; ab93349). Samples were then measured for lactate using an L-lactate assay kit (University at Buffalo Biomedical Research Service Center; A-108) according to the manufacturer’s instructions. The same deproteinated samples were assayed using a NAD+/NADH assay kit (University at Buffalo Biomedical Research Service Center; A-118) according to the manufacturer’s instructions. Samples were normalized to protein and groups were then normalized to the control group.
Electronic Health Record (EHR) Search Strategy
With approval from the Wake Forest IRB (IRB00057339), we identified adults with T2D treated with metformin between 1/1/2013 to 1/1/2019 at Wake Forest Baptist Health clinics through an i2b2 data request. Inclusion criteria included age ≥18 years with ICD-9 or −10 diagnoses of T2D, HbA1c≥6.5% prior to initiation of treatment, and treatment with no other antidiabetic agents. We further required patients to have a serum ferritin level determined within 6 months prior to the first metformin prescription, and who had HbA1c determinations prior to and 6–12 months after metformin initiation. We excluded individuals on glucocorticoid therapy or with conditions known to raise serum ferritin by virtue of inflammation rather than iron excess, including rheumatoid arthritis, lupus, inflammatory bowel disease, hepatitis C, and active infections.
The criteria initially identified 804 subjects. Individual charts were accessed to determine the actual start date of metformin and to verify that subjects met inclusion criteria. Of those subjects who met inclusion criteria, we were able to determine the definite start date of metformin in 92 subjects. We further excluded 6 subjects who did not tolerate the metformin, 2 whose HbA1c rose in the setting of glucocorticoid treatment, and 1 who never started the metformin.
Statistical Procedures
Results are presented as the mean ± SEM. The significance of variability between groups was determined by 2-way ANOVA with a Tukey post-hoc analysis corrected for multiple comparisons. Data were analyzed with GraphPad Prism software (v.6). For “metformin effectiveness,” we analyzed the difference of the means of the placebo and metformin-treated groups, with the variance of the differences being the sum of the variances divided by the sample sizes. Thus, for the graphs portraying these “effectiveness” data the difference of the means is a single value and hence there are not multiple data points in the “plunger” plots.
Results
Low or High Iron Diets Blunt Metformin Responsiveness in a Mouse Model of T2D
After maintaining wild type (WT) C57BL/6J mice on normal chow for two months, they were then fed a diabetogenic “fast food” (FF) diet (49% carbohydrate, 21% fat)26 with three levels of iron. The mid-level of iron (35 mg iron per kg chow, “normal”) is commonly used in commercial rodent chows. Other cohorts received FF chow containing 4mg/kg, “low”, or 2000 mg/kg, “high”, levels of iron. We recently reported the metabolic and iron phenotypes of mice on these diets.25 The lower iron diet does not result in iron deficiency anemia when animals receive normal chow for two months after weaning. Although the higher iron diet contains ~57 times as much iron compared to normal iron, because of feedback inhibition of gut absorption mediated by hepcidin, and the relatively poor absorption of elemental iron in the diet, it results in an only ~4-fold increase in liver iron,25 a change well within the range seen in normal humans. Thus, these treatments mirror the iron phenotypes of humans across the broad range of normal tissue iron.25
After 12–16 weeks on the FF diets with varying iron, when diabetes begins to manifest, treated mice received 300 mg/kg/day metformin delivered in their drinking water, with assessment of glucose tolerance at the beginning and end of the treatment period and weekly measurement of weight and fasting glucose throughout the period. Overall, both iron (p<0.0001, by 2-way ANOVA) and metformin (p<0.01) treatments had significant effects on the change in fasting glucose values over the course of the metformin vs placebo treatment (Figure 1A). On the “normal” iron diet (35 mg/kg), fasting glucose levels increased by 37.9±5.7 mg/dL in the placebo group but decreased by 3.3±4.4 mg/dL in the metformin-treated group (p<0.01, ANOVA corrected for multiple comparisons). By contrast, on the high iron (2000mg/kg) diet, fasting glucose in the placebo-treated mice increased by a similar amount (1.93±0.38 mmol/L), but metformin had no beneficial effect (1.83±0.44 mmol/L increase, p>0.99 compared to placebo). The values after metformin treatment differed significantly between the 35 and 2000 mg iron diets (p<0.01). On the lower iron diet, placebo-treated mice were protected from diabetes, exhibiting a decrease in glucose (−0.12±0,45 mmol/L, p<0.05 compared to either higher iron diet), and metformin had no significant further effect (−1.11±0.55 mmol/L, p=0.68).
The Effects of Iron on Metformin Action are Related to Fasting Glucose and Not Due to Changes in Weight or Insulin Responsiveness
The absolute levels of fasting glucose at the end of the treatment period (Figure 1B) show a similar pattern to that of the increases in fasting glucose for individual mice: By 2-way ANOVA, the overall effects of both iron and metformin were significant (p<0.0001). Within diets, however, a significant metformin effect to lower fasting glucose was seen only with the mid-level 35 mg/kg iron diet (11.5±0.33 vs 8.5±0.22 mg/dL, p<0.0001) but in neither the lower nor higher iron diet groups (p>0.98 for both). Fasting glucose levels were lower in the lower iron placebo group (177±7 mg/dL) compared to placebo-treated mice on either the 35 mg/kg or the 2000 mg/kg iron diet (p<0.03 and p=0.05, respectively).
The differences in metformin responsiveness were not accounted for by body weight (Figure 1C). As previously reported, body weights show an inverse relation with iron both in rodents25 and humans,27 and the same is true in these cohorts (p<0.0001 by ANOVA). Metformin treatment did not affect weight; however (p=0.24), within each dietary iron group, the weights in the placebo group equaled those in the metformin group (p=0.69 or greater).
Metformin mainly acts by inhibiting hepatic gluconeogenesis, with changes in insulin responsiveness and glucose disposal thought to be a secondary effect related to the improvement in glycemia. Thus, our primary measure in the study shown in Figure 1 was fasting glucose, which is primarily determined by hepatic glucose output.28,29 We also measured the incremental area under the glucose curve (iAUCG) after intraperitoneal glucose tolerance testing. The iAUCG corrects for differences in fasting glucose and therefore is largely a measure of insulin action and insulin secretory capacity. Neither metformin nor iron were related to iAUCG by ANOVA (Figure 1D), although in placebo-treated mice at the highest iron, iAUCG was lower compared to low iron, consistent with the decrease in weight in that group.
To test whether the results might be accounted for by an effect of the diets on absorption or clearance of metformin, we measured plasma metformin levels in the mice on the different diets. They did not differ among the diets (4 mg/kg diet: 23.8±5.0 mg/L; 35 mg/kg: 33.5±9.8 mg/L; 2000 mg/kg: 31.6±11.5 mg/L; N=3/group, p=0.75).
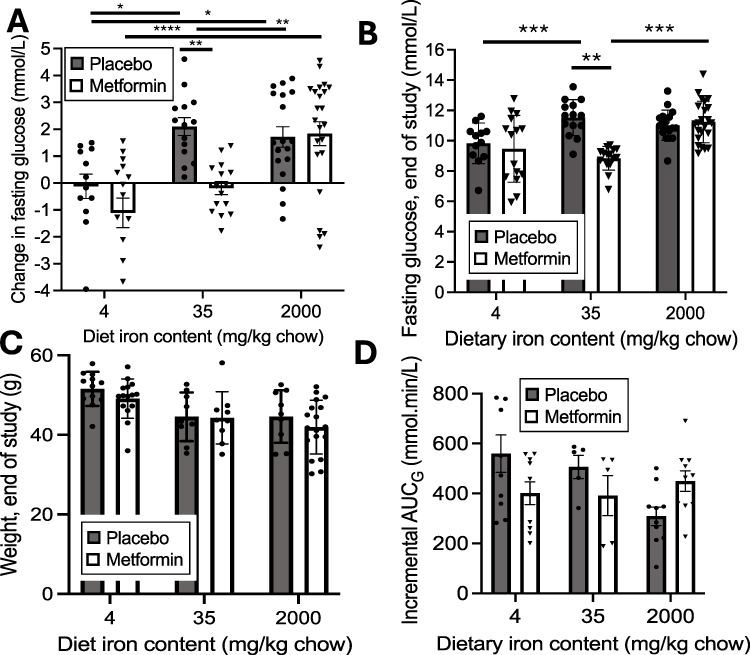 |
Figure 1 Metabolic responses to metformin in mice on a diabetogenic diet containing either lower (4 mg/kg), medium (35mg/kg) or higher (2000 mg/kg) elemental iron, with or without metformin treatment. Mice were treated with the indicated diets for 3–4 months and treated with metformin for the last 7–12 weeks of that period. Within those ranges of treatment times, the duration of diet and metformin treatment had no significant effect on the changes in glucose or metformin response (p=0.21–0.73 within each treatment group). Four independent studies were carried out, two with all six treatment groups (3 dietary iron levels, each ± metformin) and two with at least four groups, each with N>4 for each treatment group, with the combined total N=12-23 for each treatment group. (A) Change in fasting glucose between initiation of metformin and end of the study. (B) Fasting glucose at end of study. (C) Body weights at end of study. (D) Incremental area under the glucose curve (iAUCG) during glucose tolerance testing. Bar graphs show mean ± SEM. For individual comparisons *p<0.05, **p<0.01, ***p<0.001, ****p<0.0001 by ANOVA with Tukey correction for multiple measurements. |
Increased O-GlcNAc Modification of Proteins in Liver Abrogates the Effect of Iron on Metformin Responsiveness
Involvement of modification of proteins by O-GlcNAc in the metabolic effects of iron was suggested by that pathway’s mediation of the effects of iron on transcriptional regulation of leptin.30 To test if O-GlcNAc might also be involved in the interaction of iron and metformin, we repeated the study of metformin action in mice with heterozygous liver-specific deletion of the gene that encodes O-GlcNAcase (OGA, or meningioma expressed antigen 5, Mgea5), the only protein known to remove O-GlcNAc from proteins. Proof of successful heterozygous knockdown (KD) was established by Western blotting revealing decreased OGA protein expression in liver (Figure 2A, left bar graph, p<0.01). The decreased OGA resulted in increased global O-GlcNAc modification of proteins (Figure 2A, center, p<0.001) without a change in the level of the principal O-glycosyltransferase (OGT) (Figure 2A, right). Original blots for Figure 2A are shown in Supplemental Figure 1. Assay of OGA enzyme activity confirmed an ~50% reduction in the OGA KD mice (Figure 2B, p<0.0001) with no effect of iron or metformin.
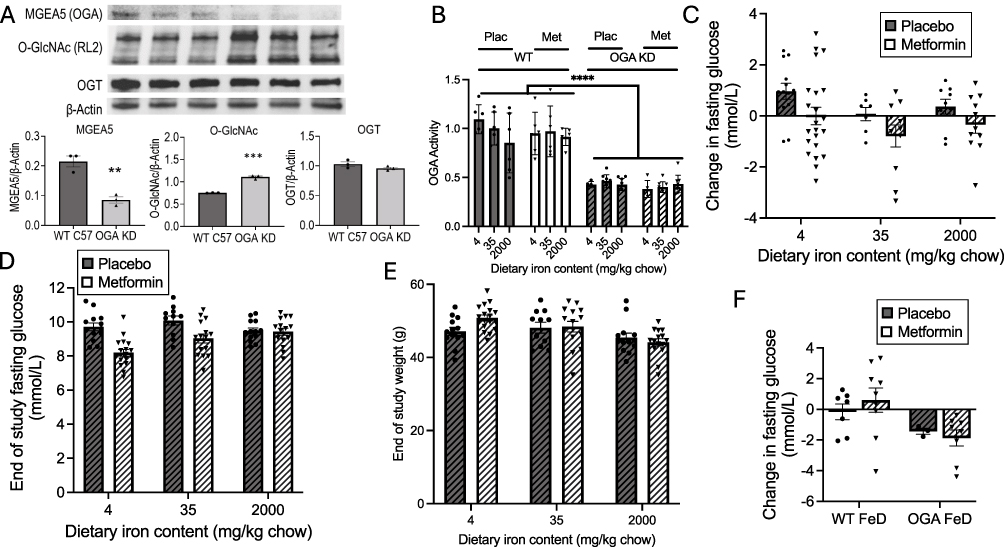 |
Figure 2 Metabolic responses to metformin in mice with heterozygous deletion of the OGA gene (OGA KD) on a diabetogenic diet containing either lower (4 mg/kg), medium (35mg/kg) or higher (2000 mg/kg) elemental iron, with or without metformin treatment. (A) Knockdown of OGA. Liver extracts were Western blotted for OGA (Mgea5), global O-GlcNAc modification, and O-glycosyltransferase (OGT), with band densities normalized to β-actin (N=3 biological replicates). (B) OGA enzyme activity was assayed (N=3 biological replicates each assayed in duplicate in livers of WT and OGA KD mice, treated or not with metformin. (C–E) To investigate glycemic responses to the FF diet ± metformin, mice were treated with the indicated diets with or without metformin as described for Figure 1 for each treatment group. (C) Change in fasting glucose between initiation of metformin and end of the study. (p<0.0001 for metformin effect, p=0.71 for iron effect by 2-way ANOVA). (D) Fasting glucose at end of study. (p=0.0001 for metformin effect by 2-way ANOVA). () Body weights at the end of the study. (p=0.0011 for iron effect by 2-way ANOVA).) Changes in fasting glucose on iron deficient diets. Bar graphs show mean ± SEM. For individual comparisons **p<0.01, ***p<0.001, ****p<0.0001 by ANOVA with Tukey correction for multiple measurement. |
OGA KD mice were fed the different iron diets and treated or not with metformin as described above for the WT mice. The pattern of metformin responsiveness changed markedly compared to the WT mice (Figure 2C; note decreased range of y-axis scale compared to Figure 1A). By 2-way ANOVA the effect of iron on the change in glucose over the treatment period that was significant in the WT mice (Figure 1) lost overall significance: On the 35 mg/kg iron diet the changes in glucose in placebo-treated mice were similar to those observed on the 4 mg/kg (p=0.68) and 2000 mg/kg (p>0.99) diets. Moreover, glucose values in the placebo-treated OGA KD mice did not increase to the same extent as in the WT mice (p<0.05 for all diets combined). For example, in the WT 35 mg/kg iron group on placebo, glucose increased by 2.11±0.32 mmol/L (Figure 1A), whereas the OGA KD mice on the same diet increased by only 0.70±0.34 mmol/L (p<0.01 compared to WT). The magnitude of the overall metformin effect in all groups was less than in the WT mice, and although it was not significant for any of the individual diets, it remained significant for all diets combined (p=0.01 by ANOVA). The difference in the metformin effect was not due to differences in metformin levels between the WT and OGA KD mice (29.6±4.5 and 35.4±12.6 mg/L, respectively, N=9 and 6/group, p=0.63).
The same pattern seen when examining the change in glucose in the OGA KD was also seen in the fasting glucose at the end of the study (Figure 2D): Overall, metformin exerted a significant effect on fasting glucose in the OGA KD mice across all diets (p<0.0001, 2-way ANOVA), but not significantly within any individual diet. The overall effect of iron was lost on the OGA KD (p=0.66 by ANOVA). Metformin decreased end-of-study glucose values in the 4 and 35 mg/kg iron OGA KD groups (p<0.05 for both), but to a lesser degree than the WT mice on those diets (Figure 1B, p=0.02). There was no effect of metformin on the 2000 mg/kg diet (p>0.99). End-of-study fasting glucose concentrations tended to be lower than those observed in the WT mice but not significantly (p=0.12). As was the case for the WT mice, the results are not explained by body weight (Figure 2E): Weights of the OGA KD mice were not different from the WT mice, and like the WT, weight decreased with higher dietary iron (p=0.0011 by ANOVA), though not to the same degree as observed in the WT. Within the iron diet groups, however, weights did not differ between placebo and metformin-treated mice (p=0.71 by ANOVA and p>0.9 for each individual diet).
Overt Iron Deficiency Mimics Metformin and is Not Additive with Metformin
The relationship of metformin effects to iron starvation in yeast15 prompted us to examine the effects of overt iron deficiency on metformin effectiveness in our mouse models. Because of the potential confounding effects of anemia per se on glycemia,31 we present these data as a separate analysis. Mice were therefore fed the 4 mg/kg iron FF diet, but unlike the studies above, the diet was commenced at weaning, resulting in moderate levels of iron deficiency anemia (hemoglobin levels of 7.8±2.1 g/dL, compared to 13.2±1.8 g/dL in animals on sufficient iron, p<0.0001). In the iron-deficient WT mice, fasting glucose did not increase on the FF diet (Figure 2F), and metformin had no further effect. By ANOVA, the effect of genotype (WT vs OGA KD) on the change in glucose over the drug treatment period was significant (p=0.02 by ANOVA) but the metformin effect was lost (p=0.88). Overall, in the OGA KD iron-deficient mice glucose levels decreased during the treatment period compared to the WT (p<0.05 by ANOVA), and the decrease in metformin was significantly greater than observed in the WT mice on metformin (p<0.05).
Metformin Effectiveness as a Function of Iron and O-GlcNAc Levels
To summarize and emphasize the differences between the WT and OGA KD mice, we have combined data from Figures 1A and 2C, for simplicity of presentation limiting the data to that of the mice on “normal” (35 mg/kg) iron compared to high iron (2000 mg/kg) (Figure 3A). Overall, in these two groups, the effects of genotype and metformin are significant (p<0.0001 by 3-way ANOVA). The effect of metformin on glycemia is only significant in the WT mice on 35 mg/kg iron (p=0.0019 by Anova with Tukey’s correction for multiple comparisons). There is no overall effect of iron (p=0.10 by 3-way ANOVA). On high iron, metformin does not affect glycemia, and there is a significant difference in the change in glucose between the WT and OGA KD mice on metformin (Figure 3A, p<0.002).
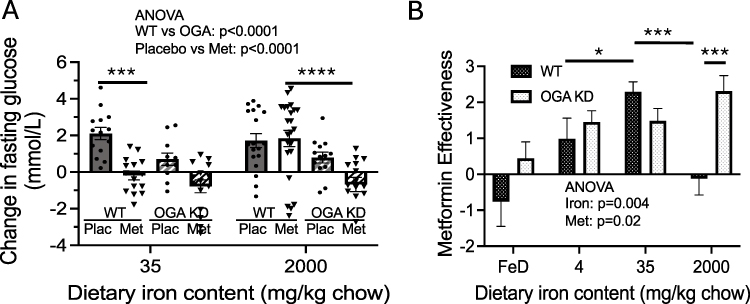 |
Figure 3 Comparison of metabolic effects of metformin in WT and OGA KD mice on diabetogenic diets with differing iron levels. (A) Change in glucose from the beginning to end of the placebo/metformin treatment period in WT vs OGA KD mice, a re-formatting of the data in Figures 1A and 2C to allow direct comparison across the genotypes. (p<0.0001 for metformin effect, p=0.05 for iron effect by 2-way ANOVA). (B) Metformin effectiveness ([average change in fasting glucose in placebo-treated mice] – [average change in fasting glucose in metformin-treated mice]). Bar graphs show mean ± SEM. Note that in this and subsequent figures showing metformin effectiveness we are analyzing the difference of the means of the placebo and metformin-treated groups, with the variance of the differences being. |
We also subtracted the change in fasting glucose in metformin-treated mice from the change in glucose in placebo-treated mice for each diet and genotype of mice, to generate an index of relative “metformin effectiveness” (Figure 3B). (Note that in this and subsequent figures showing metformin effectiveness, we are analyzing the difference of the means of the placebo and metformin-treated groups, with the variance of the differences being the sum of the variances divided by the sample sizes. Thus, for the graphs portraying these data the difference of the means is a single value and hence there are not multiple data points in the “plunger” plots). The overall effects of both iron and OGA KD are significant (p<0.01 and p<0.05 by 2-way ANOVA). Metformin effectiveness is lowest in the iron-deficient mice (p<0.01), consistent with the “iron starvation” hypothesis. For WT mice, maximal effectiveness is seen in the 35 mg/kg (normal) iron diet with substantial falloff in effectiveness at either higher or lower iron (p<0.001 for WT 35 vs 2000 mg/kg and p<0.05 for WT 35 vs 4 mg/kg iron diets). In the OGA KD mice, by contrast, metformin effectiveness is relatively stable across all of the non-deficient iron diets. The difference in metformin effectiveness between WT and OGA KD mice is most pronounced on 2000 mg/kg high iron diet (p<0.001 for OGA KD vs WT). In the OGA KD mice on the 35 mg/kg iron diet, the “metformin effectiveness” is relatively less than that observed in WT, but this is against the background of a smaller increase in fasting glucose in the placebo-treated OGA KD mice (see Figure 2C compared to 1A, p<0.01) and similar end-of-study fasting glucose values in the OGA KD compared to WT (Figures 1B and 2D). Thus, the relative decrease in “metformin effectiveness” in the OGA KD reflects the combination of a metformin-like and a metformin-independent effect of decreased O-GlcNAc on glucose, an effect that is not additive with the effects of metformin (Figure 2B).
Downstream Effects of Metformin on GPD2, Tissue Lactate, pAMPK, and pACC1 are Iron- and O-GlcNAc-Responsive
Among the multiple mediators of metformin action is glycerol-3-phosphate dehydrogenase (GPD), part of the glycerol phosphate shuttle that maintains cytosolic/mitochondrial redox balance through the NAD+/NADH ratio. In fact, the mitochondrial GPD, namely GPD2, was suggested to be a direct binding target of metformin action,9 although later evidence is more consistent with a role for GPD2 as a further downstream mediator.5 We therefore examined the effects of iron, metformin, and O-GlcNAc modulation on GPD2 activity. Consistent with the aforementioned references, metformin did have an overall effect to decrease GPD2 activity (Figure 4A, p<0.0001, 2-way ANOVA), and individual t-testing (corrected for multiple sampling) revealed the effect to be most significant for the “normal” 35 mg iron diet (65% decrease, p<0.0001), less so for the 4 mg iron diet (34% decrease, p<0.05), and not so for the 2000 mg diet (36% decrease, p=NS). In the OGA KD mice (Figure 4B), decreased OGA activity mimicked the effect of metformin to decrease GPD2 on all diets, again demonstrating non-additivity of OGA KD and metformin treatment. OGA KD also eliminated any effect of iron on GPD2 (p=0.61). In placebo-treated OGA KD mice, liver GPD2 activity was lower than that observed in WT mice (Figure 4B, p<0.0001 by two-way ANOVA). We also assessed “metformin effectiveness” (Figure 4C) for changes in GPD2 in both groups as was described above (Figure 3B) for the changes in glucose levels. The effect of metformin in placebo-treated WT mice was maximal on the 35 mg/kg diet and completely lost in the OGA KD mice.
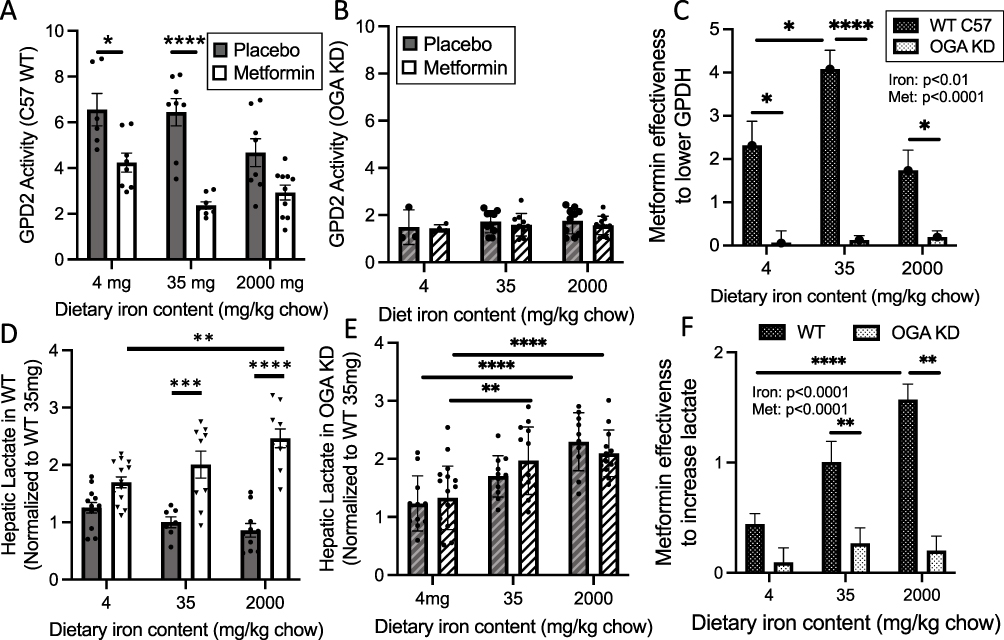 |
Figure 4 Effects of iron, metformin, and O-GlcNAc modification on downstream effects of metformin action mitochondrial glycerol-3-phosphate dehydrogenase (GPD2) activity and hepatic lactate levels. Tissues from mice reported in Figures 1 and 3 were analyzed, using whole liver homogenates for lactate and crude mitochondrial preps for GPD2 activity. (A–C) GPD2 activity. (A) Activity of GPD2 was assessed in wild type C57 mice on various iron diets, with or without metformin treatment. Effects of iron, metformin, and their interaction were all significant by 2-way ANOVA (p<0.01, p<0.0001, and p<0.05, respectively). (B) GPD2 activity in OGA KD mice (p=NS for all comparisons). (C) Metformin effectiveness to lower GPD2 ([average GPD2 activity in placebo-treated mice] – [average GPD2 in metformin-treated mice]) from the data in Panels (A and B) By 2-way ANOVA, overall iron (p<0.01) and metformin (p<0.0001) effects were significant. (D–F) Hepatic lactate levels, normalized by protein and to levels in placebo-treated mice on the 35 mg/kg iron diet. (D) Hepatic lactate levels in WT C57 mice. Effects of metformin were significant by 2-way ANOVA (p<0.0001). (E) Hepatic lactate levels in OGA KD mice. Effects of iron were significant by 2-way ANOVA (p<0.0001). (F) Metformin effectiveness ([average lactate in placebo-treated mice] – [average lactate in metformin-treated mice]) from the data in (D and E). By 2-way ANOVA, overall effects of iron (p<0.0001) and metformin (p<0.0001) were significant. Bar graphs show mean ± SEM. For individual comparisons *p<0.05, **p<0.01, ***p<0.001, ****p<0.0001 by ANOVA with Tukey correction for multiple comparisons. To simplify the presentation, significance is only shown for placebo/metformin comparisons within iron diets, and for placebo/placebo and metformin/metformin comparisons across iron diets. |
Metformin also increases hepatic tissue lactate levels,5 so we examined the effects of metformin, iron and OGA KD on tissue lactate in whole-liver tissue homogenates. In WT mice, metformin increased lactate levels overall (Figure 4D, p<0.0001 by 2-way ANOVA), but in individual comparisons the effect of metformin was not significant in the lower (4 mg/kg) iron diet. Higher iron tended to decrease lactate levels in placebo-treated mice, but the effects were fully reversed by metformin. In the OGA KD mice (Figure 4E), iron increased lactate overall (p<0.0001 by 2-way ANOVA) but the effect of metformin was completely lost (p=0.64). The loss of the metformin effect on lactate levels in the OGA KD mice is also seen in the analysis of “metformin effectiveness” (Figure 4F), as is the loss of metformin effectiveness in the lower iron diet in the WT mice. Unlike the case for metformin’s glucose- and GPD2-lowering effects, however, the effect of metformin on lactate in the WT mice was not abrogated on the higher iron diet, likely due to previously reported independent effects of iron on lactate (see Discussion).
The AMP-dependent kinase pathway has also been identified as one of the downstream targets for metformin action.32 Overall, the effect of iron on AMPK phosphorylation was significant (Figure 5A, p<0.0001 by ANOVA), and the effect of metformin nearly so (p=0.051), although with individual comparisons the effect of metformin was significant only in mice on the “normal” (35 mg/kg) iron diet (p<0.05). A difference in the pattern of iron effects is apparent in the increase in the pAMPK/AMPK ratio at high iron. This, however, is not due to an increase in pAMPK but rather a decrease in AMPK (Figure 5C), with the density of AMPK on the blot, normalized to actin, being 0.93±027 on the lower iron diets compared to 0.43±0.14 on the high iron diet, p=0.02 by t test). The reason for this change is not clear but may be related to changes in O-GlcNAc modification (see Figure 6), AMPK being a known target of that modification.33 In the OGA KD mice, the pattern differed from the other effects of metformin described above. By ANOVA, the effects of iron and metformin are significant (Figure 5B, p<0.05), and the pAMPK/AMPK ratios were higher in the metformin-treated OGA KD mice than in the WT mice (Figure 5B, note increased scale on y-axis, p<0.05). Although there was a trend for stimulation by metformin in the “normal” 35 mg//kg diet, the effect was only significant for the high iron diet (Figure 5B, p<0.001). In addition, as was the case for the WT mice, high iron caused an overall decrease in the absolute level of AMPK normalized to actin (0.89±0.12 compared to 0.43±0.14, p=0.03 by t-test, further suggesting a complex interplay among iron, O-GlcNAc, the AMPK pathway, and likely other independent effects of iron on glycolysis34 as well as other regulators of AMPK. Representative Western blots for AMPK and pAMPK are shown in Figure 5C, with full blots presented as supplemental data (Supplemental Figure 2).
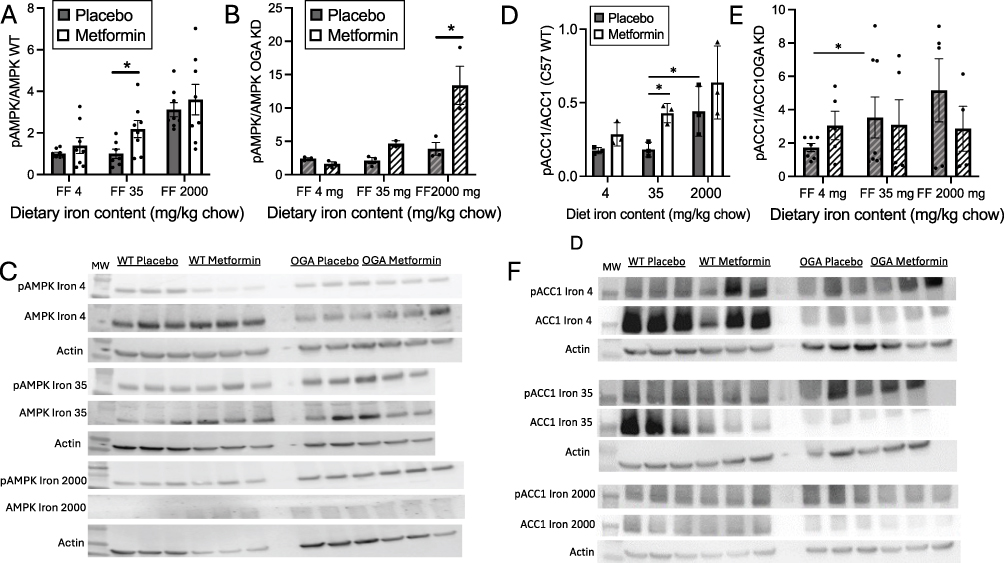 |
Figure 5 Effects of iron, metformin, and O-GlcNAc modification on downstream effectors of metformin action, phosphorylated AMP-dependent kinase (pAMPK) and phosphorylated acetyl coA carboxylase 1 (pACC1). Tissues from mice reported in Figures 1 and 3 were analyzed, using whole homogenates for Western blotting of pAMPK and pACC1 levels, normalized to total AMPK and ACC1. (A) Levels of pAMPK in livers of wild type C57 mice on various iron diets, with or without metformin treatment. Effects of iron and metformin were significant by 2-way ANOVA (p=0.004 and p<0.01 and p<0.05, respectively). (B) Levels of pAMPK in livers of in OGA KD mice on various iron diets, with or without metformin treatment. Effects of iron and metformin were significant by 2-way ANOVA (p=0.004 and p<0.01 and p<0.05, respectively). (C) Representative Western blots of AMPK and pAMPK. (D) Levels of pACC1 in livers of wild type C57 mice on various iron diets, with or without metformin treatment. Effects of iron and metformin were significant by 2-way ANOVA (p=0.004 and p<0.01 and p<0.05, respectively). (E) pACC1 levels in OGA KD mice. Effects of iron (p=0.03) but not metformin were significant by 2-way ANOVA. (F) Representative Western blots for ACC and pACC. Bar graphs show mean ± SEM. For individual comparisons *p<0.05 by ANOVA with Tukey correction for multiple comparisons. To simplify the presentation, significance is only shown for placebo/metformin comparisons within iron diets, and for placebo/placebo and metformin/metformin comparisons across iron diets. |
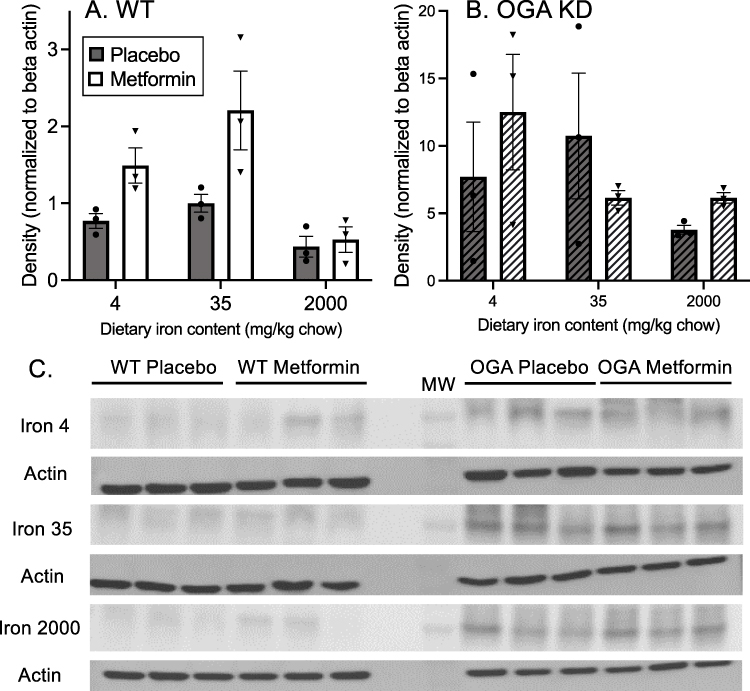 |
Figure 6 Effects of iron and metformin on protein modification by O-GlcNAc. (A) WT mice. All samples of liver extracts were run on a single gel and membrane and Western blotted using an antibody that recognizes O-GlcNAc on multiple proteins. Densitometry was performed using the MW range of 50–250 kDa,36 with only one representative region of the gel shown, and normalized to b-actin. Full gels were submitted as Supplemental data. By 2-way ANOVA, the effects of metformin (p=0.006) and iron (p=0.003) were significant. (B) The same analysis was performed using the OGA KD mice. Neither metformin (p=0.74) nor iron (p=0.27) had a significant effect on O-GlcNAc levels. (C) Densitometric scanning of the O-GlcNAc blots. The region of MW 50–250 kDa was scanned, but only a representative band in that range is shown. The bands shown were cropped and rearranged from a single gel and single blot. |
Another mediator of metformin action and a downstream target of AMPK is acetyl-coA carboxylase (ACC), whose phosphorylation is stimulated by metformin, resulting in decreased ACC activity and increased fatty acid oxidation.35 The degree of ACC1 phosphorylation in WT mice (Figure 5D) is correlated with pAMPK/AMPK (Figure 5A) (r=0.961, p<0.001). In WT mice, metformin had an overall effect to stimulate the ratio of phosphorylated pACC1 to ACC across all levels of dietary iron (Figure 5D, p=0.01 by 2-way ANOVA), although in multivariate analysis the effect was only significant in the mice on the normal (35 mg/kg) iron diet (p<0.05). Higher dietary iron also increased the pACC1/ACC1 ratio in both placebo- and metformin-treated WT mice (Figure 5D, p=0.004 by 2-way ANOVA with multivariate analysis), but metformin did not stimulate compared to placebo on high iron. In the OGA KD mice, the overall effects of metformin and iron on pACC1 were both lost (Figure 5E, p=0.46 and 0.65 by 2-way ANOVA). Specifically, in the OGA KD mice, the values of pAMPK/AMPK were not correlated with pACC1/ACC1 (r=0.066, p=0.89) as was generally the case in the WT mice. Representative Western blots for ACC/pACC are shown in Figure 5F, with full blots presented as supplemental data (Supplemental Figure 3).
The magnitude of the stimulation of pAMPK and pACC by metformin is shown in Table 1. The highest ratio of metformin stimulation is in the WT mice on the normal 35mg/kg iron diet. The exception to the patterns observed in Figure 2 is a high degree of stimulation of pAMPK by metformin in the OGA KD mice on high iron (3.47±2.88), although this did not translate to increased pACC1 in the same mice (0.55±1.34), further evidence for complex co-modulation of the pathway by metformin, O-GlcNAc, and possibly other autonomous effects of high iron (see Discussion).
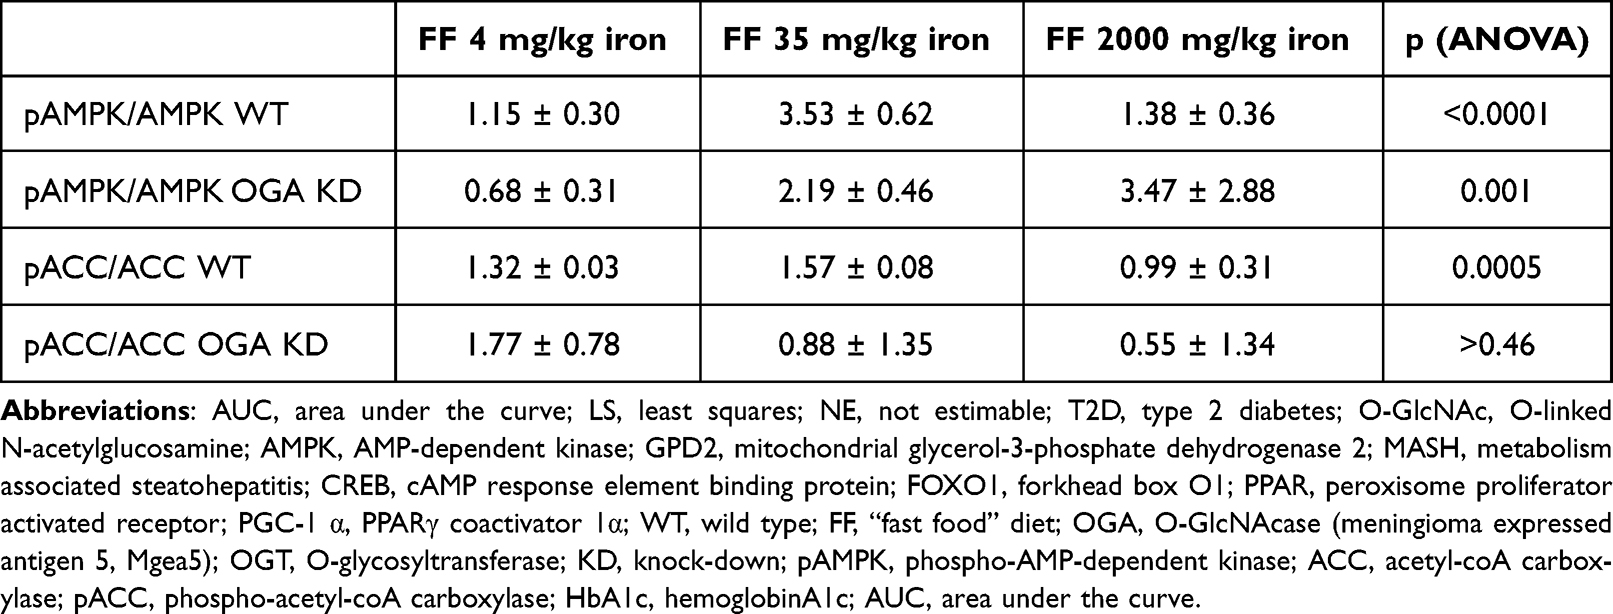 |
Table 1 Fold Effect of Metformin on pAMPK/AMPK and pACC/ACC |
Global Protein O-Linked GlcNAc Levels are Affected by Metformin and Iron
The effect of genetic O-GlcNAc manipulation on glycemic responses to iron and metformin led us to measure global O-GlcNAc modification of proteins in the livers of the mice studied above by Western blotting using an antibody that recognizes O-GlcNAc levels on multiple protein substrates. Density of O-GlcNAc was scanned over the range of 50–250 kDa on the gel, but only a typical band is shown in Figure 6. In WT mice, both iron and metformin affected O-GlcNAc in a manner consistent with its possible mediation of their effects on glycemia. Metformin significantly increased O-GlcNAc (Figure 6A, p=0.006, 2-way ANOVA). Across all iron diets, metformin increased iron by 1.9-fold (p=0.02 by paired t test), with the relative metformin effect being the least in high iron (1.2-fold, p=0.37). The effect of iron on O-GlcNAc was also significant (p=0.003, by 2-way ANOVA). The highest O-GlcNAc levels in WT mice were seen on the 35 mg/kg iron diet, but the individual differences were not significant between diets. In the OGA KD mice the O-GlcNAc levels were higher than those seen in the WT mice (Figure 6B, note different x-axis scale, p<0.0001 by t-test), but by 2-way ANOVA neither the effects of metformin (p=0.74) nor iron (p=0.27) were significant. Representative Western blots for O-GlcNAc and the β-actin used to normalize are shown in Figure 6C, with full blots presented as supplemental data (Supplemental Figure 4).
The inconsistency of increased phosphorylation of AMPK and the lack of increased activity to phosphorylate ACC1, combined with the known effect of O-glycosylation on AMPK activity prompted us to attempt to measure that modification on AMPK, but either with immunoprecipitation of AMPK followed by blotting for O-GlcNAc, or vice versa, we were unable to visualize modified AMPK.
Human Serum Ferritin Levels Predict Metformin Responsiveness
To determine if our results in mice were seen in human responsiveness to metformin, we performed a “proof of concept” retrospective analysis of electronic health records of adults with T2D in the Wake Forest Baptist Health system who were treated with metformin as monotherapy and who had undergone measurements of iron status (serum ferritin) prior to the start of metformin. Ferritin is in general a reliable indicator of tissue iron levels both in normal humans and in those with significant pathology such as MASH or T2D (see Discussion). In 83 cases, we were able to confirm by manual review of notes the start date of the drug, that the drug was tolerated and continued, and that they met inclusion criteria described in the Methods. The demographic characteristics of the subjects were: Male (N=36, 43%), female (N=47, 57%), self-identified as white (N=53, 65%), African-American (N=23, 26%), or Hispanic (N=7, 9%). Average age at initiation of metformin was 59.4±1.3 years.
The relationship between serum ferritin values and the change in HbA1c within the first year after metformin initiation is best fit with a polynomial curve, with declines in optimal metformin responsiveness both above and below an optimal ferritin level of ~125 ng/mL (Figure 7A, r2=0.1174, N=83, p=0.0015). The same relation is seen when outlier ferritin values are excluded and only those with normal range ferritin (adult males, 30–400 ng/mL, adult females 15–150 ng/mL) are considered (r=0.332, N=54, p=0.0022, not shown).
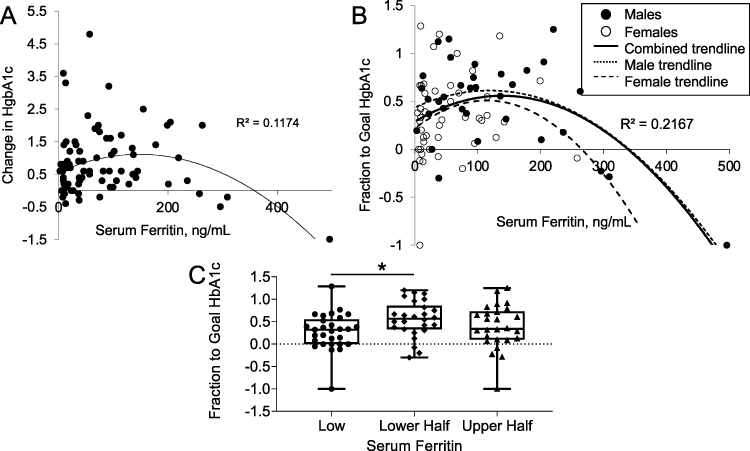 |
Figure 7 Relation of serum ferritin to metformin responsiveness in humans. (A) Response of HbA1c (% decrease) to metformin as a function of serum ferritin ng/mL (r=0.343, N=83, p=0.0015). Negative values represent an increase in HbA1c. (B) Response of HbA1c to metformin expressed as fractional improvement in HbA1c to a normal level of 5.7%. Negative values represent worsening of HbA1c, and values of greater than one represent responses to levels below 5.7% (see Methods). For all subjects, r=0.466, N=83, p<0.0001. Separate trendlines are shown for males (N=37, r=0.466, p=0.0003) and females (N=46, r=0.253, p=0.08). (C) Metformin responses in the groups with below normal ferritin compared to lower and upper half of normal ferritin. *p<0.05. |
There was a trend toward a positive relationship between ferritin and HbA1c prior to metformin therapy, consistent with large epidemiologic studies linking iron with diabetes37 (r=0.19, p=0.12, not shown). Thus, those with high ferritin tend to start with higher HbA1c values, and therefore have the potential to respond to metformin with greater changes in HbA1c. This was the case: The starting HbA1c was positively correlated with the change in HbA1c after metformin therapy (r=0.61, p<0.0001). To correct for this bias, we normalized the change in HbA1c after metformin therapy to the degree to which they reached a normal HbA1c of 5.7% (“fraction to goal HbA1c” = [HbA1cpretreatment - HbA1cposttreatment]/[HbA1cpretreatment – 5.7]). This measure was independent of the starting HbA1c (r=0.03, p=0.79), and using it as the dependent variable strengthened the relationship between ferritin and metformin responsiveness (Figure 7B, r2=0.217, N=83, p<0.0001). The same relationship was true using a goal HbA1c at the nondiabetic threshold of 6.4% (p=0.0006, not shown). Thus, the same “inverted U” responsiveness to metformin as was observed in the mice on different levels of dietary iron were also seen in humans as a function of ferritin, a reliable measure of tissue iron in humans. Females had lower ferritin values than males (52.1±8.2 v 111.8±14.5 ng/mL, p<0.0001), but each gender had the same relative relationship of ferritin to metformin responsiveness (Figure 7B). The relationship was significant in males (N=37, r=0.466, p=0.0003), but with their narrower range of ferritin values, only suggestive in females, (N=46, r=0.253, p=0.08). Overall, the fraction to goal HgbA1c was higher in those in the lower half of normal serum ferritin compared to those with below normal ferritin (Figure 7C, p<0.05). Those in the lower half of normal also trended to improve more than those with upper half of ferritin values (p=0.18).
Typically, clinical trials have observed a decrease in HbA1c of approximately 0.5–1 unit with metformin monotherapy at maximal doses (eg38). This decrease is roughly equivalent to an ~40% response in terms of the “fraction to goal HbA1c” in Figure 7B, namely a decrease in HbA1c from 9.0 to 8.0 or from 8.0 to 7.4, using the goal of a nondiabetic HbA1c of 6.4. 34% of the current cohort failed to reach that threshold, a nonresponse rate similar to that reported in the literature for metformin.2 Using this definition of response/nonresponse, 26 of 28 (93%) non-responders had serum ferritin levels <50 (below the normal limit for males) or >125 mg/mL (above the “optimal” ferritin determined in Figure 7B), whereas only 2 of 28 (7%) non-responders had an intermediate serum ferritin level (p=0.03 by chi square).
Discussion
The hypothesis that tissue iron levels would affect metformin responsiveness was based on two findings: 1) Metformin induces a pleiotropic “iron starvation response” in yeast15 and 2) iron is an important contributor to diabetes risk.11 Here, we report that mice on a “fast food” (FF) high fat, diabetogenic diet with a mid-normal level of dietary iron (35 mg/kg chow) responded well to metformin, which largely prevented the increase in fasting glucose seen on the FF diet. The beneficial effect of metformin was completely abolished, however, in mice on a higher iron diet (2000 mg/kg chow). Low-normal or overtly iron deficient diets, conversely, mimicked the effects of metformin, namely decreasing the effect of the fast-food diet to increase fasting glucose. Furthermore, this effect was not additive with metformin, suggesting that they may share mechanistic pathways. The response to low iron in higher, multi-tissue organisms is more complex than in yeast, and is tissue-specific, so there is no universal or canonical “iron starvation response” across tissues. Nevertheless, our findings are consistent with the hypothesis that with relative iron overload, the ability of metformin to induce elements of a metabolic response to low iron is overwhelmed by the high tissue iron levels. Conversely, low iron independently initiates elements of that response, mimicking metformin and resulting in a decreased additional effect of metformin on glycemia.
An important issue in dissecting the effects of metformin in animal and tissue culture models has been the potential to induce “off target” effects with suprapharmacologic dosing. Our mouse study employed a dose of 300 mg/kg. Although ~10-fold higher than the dose used in humans, because of higher clearance rates, this dose results in blood concentrations comparable to those seen in humans.39
Prior work on the mechanisms by which iron affects metabolic signaling in adipocytes identified O-linked N-acetyl glucosamine modification of proteins as one mechanism, and the principal one by which iron affects leptin levels.22 O-GlcNAc is a nutrient sensing pathway that signals some of the adaptive responses to excess nutrients (e.g increased insulin secretion, enhanced glycogen storage) that over time become maladaptive, mirroring the natural history of type 2 diabetes resulting in insulin resistance, obesity, and impaired insulin secretion.40–42 This prompted testing the effects of genetic manipulation of the O-GlcNAc pathway on metformin responsiveness. We were able to show that liver-specific heterozygous deletion of O-GlcNAcase (OGA), the single enzyme that removes O-GlcNAc from proteins, increases hepatic O-GlcNAc levels, mimics the effects of metformin on glycemia, and abrogates the effects of high iron. Importantly, for most of our observed effects, increasing O-GlcNAc is not additive with metformin in affecting glycemia and metformin downstream targets.
The O-GlcNAc pathway is an attractive candidate for being one of the pathways involved in this integratory regulation. It is a pleiotropic regulator of metabolism that affects most of the mediators and effects of metformin studied herein through modification of enzymes and transcription factors that regulate glucose metabolism.43 For example, increased lactate production is a hallmark of metformin action, and increased O-glycosylation of phosphoglycerate kinase 1 increases its activity and drives lactate production.44 O-GlcNAc modification of multiple targets also drives much of the observed “Warburg effect” in cancers.45,46 Furthermore, O-GlcNAc exhibits inverted U-shaped responsiveness that is consistent with a true homeostatic pathway whose purpose is to maintain levels of metabolites or metabolic activity that are neither too high nor too low. For example, it is beneficial to temper hepatic glycogen synthesis in situations of high glucose (to prevent over-accumulation of glycogen) but also when glucose availability is low (to preserve glucose for fuel availability), and O-GlcNAc modification inhibits glycogen synthase in both high and low glucose.47–49 This inverted U-shaped curve was also observed in the current study in the relation of iron-dependence of overall O-GlcNAc modification (Figure 6). The fact that the O-GlcNAc sensing mechanism is linked to iron availability is also consistent with the tight coupling of iron and metabolic activity that has been highly evolutionary conserved.50 The broad range of substrates for O-glycosylation and its pleiotropic actions to alter intrinsic enzyme activity, protein stability, subcellular targeting, for example, mean that any single substrate will likely not explain the complex overall effects observed. Likewise, iron exerts its actions on metabolism through multiple pathways,14 so the interactions of iron, metformin and O-GlcNAc on glycemia represent an integration of many individual effects that is neither monotonic nor the result of a single sequential pathway.
Measurement of downstream effects of metformin other than glycemia in the mice with increased O-GlcNAc modification driven by heterozygous deletion of OGA, notably on GPD2 activity, hepatic tissue lactate levels, pAMPK and pACC1, are generally consistent with interactive effects of iron and increased O-GlcNAc levels on metformin action. Specifically, in the OGA KD mice there is less of a metformin effect at low iron, and decreased effects of metformin and iron overall. O-GlcNAc modification is involved in almost all the signaling pathways mentioned above, including regulation of AMPK/ACC and GPD2.51,52 The effects of iron and O-GlcNAc, however, are not completely parallel for each of these effects of metformin. For example, effects of metformin on lactate and pACC1 are evident on the higher iron diet that antagonized the effect of metformin on fasting glucose and GPD2. These results are, however, consistent with our previous observations of independent effects of high iron on whole-body lactate production in previous models of elevated tissue iron.53 Thus, the lack of completely parallel effects of iron, O-GlcNAc and metformin is not surprising given the complexity of the multiple systems that feed into regulating these aspects of metabolism. Activity and phosphorylation of ACC, for example, are affected by numerous regulators including AMPK, protein kinase A, protein phosphatase 2A, allosteric effects, and others, each of which are in turn regulated through other pathways, so the lack of a simple 1:1 correspondence of the effects of iron and O-GlcNAc across all these measures of metformin action would not necessarily be expected. Given the pleiotropic effects of iron in multiple tissues,14 it is therefore likely that many aspects of metabolism that are impinged upon by metformin will be overshadowed by effects of high iron in the same or other tissues that may be mediated by different pathways. High iron, for example, will activate oxidant stress pathways that may be independent of the pathways that affect metformin action, and low iron also activates hypoxia sensing pathways54 that themselves also feed into O-GlcNAc signaling and regulation of glycolysis.46,55
The idea of a pleiotropic upstream regulator (such as O-GlcNAc) mediating aspects of metformin action has implications for the controversy surrounding its molecular mechanism. For example, with a multitargeted mode of action, even if metformin did affect AMPK,8 it could still work through other pathways to exert antidiabetic actions, perhaps explaining preserved metformin action in AMPK and/or LKB1 knockout models (eg8). Other proposed mediators of metformin action—mitochondrial function, glycolytic pathways, and transcriptional regulation of gluconeogenesis, for example—are also regulated by iron and are targets of O-GlcNAcylation.
Although for all the above reasons we believe the O-GlcNAc pathway is a plausible mediator of at least some effects of metformin, it is important to point out that in this body of work, we were unable to show a direct relationship between O-GlcNAc modification of any specific target with metformin action. Part of this problem is related to the fact that the target of metformin action itself is not known. Our work, however, shows interactions among iron, metformin, and O-GlcNAcylation that are worth pursuing further.
To correlate the findings in mice with metformin effects in humans, we performed a retrospective review of the electronic health records of individuals on whom we could verify a start date for metformin therapy and on whom we had laboratory data for pre- and post-treatment HbA1c and pre-treatment ferritin, a surrogate but generally reliable measure of tissue iron. Consistent with the hypothesis and the data from the mouse model, humans with either high or subnormal levels of serum ferritin respond less well to metformin. Our analysis of metformin responders and non-responders suggests that a significant portion of metformin non-responsiveness (>90% in our proof-of-concept retrospective analysis, Figure 7) is related to low or high levels of ferritin. We saw no difference between males and females in the overall relationship between metformin responsiveness and serum ferritin, although females did have lower average ferritin. It should be pointed out, however, that our results show only 12–22% of the variance in metformin responsiveness is accounted for by iron. Other factors such as weight, duration of diabetes, residual insulin secretory capacity, the gut microbiome and many others also play roles.
The detrimental effects of excess iron for diabetes risk were first recognized in diseases of pathologic iron overload, but recently it has become clear that the risk for T2D also increases in the general population through the entire normal range of serum ferritin, a marker of tissue iron stores (eg37). This relationship is seen in different ethnicities,37 gestational diabetes,56 and prediabetes.57 Furthermore, in small studies iron reduction is sufficient to improve glycemia in human T2D (eg58), suggesting a causal relationship. As in the studies cited, we also used ferritin as a surrogate marker for tissue iron stores in the humans. Serum ferritin can rise in acute inflammation, but in an epidemiologic study the diabetes risk associated with high ferritin was not accounted for by serum inflammatory markers but rather by increased iron intake, either through diet (largely red meat) or nutritional supplements.59 Even in serious inflammatory conditions such as biopsy-proven metabolism-associated steatohepatitis, ferritin is more closely related to liver iron than to markers of inflammation.60 Thus, there is strong evidence that the association of diabetes with ferritin reflects its association with tissue iron. The most compelling support for ferritin representing tissue iron in inducing metformin insensitivity is the fact that we could reproduce impaired metformin responsiveness in a mouse model simply by feeding a higher iron diet.
Our work on iron and diabetes risk has revealed multiple mechanisms by which iron contributes to diabetes by affecting B-cell function,61 insulin resistance,20 fuel choice,62 and the circadian rhythm of hepatic gluconeogenesis.21 These effects are mediated by a diversity of transcription factors (FoxO1, CREB, PGC-1α) and enzymes (sirtuins, AMPK, mTOR), consistent with the hypothesis that the effects of metformin are initiated by an upstream regulatory system with pleiotropic manifestations. This pleiotropy could also explain reported benefits of metformin in conditions as diverse as cancer, heart failure, and aging.
The metabolic response to iron insufficiency and metformin seen in yeast are functionally analogous to effects of metformin seen in the liver of higher organisms, including effects not only on glycolysis but also on pathways mediating growth, DNA remodeling, and folate/B12/single-carbon metabolism, all of which are affected by iron deficiency63–65 and have also been associated with metformin treatment in humans.66–68 As pointed out above, many of these responses also parallel some manifestations of the “Warburg effect” in cancer cells, including decreased mitochondrial oxidation, increased glycolytic flux, and effects of cell growth that are mediated to a significant degree by O-GlcNAcylation.55 These parallels argue for a common upstream mediator in yeast and mammals that affects several downstream signaling pathways. The key regulator of the iron starvation response in yeast (Aft1p), however, has no clear human orthologue. Furthermore, although yeast have orthologues to the genes involved in O-glycosylation, actual O-GlcNAc modification is not seen in yeast. Thus, our current results do not identify a specific molecular target of metformin; we were unable, for example, to show direct effects of metformin or iron in vitro on activities of the enzymes regulating O-glycosylation, OGA and OGT (not shown). One interesting possibility is that metformin does not, like most drugs, have a specific protein target, which would also be consistent with its relatively high dosing and extraordinarily broad host range of action including plants.69
Conclusion
We have shown that metformin action in mice is modulated by tissue iron stores and by the pleiotropic metabolic regulator, protein modification by O-linked GlcNAc. An overarching hypothesis consistent with these results is that metformin and insufficient iron decrease mitochondrial energy production through multiple mechanisms (Figure 8). Part of the regulatory response to this perceived “energy emergency” includes alterations in O-GlcNAc modification of proteins that enhance glycolytic pathways to support a shift away from mitochondrial fuel oxidation. Note that O-glycosylation may be directly affected by dietary iron and/or metformin but will also respond to changes in fuel and energy availability. This is clearly an over simplification of the multiple inputs that regulate fuel metabolism. For example, our prior work has also shown that at least some of the effects of low iron are also signaled by the hypoxia sensing pathway,54 and low tissue oxygen and activation of the hypoxia pathway share many of the effects initiated by low iron and metformin, for example, limiting oxidative metabolism.70 Further elucidation of the interactions among all of these pathways is therefore potentially important, for example, in identifying new targets for treating diabetes. Our results also suggest the need for clinical trials to test modulating iron stores to optimize response to metformin, a drug that, while extremely safe, effective, and inexpensive, is still not sufficient to allow a majority of patients taking it as monotherapy to reach glycemic goals.
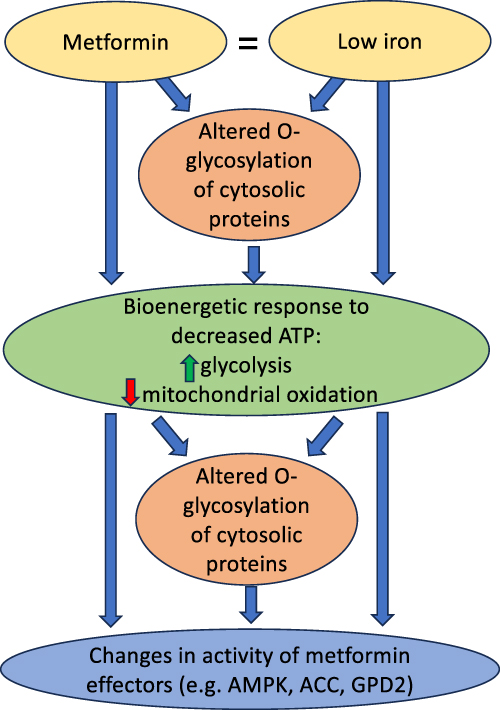 |
Figure 8 Summary of postulated mechanisms linking metformin and iron. We postulate that metformin induces a response similar to low iron, including changes in fuel oxidation and glycolysis that limit cellular energy stores. Altered O-glycosylation, induced directly by metformin and the relative lack of iron, and/or by the changes in the cellular energy state, in turn feed into the modification of metformin effectors. The final effects are therefore complex integrations of multiple signals. AMPK, for example, is affected not only by O-glycosylation, but also directly by changes in AMP/ATP ratios as well as by other signal transduction pathways. |
Study Approval
Animal studies and procedures were approved by the Wake Forest Institutional Animal Care and Use Committee. Human studies complied with the Declaration of Helsinki and were approved by the Wake Forest Institutional Review Board (IRB00057339). Written consent was waived for the deidentified chart review.
Data Sharing Statement
The datasets generated during and/or analyzed during the current study are available from the corresponding author upon reasonable request.
Author Contributions
AVH: Conceptualization, Methodology, Investigation, Writing – review & editing. COU: Conceptualization, Investigation, Supervision, Writing – original draft, Writing – review & editing. SS: Methodology, Writing – review & editing. SJ: Investigation, Writing – review & editing. HB-P: Investigation, Writing – review & editing. FRL: Conceptualization, Methodology, Investigation, Visualization, Supervision, Writing – original draft, Writing – review & editing. DAM: Conceptualization, Methodology, Visualization, Supervision, Writing – original draft, Writing – review & editing.
All authors gave final approval of the version to be published; have agreed on the journal to which the article has been submitted; and agreed to be accountable for all aspects of the work.
Funding
National Institutes of Health grant 5 R01DK 119913 (DAM), National Institutes of Health grant 5 UL1TR001420 (DAM), National Institutes of Health grant 1P30DK12472 (DAM), United States Veterans Administration Research Service 2I01 BX001140 (DAM).
Disclosure
The author(s) report no conflicts of interest in this work.
References
1. Inzucchi SE, Bergenstal RM, Buse JB, et al. Management of hyperglycemia in type 2 diabetes, 2015: a patient-centered approach: update to a position statement of the American diabetes association and the European association for the study of diabetes. Diabetes Care. 2015;38(1):140–19. doi:10.2337/dc14-2441
2. Cook MN, Girman CJ, Stein PP, Alexander CM. Initial monotherapy with either metformin or sulphonylureas often fails to achieve or maintain current glycaemic goals in patients with type 2 diabetes in UK primary care. Diabet Med. 2007;24(4):350–358. doi:10.1111/j.1464-5491.2007.02078.x
3. Foretz M, Guigas B, Viollet B. Understanding the glucoregulatory mechanisms of metformin in type 2 diabetes mellitus. Nat Rev Endocrinol. 2019;15(10):569–589. doi:10.1038/s41574-019-0242-2
4. El-Mir M-Y, Nogueira V, Fontaine E, Averet N, Rigoulet M, Leverve X. Dimethylbiguanide inhibits cell respiration via an indirect effect targeted on the respiratory chain complex I. J Biol Chem. 2000;275(1):223–228. doi:10.1074/jbc.275.1.223
5. LaMoia TE, Butrico GM, Kalpage HA, et al. Metformin, phenformin, and galegine inhibit complex IV activity and reduce glycerol-derived gluconeogenesis. Proc Natl Acad Sci USA. 2022;119(10):e2122287119. doi:10.1073/pnas.2122287119
6. Zhou G, Myers R, Li Y, et al. Role of AMP-activated protein kinase in mechanism of metformin action. J Clin Invest. 2001;108(8):1167–1174. doi:10.1172/JCI13505
7. Madiraju AK, Qiu Y, Perry RJ, et al. Metformin inhibits gluconeogenesis via a redox-dependent mechanism in vivo. Nat Med. 2018;24(9):1384–1394. doi:10.1038/s41591-018-0125-4
8. Foretz M, Hebrard S, Leclerc J, et al. Metformin inhibits hepatic gluconeogenesis in mice independently of the LKB1/AMPK pathway via a decrease in hepatic energy state. J Clin Invest. 2010;120(7):2355–2369. doi:10.1172/JCI40671
9. Madiraju AK, Erion DM, Rahimi Y, et al. Metformin suppresses gluconeogenesis by inhibiting mitochondrial glycerophosphate dehydrogenase. Nature. 2014;510(7506):542–546. doi:10.1038/nature13270
10. Alshawi A, Agius L. Low metformin causes a more oxidized mitochondrial NADH/NAD redox state in hepatocytes and inhibits gluconeogenesis by a redox-independent mechanism. J Biol Chem. 2019;294(8):2839–2853. doi:10.1074/jbc.RA118.006670
11. Simcox JA, McClain DA. Iron and diabetes risk. Cell Metab. 2013;17(3):329–341. doi:10.1016/j.cmet.2013.02.007
12. Backe MB, Moen IW, Ellervik C, Hansen JB, Mandrup-Poulsen T. Iron regulation of pancreatic beta-cell functions and oxidative stress. Annu Rev Nutr. 2016;36(1):241–273. doi:10.1146/annurev-nutr-071715-050939
13. Fernandez-Real JM, McClain D, Manco M. Mechanisms linking glucose homeostasis and iron metabolism toward the onset and progression of type 2 diabetes. Diabetes Care. 2015;38(11):2169–2176. doi:10.2337/dc14-3082
14. Harrison AV, Lorenzo FR, McClain DA. Iron and the pathophysiology of diabetes. Annu Rev Physiol. 2023;85(1):339–362. doi:10.1146/annurev-physiol-022522-102832
15. Stynen B, Abd-Rabbo D, Kowarzyk J, et al. Changes of cell biochemical states are revealed in protein homomeric complex dynamics. Cell. 2018;175(5):1418–1429e9. doi:10.1016/j.cell.2018.09.050
16. Fargion S, Mattioli M, Fracanzani AL, et al. Hyperferritinemia, iron overload, and multiple metabolic alterations identify patients at risk for nonalcoholic steatohepatitis. Am J Gastroenterol. 2001;96(8):2448–2455. doi:10.1111/j.1572-0241.2001.04052.x
17. Altamura S, Muckenthaler MU. Iron toxicity in diseases of aging: Alzheimer’s disease, Parkinson’s disease and atherosclerosis. J Alzheimers Dis. 2009;16(4):879–895. doi:10.3233/JAD-2009-1010
18. Toyokuni S. Role of iron in carcinogenesis: cancer as a ferrotoxic disease. Cancer Sci. 2009;100(1):9–16. doi:10.1111/j.1349-7006.2008.01001.x
19. Zhang W, Iso H, Ohira T, et al. Associations of dietary iron intake with mortality from cardiovascular disease: the JACC study. J Epidemiol. 2012;22(6):484–493. doi:10.2188/jea.JE20120006
20. Gabrielsen JS, Gao Y, Simcox JA, et al. Adipocyte iron regulates adiponectin and insulin sensitivity. J Clin Invest. 2012;122(10):3529–3540. doi:10.1172/JCI44421
21. Simcox JA, Mitchell TC, Gao Y, et al. Dietary iron controls circadian hepatic glucose metabolism through heme synthesis. Diabetes. 2015;64(4):1108–1119. doi:10.2337/db14-0646
22. Gao Y, Liu J, Bai Z, et al. Iron down-regulates leptin by suppressing protein O-GlcNAc modification in adipocytes, resulting in decreased levels of O-glycosylated CREB. J Biol Chem. 2019;294(14):5487–5495. doi:10.1074/jbc.RA118.005183
23. Semenza GL. Hypoxia-inducible factors in physiology and medicine. Cell. 2012;148(3):399–408. doi:10.1016/j.cell.2012.01.021
24. Zachara N, Akimoto Y, Hart GW. The O-GlcNAc modification. In: Varki A, Cummings RD, editors, Essentials of Glycobiology; 2015: 239–251
25. Salaye L, Bychkova I, Sink S, et al. A low iron diet protects from steatohepatitis in a mouse model. Nutrients. 2019;11(9):2172. doi:10.3390/nu11092172
26. Charlton M, Krishnan A, Viker K, et al. Fast food diet mouse: novel small animal model of NASH with ballooning, progressive fibrosis, and high physiological fidelity to the human condition. Am J Physiol Gastrointest Liver Physiol. 2011;301(5):G825–34. doi:10.1152/ajpgi.00145.2011
27. Abbas MA, Abraham D, Kushner JP, McClain DA. Anti-obesity and pro-diabetic effects of hemochromatosis. Obesity. 2014;22(10):2120–2122. doi:10.1002/oby.20839
28. DeFronzo RA, Ferrannini E, Simonson DC. Fasting hyperglycemia in non-insulin-dependent diabetes mellitus: contributions of excessive hepatic glucose production and impaired tissue glucose uptake. Metabolism. 1989;38(4):387–395. doi:10.1016/0026-0495(89)90129-7
29. Cusi K, Consoli A, DeFronzo RA. Metabolic effects of metformin on glucose and lactate metabolism in noninsulin-dependent diabetes mellitus. J Clin Endocrinol Metab. 1996;81(11):4059–4067. doi:10.1210/jcem.81.11.8923861
30. Gao Y, Li Z, Gabrielsen JS, et al. Adipocyte iron regulates leptin and food intake. J Clin Invest. 2015;125(9):3681–3691. doi:10.1172/JCI81860
31. Mendel CM, Kunitake ST. Cell-surface binding sites for high density lipoproteins do not mediate efflux of cholesterol from human fibroblasts in tissue culture. J Lipid Res. 1988;29(9):1171–1178. doi:10.1016/S0022-2275(20)38449-2
32. Shaw RJ, Lamia KA, Vasquez D, et al. The kinase LKB1 mediates glucose homeostasis in liver and therapeutic effects of metformin. Science. 2005;310(5754):1642–1646. doi:10.1126/science.1120781
33. Bullen JW, Balsbaugh JL, Chanda D, et al. Cross-talk between two essential nutrient-sensitive enzymes: o-GlcNAc transferase (OGT) and AMP-activated protein kinase (AMPK). J Biol Chem. 2014;289(15):10592–10606. doi:10.1074/jbc.M113.523068
34. Huang J, Gabrielsen JS, Cooksey RC, et al. Increased glucose disposal and AMP-dependent kinase signaling in a mouse model of hemochromatosis. J Biol Chem. 2007;282(52):37501–37507. doi:10.1074/jbc.M703625200
35. Thompson JW, Griffin ME, Hsieh-Wilson LC. Methods for the detection, study, and dynamic profiling of O-GlcNAc glycosylation. Methods Enzymol. 2018;598:101–135. doi:10.1016/bs.mie.2017.06.009
36. Hardie DG, Carling D. The AMP-activated protein kinase--fuel gauge of the mammalian cell? Eur J Biochem. 1997;246(2):259–273. doi:10.1111/j.1432-1033.1997.00259.x
37. Jiang R. Body iron stores in relation to risk of type 2 diabetes in apparently healthy women. JAMA. 2004;291(6):711–717. doi:10.1001/jama.291.6.711
38. Sherifali D, Nerenberg K, Pullenayegum E, Cheng JE, Gerstein HC. The effect of oral antidiabetic agents on A1C levels: a systematic review and meta-analysis. Diabetes Care. 2010;33(8):1859–1864. doi:10.2337/dc09-1727
39. Chandel NS, Avizonis D, Reczek CR, et al. Are metformin doses used in murine cancer models clinically relevant? Cell Metab. 2016;23(4):569–570. doi:10.1016/j.cmet.2016.03.010
40. Tang J, Neidigh JL, Cooksey RC, McClain DA. Transgenic mice with increased hexosamine flux specifically targeted to beta-cells exhibit hyperinsulinemia and peripheral insulin resistance. Diabetes. 2000;49(9):1492–1499. doi:10.2337/diabetes.49.9.1492
41. McClain DA, Lubas WA, Cooksey RC, et al. Altered glycan-dependent signaling induces insulin resistance and hyperleptinemia. Proc Natl Acad Sci USA. 2002;99(16):10695–10699. doi:10.1073/pnas.152346899
42. Veerababu G, Tang J, Hoffman RT, et al. Overexpression of glutamine: fructose-6-phosphate amidotransferase in the liver of transgenic mice results in enhanced glycogen storage, hyperlipidemia, obesity, and impaired glucose tolerance. Diabetes. 2000;49(12):2070–2078. doi:10.2337/diabetes.49.12.2070
43. Ruan H-B, Singh JP, Li M-D, Wu J, Yang X. Cracking the O-GlcNAc code in metabolism. Trends Endocrinol Metab. 2013;24(6):301–309. doi:10.1016/j.tem.2013.02.002
44. Nie H, Ju H, Fan J, et al. O-GlcNAcylation of PGK1 coordinates glycolysis and TCA cycle to promote tumor growth. Nat Commun. 2020;11(1):36. doi:10.1038/s41467-019-13601-8
45. Ma Z, Vosseller K. Cancer metabolism and elevated O-GlcNAc in oncogenic signaling. J Biol Chem. 2014;289(50):34457–34465. doi:10.1074/jbc.R114.577718
46. Ferrer CM, Lynch TP, Sodi VL, et al. O-GlcNAcylation regulates cancer metabolism and survival stress signaling via regulation of the HIF-1 pathway. Mol Cell. 2014;54(5):820–831. doi:10.1016/j.molcel.2014.04.026
47. Parker G, Taylor R, Jones D, McClain D. Hyperglycemia and inhibition of glycogen synthase in streptozotocin-treated mice: role of O-linked N-acetylglucosamine. J Biol Chem. 2004;279(20):20636–20642. doi:10.1074/jbc.M312139200
48. Parker GJ, Lund KC, Taylor RP, McClain DA. Insulin resistance of glycogen synthase mediated byO-linked N-acetylglucosamine. J Biol Chem. 2003;278(12):10022–10027. doi:10.1074/jbc.M207787200
49. Taylor RP, Parker GJ, Hazel MW, et al. Glucose deprivation stimulates O-GlcNAc modification of proteins through up-regulation of O-linked N-acetylglucosaminyltransferase. J Biol Chem. 2008;283(10):6050–6057. doi:10.1074/jbc.M707328200
50. Shakoury-Elizeh M, Protchenko O, Berger A, et al. Metabolic response to iron deficiency in Saccharomyces cerevisiae. J Biol Chem. 2010;285(19):14823–14833. doi:10.1074/jbc.M109.091710
51. Rumberger JM, Wu T, Hering MA, Marshall S. Role of hexosamine biosynthesis in glucose-mediated up-regulation of lipogenic enzyme mRNA levels: effects of glucose, glutamine, and glucosamine on glycerophosphate dehydrogenase, fatty acid synthase, and acetyl-CoA carboxylase mRNA levels. J Biol Chem. 2003;278(31):28547–28552. doi:10.1074/jbc.M302793200
52. Luo B, Parker GJ, Cooksey RC, et al. Chronic hexosamine flux stimulates fatty acid oxidation by activating AMP-activated protein kinase in adipocytes. J Biol Chem. 2007;282(10):7172–7180. doi:10.1074/jbc.M607362200
53. Huang J, Jones D, Luo B, et al. Iron overload and diabetes risk: a shift from glucose to Fatty Acid oxidation and increased hepatic glucose production in a mouse model of hereditary hemochromatosis. Diabetes. 2011;60(1):80–87. doi:10.2337/db10-0593
54. Nam H, Jones D, Cooksey RC, et al. Synergistic inhibitory effects of hypoxia and iron deficiency on hepatic glucose response in mouse Liver. Diabetes. 2016;65(6):1521–1533. doi:10.2337/db15-0580
55. Jozwiak P, Forma E, Brys M, Krzeslak A. O-GlcNAcylation and metabolic reprograming in cancer. Front Endocrinol. 2014;5:145. doi:10.3389/fendo.2014.00145
56. Afkhami-Ardekani M, Rashidi M. Iron status in women with and without gestational diabetes mellitus. J Diabetes Compl. 2009;23(3):194–198. doi:10.1016/j.jdiacomp.2007.11.006
57. Sharifi F, Nasab NM, Zadeh HJ. Elevated serum ferritin concentrations in prediabetic subjects. Diab Vasc Dis Res. 2008;5(1):15–18. doi:10.3132/dvdr.2008.003
58. Houschyar KS, Ludtke R, Dobos GJ, et al. Effects of phlebotomy-induced reduction of body iron stores on metabolic syndrome: results from a randomized clinical trial. BMC Med. 2012;10(1):54. doi:10.1186/1741-7015-10-54
59. Fleming DJ, Tucker KL, Jacques PF, Dallal GE, Wilson PW, Wood RJ. Dietary factors associated with the risk of high iron stores in the elderly Framingham heart study cohort. Am J Clin Nutr. 2002;76(6):1375–1384. doi:10.1093/ajcn/76.6.1375
60. Beaton MD, Chakrabarti S, Adams PC. Inflammation is not the cause of an elevated serum ferritin in non-alcoholic fatty liver disease. Ann Hepatol. 2014;13(3):353–356. doi:10.1016/S1665-2681(19)30864-6
61. Jouihan HA HA, Cobine PA, Cooksey RC, et al. Iron-mediated inhibition of mitochondrial manganese uptake mediates mitochondrial dysfunction in a mouse model of hemochromatosis. Mol Med. 2008;14(3–4):98–108. doi:10.2119/2007-00114.Jouihan
62. Huang J, Simcox J, Mitchell TC, et al. Iron regulates glucose homeostasis in liver and muscle via AMP-activated protein kinase in mice. FASEB J. 2013;27(7):2845–2854. doi:10.1096/fj.12-216929
63. Puig-Segui MS, Decker CJ, Barlit H, Labunskyy VM, Parker R, Puig S. Regulation of translation in response to iron deficiency in human cells. Sci Rep. 2024;14(1):8451. doi:10.1038/s41598-024-59003-9
64. Federico G, Carrillo F, Dapporto F, et al. NCOA4 links iron bioavailability to DNA metabolism. Cell Rep. 2022;40(7):111207. doi:10.1016/j.celrep.2022.111207
65. Rosenberger FA, Moore D, Atanassov I, et al. The one-carbon pool controls mitochondrial energy metabolism via complex I and iron-sulfur clusters. Sci Adv. 2021;7(8). doi:10.1126/sciadv.abf0717
66. Amin S, Lux A, O’Callaghan F. The journey of metformin from glycaemic control to mTOR inhibition and the suppression of tumour growth. Br J Clin Pharmacol. 2019;85(1):37–46. doi:10.1111/bcp.13780
67. Chapman LE, Darling AL, Brown JE. Association between metformin and vitamin B12 deficiency in patients with type 2 diabetes: a systematic review and meta-analysis. Diabetes Metab. 2016;42(5):316–327. doi:10.1016/j.diabet.2016.03.008
68. Zhong T, Men Y, Lu L, et al. Metformin alters DNA methylation genome-wide via the H19/SAHH axis. Oncogene. 2017;36(17):2345–2354. doi:10.1038/onc.2016.391
69. Cummings BM, Needoba JA, Peterson TD. Effect of metformin exposure on growth and photosynthetic performance in the unicellular freshwater chlorophyte, Chlorella vulgaris. PLoS One. 2018;13(11):e0207041. doi:10.1371/journal.pone.0207041
70. Majmundar AJ, Wong WJ, Simon MC. Hypoxia-inducible factors and the response to hypoxic stress. Mol Cell. 2010;40(2):294–309. doi:10.1016/j.molcel.2010.09.022
 © 2026 The Author(s). This work is published and licensed by Dove Medical Press Limited. The
full terms of this license are available at https://www.dovepress.com/terms
and incorporate the Creative Commons Attribution
- Non Commercial (unported, 4.0) License.
By accessing the work you hereby accept the Terms. Non-commercial uses of the work are permitted
without any further permission from Dove Medical Press Limited, provided the work is properly
attributed. For permission for commercial use of this work, please see paragraphs 4.2 and 5 of our Terms.
© 2026 The Author(s). This work is published and licensed by Dove Medical Press Limited. The
full terms of this license are available at https://www.dovepress.com/terms
and incorporate the Creative Commons Attribution
- Non Commercial (unported, 4.0) License.
By accessing the work you hereby accept the Terms. Non-commercial uses of the work are permitted
without any further permission from Dove Medical Press Limited, provided the work is properly
attributed. For permission for commercial use of this work, please see paragraphs 4.2 and 5 of our Terms.