")
Back to Journals » Infection and Drug Resistance » Volume 14
Time Series Analysis and Forecasting of the Hand-Foot-Mouth Disease Morbidity in China Using An Advanced Exponential Smoothing State Space TBATS Model
Authors Yu C, Xu C, Li Y, Yao S, Bai Y , Li J, Wang L, Wu W , Wang Y
Received 30 January 2021
Accepted for publication 26 April 2021
Published 21 July 2021 Volume 2021:14 Pages 2809—2821
DOI https://doi.org/10.2147/IDR.S304652
Checked for plagiarism Yes
Review by Single anonymous peer review
Peer reviewer comments 2
Editor who approved publication: Dr Sahil Khanna
Chongchong Yu,1,* Chunjie Xu,2,* Yuhong Li,3 Sanqiao Yao,1 Yichun Bai,1 Jizhen Li,1 Lei Wang,4 Weidong Wu,1 Yongbin Wang1
1Department of Epidemiology and Health Statistics, School of Public Health, Xinxiang Medical University, Xinxiang, Henan Province, People’s Republic of China; 2Department of Occupational and Environmental Health, School of Public Health, Capital Medical University, Beijing, 100069, People’s Republic of China; 3National Center for Tuberculosis Control and Prevention, China Center for Disease Control and Prevention, Beijing, People’s Republic of China; 4Center for Musculoskeletal Surgery, Charité–Universitätsmedizin Berlin, Corporate Member of Freie Universität Berlin, Humboldt–Universität Zu Berlin and Berlin Institute of Health, Berlin, Germany
*These authors contributed equally to this work
Correspondence: Yongbin Wang
Department of Epidemiology and Health Statistics, School of Public Health, Xinxiang Medical University, Xinxiang, 453000, Henan Province, People’s Republic of China
Email [email protected]
Objective: The high morbidity, complex seasonality, and recurring risk of hand-foot-and-mouth disease (HFMD) exert a major burden in China. Forecasting its epidemic trends is greatly instrumental in informing vaccine and targeted interventions. This study sets out to investigate the usefulness of an advanced exponential smoothing state space framework by combining Box-Cox transformations, Fourier representations with time-varying coefficients and autoregressive moving average (ARMA) error correction (TBATS) method to assess the temporal trends of HFMD in China.
Methods: Data from January 2009 to December 2019 were drawn, and then they were split into two segments comprising the in-sample training data and out-of-sample testing data to develop and validate the TBATS model, and its fitting and forecasting abilities were compared with the most frequently used seasonal autoregressive integrated moving average (SARIMA) method.
Results: Following the modelling procedures of the SARIMA and TBATS methods, the SARIMA (1,0,1)(0,1,1)12 and TBATS (0.024, {1,1}, 0.855, {< 12,4>}) specifications were recognized as being the optimal models, respectively, for the 12-step ahead forecasting, along with the SARIMA (1,0,1)(0,1,1)12 and TBATS (0.062, {1,3}, 0.86, {< 12,4>}) models as being the optimal models, respectively, for the 24-step ahead forecasting. Among them, the optimal TBATS models produced lower error rates in both 12-step and 24-step ahead forecasting aspects compared to the preferred SARIMA models. Descriptive analysis of the data showed a significantly high level and a marked dual seasonal pattern in the HFMD morbidity.
Conclusion: The TBATS model has the capacity to outperform the most frequently used SARIMA model in forecasting the HFMD incidence in China, and it can be recommended as a flexible and useful tool in the decision-making process of HFMD prevention and control in China.
Keywords: HFMD, morbidity, TBATS, SARIMA, models, time series analysis
Introduction
Hand-foot-and-mouth disease (HFMD) is a common viral infectious disease that mainly affects children under seven.1 This illness is typically a self-limiting condition and most children are characterized by oral pain, anorexia, low fever, and popular vesicles on the palms and soles, whereas a few children can develop myocarditis, pulmonary edema, and aseptic meningoencephalitis, which may lead to death. Coxsackievirus A16 (CVA16) and enterovirus 71 (EV71) are the most common causative agents causing HFMD outbreaks in the past years, even though some other pathogens can be involved.2–4 Moreover, it was discovered that around half of the children were coinfected with more than one pathogen. The Coxsackie viruses were first described in 1948,5 and particular attention was not paid to HFMD until 1998 because this illness caused several outbreaks, associated with millions of children, especially in the Western Pacific Region (eg, Malaysia, China, Japan, Singapore, Mongolia, Vietnam, and Cambodia6–11). In China, several large outbreaks of HFMD were observed in 2007 and early 2008, leading to major burdens of disease and economy. In response to such a daunting threat, HFMD was thus listed as a notifiable disease in May 2008 in China,12 and since then its morbidity often ranks the first among the 40 notifiable infectious diseases in China.13 Currently, three monovalent EV-A71 vaccines have been introduced against HFMD since 2016 in China, and the protective efficacies of the above-mentioned vaccines were shown to be higher than 90% against EV71-related HFMD.14 However, it is documented that this illness still has a significant influence on the general susceptible population, with more than two million children developed HFMD per year in China, and more crucially, the HFMD incidence appears to exhibit an increasing tendency in recent years, partly attributable to the emergence of new Coxsackievirus, climate change, and environmental degradation.14,15 Therefore, to attenuate or contain the spreading of this illness, early warning for the temporal patterns of HFMD epidemic trends in the upcoming years using a suitable forecasting model plays an important role in developing effective preventive measures.16
In the past, different mathematical simulation models, including autoregressive integrated moving average (ARIMA) method,13 artificial neural networks (ANNS), exponential smoothing (ES) method,17 support vector machine (SVM),18 decomposition methods,18 and grey model19 have been applied to forecast the epidemics of communicable diseases. The occurrence of communicable diseases is typically limited by different influencing factors (eg, meteorological variables, government interventions, vaccines, and air quality15,20), leading to showing complex epidemiological features with multiple seasonal periods, high-frequency seasonality, non-integer seasonality, and dual-calendar effects of the time series.21 For this reason, the above frequently used forecasting tools may be incapable of mining information in such a complex time series reasonably well. Importantly, the incidence series of HFMD has been shown to exhibit complex seasonal patterns in different regions or countries.12,22–24 To overcome the weaknesses and inadequacy of the existing time series models in dealing with complex seasonal patterns, an advanced exponential smoothing state space framework by combining Box-Cox transformations, Fourier representations with time-varying coefficients and autoregressive moving average (ARMA) error correction (TBATS) model was customized to accommodate such a time series with complex seasonal behaviors.21 The TBATS model is introduced based on a trigonometric formulation capable of handling the seasonal complexities in a time series. Also, this model is designed to overcome the defects of the conventional BATS models that require a large number of parameters to be estimated in the process of BATS-development and are unable to deal with non-integer seasonality.21,25,26 However, there is a current lack of using the TBATS framework to model and forecast the temporal patterns of HFMD. Considering the advantage of the TBATS framework and the complex seasonal patterns of HFMD, the purpose of this work is to use the TBATS framework to describe and predict the epidemic behaviors of HFMD. In the forecasting field of communicable diseases, the most commonly used mathematical methods is the ARIMA model,13,27–30 and it has been demonstrated to show a high forecasting accuracy. Therefore, in this study, the ARIMA model was also created to nowcast and forecast the epidemic trends of HFMD, and its forecasting accuracy level was compared with the TBATS method to further investigate the flexibility and usefulness of the TBATS method.
Materials and Methods
Data Collection
In China, the notifiable infectious diseases were asked to report to the Chinese Center for Disease Control and Prevention (CDC). Since HFMD was named as class C notifiable infectious disease in May 2008, and hence the monthly notified cases between January 2009 and December 2019 spanning 11 years were drawn from the National Notifiable Infectious Disease Surveillance System (NNIDSS) operated by the Chinese CDC, and the population data were drawn from the Statistical Yearbook of China during the same period. Suppose that the number of populations remained relatively steady during the year, the monthly HFMD incidence rate was computed by the average populations of each year (Table S1). Generally, at least 50 and preferably 100 observations or more are required to construct a robust and effective forecasting model.31 Therefore, the dataset including over 100 observations was treated as the training horizon to build the model, and the rest as the testing horizon to verify its generalization of the model.
The study protocol was approved by the institutional review board of Xinxiang Medical University (No: XYLL-2019072), and the ethical approval failed to be needed since the reported HFMD cases without personal information are publicly available in China.
SARIMA Model
Typically, time series is characterized by noticeable correlations between successive observed values.32 The most classical approach to consider the association patterns of a time series is the ARIMA model.29 Since the incidence series of infectious diseases often shows marked seasonal variation and periodicity, and thus the seasonal ARIMA (SARIMA) is more appropriate for capturing the dynamic dependence structure in the HFMD incidence.13,33 In this model, the seasonality of the object series was regarded as the independent variable and the morbidity as the dependent variable.33 SARIMA method can be presented with the standard notation of SARIMA (p,d,q)(P,D,Q)s, where p stands for the order of autoregression, d signifies differenced times, and q refers to the order of moving-average, (P,D,Q) are their corresponding seasonal counterparts, and S is the cycle length of the object series (S=12 in this study). Often, the SARIMA model is created based on four modelling steps. First, model identification. The SARIMA is defined for stationary time series.30 Therefore, the stationarity of HFMD incidence series was detected using an augmented Dickey-Fuller (ADF) test, if suggesting a nonstationary series, the logarithm or square root transformed method or/and differenced method would need to be used until a stationary series was achieved.29 Second, parameter estimation. By examining the correlogram and partial correlogram of the differenced series to identify the plausible values of the key parameters of the SARIMA model. Among the possible models, the parameters that provided a less value of Akaike’s information criterion (AIC) and Schwarz’s Bayesian criterion (BIC) and a greater value of Log-Likelihood were considered the preferred.33 Third, model diagnostic checking. Using the Ljung-Box Q test to check whether the residual series behaved like a white noise series and the key parameters were statistically significant.33 Finally, when the best model passed all the required statistical tests, and then a forecast into the future could be done using this best-fitting model. Otherwise, the above steps should be repeated until an appropriate model was detected.
TBATS Model
In the past, the well-documented seasonal ES methods have widely been adopted to deal with the single seasonal time series.17 Nevertheless, these traditional ES methods fail to describe the complex seasonal time series comprising multiple seasonal patterns, non-integer seasonal patterns, and dual-calendar effects.21,34 Although some researchers attempted to extend the classical ES models to accommodate a second seasonal trait so that the time series comprising two seasonal components can be described, this may suffer from a major flaw that needs to compute substantial values for the preceding seasonal patterns, particularly when a time series shows high-frequency seasonal behaviors, resulting in over-parameterization.21,26,35 To accommodate a wider variety of seasonal components and to resolve the issue encountered in the extended version of the common ES models. The notation BATS (p, q, m1, m2, …, mT) method is thus proposed, where B refers to the Box-Cox transformation, A represents the ARMA model, T is the trend trait in the object time series, and S signifies the seasonality in the object time series.21,26,34 The key parameters of the BATS model are composed of the ARMA method (p and q) and the seasonal periods (m1, …, mT). The BATS model has the potential to handle multiple seasonal periods and to allow for some types of nonlinear characteristics included in the object time series with Box-Cox transformation.36 Despite its advantages of the BATS model, it is unable to deal with non-integer seasonality and also encounters many parameters that require computation.21 Hence, researchers proposed a novel trigonometric representation of seasonal traits based on the Fourier series, and this representation can be in the form of TBATS (ω, p, q, φ, {m1, k1}, {m2, k2}, …,{mT, kT}), where the parameters (p, q, and m) of the TBATS model have the same meaning as the BATS model, k is the number of harmonics used for the seasonal trait, ω stands for the Box-Cox transformation, and φ signifies the dampening parameter value.21,37 Importantly, The TBATS method can not only significantly reduce the number of parameters needed (with an estimation of 2(k1+k2+ … +kT) initial seasonal values) relative to the traditional BATS method, but can be used to estimate the non-integer seasonal frequencies with the trigonometric functions.21,37 Also, the TBATS model has the potential to decompose a time series into constituent different components. Especially, this model is capable of identifying and extracting one or more seasonal traits that may fail to be presented in the object series graphs themselves.37
Statistical Analysis
The SARIMA and TBATS methods were created using R software (version 3.4.3, R Development Core Team, Vienna, Austria). We set two predicted segments to account for the model uncertainty in the forecasting process (ie, the first 108 (from January 2009 to December 2017) and 120 (from January 2009 to December 2018) observations were used for the training parts, respectively, and the rest of 24 (from January 2018 to December 2019) and 12 (from January to December 2019) observations were reserved for the testing parts, respectively). In this study, a Lagrangian Multiplier (LM) test was employed to check whether there existed conditional heteroskedastic behavior and volatility (ARCH effect) in the residual series produced by these two models.38 The statistical significance level was set at p<0.05.
We used two types of evaluation metrics to investigate the forecasting accuracy level between these two models. One is the scale-dependent metrics including root mean square error (RMSE) and mean absolute deviation (MAD), another is the percentage error metrics including mean error rate (MER) and mean absolute percentage error (MAPE). The model that has lower values of the above measurement metrics was considered higher accuracy in the time series forecasting of HFMD morbidity.
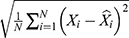


where Xi is the observed values,  is the predicted values of the two models used,
  stands for the mean of the observed values, and N signifies the number of forecasted values of the two models used.
Results
Descriptive Analysis
During the period 2009–2019, the reported number of HFMD totaled 22,227,647 cases, leading to annual and monthly average incidence rates of 147.710 and 12.309 per 100,000 people, respectively. From Figure 1 we can see that HFMD cases were notified across the whole year, and yet the HFMD incidence showed a high incidence characteristic every other year. Based on the 11 years of observations, the maximum number of HFMD cases were noted in May 2014, with 528,777 cases (38.658 per 100,000 people), and the minimum number of HFMD cases were observed in January 2009, with 7672 cases (0.575 per 100,000 people). When a seasonal-trend decomposition procedure based on Loess (STL) method was adopted to characterize the different components in the HFMD incidence, a notable seasonality and dual peak distribution were observed, there were few cases between January and March (especially in February), a sudden escalation between April and July (particularly in June), then a reduction in August, and yet a secondary peak in September per year (Figure 1).
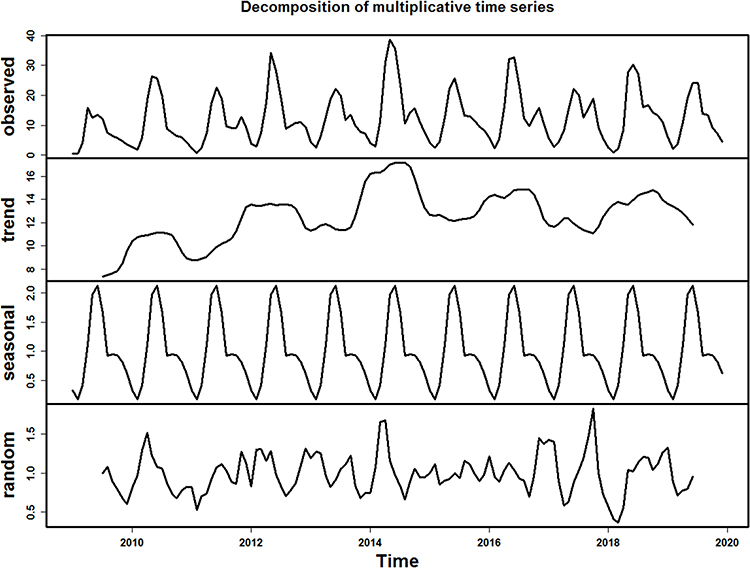 |
Figure 1 Time series displaying the HFMD incidence from January 2009 to December 2019 and the decomposed trend, seasonal, and random traits using the classical multiplicative decomposition method. |
Constructing the SARIMA Model
By a visual inspection of the time series plot showing the original data, the logarithm transformed data, and the square root transformed data of the HFMD incidence (Figure S1), suggesting a similar changing trend over time between these three series. After repeated attempts (Figure S2), we found that the original data of the HFMD incidence with logarithm transformation seemed to be more suitable for the development of the SARIMA model to make a long-term forecast (from January 2018 to December 2019). As a result, we first seasonally differenced the logarithm transformed series from January 2009 to December 2017 to remove its strong seasonal pattern (Figure S3). The differenced series was shown to be stationary (ADF=−5.720, p<0.001), which suits the prerequisite for constructing the SARIMA model. Then, by investigating the autocorrelation function (ACF) and the partial autocorrelation function (PACF) plots of the differenced series, it appeared that the orders of p, P, q, and Q might be between 0 and 2 in that the correlation coefficients showed a rapidly decayed trend before lag 3 (Figure S3). Given that some models with simple parameters are not capable of effectively capturing the dynamic dependence structure of the HFMD incidence series, thereby eight plausible models were selected in our experiments (Table 1). Of them, it seemed that the SARIMA(1,0,1)(0,1,1)12 specification was expected to be the preferred model as it provided the minimum information criteria (AIC=17.147 and BIC=27.876) among the plausible models. Further diagnostic checking for the residual series of the best SARIMA model indicated that the key parameters were statistical significance (Table 2), and the residuals from this best SARIMA model behaved like a white noise series as the Box-Ljung Q test showed a p-value greater than 0.05 (Table 3 and Figure 2). Besides, no ARCH effect was observed in the residuals since the LM-test indicated a p-value greater than 0.05 (Table 3). All the results above mean that the SARIMA model obtained is very adequate for modelling the HFMD incidence. Similarly, following the modelling procedures described above, the observations between January 2009 and December 2018 were used to construct the SARIMA model to validate the robustness and accuracy of the SARIMA model. The SARIMA(1,0,1)(0,1,1)12 specification was still considered the optimal model and the statistical tests for this preferred SARIMA model are given in Tables S2-S4 and Figures S4-S6.
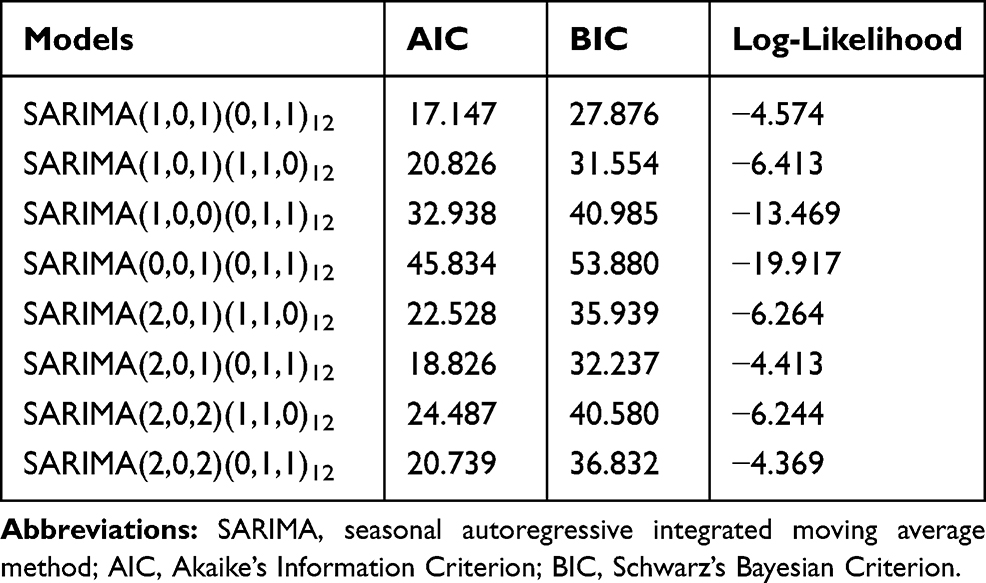 |
Table 1 The Identified Eight Possible SARIMA Methods and Their Corresponding Information Criteria |
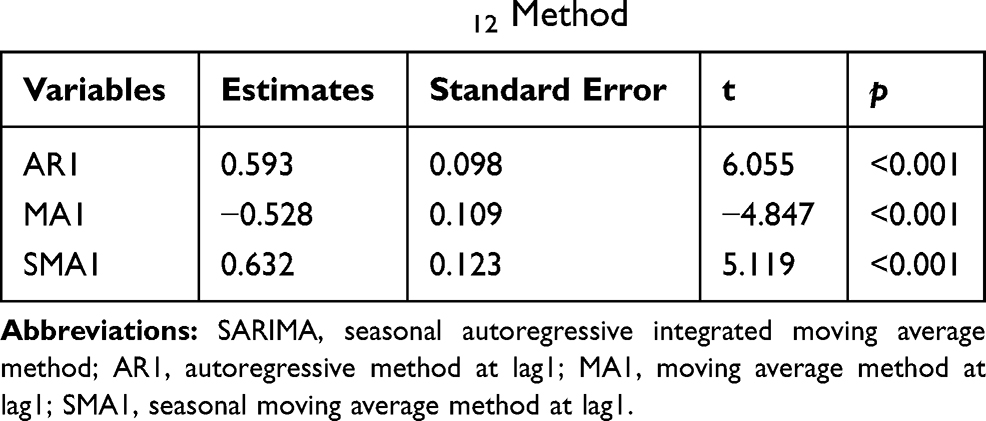 |
Table 2 Statistical Test of the Estimated Parameters for the Optimal SARIMA (1,0,1)(0,1,1)12 Method |
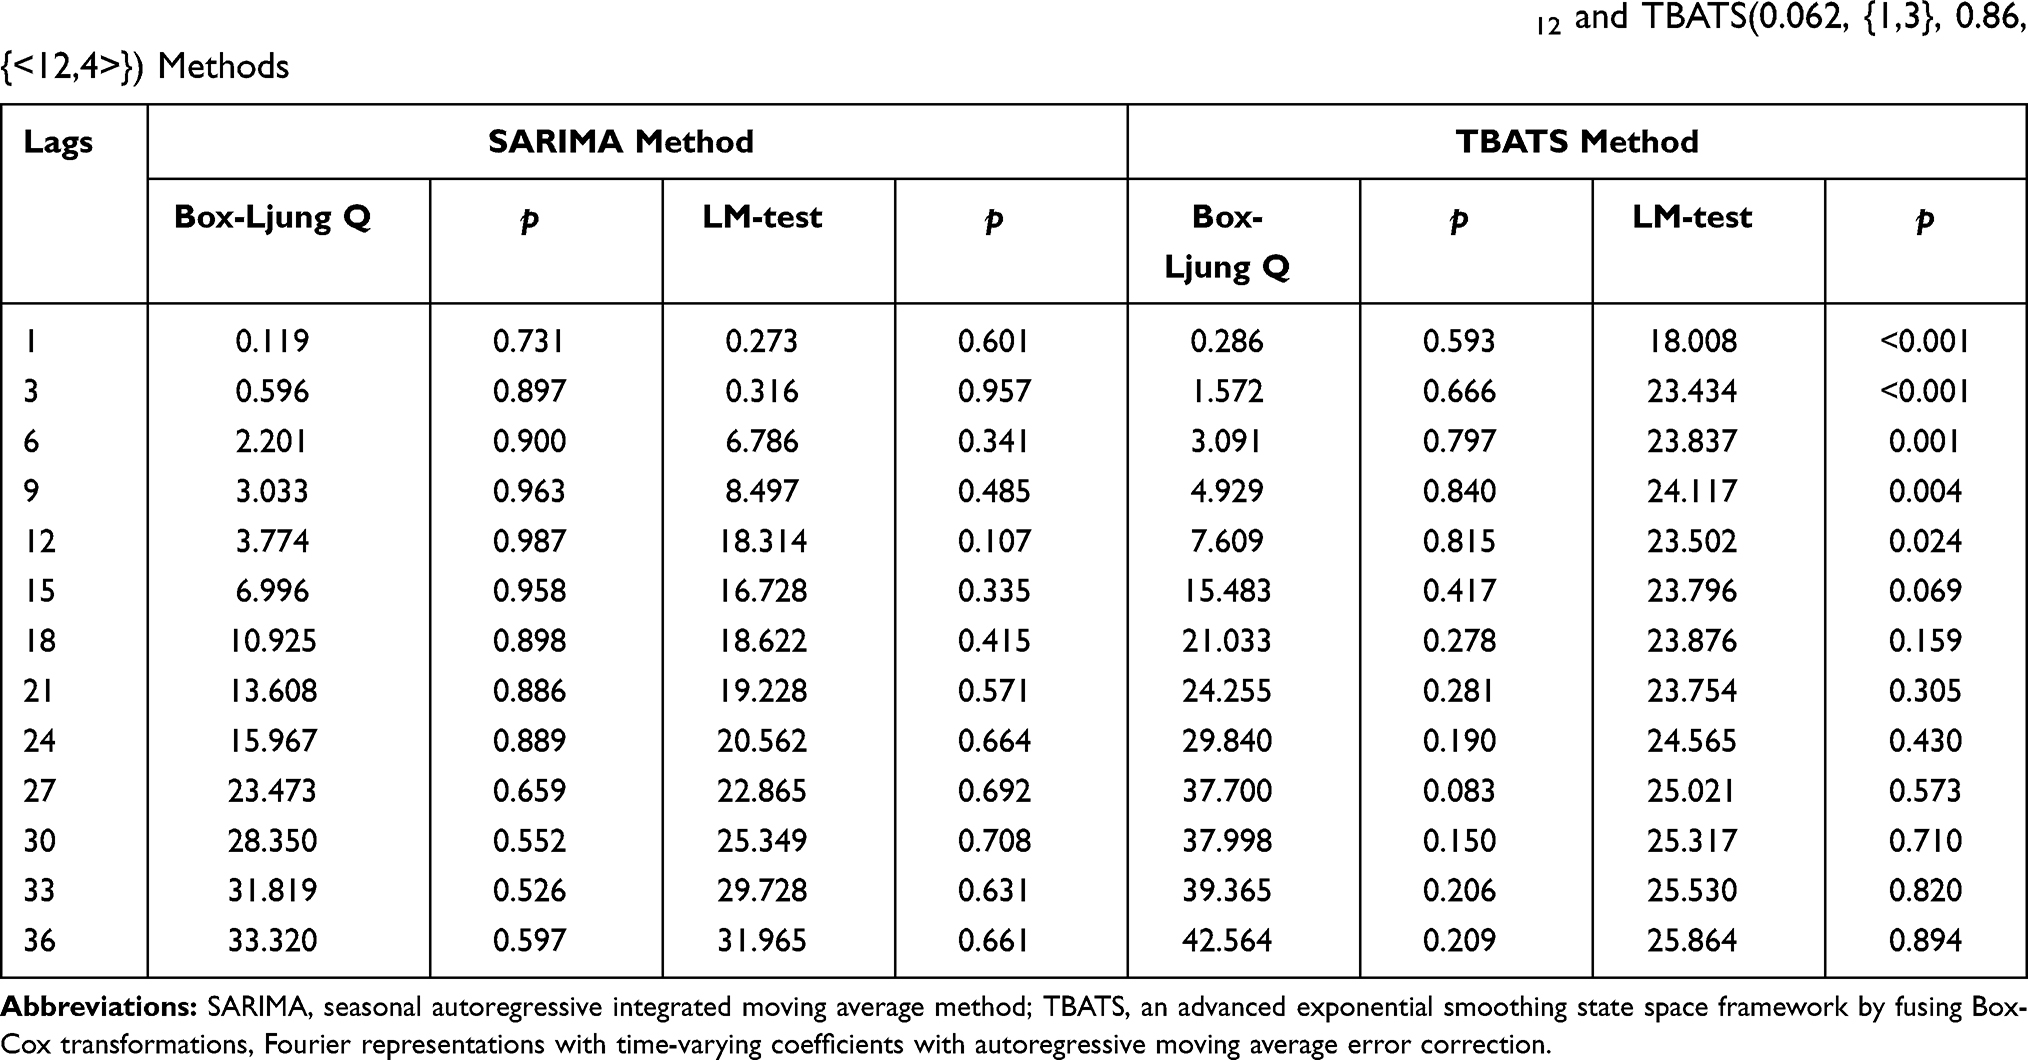 |
Table 3 Box-Ljung Q and LM Tests of the Residual Series from the Optimal SARIMA (1,0,1)(0,1,1)12 and TBATS(0.062, {1,3}, 0.86, {<12,4>}) Methods |
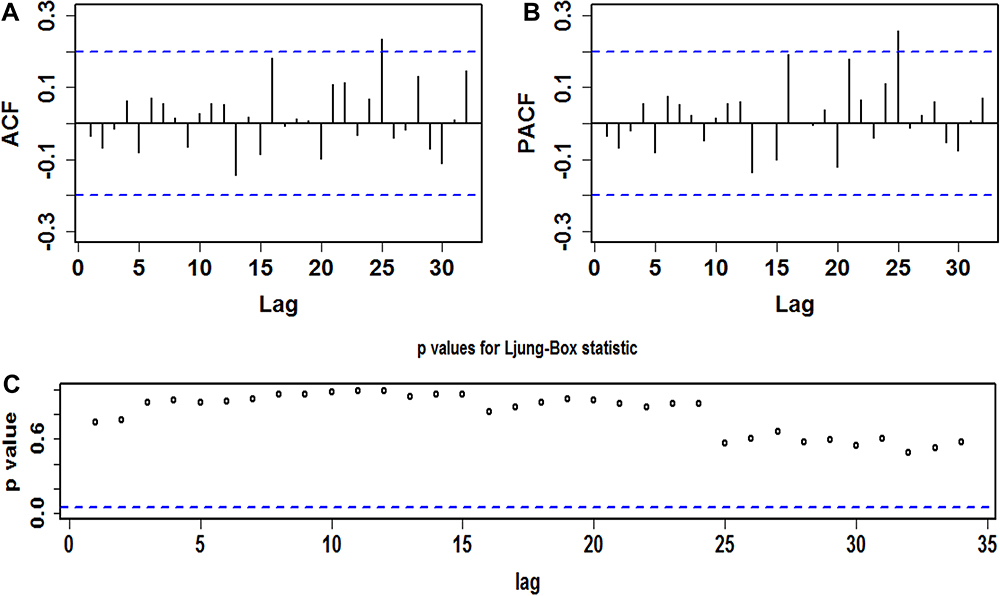 |
Figure 2 Diagnostic checking for the residual series from the best SARIMA (1,0,1)(0,1,1)12 method. (A) Correlogram of the sample autocorrelation function (ACF); (B) Correlogram of the sample partial autocorrelation function (PACF); (C) p values for the Ljung-Box test. The plot above showed that almost all the sample autocorrelations for the residual series fail to touch the significance bounds apart from the one at lag 25 (which is also reasonable as higher-order autocorrelation may exceed the 95% significance bounds by chance alone) and p values at different lags are greater than 0.05 under the Ljung-Box statistic, suggesting that there is little evidence of non-zero autocorrelations in the residual series at various lags. |
Developing the TBATS Model
The forecasting accuracy level of the TBATS model relies on the number of harmonics k used for the seasonal component.21 In choosing an effective TBATS model, given one seasonal trait at a time, we thus developed the TBATS model based on the training data from January 2009 to December 2017 by gradually adjusting the k each time but remaining all other harmonics constant for each seasonal component. Meanwhile, an automatic time series algorithm of the ARIMA model was employed to the residual series produced by the TBATS model without the ARMA component to discover the suitable orders of p and q.39 By doing so, the one that had the minimum AIC value was identified as the optimal model. In an effort by trial and error, it is found that the TBATS (0.062, {1,3}, 0.86, {<12,4>}) specification minimizes the AIC (705.260), and the resulting smoothing parameters and other key parameters are listed in Table S5 and the extracted components with Box-Cox transformation based on the above-identified parameters are visible in Figure S7. Further analysis for the residual series indicated that the errors belonged to a white noise series and the ARCH effect from the original observed series was largely attenuated in that gradually increasing the lag periods generated a p-value greater than 0.05 under the Box-Ljung Q test and the LM test (Table 3 and Figure 3). Thereby, we are confident that this best TBATS model is sufficient for the morbidity series forecasting of HFMD. Likewise, following the model selection steps, the TBATS (0.024, {1,1}, 0.855, {<12,4>}) specification was selected as the best-fitting model based on the data from January 2009 to December 2018 to account for the model uncertainty, and the resulting key parameters and statistical checking results are provided in Tables S4-S5 and Figures S8-S9.
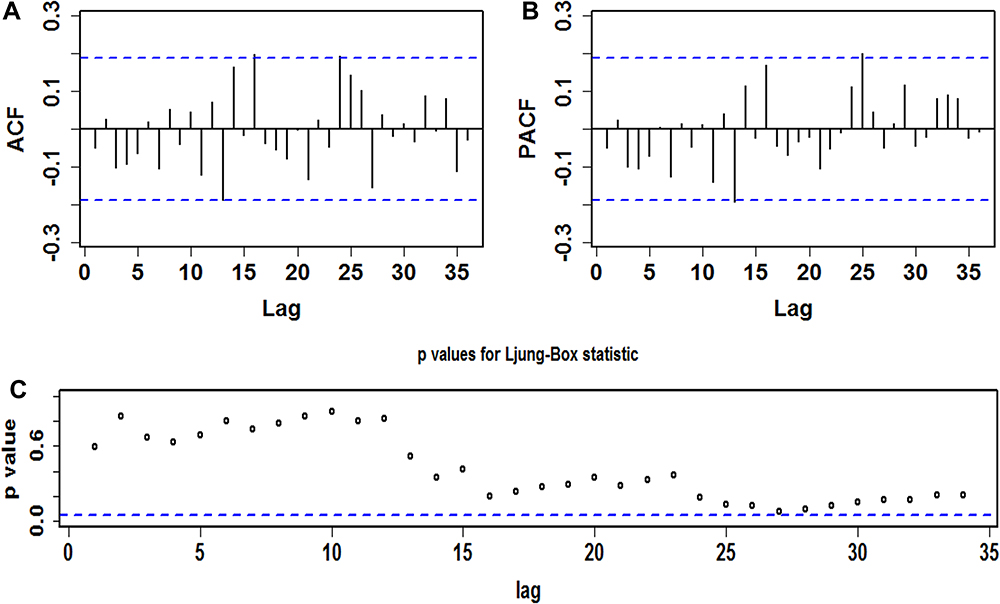 |
Figure 3 Diagnostic checking for the residual series from the best TBATS (0.062, {1,3}, 0.86, {<12,4>}) method. (A) Correlogram of the sample autocorrelation function (ACF); (B) Correlogram of the sample partial autocorrelation function (PACF); (C) p values for the Ljung-Box test. The plot above showed that almost all the sample autocorrelations for the residual series fail to touch the significance bounds and p values at different lags are greater than 0.05 under the Ljung-Box statistic, suggesting that there is little evidence of non-zero autocorrelations in the residual series at various lags. |
Comparing the Forecasting Ability Between Models
The forecasting ability between the TBATS model and the SARIMA model was compared from two aspects including in-sample fitting horizon and out-of-sample forecasting horizon based on the measurement metrics of MAD, RMSE, MAPE, and MER. Table 4 and Figure S10 detail the results on the comparison, and it is apparent from the results that the best TBATS models produced lower error rates in both the training and testing segments compared to the best SARIMA models, be it in 24-step or 12-step ahead projections (Table S6 and S7), suggesting that the TBATS model is more reliable and robust in forecasting the HFMD incidence in China than the most frequent use of SARIMA model (Figure S11). Accordingly, we again built the TBATS model based on the 11 years of data to predict the HFMD incidence into the next 24 months. The model selection procedures resulted in the best TBATS (0.022, {3, 1}, 0.851, {<12, 4>}) method, and the resulting forecasting results are presented in Table 5 and Figure 4, being suggestive of a relatively stable epidemiological trend in the HFMD incidence between January 2020 and December 2021 in China.
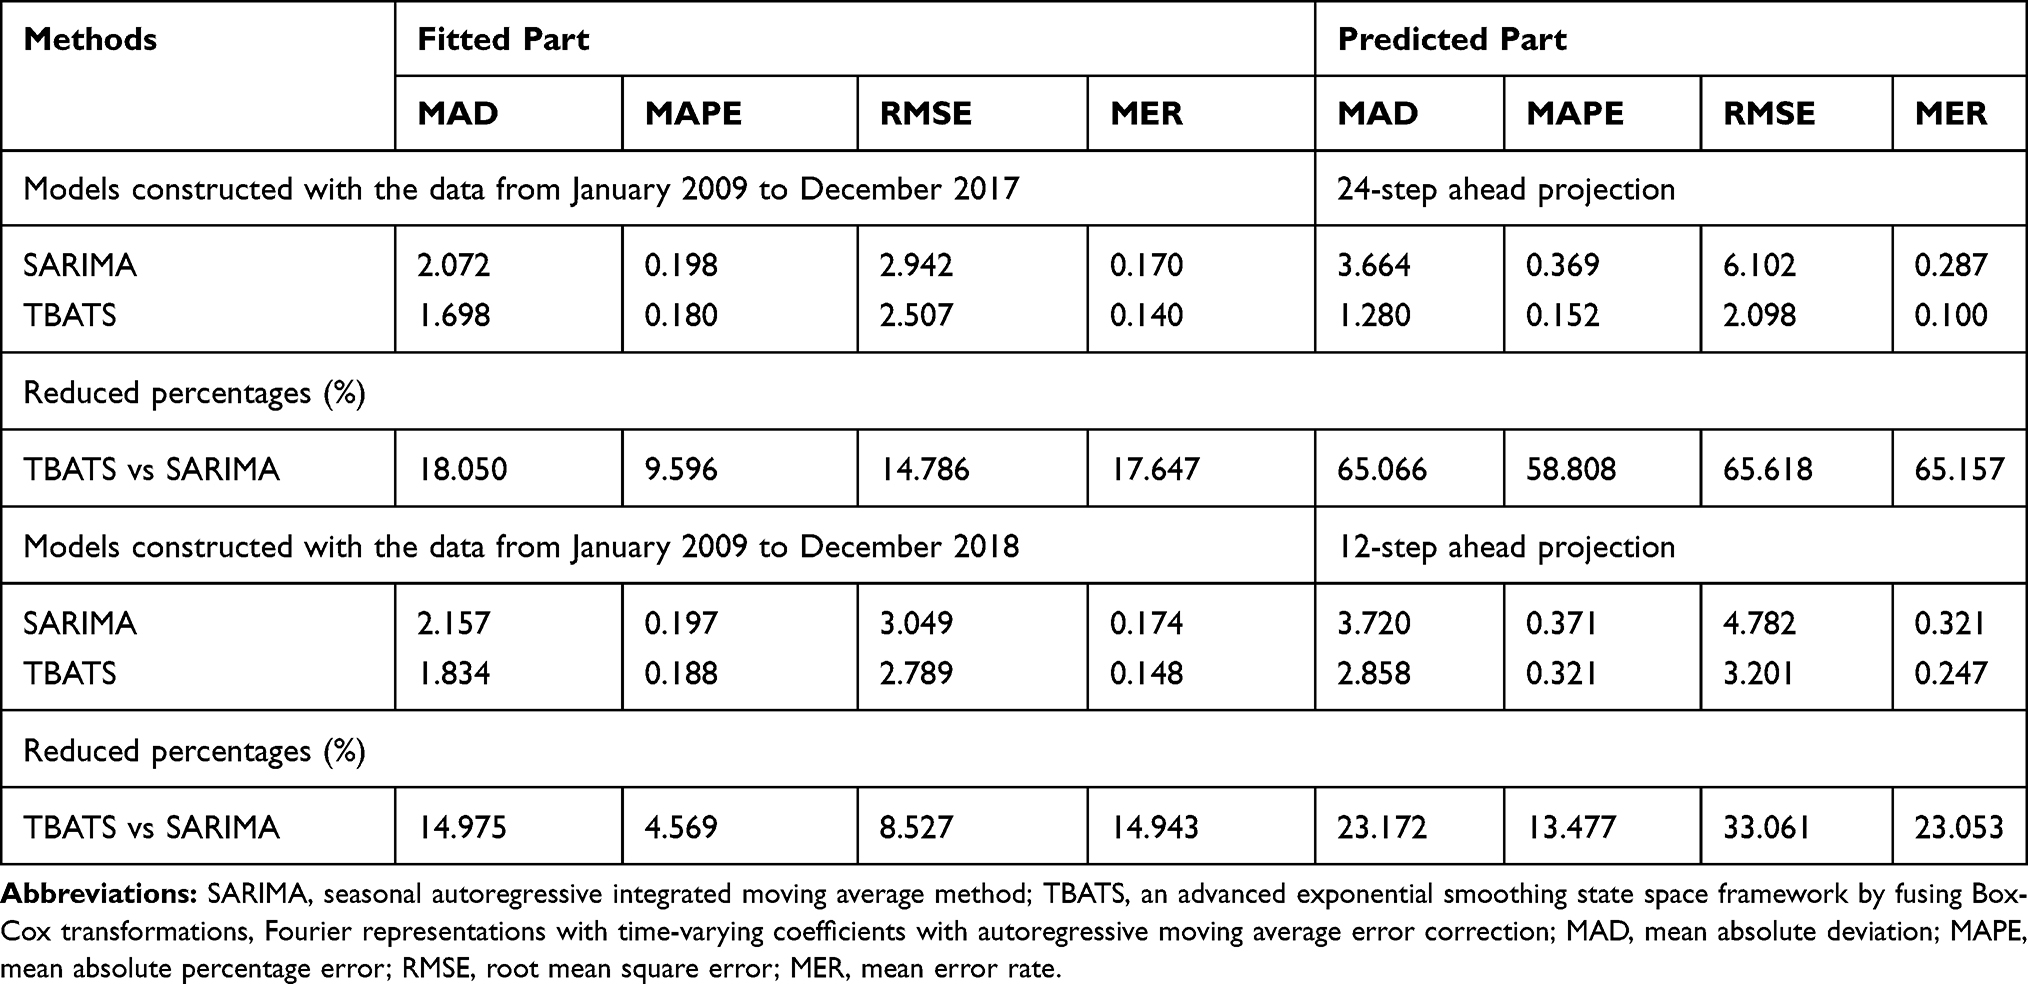 |
Table 4 Comparisons of the Fitted Parts and the Predicted Parts Between SARIMA Methods and TBATS Methods |
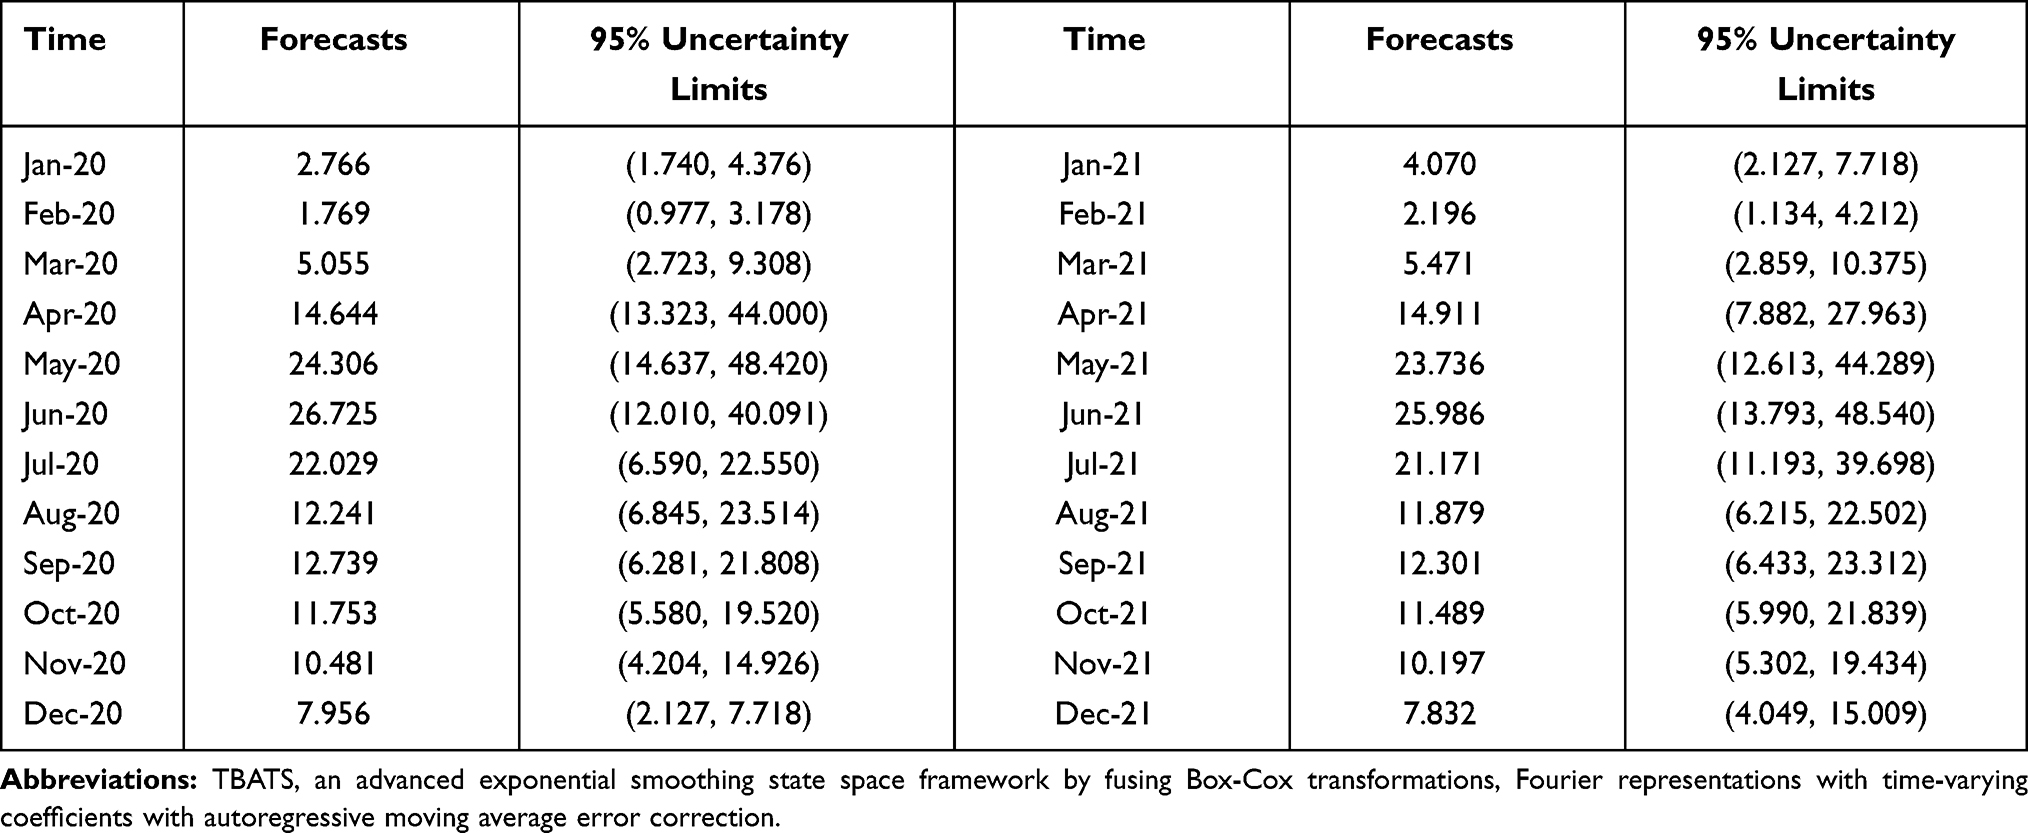 |
Table 5 Forecasts and Their 95% Uncertainty Limits of the HFMD Incidence for the Next 24 Months Based on the TBATS (0.022, {3, 1}, 0.851, {<12, 4>}) Method |
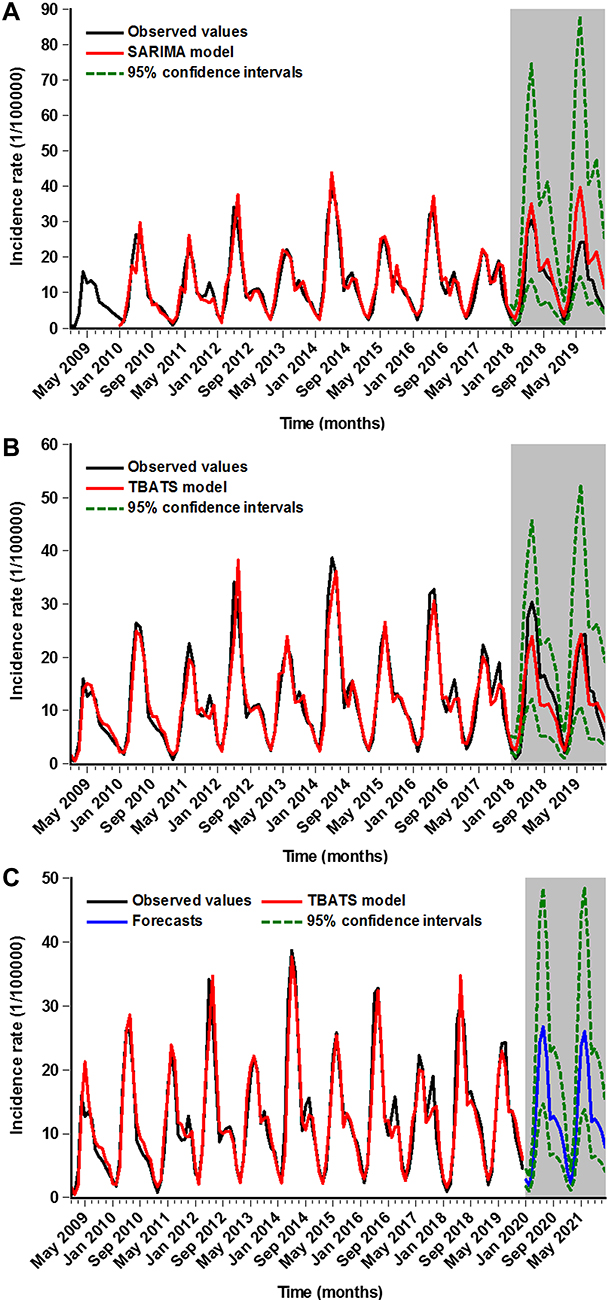 |
Figure 4 Time series plot showing the in-sample simulation and out-of-sample forecasting using the best SARIMA and TBATS methods. (A) The in-sample fitting and out-of-sample forecasting results using the best SARIMA method; (B) The in-sample fitting and out-of-sample forecasting results using the best TBATS method; (C) The next 24-month projections using the best TBATS method built with the incidence data from January 2009 to December 2019. |
Discussion
Since 2008, HFMD has become a major public health concern because of its high morbidity and adverse health effect on more than two million children per year in China.12,13,22 The use of statistical models with high accuracy and robustness as an effective and helpful tool for the estimation of the long-term epidemic trends of infectious diseases is essential to inform prevention initiatives.16 For this reason, prompting different researches using various mathematical techniques with the same purpose of achieving an accurate forecast of the upcoming HFMD epidemics is being done. However, as far as we know that there is no study by far using an advanced exponential smoothing state space TBATS framework to describe and estimate the temporal patterns of HFMD. The present research explores, for the first time, its potential of the TBATS model for the application in describing and analyzing the epidemic trajectories of HFMD, and the most commonly used SARIMA model was also fitted to the HFMD incidence data to compare their predictive ability between the TBATS model and the SARIMA model. The results to emerge from this time series analysis indicated that the best TBATS model shows a performance improvement over the optimal SARIMA model in both in-sample data and out-of-sample data, particularly in the forecasting aspect, be it in the 12-step ahead (short-term) projection or the 24-step ahead (long-term) projection. In the meantime, we also developed the TBATS and SARIMA models based on the data from January 2009 to December 2016 to investigate their forecasting ability into the next 36 months, suggesting that the TBATS model was still superior to the SARIMA model (Tables S8 and S9), but these two models produced a high error rate (MAPE=0.441 in the TBATS model vs MAPE=0.930 in the SARIMA model), particularly for the SARIMA model, it had been inadequate for predicting the temporal patterns into the future three years as the MAPE value was greater than 0.5 on the testing data, which is deemed as an unacceptable level of accuracy. This provides further support for the usefulness of the TBATS model as an adequate and effective tool in nowcasting and forecasting the temporal trends of HFMD until the upcoming 24 months in China. Furthermore, an external validation of the utility of TBATS model was performed based on the HFMD incidence data from 2009 to 2017 in Henan Province (Table S10), and the resulting results are listed in Table S11 and Figure S11, indicating a same finding as our present study that the predictive results under TBATS model were closer to the actual data compared with that under SARIMA model. Also, the TBATS model can act as a serviceable tool in estimating the short-term or long-term effects of new prevention and control measures (eg, the introduction of new vaccines available, the optimization of the current prophylaxis, and increasing the intensity of vaccine advocacy and education among children and their parents at high-risk seasons2,24). If this model produces a significant overestimation over the real data, suggesting that the present interventions may take effect; otherwise, additional interventions are needed to contain the epidemics of HFMD. Besides, the SARIMA model was also discovered to report an acceptable projected result although it yielded a higher forecasting error rate compared to the TBATS model. This further corroborates the finding of a great deal of previous work that the SARIMA model is flexible and useful in the forecasting domain of time series.27,29,30,33,40
The versatile SARIMA method is deemed as the most frequently adopted tool in the forecasting domain of time series data with remarkable seasonality and cyclicity in that this model has the advantage that there is no need to make a foregoing assumption on the inherent rule of a time series.30,41 For example, Tian et al built a SARIMA (1,1,2) (0,1,1)12 model to describe and analyze the temporal patterns of HFMD between May 2008 and August 2018.13 Shi et al investigated the spreading mode of Hemorrhagic Fever with Renal Syndrome morbidity from 2000 to 2017 in East China by establishing a SARIMA (0,1,1,)(0,1,1)12 method.27 In spite of its satisfactory predictive performance of the SARIMA model, it has a limited ability to solve nonlinear problems and to make a long-term forecast as this model is designed under the assumption of linearity.33 Also, as evidenced by the findings to emerge from our study and other publications,13,21,42 the SARIMA model is not well suited to address the complex time series with multiple seasonal periods, high-frequency seasonality, non-integer seasonality, and dual-calendar effects despite its wide application.21 Instead, the TBATS model is tailored for not only dealing with the complex time series described above but allowing for some types of non-linearity using Box-Cox transformations,21,43 which enable this model to have the potential to describe the long-term epidemic patterns of HFMD. Given its attractive applications of the TBATS model,21 it appeared therefore that this model can be adopted to analyze the HFMD incidence in other countries or regions, even for all the time series, and yet additional work on the current topic is still required to verify its versatility. Additionally, of note, current studies have demonstrated the potential of some new models to perform the long-term forecasting and to handle the nonlinear issue, such as ETS model,44 long short-term memory neural network (LSTM),9 and neural network nonlinear autoregression (NNAR) model.45 Consequently, further investigations into the predictive performance comparison between the TBATS model and the above models are needed.
Understanding the epidemiological features of infectious diseases is very useful and crucial for their prevention and control.9 In this study, there were reported HFMD cases all the year round in China, and characterized by biennial or triennial larger epidemics in the HFMD incidence. Such an epidemiological feature fits well with earlier reports in mainland China,12,13,46 also coincident in Taiwan of China,47 Singapore,48 Vietnam,11 and Malaysia.49 The possible reasons underlying such an epidemic pattern are first, most people who have been infected with the pathogens of HFMD can develop protective antibodies against the causative agents, leading to a risk reduction in the infection with the same types of pathogens.13 Second, recent work found that the duration of cross-protection infected with the most common two pathogens of CVA16 and EV71 was about 9.95 weeks (95% uncertainty limit 3.31 to 23.40) in 68% of the population, suggesting that such a periodic pattern of HFMD may be related to cross-serotype immunity.12,50 Besides, the additional reasons for the periodic pattern described above are expected to go on. Whilst we also observed that the HFMD incidence exhibited a notable seasonality and dual peak distribution, there were few cases between January and March, a rapid upsurge between April and July, then a reduction in August, and yet a secondary peak in September per year. Such a seasonal behavior was in line with the finding from Singapore,48 Malaysia,49 and most provinces or cities of China (eg, Taiwan, Hong Kong, Ningbo, Shenzhen, Zunyi, Shandong, and Guangdong).22 For the double peak pattern of HFMD, current evidence indicated that it was predominantly seen in southern China,12 in good agreement with the data reported in Hong Kong and Taiwan of China,47,51 and Vietnam,11 whereas inconsistent with the data reported in most regions of northern China,12 where a single peak was predominately seen, this concurs well with the finding from Japan and Malaysia.12,49 The peak activity of HFMD varied by geography, which may be ascribed to the different pathogens,12,49 meteorological factors (such as temperature, atmospheric pressure, precipitation, sunshine hours, humidity, and wind),12,15 and socio-economic differences.12,22 Prior published work discovered that although the leading pathogens of EV71 and CVA16 arise per year in China (which is different from that in Japan and Malaysia where the leading pathogens arise every 3 or 4 years12,49), they are circulated in different peaks.52 The EV71 is mainly associated with the first strong peak behavior, whereas the CVA16 is predominantly associated with the second weak peak activity, and yet these two common pathogens are less circulated in January and February annually, this wholly corroborates with our initial finding that a trough in the HFMD incidence seen between January and March. Another contributory factor correlated with the least reported HFMD cases in February is closely related to the “spring festival effect”, several studies have given well-grounded discussions on how this effect influences the epidemics of infectious diseases.53,54 Further, a projection into the next two years based on the TBATS model showed that albeit there did not seem to have a large amplitude of oscillations compared with the data from 2009 to 2019, the HFMD incidence was still high, and the predicted seasonal patterns match well with our findings described above. Currently, some emerging Enteroviruses, especially Coxsackievirus A6 (CA6),3,14 have been increasing triggers causing HFMD outbreaks, and thus it is a matter of great urgency that the introduction of a multivalent vaccine fusing EV71, CA16 with CA6 to prevent HFMD in addition to the preventions strongly recommended by Saguilet al.24
This study sets out to investigate the flexibility and usefulness of the TBATS model in fitting and forecasting the epidemic patterns of HFMD in China. Importantly, the results to emerge from a series of experiments are encouraging. However, this study also suffers from some drawbacks. First, since HFMD is a self-limiting disease,2 the patients with mild and moderate symptoms may not seek medical assistance, thus leading to under-reporting and under-diagnosis. Second, daily or weekly data may provide a greater investigation into the temporal discrepancies among years. Nonetheless, it is difficult to obtain such data for shorter periods. Third, a high forecasting performance can be achieved when using the TBATS model to nowcast and forecast the temporal levels of the next two years (24 months). Future work should therefore include the new data into the model to ensure its high forecasting accuracy. Lastly, the present results may not be transferable to the conclusion that the TBATS model has superiority in the prediction of HFMD in other regions or other infectious diseases, and additional work is entailed.
Conclusion
The most striking result to emerge from the data is that the TBATS model has the capacity to outperform the most frequently used SARIMA model in decomposing and forecasting the HFMD incidence in China. This model can be recommended as a flexible and useful tool in the decision-making process of HFMD prevention and control. Moreover, the predicted HFMD incidence for the next two years remains still high, considering the new increasing emerging pathogens causing HFMD outbreaks, it is required to curb and harness this urgent issue within the feasible measures taken.
Data Sharing Statement
All data for this work are presented in the results and conclusions or please contact the corresponding author on the reproducibility of this work.
Acknowledgments
We thanked all the people who took part in the gathering of HFMD cases. This study was supported by the Innovation and Entrepreneurship Training Project for University Students of Henan Province and Xinxiang Medical University (S202010472007 and XYXSKYZ201932), the Key Scientific Research Project of Universities in Henan (21A330004), and the National Natural Fund Youth Project (31802024)
Author Contributions
All authors contributed to the conceptualization, data curation, investigation, methodology, project administration, software, validation, visualization, and review of the manuscript, and agreeing to publish this work.
Disclosure
The authors report no conflicts of interest in this work.
References
1. Horsten HH, Kemp M, Fischer TK, Lindahl KH, Bygum A. Atypical hand, foot, and mouth disease caused by coxsackievirus A6 in Denmark: a diagnostic mimicker. Acta Derm Venereol. 2018;98(3):350–354. doi:10.2340/00015555-2853
2. Huang J, Liao Q, Ooi MH, et al. Epidemiology of recurrent hand, foot and mouth disease, China, 2008–2015. Emerg Infect Dis. 2018;24(3):432–442. doi:10.3201/eid2403.171303
3. Li Y, Chang Z, Wu P, et al. Emerging enteroviruses causing hand, foot and mouth disease, China, 2010–2016. Emerg Infect Dis. 2018;24(10):1902–1906. doi:10.3201/eid2410.171953
4. Kimmis BD, Downing C, Tyring S. Hand-foot-and-mouth disease caused by coxsackievirus A6 on the rise. Cutis. 2018;102(5):353–356.
5. Robinson CR, Doane FW, Rhodes AJ. Report of an outbreak of febrile illness with pharyngeal lesions and exanthem: toronto, summer 1957; isolation of group A Coxsackie virus. Can Med Assoc J. 1958;79(8):615–621.
6. Chan LG, Parashar UD, Lye MS, et al. Deaths of children during an outbreak of hand, foot, and mouth disease in sarawak, Malaysia: clinical and pathological characteristics of the disease. For the Outbreak Study Group. Clin Infect Dis. 2000;31(3):678–683. doi:10.1086/314032
7. Fujimoto T, Chikahira M, Yoshida S, et al. Outbreak of central nervous system disease associated with hand, foot, and mouth disease in Japan during the summer of 2000: detection and molecular epidemiology of enterovirus 71. Microbiol Immunol. 2002;46(9):621–627. doi:10.1111/j.1348-0421.2002.tb02743.x
8. Ho M, Chen ER, Hsu KH, et al. An epidemic of enterovirus 71 infection in Taiwan. Taiwan Enterovirus Epidemic Working Group. N Engl J Med. 1999;341(13):929–935. doi:10.1056/nejm199909233411301
9. Wang Y, Xu C, Zhang S, et al. Development and evaluation of a deep learning approach for modeling seasonality and trends in hand-foot-mouth disease incidence in mainland China. Sci Rep. 2019;9(1):8046. doi:10.1038/s41598-019-44469-9
10. Chan KP, Goh KT, Chong CY, Teo ES, Lau G, Ling AE. Epidemic hand, foot and mouth disease caused by human enterovirus 71, Singapore. Emerg Infect Dis. 2003;9(1):78–85. doi:10.3201/eid0901.020112
11. Van Tu P, Thao NTT, Perera D, et al. Epidemiologic and virologic investigation of hand, foot, and mouth disease, southern Vietnam, 2005. Emerg Infect Dis. 2007;13(11):1733–1741. doi:10.3201/eid1311.070632
12. Xing W, Liao Q, Viboud C, et al. Hand, foot, and mouth disease in China, 2008–12: an epidemiological study. Lancet Infect Dis. 2014;14(4):308–318. doi:10.1016/s1473-3099(13)70342-6
13. Tian CW, Wang H, Luo XM. Time-series modelling and forecasting of hand, foot and mouth disease cases in China from 2008 to 2018. Epidemiol Infect. 2019;147:e82. doi:10.1017/S095026881800362X
14. Bian L, Wang Y, Yao X, Mao Q, Xu M, Liang Z. Coxsackievirus A6: a new emerging pathogen causing hand, foot and mouth disease outbreaks worldwide. Expert Rev Anti Infect Ther. 2015;13(9):1061–1071. doi:10.1586/14787210.2015.1058156
15. Gu S, Li D, Lu B, Huang R, Xu G. Associations between ambient air pollution and daily incidence of pediatric hand, foot and mouth disease in Ningbo, 2014–2016: a distributed lag nonlinear model. Epidemiol Infect. 2020;148:e46. doi:10.1017/S0950268820000321
16. World Health Organization. A guide to clinical management and public health response for hand, foot and mouth disease (HFMD). Available from: https://www.who.int/westernpacific/emergencies/surveillance/archives/hand-foot-and-mouth-disease.
17. Zhang YQ, Li XX, Li WB, et al. Analysis and predication of tuberculosis registration rates in Henan Province, China: an exponential smoothing model study. Infect Dis Poverty. 2020;9(1):123. doi:10.1186/s40249-020-00742-y
18. Zhang X, Zhang T, Young AA, Li X. Applications and comparisons of four time series models in epidemiological surveillance data. PLoS One. 2014;9(2):e88075. doi:10.1371/journal.pone.0088075
19. Wang YW, Shen ZZ, Jiang Y. Comparison of ARIMA and GM(1,1) models for prediction of hepatitis B in China. PLoS One. 2018;13(9):e0201987. doi:10.1371/journal.pone.0201987
20. Yin F, Ma Y, Zhao X, et al. The association between diurnal temperature range and childhood hand, foot, and mouth disease: a distributed lag non-linear analysis. Epidemiol Infect. 2017;145(15):3264–3273. doi:10.1017/s0950268817002321
21. Livera AMD, Hyndman RJ. Forecasting time series with complex seasonal patterns using exponential smoothing. J Am Stat Assoc. 2011;106(496):1513–1527. doi:10.1198/jasa.2011.tm09771
22. Zhuang ZC, Kou ZQ, Bai YJ, et al. Epidemiological research on hand, foot, and mouth disease in Mainland China. Viruses. 2015;7(12):6400–6411. doi:10.3390/v7122947
23. Koh WM, Bogich T, Siegel K, et al. The epidemiology of hand, foot and mouth disease in asia: a systematic review and analysis. Pediatr Infect Dis J. 2016;35(10):e285–300. doi:10.1097/inf.0000000000001242
24. Saguil A, Kane SF, Lauters R, Mercado MG. Hand-foot-and-mouth disease: rapid evidence review. Am Fam Physician. 2019;100(7):408–414.
25. Taylor JW. An evaluation of methods for very short-term load forecasting using minute-by-minute British data. Int J Forecast. 2008;24.
26. Taylor JW. Triple seasonal methods for short-term electricity demand forecasting. Eur J Oper Res. 2010;204:139–152. doi:10.1016/j.ejor.2009.10.003
27. Shi F, Yu C, Yang L, et al. Exploring the dynamics of hemorrhagic fever with renal syndrome incidence in east China through seasonal autoregressive integrated moving average models. Infect Drug resistance. 2020;13:2465–2475. doi:10.2147/IDR.S250038
28. Liu K, Li T, Vongpradith A, et al. Identification and prediction of tuberculosis in eastern china: analyses from 10-year population-based notification data in Zhejiang Province, China. Sci Rep. 2020;10(1):7425. doi:10.1038/s41598-020-64387-5
29. Li Z, Wang Z, Song H, et al. Application of a hybrid model in predicting the incidence of tuberculosis in a Chinese population. Infect Drug Resist. 2019;12:1011–1020. doi:10.2147/idr.s190418
30. Liu Q, Li Z, Ji Y, et al. Forecasting the seasonality and trend of pulmonary tuberculosis in Jiangsu Province of China using advanced statistical time-series analyses. Infect Drug Resist. 2019;12:2311–2322. doi:10.2147/idr.s207809
31. Bartholomew D, Box GEP, Jenkins GM. Time Series Analysis: Forecasting and Control.
32. Wang Y, Xu C, Yao S, Zhao Y. Forecasting the epidemiological trends of COVID-19 prevalence and mortality using the advanced α-Sutte Indicator. Epidemiol Infect. 2020;148:e236. doi:10.1017/s095026882000237x
33. Wang Y, Xu C, Ren J, et al. Secular seasonality and trend forecasting of tuberculosis incidence rate in china using the advanced error-trend-seasonal framework. Infect Drug Resist. 2020;13:733–747. doi:10.2147/IDR.S238225
34. Taylor JW. Short-term electricity demand forecasting using double seasonal exponential smoothing. J Oper Res Soc. 2003;54(8):799–805. doi:10.1057/palgrave.jors.2601589
35. Gould PG, Koehler AB, Ord JK, Snyder RD, Hyndman RJ, Vahid-Araghi F. Forecasting time series with multiple seasonal patterns. Eur J Oper Res. 2008;191(1):207–222. doi:10.1016/j.ejor.2007.08.024
36. Bickel PJ, Doksum KA. An analysis of transformation revisited. J Am Stat Assoc. 1981;76(374):209–210. doi:10.1080/01621459.1981.10477649
37. Hyndman R, Athanasopoulos G, Bergmeir C, et al. forecast: forecasting functions for time series and linear models. Available from:https://cran.r-project.org/web/packages/forecast/index.html.
38. Wang Y, Xu C, Zhang S, Wang Z, Zhu Y, Yuan J. Temporal trends analysis of human brucellosis incidence in mainland China from 2004 to 2018. Sci Rep. 2018;8(1):15901. doi:10.1038/s41598-018-33165-9
39. Hyndman RJ, Khandakar Y. Automatic time series forecasting: the forecast package for R. J Stat Softw. 2008;27(3):1–22. doi:10.18637/jss.v027.i03
40. Zheng A, Fang Q, Zhu Y, Jiang C, Jin F, Wang X. An application of ARIMA model for predicting total health expenditure in China from 1978–2022. J Glob Health. 2020;10(1):010803. doi:10.7189/jogh.10.010803
41. Zhang X, Pang Y, Cui M, Stallones L, Xiang H. Forecasting mortality of road traffic injuries in China using seasonal autoregressive integrated moving average model. Ann Epidemiol. 2015;25(2):101–106. doi:10.1016/j.annepidem.2014.10.015
42. Liu L, Luan RS, Yin F, Zhu XP, Lu Q. Predicting the incidence of hand, foot and mouth disease in Sichuan province, China using the ARIMA model. Epidemiol Infect. 2016;144(1):144–151. doi:10.1017/s0950268815001144
43. Box GEP, Cox DR. An analysis of transformations. J Royal Stati Soc. 1964;26(2):211–243. doi:10.1111/j.2517-6161.1964.tb00553.x
44. Wang Y, Xu C, Yao S, et al. Estimating the prevalence and mortality of coronavirus disease 2019 (COVID-19) in the USA, the UK, Russia, and India. Infect Drug Resist. 2020;13:3335–3350. doi:10.2147/idr.s265292
45. Wei S. Improving prediction accuracy of river discharge time series using a Wavelet-NAR artificial neural network. J Hydroinfo. 2012;14(4):974–991. doi:10.2166/hydro.2012.143
46. Ni H, Yi B, Yin J, et al. Epidemiological and etiological characteristics of hand, foot, and mouth disease in Ningbo, China, 2008–2011. J Clin Virol. 2012;54(4):342–348. doi:10.1016/j.jcv.2012.04.021
47. Chen SC, Chang HL, Yan TR, Cheng YT, Chen KT. An eight-year study of epidemiologic features of enterovirus 71 infection in Taiwan. Am J Trop Med Hyg. 2007;77(1):188–191. doi:10.4269/ajtmh.2007.77.188
48. Ang LW, Koh BK, Chan KP, Chua LT, James L, Goh KT. Epidemiology and control of hand, foot and mouth disease in Singapore, 2001–2007. Ann Acad Med Singapore. 2009;38(2):106–112.
49. Podin Y, Gias EL, Ong F, et al. Sentinel surveillance for human enterovirus 71 in Sarawak, Malaysia: lessons from the first 7 years. BMC Public Health. 2006;6:180. doi:10.1186/1471-2458-6-180
50. Takahashi S, Liao Q, Van Boeckel TP, et al. Hand, foot, and mouth disease in china: modeling epidemic dynamics of enterovirus serotypes and implications for vaccination. PLoS Med. 2016;13(2):e1001958. doi:10.1371/journal.pmed.1001958
51. Ma E, Chan KC, Cheng P, Wong C, Chuang SK. The enterovirus 71 epidemic in 2008--public health implications for Hong Kong. Int J Infect Dis. 2010;14(9):e775–780. doi:10.1016/j.ijid.2010.02.2265
52. Liu W, Wu S, Xiong Y, et al. Co-circulation and genomic recombination of coxsackievirus A16 and enterovirus 71 during a large outbreak of hand, foot, and mouth disease in Central China. PLoS One. 2014;9(4):e96051. doi:10.1371/journal.pone.0096051
53. Wei W, Jiang J, Gao L, et al. A new hybrid model using an autoregressive integrated moving average and a generalized regression neural network for the incidence of tuberculosis in Heng County, China. Am J Trop Med Hyg. 2017;97(3):799–805. doi:10.4269/ajtmh.16-0648
54. Wei W, Jiang J, Liang H, et al. Application of a combined model with autoregressive integrated moving average (ARIMA) and generalized regression neural network (GRNN) in Forecasting Hepatitis Incidence in Heng County, China. PLoS One. 2016;11(6):e0156768. doi:10.1371/journal.pone.0156768
 © 2021 The Author(s). This work is published and licensed by Dove Medical Press Limited. The full terms of this license are available at https://www.dovepress.com/terms.php and incorporate the Creative Commons Attribution - Non Commercial (unported, v3.0) License.
By accessing the work you hereby accept the Terms. Non-commercial uses of the work are permitted without any further permission from Dove Medical Press Limited, provided the work is properly attributed. For permission for commercial use of this work, please see paragraphs 4.2 and 5 of our Terms.
© 2021 The Author(s). This work is published and licensed by Dove Medical Press Limited. The full terms of this license are available at https://www.dovepress.com/terms.php and incorporate the Creative Commons Attribution - Non Commercial (unported, v3.0) License.
By accessing the work you hereby accept the Terms. Non-commercial uses of the work are permitted without any further permission from Dove Medical Press Limited, provided the work is properly attributed. For permission for commercial use of this work, please see paragraphs 4.2 and 5 of our Terms.