Back to Journals » Journal of Inflammation Research » Volume 14
TILRR (Toll-like Interleukin-1 Receptor Regulator), an Important Modulator of Inflammatory Responsive Genes, is Circulating in the Blood
Authors Kashem MA, Yuan XY, Li L, Kimani J, Plummer F, Luo M
Received 19 June 2021
Accepted for publication 24 August 2021
Published 24 September 2021 Volume 2021:14 Pages 4927—4943
DOI https://doi.org/10.2147/JIR.S325553
Checked for plagiarism Yes
Review by Single anonymous peer review
Peer reviewer comments 2
Editor who approved publication: Professor Ning Quan
Mohammad Abul Kashem,1– 4 Xin-Yong Yuan,4 Lin Li,2 Joshua Kimani,5 Francis Plummer1 ,† Ma Luo1,2,4
1Department of Medical Microbiology and Infectious Diseases, University of Manitoba, Winnipeg, MB, Canada; 2JC Wilt Infectious Diseases Research Centre, Winnipeg, Mb, Canada; 3Department of Microbiology and Veterinary Public Health, Chittagong Veterinary and Animal Sciences University, Chittagong, Bangladesh; 4National Microbiology Laboratory, Public Health Agency of Canada, Winnipeg, MB, Canada; 5Institute for Tropical and Infectious Diseases, University of Nairobi, Nairobi, Kenya
†In memoriam (passed away on February 4, 2020).
Correspondence: Ma Luo
Department of Medical Microbiology, University of Manitoba, Winnipeg, MB, Canada
Tel +204-789-5072
Fax +204-789-2018
Email [email protected]; [email protected]
Purpose: TILRR (Toll-like interleukin-1 receptor regulator), a variant of FREM1 (Fras-related extracellular matrix 1), is a modulator of many genes in NF-κB (nuclear factor kappa-light-chain-enhancer of activated B cells) signaling and inflammatory responses. It enhanced the expression of multiple genes in the NF-κB signaling pathway and promoted the production of multiple pro-inflammatory cytokines/chemokines. TILRR is an extracellular matrix protein and expressed in cells and tissues, and has never been considered to exist in the blood. The study aimed to identify circulating TILRR protein in human plasma as a biomarker of systemic inflammation.
Methods and Results: We developed a multiplex bead array method (Bio-Plex) using 4 monoclonal antibodies targeting different protein domains of FREM1/TILRR to investigate whether TILRR can be detected in blood plasma. The results of the multiplex bead array method were validated by Western blot analysis of affinity-purified TILRR from patient plasma samples. We subsequently analyzed 640 plasma samples from women enrolled in the Pumwani Sex Worker cohort (PSWC) (Nairobi, Kenya). Our study showed that TILRR exists in all patient plasma samples, but its quantities vary greatly among the patients, ranging from 2.38 ng/mL to 5196.79 ng/mL. The plasma TILRR below 2.38 ng/mL can only be detected by affinity purification and Western blot analysis.
Conclusion: Our in-house developed multiplex bead array method can successfully quantify TILRR protein in plasma samples. Because TILRR is an important modulator of many inflammation-responsive genes, it may be an inflammation biomarker in blood and play a role in modulating systemic inflammation.
Keywords: TILRR, soluble biomarker, human plasma, mouse anti-FREM1 mAbs, multiplex bead array method, Western blot analysis
Introduction
TILRR (Toll-like interleukin-1 receptor regulator), a splice variant of the Fras-related extracellular matrix 1 (FREM1) gene, is involved in the development of pathological abnormalities via aberrant inflammatory reaction.1 It has been identified as a co-receptor of interleukin-1 receptor type 1 (IL-1R1) and is an important regulator of the NF-κB (nuclear factor kappa-light-chain-enhancer of activated B cells) signal transduction pathway and inflammatory responses.2–4 TILRR interacts with the IL-1R1-TIR (toll/IL-1 receptor) complex and enhances the signal transduction by increasing the expression of the IL-1R1 receptor and ligand-binding activities.2,5,6 The association of TILRR with IL-1R1 not only involves expressing receptor complex but also induces the engagement of MYD88 (myeloid differentiation primary response 88) adapter molecule on the cytoplasmic TIR domain leading to the activation of NF-κB signaling pathway and the expression of pro-inflammatory genes.2,3,6 TILRR is expressed in human cervicovaginal epithelial cells, peripheral blood mononuclear cells (PBMCs), including monocytes, and a broad range of human and mouse lymphocytic and mesenchymal cell lines.1,2,6 Recently, we demonstrated that TILRR modulates the expression of many NF-κB inflammation-responsive genes,7 promotes the production of pro-inflammatory cytokines/chemokines, including IL (interleukin)-6, IL-8, IP (interferon gamma-induced protein)-10, and RANTES (regulated on activation, normal T-cell expressed and secreted),7 and induces migration of immune cells (THP-1 and MOLT-4 cells).8 FREM1, in contrast, has been identified as an essential component for embryonic development and involves immune cell migration.6,9 FREM1 gene (encoding 2179 amino acids) has ~15 splice variants,10,11 including TILRR (encoding 715 amino acids).6 As a shorter isoform of FREM1, the transcriptional start site of TILRR is present in an intronic segment between exons 24 to 25 of the FREM1 gene.6,12 Since TILRR is expressed in human epithelial and blood mononuclear cells and involved in inflammatory responses, we hypothesized that TILRR exists as a soluble protein in the human blood plasma and functions as a biomarker of systemic inflammation. To detect TILRR protein in the blood, we developed a multiplex bead array method, and the existence of TILRR protein in the plasma of the women enrolled in the Pumwani sex worker cohort (PSWC) was confirmed by Western blot analysis of affinity-purified TILRR. Because of its importance in modulating many inflammatory responsive genes in the NF-κB signal transduction pathway, TILRR could be a biomarker for systemic inflammation.
Materials and Methods
Study Participants
Women enrolled in the PSWC, Nairobi, Kenya between 1985 and 2008 were the participants of this study. The PSWC is an open prospective cohort established to study the immunobiology and epidemiology of sexually transmitted infections (STIs). The patients enrolled in the cohort have been followed biannually since the cohort establishment in 1985.13 This research cohort also provided services related to STIs and HIV-1 (human immunodeficiency virus type 1) prevention and care, such as consultation, provision of free condoms, and treatment of other infections. All enrolled women were screened for anti-HIV p24 using enzyme immunoassays (EIA). Women who were HIV-1 negative for antibodies on EIA were further confirmed by immunoblot testing. All participants were routinely screened for HIV-1 infection by PCR (polymerase chain reaction) assay.14 The study analyzed 640 available archived HIV-1 negative plasma samples from 316 female sex workers (FSWs) who were HIV negative at the cohort enrollment. If available, HIV-1 negative plasma samples from different visits of the same woman were also included. Out of 316 FSWs, 179 women had only plasma samples from one visit, whereas 137 subjects had plasma samples from more than one visit. The reason for including plasma samples from multiple visits was to investigate the potential variations within the same subjects over time.
Multiplex Bead Array Method for Quantification of TILRR Protein in Blood Plasma
Method Design
The full-length FREM1 (2179 amino acid) contains multiple functional domains: a putative N-terminal signal sequence, 12 chondroitin sulfate proteoglycan (CSPG) tandem repeats, a Calx-β domain, and a unique type C lectin-like (LecC) domain towards the C-terminal region.15 It has two Arg-Gly-Asp (RGD) motifs and two glycosaminoglycan (GAG) attachment sites. FREM1 splice variant, TILRR, is a shortened form of FREM1 (715 amino acid) and contains protein sequence from CSPG domains 10 to the LecC domain (Figure S1A and B).7,16 With 699 of 715 amino acid sequences of TILRR identical to FREM1 except for the 16 amino acids at its N-terminal, it is very difficult to differentiate TILRR from FREM1 except that TILRR is a smaller protein.
We previously developed a panel of mouse monoclonal antibodies (mAbs) to FREM1.16 Of them, some are specific to major epitopes located on CSPG-9, CSPG-10, CSPG-11/12, and Calx-β domains (Table 1). Since TILRR, a shorter variant of full-length FREM1 protein does not have CSPG9, we used a combination of these monoclonal antibodies to differentiate TILRR from FREM1 with a multiplex bead array method. We used mAbs specific to CSPG-9, CSPG-11/12, and Calx-β domains to capture full-length FREM1 protein and TILRR from the plasma, and use the mAb to CSPG-10, which exist in both full-length FREM1 protein and in TILRR, to detect the captured proteins. With a combination of different fluorescent beads conjugated with these mAbs, we can differentiate whether the detected protein is the full-length FREM1 protein or TILRR. Three mAbs (F237G1, F237G3, and F218G4) recognizing different FREM1 domains were used as capture antibodies (Table 1). The mAb F237G1 was used to differentiate full-length FREM1 from TILRR protein because F237G1 targeting epitopes on CSPG9 that only existed in full-length FREM1. The mAb F237G12 was used as a detection antibody. The TILRR protein detection method using four anti-FREM1 mAbs in a multiplex suspension array system is shown in Figure 1.
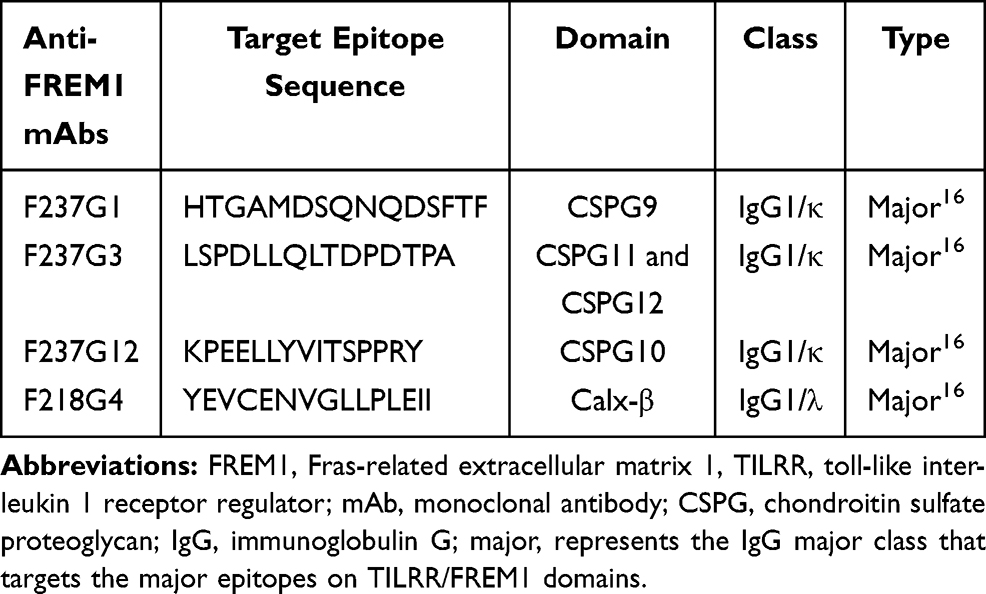 |
Table 1 List of Mouse Anti-FREM1 mAbs Selected for TILRR and Full-Length FREM1 Isoform Measurement in Human Plasma Samples |
 |
Figure 1 TILRR protein detection methods using four mouse anti-FREM1 monoclonal antibodies with multiplex bead array system. F237G3, F218G4, and F237G1 mAbs were used as capture antibodies that coupled with magnetic beads (purple-colored), and F237G12 mAb was used as a detection antibody, which labeled with biotin (red-colored). Both capture and detection antibodies targeted major epitopes on TILRR/FREM1 proteins were formed a sandwich complex that was detected in the Luminex detection system (Bio-Rad, Mississauga, Canada) following the addition of Streptavidin-PE. Note: Adapted from Kashem MA, Li H, Toledo NP, et al. Toll-like Interleukin 1 Receptor Regulator Is an Important Modulator of Inflammation Responsive Genes. Front Immunol. 2019;10(272):1–16.7 Abbreviations: TILLR, toll-like interleukin 1 receptor regulator; FREM1, Fras-related extracellular matrix 1; mAb, monoclonal antibody; RGD, arginine-glycine-aspartic acid; CSPG, chondroitin sulfate proteoglycan; and GAG, glycosaminoglycan; Streptavidin-PE, streptavidin-phycoerythrin. Legends of the figure are mentioned in the bottom and upper left side. |
Coupling of Anti-FREM1 mAbs to Magnetic Beads
In-house developed mouse monoclonal anti-FREM1 IgG antibodies F237G1, F237G3, and F218G4 were coupled to magnetic beads using an amine-coupling kit (Bio-Rad, Mississauga, Canada) according to the manufacturer’s instructions. Briefly, 100 µL of 1.25×10⁶ monodisperse COOH beads with different fluorescent spectrum (34, 36, and 64) were used to couple F218G4, F237G3, and F237G1 mAbs targeting major epitopes on Calx-β, CSPG11-12, and CSPG9 domains in a single coupling reaction, respectively. Stock beads were vortexed for 30 sec, and 100 µL of bead was transferred to a coupling reaction tube (supplied). After 1X wash with PBS (phosphate-buffered saline) pH 7.4, beads were resuspended in 80 µL bead activation buffer and vortexed for 30 sec. Ten microliters of Sulfo-NHS (N-hydroxysulfosuccinimide, 50 mg/mL) and EDAC (1-Ethyl-3-[3-dimethylaminopropyl] carbodiimide, 50 mg/mL) was added to the beads containing activation buffer and incubated for 20 min at room temperature (RT) on a rotor. The beads were washed 1X with PBS pH 7.4 and added each diluted antibody (20 µg, 40 µg, or 60 µg) separately. Beads-antibody mixture was incubated for 2 h at RT on a rotor. After incubation, non-specific binding sites were blocked by using 250 µL blocking buffer for 30 min at RT on a rotor. Using a magnetic separator, supernatants were discarded, and a 500 µL storage buffer was added and vortexed for 20 sec. The storage buffer was carefully removed and 150 µL storage buffer was again added as a final bead volume. Four separate coupling reactions were performed for each antibody with each concentration. All four separate reactions were combined in a single tube and the concentration of coupled beads was estimated using a hemocytometer as previously described.17,18 Coupled beads were stored at 4° C for downstream application.
Detection Antibody Labeling
Anti-FREM1 IgG F237G12 mAb targeting major epitopes on the CSPG10 domain of TILRR was used as a detection antibody. This antibody was biotinylated by using an apex antibody labeling kit (Invitrogen, Toronto, Canada) according to the manufacturer’s instructions. Briefly, the resin inside the labeling tip was settled down at the bottom and hydrated with 100 µL wash buffer using a gel-loading tip. Wash buffer was gently pushed through the tip into a microcentrifuge tube with a syringe (supplied). After washing, 10 µL of diluted F237G12 mAb (20 µg maximum) was slowly pushed through the resin and then added 10 µL Biotin-XX reactive dye mixed with dimethyl sulfoxide (DMSO) and labeling buffer. The reaction mixture was incubated overnight at 4°C. The resin bed was carefully washed 2X with 50 µL wash buffer. Next, 10 µL of neutralization buffer was taken in a clean microcentrifuge tube, and 40 µL of elution buffer was slowly pushed through the resin into the collection tube containing neutralization buffer. The eluted antibody (~50 µL) was mixed gently and stored at 4° C for a maximum of 2 weeks. For longer storage, the buffer in the labeled antibody was exchanged with exchange buffer (PBS pH 7.2 containing 1 mM EDTA [ethylenediaminetetraacetic acid] and 154 mM NaCl) using Amicon(R) Ultra-2 Centrifugal filter with 10K NMWL (nominal molecular weight limit) (Millipore, Oakville, Canada).
Optimization of Coupled Beads, Detection Antibody, and Recombinant FREM1 spD Protein
We optimized the assay condition for the required amount of coupled anti-FREM1 mAb beads using in-house developed recombinant FREM1-specific domain (rFREM1 spD) protein (Figure S1C). Anti-FREM1 mAbs coupled bead stock (~5×10⁶ beads/mL) were diluted together (3-plex; equal concentration) with custom assay buffer (PBS pH 7.2 containing 2 mM EDTA, 150 mM NaCl, and 1% IGEPAL CA-630 [Octylphenoxypolyethoxyethanol; Sigma-Aldrich, Oakville, Canada]) into multiple working concentrations, 1:100, 1:200, 1:400, 1:800, 1:1000, 1:2000, 1:4000 and 1:10,000 dilutions. The rFREM1 spD protein in duplicates was used as a sample for bead optimization assay. The assay was conducted according to the Bio-Rad recommended protocol. Data were checked for some cut-off parameters required to maintain the optimal assay condition, including the number of bead count (≥100 for each bead region), % CV (coefficient of variation) (≤15%), and bead recovery range (70–130%). The results showed that 1:100 bead dilutions (20 µg concentration) were satisfied the cut-off parameters. Next, detection antibody concentration (1–2 µg/mL) was optimized using an optimal bead dilution of 1:100. The detection antibody concentration of 1 µg/mL was satisfied the cut-off parameters.
Additionally, rFREM1 spD protein was optimized using an optimal concentration of captured and detection antibodies. We generated a standard curve by using rFREM1 spD protein for each captured antibody (Figure 2). A fivefold dilution of rFREM1 spD protein (lab ID# F5) was prepared ranges from standard 1 (S1; conc., 10,000 ng/mL) to S7 (conc., 0.64 ng/mL). Each point of diluted rFREM1 spD protein in duplicates was added to the assay plate containing capture beads followed by the addition of detection antibody and streptavidin-PE (Streptavidin-Phycoerythrin; Bio-Rad, Mississauga, Canada). The optimal dilution of rFREM1 spD protein (based on the upper limit of quantification [ULOQ] and lower limit of quantification [LLOQ]) was utilized for all downstream assays to measure TILRR protein from human plasma samples.
 |
Figure 2 Standard curves generated by multiplex bead array using recombinant FREM1 (rFREM1) protein and anti-FREM1 mAbs. rFREM1 spD protein was diluted 5-fold with concentration ranges from 10,000 ng/mL (S1, standard 1) to 0.64 ng/mL (S7, standard 7). Standard curves were generated with three anti-FREM1 mAbs, such as F237G3 (A), F218G4 (B), and F237G1 (C) that coupled with three different fluorescent spectrum beads. As a detection antibody, custom biotinylated anti-FREM1 (F237G12) mAb was used. MFI value for each antibody was graphed against the corresponding observed concentration of each point of rFREM1 spD protein (S1 to S7) where bead recovery ranges were maintained 70–130. Each line represents one replicate. A total of three independent experiments (n=3) were conducted for each antibody (all three antibodies were tested together as a 3-plex). The X-axis indicates the protein concentration (ng/mL) and Y-axis represents the MFI. Abbreviations: FREM1, Fras-related extracellular matrix 1; MFI, mean fluorescent intensity; R, replicate; mAb, monoclonal antibody. |
Preparation of Plasma Samples for the Assay
Archived human plasma samples collected from HIV-1 negative women of PSWC between 1985 and 2008 were used to measure the TILRR protein. Samples were pulled from the −80° C freezer and kept on ice to thaw. The thawed plasma was centrifuged at 10,000×g for 10 min at 4° C to pellet the leftover blood cells along with other solid particles. Supernatants were collected and diluted with custom plasma diluents (PBS pH 7.2 containing 2 mM EDTA, 150 mM NaCl, 1% IGEPAL CA-630, and 20 mM Tris pH 8.0) in a ratio of 1:10. A total of 120 µL samples (12 µL of plasma + 108 µL of sample diluents) were prepared to use in duplicates from each individual. Diluted samples were kept on ice and vortexed for 15 sec before being added to the assay plate.
Measurement of TILRR Protein from Human Plasma Samples
A modified in-house developed cytokine/chemokine measurement protocol was used to measure TILRR in plasma samples.7 The assay was conducted using an in-house developed custom 3-plex anti-FREM1 mAbs panel. Briefly, anti-FREM1 mAbs coupled magnetic beads (50 µL, diluted in PBS pH 7.2 containing 2 mM EDTA, 150 mM NaCl, and 1% IGEPAL CA-630) at 1:100 dilutions were added to the 96-well assay plate. Following 2X washes, 50 µL of diluted plasma (1:10) was added to the wells in duplicates and incubated for 1h at RT on a plate shaker (850±50 rpm). After 3X washes, a 30 µL custom biotinylated secondary detection antibody (1 µg/mL) was added and incubated again for 30 min at RT on a plate shaker. Fifty microliters of streptavidin-PE conjugate (1X) were added following 3X washes, and further incubated for 10 min at RT on a shaker. Finally, 125 µL PBS (pH 7.2) was dispensed into each well, and run the plate in Bio-PlexTM 200 System (Luminex xMAP technology) (Bio-Rad, Mississauga, Canada). For the standard curve, rFREM1 spD protein was diluted into fivefold dilution (S1 to S7), and 50 µL of each dilution was added in duplicates. For blank (background control), 50 µL of dilution buffer (PBS pH 7.2 containing 2 mM EDTA, 150 mM NaCl, and 1% IGEPAL CA-630) was added in duplicates. Bio-Plex software version 6.1 was used to acquire data, which were optimized to calculate the ULOQ (ng/mL) and LLOQ (ng/mL) using logistic-5PL regression analysis with fitness probability ≥ 0.95.
Affinity Purification and Western Blot Analysis Methods for the Validation of TILRR Protein
Cross-Linking of Anti-FREM1 IgG mAb with Protein G Agarose Beads
The cross-linking procedure was performed with modified protocol as described by New England BioLabs Inc.19 After uniform mixing of protein G agarose beads (by inverting the vial several times), 500 µL was taken into a clean 5 mL affinity purification column (ThermoFisher Scientific, Toronto, Canada). The buffers were removed from the beads by gravitational force (end volume obtained 50% bead slurry) and washed twice with 5 mL of 0.1 M sodium phosphate buffer (binding buffer, pH 8.0). Beads were resuspended in 400 µL of binding buffer, and 150 µL of diluted anti-FREM1 F237G12 IgG mAb (100 µg concentrations in binding buffer) was added, mixed gently, and incubated for 30 min at 4° C on a rotor. Following incubation, the buffers were removed and washed 3X with 5 mL of binding buffer. Then, 5 mL of 0.2 M triethanolamine (cross-linking buffer, pH 8.2) was added to the column containing protein G immobilized anti-FREM1 IgG mAb and allowed to drain through the membrane. Washing of protein G immobilized mAb column was repeated for one more time with cross-linking buffer and added 5 mL of 25 mM DMP (dimethyl pimelimidate dihydrochloride) cross-linking reagent (6.5 mg/mL in cross-linking buffer, prepared immediately prior to use). The reaction was mixed gently and incubated at RT for 45 min on the rotor. After incubation, excess buffers were removed, and the beads were washed 1X with 5 mL of 0.1 M ethanolamine (blocking buffer, pH 8.2). The beads were again resuspended in a 5 mL blocking buffer and incubated for 1 h at RT on the rotor. Following a 2X wash with 5 mL PBS pH 7.2, 5 mL elution buffer (0.1 M glycine-HCl, pH 2.5) was added to elute the unlinked anti-FREM1 F237G12 IgG mAbs. Finally, 1 mL of PBS pH 7.2 containing 0.1% Tween 20 and 0.02% sodium azide was added to the cross-linked IgG mAb, and stored at 4° C. Cross-linked anti-FREM1 IgG mAb was used for affinity purification of TILRR protein from plasma samples. The cross-linking procedures of anti-FREM1 F237G12 IgG mAb with protein G agarose beads are shown in Figure S2.
Verification of Anti-FREM1 IgG mAb Cross-Linking Efficiency
Cross-linking efficiency of anti-FREM1 F237G12 IgG mAb with protein G agarose beads was examined by Pierce BCA (bicinchoninic acid) Protein Assay (ThermoFisher Scientific, Toronto, Canada) using filter through (collected from each step of cross-linking procedure) according to the manufacturer’s instructions. Briefly, a set of diluted albumin (bovine serum albumin, BSA) standards was prepared ranges from 25 to 2000 µg/mL concentrations (S1 to S8). The working reagent of BCA was prepared by adding 50 parts of reagent A with 1 part of reagent B (50:1). Each point of diluted standard and unknown filter through samples (10 µL) in duplicates was dispensed into 96-well flat-bottom microtiter plate (ThermoFisher Scientific, Toronto, Canada). Two hundred microliter of BCA working reagent was added, and the plate was covered with plate seal (Bio-Rad, Mississauga, Canada). The plate was gently mixed for 30 sec at RT on a plate shaker (850±50 rpm) and incubated for 30 min at 37° C. Following incubation, the plate was cooled down at RT, and the absorbance was measured at or near 562 nm on SpectraMax M2e plate reader (Molecular Devices, California, USA) using SoftMax version 6.2.2 software. The protein concentration in unknown samples (µg/mL) was automatically calculated based on the standard curve generated by software, where R2 value and coefficient of variation (CV) were maintained at ≥95.0 and <15, respectively.
Affinity Purification of TILRR Protein from Human Plasma Samples
Storage buffer from cross-linked anti-FREM1 F237G12 IgG mAb protein G agarose beads in the column was drained and washed with 5 mL of PBS pH 7.2, and further with 5 mL of 0.1 M sodium phosphate buffer pH 8.0. Four milliliters of 1:4 dilution plasma samples were added to approximately 250 µL bead slurry, mixed gently, and incubated overnight at 4° C on the rotor. Following incubation, the beads were washed five times with 1 mL washing buffer (nuclease free water containing 10 mM Tris HCl [pH 8.0], 1 mM EDTA, 150 mM NaCl, 1% TritonX-100 and protease inhibitor [10 ul per mL]; pH adjusted to 7.4) to remove unbound non-specific proteins. After 5X washes, TILRR protein was eluted from the bead slurry with 250 µL elution buffer (0.2 M glycine-HCl pH 2.5) into a tube containing 250 µL neutralization buffer (1.0 M Tris-HCl, pH 8.0). Elution with 0.2 M glycine-HCl was performed two more times, and all elutes were combined in a single tube. After elution, the bead slurry was neutralized twice with 900 µL bead neutralization buffer (PBS pH 7.2 containing 5 mM EDTA, 0.02% sodium azide, and protease inhibitor [10 ul per mL]). The regenerated IgG cross-linked bead column was stored with 2 mL of PBS pH 7.2 containing 0.02% sodium azide at 4° C. The procedure of affinity purification of TILRR protein is presented in Figure S3.
Removing Plasma Immunoglobulin G (IgG) from Eluted Protein
Because IgG in plasma can bind to the protein G agarose beads that might not be fully cross-linked to the mouse mAb, the plasma IgGs were co-eluted with the affinity-purified TILRR. The plasma IgGs need to be removed from the eluted TILRR proteins. Thus, following affinity purification, human plasma IgG was removed from eluted protein using Protein G agarose beads that were not cross-linked to the mouse antibodies as follows: the eluted protein was diluted with 6 mL of PBS pH 7.2 containing 1 mM EDTA, 154 mM NaCl, and protease inhibitor (10 µL per mL), and went through a human IgG cleaning process. Briefly, 3 mL protein G agarose bead resin was pipetted into a clean 5 mL column, and allowed to drain off buffers by gravitational force. Bead slurry (~50% of the initial volume) was washed twice with 5 mL of sodium phosphate buffer (0.1 M, pH 8.0), and then the diluted protein was slowly added to the column. The protein passed through the agarose beads was collected in a new collection tube and should contain protein with reduced plasma IgG. This process was repeated once more to obtain purified protein without plasma IgG. The final purified protein was concentrated by a 10K Amicon Ultra- 2 centrifugal filter (Millipore, Oakville, Canada) for downstream analysis. The plasma IgG bound to the Protein G agarose beads was eluted with 5 mL of glycine-HCl (0.1 M, pH 2.5) and neutralized with 0.5 mL of Tris HCl (1 M, pH 8.0).
Protein Concentration and Buffer Exchange
Affinity purified protein was concentrated using a 10k Amicon Ultra- 2 centrifugal filter unit (Ultracel- 10K) (Millipore, Oakville, Canada) according to the manufacturer’s recommended protocol. Briefly, a maximum of 2 mL purified protein was loaded into the centrifugal filter at a time and spun at 4000×g for 30 min at 6° C. The buffer in concentrated protein was exchanged twice with 1 mL of 1X PBS pH 7.2 containing 1 mM EDTA, 154 mM NaCl, and protease inhibitor (10 µL in 1 mL buffer). After centrifugation, the filter was inversed into a collection tube and spun at 1000×g for 2 min. The final volume of concentrated protein was adjusted to 300 µL, and Pierce BCA protein assay was used to measure protein concentration. Affinity purified protein was analyzed by Western blot with anti-FREM1 IgG mAbs.
Western Blot Analysis
Western blot analysis of affinity-purified proteins was conducted using a slightly modified method as described elsewhere.7,20 Briefly, Odyssey(R) One-color protein molecular weight marker (LI-COR, P/N: 928–40000) was used as a protein marker (2 µL/lane). Each protein sample was run separately in a precast NuPAGE 4–12% Bis-Tris 1.0 mm x 15 well gel (Thermo Fisher Scientific, Toronto, Canada) for 45 min with 200 V, and then transferred to a nitrocellulose membrane by iBlot transfer (cycle p3 for 7 min). After 1X wash with 5 mL double distilled water (ddH2O) and further with 5 mL of PBS-T (1X PBS pH 7.2 plus 0.1% Tween 20 [Sigma-Aldrich, Oakville, Canada]) for 5 min on a shaker at 60 rpm, the membrane was dried at 37° C for 30 min. The dried membrane was blocked with 5% skim milk (Difco, BD Biosciences, Mississauga, Canada; diluted in PBS-T) for 1 h at RT on a shaker. After the removal of the blocking buffer, the membrane was incubated separately with 20 µg/mL (diluted in PBS-T containing 0.25% BSA [Sigma-Aldrich, Oakville, Canada]) of anti-FREM1 primary mAb (F237G3, F218G4, and F237G1) overnight at 4° C on a shaker (60 rpm). Anti-FREM1 F237G3 and F218G4 mAbs were used to identify TILRR, whereas anti-FREM1 F237G1 mAb was used for full-length FREM1 isoform. After 3X washes with PBS-T, the membrane was probed with IRDye(R) 800CW goat anti-mouse IgG secondary antibody (LI-COR, Nebraska, USA) (at 1:2000 dilution in PBS-T) for 1h at RT on a shaker (60 rpm). The gel was kept covered with aluminum foil to prevent light exposure from the secondary antibody incubation step and onwards. Following 3X washes with PBS-T and a final 1X wash with PBS pH 7.2, the membrane was carefully laid on the clean scanning surface of the Odyssey CLx imager (LI-COR, Nebraska, USA). Before placing the membrane, the glass scanning surface was carefully cleaned with 100% methylene chloride (Fisher Scientific, Toronto, Canada) followed by double distilled water and 50% isopropanol (Fisher Scientific, Toronto, Canada), and dried with lint-free wipes. Image Studio software version 5.0 (Image Acquisition Odyssey CLx) was utilized to obtain the images with the following settings: auto intensity (both 700 and 800 channels), 42 µm scan size with high scan quality, and 0 (zero) mm focal offset. Post-acquisition image analysis for TILRR protein signal intensity was conducted using Image Studio Lite version 5.2. The intensity of both 700 and 800 channels was further manually adjusted to minimize the background effect.
Coomassie Gel Staining
To perform quick visualization of expected ~70 kDa band of affinity-purified TILRR protein in non-transferred and transferred gels, Coomassie gel staining was conducted in parallel using BioSafeTM Coomassie stain (Bio-Rad, Mississauga, Canada) according to the company’s recommended protocol. In brief, after iBlot transfer onto nitrocellulose membrane using iBlot gel transfer device (Invitrogen, Toronto, Canada), the gel was placed in a staining container bearing 200 mL ddH2O and washed 3X with ddH2O for 5 min. Twenty milliliters of BioSafeTM Coomassie stain was added to the staining container following complete removal of ddH2O and incubated for 1 h at RT on a plate shaker with 60 rpm. After 1 h incubation, the Coomassie stain was removed and further rinsed into 200 mL ddH2O for 30 min at RT. The gel was then scanned with Odyssey CLx imaging system (LI-COR, Nebraska, USA) using the auto intensity of 700 channel, 42 µm scan size, high scan quality, and 0.5 mm focal offset. In addition, the gel was kept in fresh 200 mL ddH2O until to conduct gel drying.
Statistical Analysis
Graphical presentation of all data was organized by GraphPad Prism software, version 8.3.0 (GraphPad Software, Inc., California, USA). Western blot and Coomassie blue staining data were analyzed by Image Studio Lite software version 5.2 (https://www.licor.com/bio/image-studio-lite/) (LI-COR, Nebraska, USA). The data were presented as median with interquartile range (IQR) in all tables and figures. The final statistical comparisons conducted using Student’s t-test with 95% CI (confidence interval), all p<0.05 were reported and indicated using asterisks’ *p<0.05, **p<0.01, ***p<0.001, and ****p<0.0001.
Results
Different Quantities of TILRR Proteins are Detected in Human Plasma Samples
We developed a multiplex bead array method (Bio-Plex) to detect TILRR in blood plasma by using a combination of four mAbs targeting different functional domains of full-length FREM1 protein and TILRR (details described in materials/methods). Our design is that the protein captured by mAb F237G1 (targeting epitopes on CSPG9) represents the full-length FREM1 protein, and the proteins captured by mAbs F237G3 and F218G4 (targeting epitopes on CSPG11 and 12, and Calx-β domain, respectively) could be the full-length FREM1 protein and TILRR. Because the CSPG9 domain does not exist in TILRR, the use of F237G1 mAb can differentiate TILRR from full-length FREM1. The quantity of TILRR could be determined by the difference between mAb F237G1 and mAbs of F237G3 and F218G4.
We used the in-house developed multiplex Bead array method to test the existence of soluble TILRR protein in human plasma. We first examined 640 plasma samples collected from women enrolled in PSWC, Nairobi, Kenya, between 1985 and 2008 using this method (detailed demographic characteristics were shown in Table S1). The results showed that the in-house developed method successfully detected TILRR protein in blood plasma, and the quantity of TILRR protein is variable among different individuals. Based on the detection value of F237G3 (CSPG 11 and 12) and F218G4 (Calx-β) mAbs, we classified the plasma samples into 4 different groups as shown in Table 2. Of 640 plasma samples, the TILRR protein was detected by both F237G3 mAb (median [interquartile range, IQR]: 116.36 [73.21–219.27] ng/mL) and F218G4 mAb (median [IQR]: 77.69 [18.61–186.30] ng/mL) in 186 samples with concentration ranges from 0.57 ng/mL to 1449.62 ng/mL. Since the TILRR protein has both CSPG 11/12 and Calx-β domains, we thought that the lower value detected by the two mAbs should be the quantity of the TILRR protein (Table 2, group 1). In addition, 303 (group 2) and 19 (group 3) plasma samples only have detectable value using F237G3 mAb (median [IQR]: 50.36 [35.44–74.08] ng/mL with ranges from 2.38 ng/mL to 5196.79 ng/mL) or F218G4 mAb (median [IQR]: 97.14 [55.18–134.63] ng/mL with ranges from 15.81 ng/mL to 201.08 ng/mL), respectively (Table 2). Also, TILRR was not detected in 132 plasma samples using either F237G3 or F218G4 mAbs (Table 2, group 4). Full-length FREM1 protein was rarely detected in patients’ plasma using F237G1 mAb (data not shown). Thus, these data showed that TILRR protein is indeed present in human blood plasma and their amount is variable among the patients. As TILRR protein was not detected (below the detection limit) in some patients’ plasma and the level of detected TILRR protein was variable among patients, we next examined the TILRR protein in plasma samples by affinity purification and Western blot analysis.
 |
Table 2 TILRR Protein Detection and Quantification in Human Blood Plasma Using the Multiplex Bead Array Method |
Confirmation of TILRR Protein in Human Plasma Samples
To confirm the detected TILRR protein in human plasma using the in-house developed multiplex bead array method, we selected 3 patient plasma samples from each of the 4 classified groups (Table 2) based on the detection values with different mAbs. The TILRR protein was affinity-purified from the selected samples and analyzed by Western blot. The TILRR was probed using anti-FREM1 F237G3 and F218G4 mAbs, and Full-length FREM1 was probed using anti-FREM1 F237G1 mAb. Because F237G3 and F218G4 mAbs can detect both TILRR and FREM1, we can only differentiate TILRR from FREM1 by their protein size with protein molecular weight (MW) marker. TILRR is a ~70 kDa protein, whereas full-length FREM1 is a ~235 kDa protein. The Western blot analysis showed that TILRR protein (a 70 kDa protein) can be detected in all patient plasma samples with variable signal intensity (Figures 3A–D and Figure S4). Even the plasma samples showed no signal using the multiplex bead array method have a 70 kDa band by Western Blot analysis (Figure 3D, Group 4) except that the TILRR protein band intensity is lower. The TILRR protein band intensity was consistent with the quantity of TILRR measured with the multiplex bead array method for the different groups (Figures 3A–D; and tables on the top of Figures 3A–D). Coomassie blue staining showed that the affinity-purified proteins were not completely transferred (especially for group 1) from the gel to the nitrocellulose membrane (Figures 3A–D and Figure S5). The protein band intensity (~70 kDa) of group 1 plasma is much stronger than the other groups following Coomassie blue staining (Figure 3A). Thus, although Western blot validated the presence of TILRR in the blood plasma, it cannot provide accurate quantification of the protein since a high proportion of proteins could not be transferred to the nitrocellulose membrane. F237G1 mAb (binds with epitopes on CSPG9 of FREM1) was used to detect the full-length FREM1 by Western blot; no band of ~235 kDa (the expected size of full-length FREM1 protein) was detected (Figure S6). Thus, only TILRR protein (70 kDa) and other FREM1 variants (either <70 kDa or >70 kDa) are present in the human plasma samples. Other variants of FREM1 have not been consistently detected in all plasma samples examined. The role of these FREM1 protein variants in host inflammatory response could be interesting studies in the future.
 |
Figure 3 Western blot and Coomassie blue staining confirmation of purified TILRR protein from human blood plasma after affinity purification. The tables on the top of the figures show the amount of TILRR protein quantified by multiplex bead array using plasma samples from groups 1–4 (Table 2). (A–D) Affinity purified TILRR protein from human blood plasma was analyzed by Western blot (left, green color) and Coomassie blue staining of NuPAGE gel after iBlot transfer, showing the untransferred protein (right, red color) in Group 1 (A), Group 2 (B), Group 3 (C), and Group 4 (D). Each group shows data from 3 patients (n=3). Top panels (left) of figures A-D show the Western blot bands (green color) for TILRR protein (cropped) detected by two different anti-FREM1 IgG mAbs (F237G3 and F218G4) (full-length un-cropped blot images are shown in Figure S4). Top panels (right) of figures A-D show the protein bands in the gel after Coomassie blue staining (red color) (cropped); Full-length un-cropped gels are shown in Figure S5. The corresponding TILRR protein (R.F.U) for each patient is shown in the bar graph beneath the cropped blots and gels. Western blot and Coomassie blue staining images were acquired by Odyssey CLx imaging system (LI-COR, USA) with auto channels (both 700 and 800), 42 µm resolution, high image quality, and 0 mm focal offset for blots and 0.5 mm focal offset for gels. The X-axis of all figures indicates the patients’ identification number and Y-axis shows the TILRR protein (R.F.U). Abbreviations: TILLR, toll-like interleukin 1 receptor regulator; FREM1, Fras-related extracellular matrix 1; mAb, monoclonal antibody; ND, Not detected; kDa, kiloDalton; RFU, relative fluorescence units. Legends on the top right corner of figure B show the assay techniques. |
Based on the data of multiplex bead array analysis and Western blot analysis, we conclude that TILRR protein exists in the plasma of all patients (Table 3). Based on the Western blot results, we revised our assessment on the TILRR protein level in human plasma samples (Table 4). We conclude that TILRR protein presents in the blood plasma of all patients and its level varies greatly among the patients, ranges from 2.38 ng/mL to 5196.79 ng/mL. The highest level of TILRR protein was observed in group 1 (median [IQR]: 143.74 [76.69–247.73] ng/mL). In this group, TILRR protein can be detected by both F237G3 and F218G4 mAbs, and the highest detection value among these two mAbs should be the level of TILRR in blood plasma. The TILRR protein level of group 3 is determined with F218G4 mAb (median [IQR]: 97.14 [55.18–134.63] ng/mL, second-highest level), and the one for group 2 is determined with F237G3 mAb (median [IQR]: 50.36 [35.44–74.08] ng/mL, lowest level) (Figure 4A).
 |
Table 3 TILRR Protein Detection and Confirmation in Human Blood Plasma by the Multiplex Bead Array Method and Western Blot Analysis |
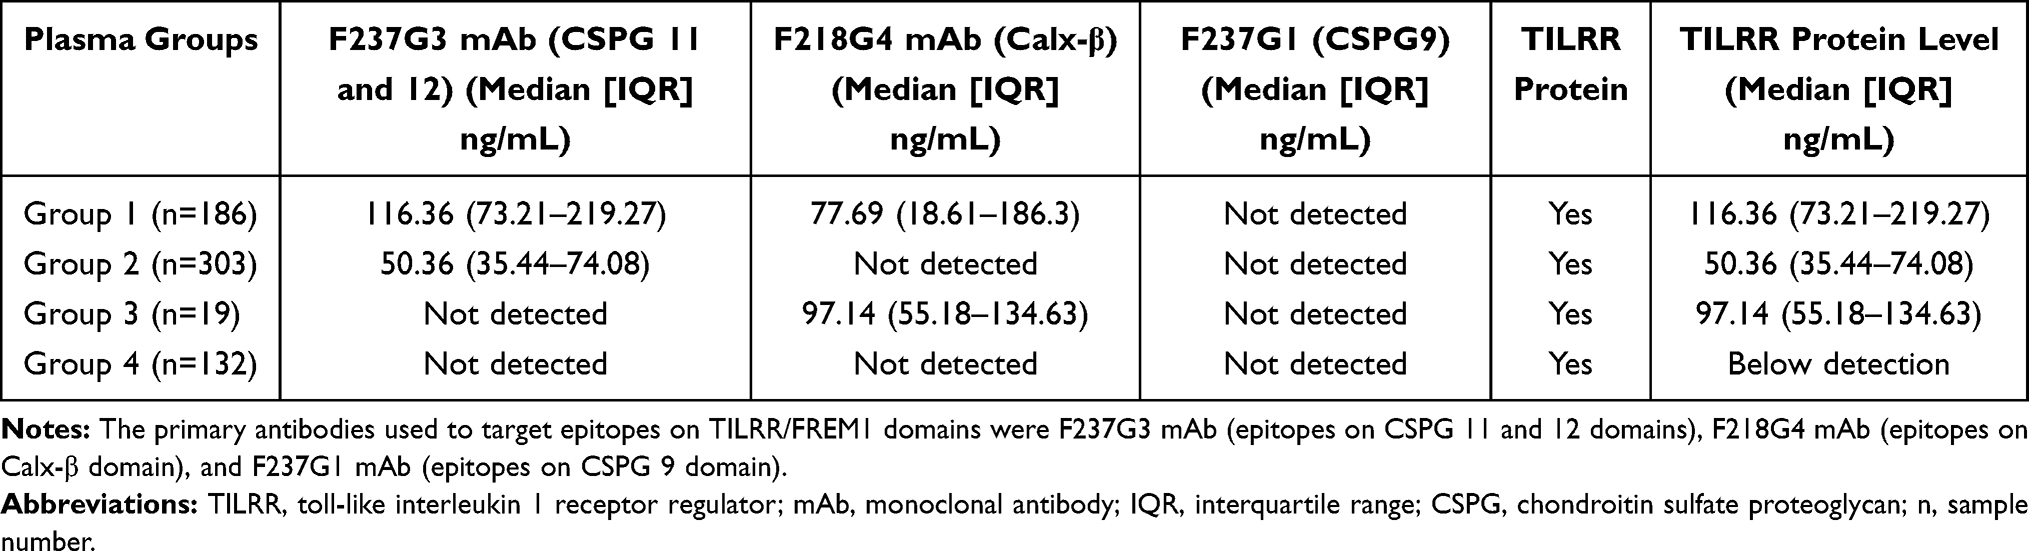 |
Table 4 TILRR Protein Detection and Quantification in Human Blood Plasma by the Multiplex Bead Array Method (After Western Blot Analysis) |
 |
Figure 4 Variable quantity and the detection frequency of TILRR protein in human plasma samples. (A) The level of TILRR protein detected by anti-FREM1 mAbs (F237G3 and F218G4) among plasma groups 1–4 (n=640) (as classified in Table 2) is shown (median with interquartile range [IQR]). In the case of group 1 (n=186), both anti-FREM1 mAbs (F237G3 and F218G4) detected the TILRR protein in blood plasma, thus the higher detection value between these two mAbs was plotted (plasma group 1). In the case of groups 2 (n=303) and 3 (n=19), TILRR protein was only detected by F237G3 mAb (group 2) and F218G4 mab (group 3), respectively. TILRR was detected neither by F237G3 mAb nor by F218G4 mAb in group 4 (below the detection limit, n=132). Thus, the data for group 4 was plotted as 0 (zero). F237G3 mAb targets epitopes on CSPG11 and 12 domains of FREM1/TILRR protein. F218G4 mAb binds epitopes on the Calx-β domain of FREM1/TILRR protein. (B) The detection frequency of TILRR protein among plasma groups 1–4 (n=640). As plasma group 4 (n=132) did not show TILRR protein detection by multiplex bead array method, the detection frequency for group 4 showed as 0 (zero)%. For groups 1–3, the detection frequency was calculated based on the total detected samples (n=508; group 1 [n=186], group 2 [n=303] and group 3 [n=19]). The sample dilution buffer was used as a negative control. Since the control buffer did not provide any data (below the lower limit of detection), the negative control condition is not shown in the figures. Statistical comparisons were conducted using a Student’s t-test with 95% CI (confidence intervals), all p<0.05 were reported and indicated using asterisks’ ****p<0.0001. The X-axis of both figures A and B show the plasma groups, whereas the Y-axis of figures A and B indicates the TILRR protein concentration (ng/mL) and detection frequency (%), respectively. Abbreviations: TILLR, toll-like interleukin 1 receptor regulator; FREM1, Fras-related extracellular matrix 1; mAb, monoclonal antibody; CSPG, chondroitin sulfate proteoglycan; n, sample. |
Next, we analyzed the detection frequency of TILRR protein among 640 plasma samples to determine whether the detection frequency is correlated to the level of TILRR protein in different groups (Figure 4B). Since TILRR could not be detected using the multiplex bead array system for group 4 plasma samples, we calculated the frequency (%) for groups 1–3. Based on the defined groups in Table 2, group 2 is the highest with a detection frequency of 59.65% (303/508), followed by group 1 (36.61%, 186/508), and group 3 (3.74%, 19/508). Thus, the level of TILRR protein is not correlated with the detection frequency in patients’ groups 1–3. Although patient group 4 showed no TILRR detection by the multiplex bead array method, Western blot analysis confirmed that this group of patients also carries TILRR in their blood plasma. Therefore, we considered group 4 as the lowest TILRR protein expression group in this study.
Validation of in-House Developed Multiplex Bead Array Method for Plasma TILRR Quantification
In-House Developed Multiplex Bead Array Method Detected and Quantified Added Recombinant FREM1 spD Proteins
To investigate whether the in-house developed multiplex bead array method accurately quantified TILRR in plasma samples, the plasma samples from different groups (as classified in Table 2) were spiked with rFREM1 spD protein. Quantification of the rFREM1 spD protein in these plasma samples will validate the in-house developed method. The data demonstrated that the multiplex bead array method successfully detected and quantified the spiked rFREM1 spD in these plasma samples (Figure 5A, Table 5). Thus, the in-house developed multiplex bead array method can successfully measure TILRR proteins in most patient samples as indicated in Table 2.
 |
Table 5 Validation of the Detection Efficiency of the in-House Developed Multiplex Bead Array Assay |
 |
Figure 5 TILRR protein quantified in plasma samples after spiked with rFREM1 spD and affinity purification using the multiplex bead array method. (A) TILRR protein of plasma samples (n=3 from each of plasma groups 1–4 in Table 2) spiked with rFREM1 spD protein (conc. 106.58 ng/mL). (B) Quantification of affinity-purified TILRR protein (after removal of plasma IgG) obtained from plasma samples of different groups (groups 1–4 in Table 2) (n=3 for each group). The input volume of affinity-purified protein was adjusted based on the amount of plasma samples used for the multiplex bead array method. The sample dilution buffer was used as a negative control. As the control buffer did not show any data value (below the lower limit of detection), the negative control condition is not shown in the figures. The data presented as mean±SEM of three independent samples. Legends on the top of figure A represent the experimental conditions. The X-axis of both figures A and B indicated the defined groups and the Y-axis represented protein concentration (ng/mL). Abbreviations: TILLR, toll-like interleukin 1 receptor regulator; FREM1, Fras-related extracellular matrix 1; rFREM1, recombinant FREM1; spD, specific domain; SEM, standard error of the mean. |
Next, we examined whether the multiplex bead array method can effectively measure the purified TILRR protein from different plasma groups as categorized in Table 2. We used the multiplex bead array method to quantify the affinity-purified protein (the volume of affinity-purified protein was adjusted based on the input volume of plasma samples used in the multiplex bead array method). The results demonstrated that TILRR was detected in the affinity-purified protein of all plasma groups including group 4, which was undetectable by the multiplex bead array method before conducting affinity purification (Figure 5B). The reason for plasma TILRR detection by the multiplex bead array method in plasma group 4 after affinity purification could be due to that the antibody-specific epitopes of TILRR are accessible to the mAbs in the purified TILRR solution, while in plasma samples the antibody-specific epitopes might be blocked by other proteins. Taken together, these data suggested that the low limit of TILRR detection using the in-house developed multiplex bead array method was at the level of ≥2.38 ng/mL in human plasma samples.
TILRR Protein Purified by Affinity Purification with Anti-FREM1 F237G12 IgG mAb
To verify whether the agarose beads cross-linked with anti-FREM1 F237G12 IgG mAb captured FREM1 variants including TILRR in human plasma, we spiked patient plasma samples with rFREM1 spD protein. After affinity purification, Western blot analysis was conducted. The results showed that only a ~57 kDa band was observed in rFREM1 spD protein alone, whereas both 70 kDa and ~57 kDa sized protein were found in patients’ plasma samples spiked with rFREM1 spD protein (Figure 6A and Figure S7A). Intriguingly, the plasma sample itself without the added rFREM1 spD protein had also a ~57 kDa-sized protein in addition to the 70 kDa TILRR protein (Figure 6A and Figure S7A). Additionally, Coomassie blue staining showed that the remaining proteins in the gel had also strong signal intensity for both ~57 kDa and 70 kDa proteins in all conditions (Figure 6B and Figure S7B). Overall, the plasma samples with spiked rFREM1 spD protein demonstrated higher signal intensity for ~57 kDa protein compared to the rFREM1 spD alone and plasma itself (Figures 6C–D). Thus, this study confirmed that agarose beads cross-linked with anti-FREM1 F237G12 IgG mAb can efficiently capture TILRR protein or other minor variants of FREM1 from patients’ plasma.
 |
Figure 6 Western blot and Coomassie blue confirmation of TILRR protein in plasma samples spiked with rFREM1 spD and following affinity purification. The plasma sample (1 mL) was spiked with rFREM1 spD (106.58 ng/mL) in a single tube. In parallel, the plasma sample alone, and rFREM1 spD alone were separately taken into the tubes. The final volume of all samples was adjusted to 4 mL (1:4 dilution), and the concentration of spiked rFREM1 spD protein was adjusted similar to the concentration of TILRR protein (median) in the patient’s plasma observed by the multiplex bead array method. Affinity purification (AP) was conducted by cross-linked anti-FREM1 F237G12 IgG mAb. (A) Western blot confirmation of ~57 kDa rFREM1 spD protein (cropped; Full-length un-cropped bot is shown in Figure S7A). The bar graph underneath the cropped blot shows the corresponding protein intensity (R.F.U) for only ~57 kDa protein. (B) Coomassie blue staining of ~57 kDa rFREM1 spD protein (cropped; the full-length un-cropped gel is shown in Figure S7B). The bar graph underneath the cropped gel shows the corresponding rFREM1spD protein intensity (R.F.U) for ~57 kDa protein. TILRR protein intensity (R.F.U) with bar graph for 70 kDa protein is not shown. C-D) Plasma samples with spiked rFREM1 spD protein (R.F.U) compared to the rFREM1 spD alone and plasma alone following Western blot analysis (C) and Coomassie blue staining (D) (n=2). Western blot and Coomassie blue staining images were acquired by Odyssey CLx imaging system (LI-COR, USA) with auto channels (both 700 and 800), 42 µm resolution, high image quality, and 0 mm focal offset for blots and 0.5 mm focal offset for gels. Abbreviations:TILLR, toll-like interleukin 1 receptor regulator; FREM1, Fras-related extracellular matrix 1; rFREM1, recombinant FREM1; spD, specific domain; mAb, monoclonal antibody; kDa, kiloDalton; RFU, relative fluorescence units. |
Discussion
Using in vitro and in vivo models, we and others have previously shown that IL-1R1 co-receptor TILRR is an important modulator of the NF-κB signaling pathway and aberrant inflammatory responses.1,2,4,7 Despite the role of TILRR in the NF-κB signal transduction pathway, it is unknown whether TILRR exists as a soluble form in human blood plasma. We used an in-house developed multiplexed bead array method and Western blot analysis and confirmed that TILRR indeed exists as a soluble protein in patient plasma samples enrolled in PSWC.
Although the amino acid sequence of TILRR is mostly identical to FREM1, we showed that we can differentiate TILRR from the full-length FREM1 protein and quantify its concentration in blood plasma using a combination of monoclonal antibodies recognizing epitopes on different protein domains of FREM1. The multiplexed bead array TILRR quantification method has been validated by affinity purification combined with Western blot analysis.
Our study showed that TILRR protein is present in all blood plasma samples examined, but its quantities vary greatly among the patients, ranging from 2.38 ng/mL to 5196.79 ng/mL among 640 plasma samples from 316 patients. The multiplexed bead array method can detect and quantify plasma TILRR as low as 2.38 ng/mL. The plasma TILRR below this amount can only be detected by affinity purification and Western blot analysis.
The demographic data of study subjects showed that the STIs and the use of oral contraceptives at the sample collection appear not significantly different among the women in different plasma groups (Table S1) as defined by TILRR protein detection (Tables 3–4). STIs were considered positive when patients were diagnosed with any one of the following disease conditions: gonorrhea, syphilis, chlamydial infection, and bacterial vaginosis. The factors influencing TILRR protein level in plasma samples would be an interesting question for future studies.
Our study is to establishing a method to quantify the existence of TILRR protein in the blood plasma and trying to avoid the interference of HIV-1 infection. However, we cannot exclude other factors that may potentially influence the level of TILRR protein in blood plasma. Establishing a method for quantifying the level of TILRR in blood plasma will help future investigations of factors influencing the level of TILRR protein in plasma and the role of TILRR protein in systemic inflammation.
Because host immune response and inflammation play an important role in the pathogenesis of infectious pathogens,21 including HIV22 and Severe Acute Respiratory Syndrome Coronavirus-2 (SARS-CoV-2),23 studying the role of TILRR as a soluble biomarker of systemic inflammation in the pathogenesis of viral infection using our in-house developed method could be important.
Conclusions
TILRR exists as a soluble protein in human blood plasma that can be quantified by using our in-house developed multiplexed bead array method with in-house developed anti-FREM1 mAbs and rFREM1 spD protein as a standard. We, for the first time, demonstrated that TILRR is circulating in the blood and may be an important biomarker of systemic inflammatory responses, and warrants further research.
Technical Notes
The following should be practiced to quantify TILRR protein in human blood plasma using the multiplex bead array method.
- There were no additional benefits of using a higher concentration (>20 µg) of anti-FREM1 mAbs to couple the magnetic beads. Among 3 different concentrations of primary anti-FREM1 mAbs we used, 20 µg of mAb coupled magnetic beads showed better detection efficiency in our experimental setting. The possible reason could be due to the available binding sites on magnetic beads that can only bind a certain amount of IgG mAbs. The amount of >20 µg of mAbs should saturate the 100 µL beads (1.25 x10⁶). Thus, more antibodies to couple the beads will not improve the detection efficiency.
- The 1 µg/mL biotinylated detection antibody worked better than the higher concentration (2 µg/mL) of detection antibody.
- Inter- and intra-assay variations: Specific attention should be paid to minimize inter- and intra-assay percentage coefficient of variation (% CV). We maintained Bio-Rad recommended % CV between inter- and intra-assays during the optimization of methods, which was <15%.
- We observed plasma IgGs in the affinity-purified TILRR proteins. The possible reason for having plasma IgGs in affinity-purified protein could be due to the free-binding sites on protein G agarose beads that were not completely cross-linked with the Fc region of added anti-FREM1 IgG (0.2 mg/mL). Since the binding capacity of Pierce Protein G agarose beads ranges from 11 to 15 mg/mL of resin, the free-binding sites on protein G agarose beads could bind plasma IgGs during the overnight incubation of the affinity purification process. We had to remove the plasma IgGs after affinity purification.
- Cross-linked anti-FREM1 mAb with agarose beads could deteriorate over time. Thus, it is important to use freshly coupled beads during affinity purification of TILRR protein from plasma samples.
- The container used for Coomassie blue staining should not be used, in any steps, for primary or secondary antibody incubations in Western blotting because Coomassie blue gives high background signals in the Odyssey imaging system (LI-COR). If needed, the containers must be cleaned with 100% Methanol/Methylene Chloride (Fisher Scientific, Catalog# D151-1) followed by 3X washes with ddH2O.
- After the acquisition of the image by the Odyssey imaging system, the image should be optimized to reduce the background effects for each channel (700 and 800 channels).
- Other factors could influence detection sensitivity in Bio-Plex assays, such as 1) variations of assay buffers; 2) biotinylation efficiency of the detection antibody (should biotinylate the required amount of antibodies for all assays, instead of multiple batches); 3) minimizing freeze-thaw of antibodies, plasma, and purified proteins; 4) minimizing pipetting variations (should always use calibrated pipette), and 5) handling of samples (should always keep them on ice).
Abbreviations
BCA, Bicinchoninic Acid; BSA, Bovine serum albumin; CI, Confidence interval; CSPG, Chondroitin Sulfate Proteoglycan; CV, Coefficient of variation; DMP, Dimethyl Pimelimidate Dihydrochloride; EIA, Enzyme immunoassay; FREM1, Fras-related extracellular matrix 1; GAG, glycosaminoglycan; HIV, Human immunodeficiency virus; IgG, Immunoglobulin G; IL-1R1, Interleukin-1 receptor type 1; IQR, Interquartile range; kDa, KiloDalton; LecC, C-type lectin; mAb, Monoclonal Antibody; PBMCs, Peripheral blood mononuclear cells; PCR, Polymerase chain reaction; PSWC, Pumwani sex worker cohort; rFREM1, Recombinant FREM1; RFU, Relative fluorescence units; RGD, Arginine-glycine-aspartic acid; STIs, Sexually transmitted infections; TILRR, Toll-like interleukin 1 receptor regulator; WB, Western blot.
Ethics Approval and Informed Consent
This study was guided by the Helsinki Declaration on ethical principles for medical research involving human subjects. Ethics approval to conduct this study using human plasma samples was obtained from the University of Manitoba and the University of Nairobi/Kenyatta National Hospital Ethics Committee (KNH/ERC/R/169). All enrolled subjects gave written informed consent to participate in the study.
Acknowledgments
We thank Dr. Guillaume Poliquin, The Acting Director-General, National Microbiology Laboratory (NML), Manitoba, Canada, for his support to conduct this study. We acknowledge and thank NML, Canada for financial support.
Author Contributions
FAP and ML acquired funding; MAK and ML conceived and designed the research; MAK and LL performed the research; MAK analyzed the data; JK coordinated the plasma sample collection and shipment; ML supervised the research; X-YY provided reagents; MAK wrote the manuscript; LL and ML edited the manuscript; MAK revised, formatted and submitted to the journal. All authors contributed to data analysis, revising the manuscript, have agreed on the journal to which the manuscript will be submitted, gave final approval of the version to be published, and agree to be accountable for all aspects of the work.
Funding
The study was funded by an operating grant from the Canadian Institutes of Health Research (CIHR), operating grant- PA: CHVI Vaccine Discovery and Social Research (http://www.cihr-irsc.gc.ca/e/193.html).
Disclosure
Mr Mohammad Kashem reports a patent 82402-323P/MRW pending; Dr Xin-Yong Yuan reports a patent TILRR modulate inflammation gene pending to 325553; Dr Ma Luo reports a patent US Provisional Application 63/067951 pending. The authors declare that they have no other competing interests in this work.
References
1. Smith SA, Samokhin AO, Alfadi M, et al. The IL-1RI Co-Receptor TILRR (FREM1 Isoform 2) Controls Aberrant Inflammatory Responses and Development of Vascular Disease. JACC Basic Transl Sci. 2017;2(4):398–414.
2. Zhang X, Shephard F, Kim HB, et al. TILRR, a novel IL-1RI co-receptor, potentiates MyD88 recruitment to control Ras-dependent amplification of NF-kappaB. J Biol Chem. 2010;285(10):7222–7232. doi:10.1074/jbc.M109.073429
3. Zhang X, Pino GM, Shephard F, Kiss-Toth E, Qwarnstrom EE. Distinct control of MyD88 adapter-dependent and Akt kinase-regulated responses by the interleukin (IL)-1RI co-receptor, TILRR. J Biol Chem. 2012;287(15):12348–12352. doi:10.1074/jbc.C111.321711
4. Mac Gabhann F. TILRR Steers Interleukin-1 Signaling: co-Receptor Provides Context and a Therapeutic Target. JACC Basic Transl Sci. 2017;2(4):415–417. doi:10.1016/j.jacbts.2017.06.001
5. Rhodes DM, Smith SA, Holcombe M, Qwarnstrom EE. Computational Modelling of NF-kappaB Activation by IL-1RI and Its Co-Receptor TILRR, Predicts a Role for Cytoskeletal Sequestration of IkappaBalpha in Inflammatory Signalling. PLoS One. 2015;10(6):e0129888. doi:10.1371/journal.pone.0129888
6. Kashem MA, Li H, Liu LR, et al. The Potential Role of FREM1 and Its Isoform TILRR in HIV-1 Acquisition through Mediating Inflammation. Int J Mol Sci. 2021;22:15. doi:10.3390/ijms22157825
7. Kashem MA, Li H, Toledo NP, et al. Toll-like Interleukin 1 Receptor Regulator Is an Important Modulator of Inflammation Responsive Genes. Front Immunol. 2019;10(272):1–16. doi:10.3389/fimmu.2019.00272
8. Kashem MA, Ren X, Li H, et al. TILRR Promotes Migration of Immune Cells Through Induction of Soluble Inflammatory Mediators. Front Cell Dev Biol. 2020;8(563):1–13. doi:10.3389/fcell.2020.00563
9. Li HN, Li XR, Lv ZT, Cai MM, Wang G, Yang ZF. Elevated expression of FREM1 in breast cancer indicates favorable prognosis and high-level immune infiltration status. Cancer Med. 2020.
10. Thierry-Mieg D, Thierry-Mieg J. AceView: a comprehensive cDNA-supported gene and transcripts annotation. Genome Biol. 2006;7 Suppl 1:S12 11–14.
11. NCBI. The AceView genes 2012; Available from: https://www.ncbi.nlm.nih.gov/IEB/Research/Acembly/.
12. Hudson RC, Gray C, Kiss-Toth E, Chico TJ, Qwarnstrom EE. Bioinformatics Analysis of the FREM1 Gene-Evolutionary Development of the IL-1R1 Co-Receptor, TILRR. Biology. 2012;1(3):484–494.
13. Plummer FA, Simonsen JN, Cameron DW, et al. Cofactors in male-female sexual transmission of human immunodeficiency virus type 1. J Infect Dis. 1991;163(2):233–239. doi:10.1093/infdis/163.2.233
14. Fowke KR, Nagelkerke NJ, Kimani J, et al. Resistance to HIV-1 infection among persistently seronegative prostitutes in Nairobi, Kenya. Lancet. 1996;348(9038):1347–1351. doi:10.1016/S0140-6736(95)12269-2
15. Kiyozumi D, Osada A, Sugimoto N, et al. Identification of a novel cell-adhesive protein spatiotemporally expressed in the basement membrane of mouse developing hair follicle. Exp Cell Res. 2005;306(1):9–23. doi:10.1016/j.yexcr.2005.01.020
16. Yuan XY, Liu LR, Krawchenko A, et al. Development of monoclonal antibodies to interrogate functional domains and isoforms of FREM1 protein. Monoclon Antib Immunodiagn Immunother. 2014;33(2):129–140. doi:10.1089/mab.2013.0058
17. Cadena-Herrera D, Esparza-de Lara JE, Ramirez-Ibanez ND, et al. Validation of three viable-cell counting methods: manual, semi-automated, and automated. Biotechnol Rep. 2015;7:9–16. doi:10.1016/j.btre.2015.04.004
18. Louis KS, Siegel AC. Cell viability analysis using trypan blue: manual and automated methods. Methods Mol Biol. 2011;740:7–12.
19. New England BioLabs I. Cross-linking of IgG to Protein A or G Beads. Available from: https://international.neb.com/protocols/0001/01/01/cross-linking-of-igg-to-protein-a-or-g-beads.
20. Li H, Nykoluk M, Li L, et al. Natural and cross-inducible anti-SIV antibodies in Mauritian cynomolgus macaques. PLoS One. 2017;12(10):e0186079. doi:10.1371/journal.pone.0186079
21. Bhattacharyya S. Inflammation During Virus Infection: swings and Roundabouts. In: Bramhachari PV, editor. Dynamics of Immune Activation in Viral Diseases. Singapore: Springer; 2020:43–59.
22. Deeks SG, Tracy R, Douek DC. Systemic effects of inflammation on health during chronic HIV infection. Immunity. 2013;39(4):633–645. doi:10.1016/j.immuni.2013.10.001
23. Garcia LF. Immune Response, Inflammation, and the Clinical Spectrum of COVID-19. Front Immunol. 2020;11:1441. doi:10.3389/fimmu.2020.01441
 © 2021 The Author(s). This work is published and licensed by Dove Medical Press Limited. The
full terms of this license are available at https://www.dovepress.com/terms
and incorporate the Creative Commons Attribution
- Non Commercial (unported, 3.0) License.
By accessing the work you hereby accept the Terms. Non-commercial uses of the work are permitted
without any further permission from Dove Medical Press Limited, provided the work is properly
attributed. For permission for commercial use of this work, please see paragraphs 4.2 and 5 of our Terms.
© 2021 The Author(s). This work is published and licensed by Dove Medical Press Limited. The
full terms of this license are available at https://www.dovepress.com/terms
and incorporate the Creative Commons Attribution
- Non Commercial (unported, 3.0) License.
By accessing the work you hereby accept the Terms. Non-commercial uses of the work are permitted
without any further permission from Dove Medical Press Limited, provided the work is properly
attributed. For permission for commercial use of this work, please see paragraphs 4.2 and 5 of our Terms.