Back to Journals » International Journal of Nanomedicine » Volume 17
Thermosensitive Tri-Block Polymer Nanoparticle-Hydrogel Composites as Payloads of Natamycin for Antifungal Therapy Against Fusarium Solani
Authors Sha X, Chan L, Fan X, Guo P, Chen T, Liu L ![]() , Zhong J
, Zhong J ![]()
Received 10 August 2021
Accepted for publication 7 March 2022
Published 28 March 2022 Volume 2022:17 Pages 1463—1478
DOI https://doi.org/10.2147/IJN.S332127
Checked for plagiarism Yes
Review by Single anonymous peer review
Peer reviewer comments 5
Editor who approved publication: Dr Mian Wang
Xiaoyuan Sha,1 Leung Chan,1 Xiaoyi Fan,2 Penghao Guo,3 Tianfeng Chen,1 Lian Liu,1 Jingxiang Zhong1,4
1Department of Ophthalmology, The First Affiliated Hospital, and Department of Chemistry, Jinan University, Guangzhou, People’s Republic of China; 2Department of Clinical Laboratory, The First Affiliated Hospital of Jinan University, Guangzhou, People’s Republic of China; 3Department of Clinical Laboratory, The First Affiliated Hospital, Sun Yat-sen University, Guangzhou, People’s Republic of China; 4Department of Ophthalmology, The Sixth Affiliated Hospital, Jinan University, Dongguan, People’s Republic of China
Correspondence: Lian Liu; Tianfeng Chen, Department of Ophthalmology, The First Affiliated Hospital of Jinan University; Department of Chemistry, Jinan University, 601 Huangpu Road, Guangzhou, 510632, People’s Republic of China, Email [email protected]; [email protected]
Purpose: Fusarium Solani is the principal pathogen associated with fungal keratitis. As a sensitive drug to F. Solani, natamycin (NAT) was limited by the poor penetration and low bioavailability in clinical application. The aim of this study was to develop a new type of tri-block polymer nanoparticle-gel complex (Gel@PLGA-PEI-PEG@NAT) for delivering NAT and evaluate its physicochemical properties, antifungal activity, safety, penetrability, adhesion, and efficacy in treating fungal keratitis.
Methods: PLGA-PEI-PEG@NAT was prepared and characterized with a nano-particle size analyzer, transmission electron microscopy (TEM), scanning electron microscopy (SEM), and Fourier transform infrared spectroscopy (FTIR). The minimum inhibitory concentration (MIC), cytotoxicity, penetrability of NAT (Natacyn® 5% ophthalmic suspension; Alcon) and PLGA-PEI-PEG@NAT with different concentrations were assessed. The eye surface retention time, ocular irritation, and curative effect of the NAT ophthalmic suspension and Gel@PLGA-PEI-PEG@NAT on a rabbit fungal keratitis model were evaluated.
Results: PLGA-PEI-PEG@NAT had a particle size of 150 nm, a positive surface charge, and a sustained-release effect. The MIC for F. Solani was 2 μg/mL. A cytotoxicity test and ocular irritation test showed that PLGA-PEI-PEG@NAT and Gel@PLGA-PEI-PEG@NAT had good biocompatibility and no obvious irritation for rabbit corneas. Penetration experiments confirmed that PLGA-PEI-PEG@NAT can successfully enter corneal epithelial cells and through the cornea to enter the anterior chamber. Compared with NAT ophthalmic suspension, Gel@PLGA-PEI-PEG@NAT had stronger cornea permeation at the same concentration. The therapeutic effect and precorneal retention ability of the NAT ophthalmic suspension and Gel@PLGA-PEI-PEG@NAT on the fungal keratitis rabbit model were compared. Gel@PLGA-PEI-PEG@NAT achieved a better therapeutic effect at a lower drug concentration, and its eye surface retention time was significantly longer than that of the NAT ophthalmic suspension.
Conclusion: Gel@PLGA-PEI-PEG@NAT was shown to be a safe and effective nanodrug delivery system for NAT. It has great potential to improve the cure rate of fungal keratitis, reduce the administration frequency during the treatment process, and improve patient compliance.
Keywords: fungal keratitis, natamycin, nanoparticles, ocular drug delivery, tri-block polymer
Graphical Abstract:

Introduction
Fungal keratitis is a serious infectious disease of cornea that can lead to stroma destruction and perforation, even endophthalmitis.1,2 Plant trauma, contact lens wearing, and long-term steroid administration are the risk factors for fungal keratitis. Yeast (Candida) and filamentous fungi (Fusarium and Aspergillus) are the major pathogens of fungal keratitis.3 Clinical retrospective studies have shown that Fusarium is the major cause of fungal keratitis in China.4–7
Currently, the clinical treatment of fungal keratitis is difficult. One of the main reasons is that the existing drug formulations cannot deliver antifungal drugs to the lesions and reach the therapeutic concentration effectively.8 Ocular antifungal drugs have the defects of poor penetration and low retention ability, which makes the treatment of fungal keratitis ineffective. Because of the special protective mechanisms, such as blink reflex, tear dilution, and nasolacrimal drainage, topical medication on the ocular surface is easily removed.9,10 Moreover, due to the mechanical barrier effect of the cornea, many drugs have difficulty penetrating the cornea and entering the eye.11 Studies involving animal models of fungal keratitis showed that the efficacy of NAT administration in debrided corneas was significantly better than that in normal corneas and NAT levels in the cornea stroma and aqueous of debrided corneas was higher than that of normal corneas.12 This study demonstrated that the corneal epithelium limited drug penetration into ocular areas. For these reasons, the existing antifungal ophthalmic preparations cannot achieve high bioavailability.9,13
The common therapeutic drugs of ocular fungal infection includes a polyene macrolide antibiotic [NAT (5%), amphotericin B (0.25%)], an imidazole anti-fungal agent, and a pyrimidine anti-fungal agent. As the First FDA-approved compound for treating ocular fungal keratitis, NAT is used as the first line treatment for fungal keratitis.14 Studies have shown that NAT is better than voriconazole and itraconazole in treating fungal keratitis caused by Fusarium infection.14,15 Since the aqueous solubility of NAT is only 30–50 mg/l and the bioavailability of NAT ophthalmic suspension (5%) is only 2% by topical administration, it has to be administered frequently (given every hour or 2 hours for 3–4 days, then tapered to 6–8 times a day, with the course of treatment lasting 2–3 weeks).16 A high concentration and frequent medication administration for a long time will lead to side effects, worse compliance, and financial burdens; therefore, it is necessary to find a drug carrier with stronger penetration and retention capabilities.
As drug carriers, nanosystems have great potential for the treatment of fungal keratitis due to the advantages of increasing the penetration of drugs and creating drugs that have better targeting and controlled drug release.17,18 At present, a variety of nanocarriers, such as nanoparticles (NPs), nanocubes, lipid NPs, liposomes, and nanomicelles have been prepared for intraocular delivery of antifungal drugs.3,19–21 Some researchers have suggested that NAT loaded nanocarriers, such as polyethylene nano-lipid carriers, micelle systems, nanocubosomal based in situ gels, and solid lipid NPs, have excellent physiochemical properties and can significantly enhance the penetration of NAT.3,22–24
Biodegradable block polymer is extensively used in studies on controlled and targeted drug delivery systems due to its excellent characteristics, such as being non-toxic and non-immunogenic.25–27 Block-copolymer-based nanostructures have many advantages, such as delivering hydrophobic and hydrophilic drugs, increasing therapeutic effectiveness, reducing toxicity, and controlling drug release.28 Composite nanoformulation is a type of delivery system that disperses NPs in thermosensitive gels or hydrogels. Thermosensitive gels exist in a solution state at 37 °C and form a gel in situ after application.29 The gel matrix acts as a barrier to prolong drug release and reduce a burst release.30 The ideal ophthalmic thermosensitive gel formulation should be in the form of eye drops, which can be free flowing, easy to drop into the eye, and form a gel in the conjunctival sac.21 It has the advantages of resistance to tear dilution and longer existing time on the ocular surface.31 Compared with solution drugs, ophthalmic thermosensitive gel formulations can significantly prolong the corneal retention time and increase the bioavailability of drugs.21,32,33
Poly-lactic-co-glycolic acid (PLGA) is often used to design various nanostructures and has been applied in the treatment of many diseases, vaccine preparations, and tissue engineering research.34,35 Long circulating properties of NPs can be further promoted by surface modification of PLGA NPs with polyethylene glycol (PEG).36 Poly-ethylene imine (PEI) carries a positive charge on its surface and could help NPs penetrate the cornea.37 After PEI modification, PLGA-PEI-PEG had stronger penetrability, higher stability, and higher utilization rate of the loaded drug.38
Based on the advantages of block polymer and composite nanoformulation, this study developed NAT loaded tri-block polymer NPs (PLGA-PEI-PEG@NAT coded as F1) and added them into a poloxamer gel (Gel@PLGA-PEI-PEG@NAT coded as F2). We then evaluated its safety, penetrability, adhesion, and therapeutic effect. It is expected to become a new ophthalmic drug delivery system to improve bioavailability and therapeutic efficacy of antifungal drugs in fungal keratitis.
Materials and Methods
Materials
Chemical reagents in this study were analytically pure and purchased from Chemical Reagent Co. Ltd. For details, PLGA, PEI, PEG, 1-(3-dimethylaminopropyl) −3-ethylcarbondiimide (EDC), N-hydroxysuccinimide (NHS), and NAT were purchased from Beyotime Biotechnology. (Table S1) Distilled water (DW) was used in all of the experiments.
Preparation of F1 and F2
A total of 300 mg PLGA was dissolved in 50 mL dichloromethane, 100 mg PEI, 50 mg PEG, 5 mg EDC, and 5 mg of NHS were dissolved in 50 mL methanol and then mixed and refluxed at 50 °C for 8 hours. After the reaction was completed, the solvent was removed by rotary evaporation at 40 °C and 30 mL of deionized water was added to dissolve F3 with ultrasound. The aqueous solution was dialyzed with deionized water overnight in a dialysis bag (interception molecular weight = 10,000 D). (Table S2) Furthermore, 5 mg of EDC, 5 mg of NHS, 10 mg of fluorescein isothiocyanate (FITC), and 100 mg of F3 were added to a beaker; the solution was mixed and stirred for eight hours to prepare FITC-PLGA-PEI-PEG. The aqueous solution was dialyzed with deionized water overnight in a dialysis bag (interception molecular weight = 10,000 D). A total of 10 mL of F3 solution (10 mg/mL) was placed in a beaker, and then 50 mg of tween 80 was added and stirred for 30 min. After that, 100 mg of NAT were added and stirred ultrasonically for 30 min and then stirred for 8 h. The solution was then centrifuged for 30 min (10,000 rpm/min) to collect F2 NPs for later use.
A total of 25 g poloxamer P407 and 3 g poloxamer P188 were dissolved in 72 mL deionized water to prepare a thermosensitive gel and it was placed in a refrigerator at 4 degrees. A total of 500 mg of F1 NPs were added to the temperature sensitive gel, which was then mixed and refrigerated at 4 °C.
Characterization of F1 and F2
The concentration of NAT in the PLGA-PEI-PEG@NAT NPs was measured and calculated in the UV spectrum at 301 nm (Cary 5000 spectrophotometer). Transmission electron microscopy (TEM) samples were prepared by dropping the particle solutions onto holey carbon film on copper grids. The morphology images of F1 were obtained with an H-7650 Transmission Electron Microscope (Hitachi, Tokyo, Japan) at an acceleration voltage of 80 kV. The size distribution and stability of the NPs were measured with a NanoSight NS300 Instrument (Malvern Panalytical, Malvern, UK). The FT-IR of PLGA, PEI, PEG, and F3 were recorded with a FT-IR spectrometer (Equinox 55, Bruker, Ettlingen, Germany) in the range 4000–500 cm-1. The characterization of F1 was carried out with ultraviolet (UV)-visible spectroscopy (Cary 5000 spectrophotometer). The sol-gel phase transitions of the gel and F2 were measured with a Malvern Kinexus rotational rheometer equipped with a parallel plate (Malvern, UK).
Detection of Antifungal Activity in vitro
A micro-double dilution method was employed to evaluate antifungal activity. The drug was diluted with MH broth to a final concentration of 128 μg/mL, 64 μg/mL, 32 μg/mL, 16 μg/mL, 8 μg/mL, 4 μg/mL, 2 μg/mL, 1 μg/mL, 0.5 μg/mL, and 0.25 μg/mL. Diluted the fungal suspensions (The preparation of F. solani strains was part of the routine hospital laboratory procedure) with culture medium until the concentration was 105 colony forming units per mL (CFU/mL). Three experimental groups were set up: NAT (NAT solution) group, NAT ophthalmic suspension (Natacyn® 5% ophthalmic suspension; Alcon) group, and the F1 group. Added 100 μL of the drugs and fungal suspensions into each well. Negative and positive control groups were set. The positive control group only contained fungal suspensions without drugs, and the negative control group only contained culture medium without fungal suspensions. After incubation for 24 hours, the colorimetry of the samples was treated with an enzymatic reader at 600 nm. The lowest drug concentration that completely inhibited the growth of fungi was the MIC of the different antifungal agents.
Drug Safety Assessment in vitro
Human corneal epithelial (HCE-T) cells were obtained from the CTCC (Jiangsu, China). The HCE-T cells were cultured at 37 °C in 5% carbon dioxide and 80–90% relative saturation humidity. The corneal epithelial cell suspensions were collected, centrifuged at 1000 rpm for 5 min, and then the supernatant was removed. Resuspend cells with fresh medium, diluted, and counted. Then adjusted the cell density to 1×10⁵ cells/mL. The peripheral holes of the 96-well plate were filled with phosphate buffer saline (PBS), and the background group and blank control group were set. Inoculated the mixed cell suspension into the 96-well plate at 100 μL per well, and set five duplicate wells for each group. Cells were cultured with different concentrations of drugs (2, 4, 8, or 16 μg/mL NAT ophthalmic suspension and 2, 4, 8, or 16 μg/mL F1) for 24 h. CCK8 and living and dead cell staining was used to detect cell viability. The experiment was repeated three times.
Detection of FITC-PLGA-PEI-PEG and FITC Uptake in HCE-T Cells
When the density of the HCE-T cells reached 80%, the cell suspension was collected after digestion with trypsin. A total of 2.5 mL of HCE-T cell suspension was inoculated into 6-wells plates at the density of 1×10⁵ cells per well. After 48 h adherent culture, the cells were incubated with serum-free medium containing 2 μg/mL of FITC-PLGA-PEI-PEG and serum-free medium containing the same content of FITC. Using DAPI solution to stain the nuclei after 0.5 h, 1 h, 2 h or 4 h, the cells were observed and photographed under a fluorescence microscope. The experiment was repeated three times.
In vivo Trans-Corneal Permeation
Trans-corneal permeations of NAT from F2 and NAT ophthalmic suspensions were evaluated in male New Zealand white rabbits that weighed between 2 and 2.5 kg. The experimental rabbits were divided into five groups: 50 mg/mL NAT ophthalmic suspension (5%) group, 10 mg/mL NAT ophthalmic suspension (1%) group, 10 mg/mL F2 group, 5 mg/mL F2 group, and 2.5 mg/mL F2 group (n=3). The rabbits were anesthetized with an intramuscular injection of Sumianxin II (0.1 mL/kg) and pentobarbital sodium (1 mL/kg). The corneal epithelia of the rabbits were scraped after application of a topical anesthesia. All the above formulations (50 μL) were administered every four hours four times. Twenty-four hours after the final administration, the rabbits were sacrificed and the aqueous humor of each eye was aspirated. The concentration of NAT in the aqueous humor was determined with the LC-MS analysis method. All procedures involving animals were carried out in accordance with the National Institutes of Health Guidelines for the Care and Use of Laboratory Animals. All the in vivo experiments were carried out with the approval of the Animal Experimentation Ethics Committee of Jinan University (IACUC-20200512-05).
Establishment of a Rabbit Corneal Fusarium Infection Model
Levofloxacin eye drops (Santen, Osaka, Japan) were used in the experimental eyes twice a day for three days. Ten microliters of 2.4×10⁶ CFU of the F. solanum spore suspension were injected into the corneal stroma with a microsyringe. TobraDex ophthalmic ointment (tobramycin 0.3%, dexamethasone 0.1%, Alcon) was dropped into the conjunctival sac and the eyelid was closed with a patch. Typical ulcer formation was observed on the third day and corneal fungus scrapings were identified as F. solanum, which are the criteria for successful establishment of animal models.
Evaluation of Drug Efficacy in the Animal Model
Experimental rabbits were divided into five groups with three rabbits in each group: normal saline (NS) group, NAT ophthalmic suspension (5%) group, 10 mg/mL F2 group, 5 mg/mL F2 group, and 2.5 mg/mL F2 group. The left eyes were used as the experimental eyes. The frequency of administration was once per hour for the First four days and then 6–8 times per day for a total of 21 days. The corneal opacity, neovascularization, conjunctival congestion, and corneal surface regularity were evaluated and photographed on days 0, 1, 3, 5, 7, 10, 14, and 21 after treatment. The clinical score of keratitis was evaluated according to the revised scoring standard developed by Wu et al.39 On the 21st day after treatment, paraffin sections were made of the diseased corneal parts. Hematoxylin and eosin (HE) staining was used to observe and collect images under a microscope.
Evaluation of the Ocular Surface Retention Ability
Fluorescein sodium was mixed with NAT ophthalmic suspension (5%) and different concentrations of F2 in a ratio of 1:5 at a low temperature. A total of 50 μL of the drugs were added into the rabbit conjunctival sac of rabbits in each group. After the rabbit eyes were closed for 10s, the ocular surface clearance was observed under cobalt blue light at 0s, 10s, 1 min, 3 min, 5 min, 7 min, 10 min, 15 min, 20 min, 25 min, and 30 min.
Corneal Penetration Assessment
New Zealand white rabbits were randomly divided into three groups: 10 mg/mL FITC-Gel@PLGA-PEI-PEG@NAT group, 5 mg/mL FITC-Gel@PLGA-PEI-PEG@NAT group, and 2.5 mg/mL FITC-Gel@PLGA-PEI-PEG@NAT group. A drug solution of 50 μL was dropped into the conjunctival sac of the right eye of each rabbit every half an hour for 2 h. After the ocular surface was washed with sterile saline, the corneas were sliced into frozen sections. Images were taken with a fluorescence microscope.
Eye Irritation Assessment
Twelve New Zealand white rabbits were randomly divided into four groups: NAT ophthalmic suspension (5%) group, 10 mg/mL F2 group, 5 mg/mL F2 group, and 2.5 mg/mL F2 group. A drug solution of 50 μL was dropped into the conjunctival sac of the right eye of each rabbit six times daily for seven days. The ocular irritation score system of Diebold et al40 was used to assess irritation in each eye before administration of the drugs and seven days after.
Statistical Analysis
Experiments were repeated at least three times. Comparisons of the mean for multiple groups were conducted with repeated measures analysis of variance (ANOVA) and pairwise comparisons among groups were performed with a two-sample t-test and LSD-t-test using SPSS 13.0 statistical package (SPSS Inc., Chicago, IL, USA).
Results and Discussion
Characterization of F1 and F2
F2 was prepared by F1 and a temperature-sensitive gel that was a liquid at a low temperature and a gel at body temperature (Figure 1A).41,42 F3 was characterized by infrared and UV spectroscopy. The infrared spectrum characteristic peaks of PLGA and PLGA-PEI corresponded to the characteristic peaks of the F3 spectrum, which showed that synthesis of tri-block polymer was successful (Figure 1B) and the NPs had been loaded with NAT (Figure 1C). A PH meter was used to detect the pH values of NAT and F1 (Figure 1D) and measurements showed that NAT was weakly acidic, while the molecule loaded with the polymer was weakly alkaline. ZETA potential analysis (Figure 1E) showed that F1 had a strong positive charge, which was conducive to the stability of NPs.
 |
Figure 1 (A) Schematic illustrating the preparation of F2. (B) Infrared spectrogram of PLGA and PLGA-PEI, F3. (C) UV spectrogram of NAT and F1. (D) pH of NAT, PLGA@NAT, and F1. (E) Surface potential of NAT, PLGA@NAT, and F1. (F) Transmission electron micrograph images of F1. (G) Scanning electron microscope images of F1. (H) Particle size of PLGA, PLAG@NAT, and F1. (I) Particle size of F1 in PBS solution. (J) Drug release profiles of NAT in PLGA@NAT and F1. (K) The particle size of F2 with different gel concentrations at 4°C. (L) Change in the shear viscosity (η) of gel and F2 with different temperatures. (M) Temperature dependence of storage modulus (G′) and loss modulus (G″) of the gel. (N) Temperature dependence of the storage modulus (G′) and loss modulus (G″) of F2. (O) The gelation time of gel, Gel@PLGA-PEI-PEG, and F2. |
The morphology of F1 was characterized with TEM and SEM. The results showed that the particle size of the NPs was uniform with good dispersion (Figure 1F and G). The particle size and stability of F1 were detected with a nano-particle size analyzer. As shown in Figure 1H and I, the particle size of F3 increased after NAT loading. The particle size of F3 was about 150 nm with a polymer dispersity index (PDI) < 0.2. In PBS solution, F3 had good stability within 21 days after reloading (PDI < 0.2). The drug release of the nanosystem was detected with ultraviolet spectroscopy. The pure NAT was directly released and PLGA loaded with NAT was prone to burst release (Figure 1J). After surface modification of PEI-PEG, F1 had a sustained-release effect and could release drugs continuously. To ensure there was no particle growth of NPs in the gel, we monitored the particle size in different gel concentrations. The particle size of the systems remained stable with a slight rise with different concentrations of the gels (Figure 1K). The Malvern Kinexus rotational method was used to measure the solution-gel phase transitions of the systems. According to the results of shear viscosity (η), the gel and F2 maintained good liquidity with a low viscosity when the temperature was below 23°C (Figure 1L), whereas, both viscosities of the gel and F2 rose rapidly to 1188 Pa’s when the temperature exceeded 23 °C. Furthermore, the temperature dependence of the storage modulus (G’) and loss modulus (G”) were analyzed to compare the thermosensitive performance between the gel and F2. The results of the storage modulus (G’) and loss modulus (G”) are shown in Figure 1M and N. The phase-transition temperature of the gel (24.53 °C) was similar to F2 (24.98°C). Thus, the introduction of NPs did not affect the thermosensitive performance of the gel. Also, according to imaging of the gel; ie, Gel@PLGA-PEI-PEG and F2, all systems were in the solution phase but turned into the gel phase at 36°C (Figure 1O). Consequently, the F2 with an appropriate thermosensitive performance has great potential to be used in antifungal therapy.
Determination of MIC
The antifungal activities of NAT, NAT ophthalmic suspension, and F1 against F. solani were determined with the micro-double dilution method. The MIC was the lowest drug concentration that could inhibit the growth of fungi when the fungal suspensions and different concentrations of the tested NAT formulations were co-incubated in 96-well plates for 24 h. As the fungi grew, the turbidity in the pore increased. The absorbance of each well was measured with an enzyme labelling instrument to indicate the growth of the fungi. Table 1 shows that the MIC of F1 was 2 μg/mL, which was the same as for the NAT ophthalmic suspension, and the MIC of NAT was 4 μg/mL. The results showed that both F1 and NAT ophthalmic suspensions had good antifungal activity, and their antifungal activity was higher than that of the NAT solution. The antifungal activity of NAT was enhanced by tri-block polymer.
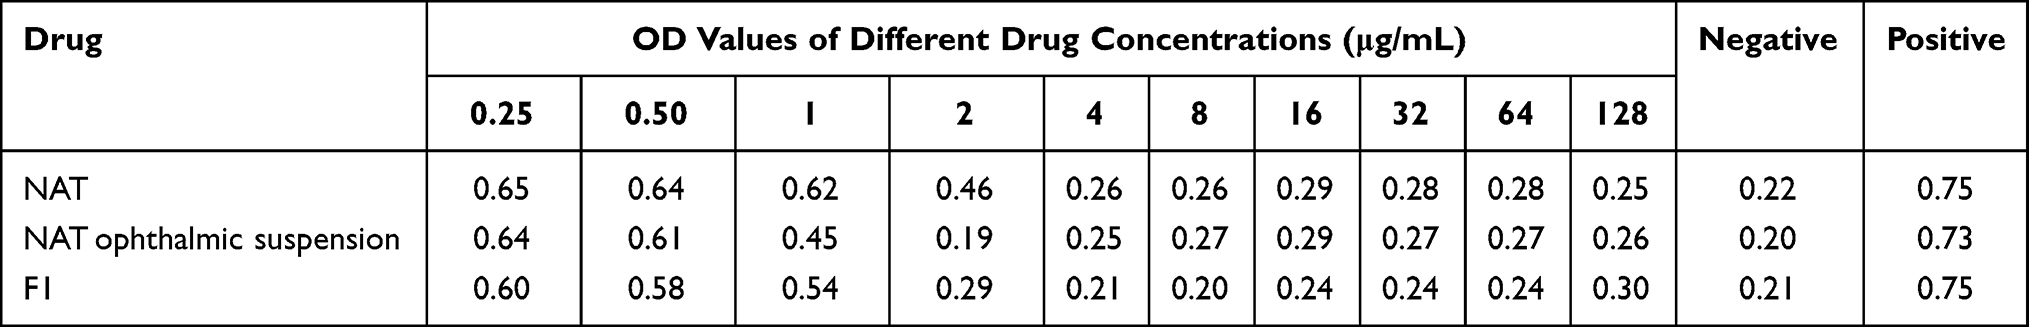 |
Table 1 Antifungal Activity of NAT, NAT Ophthalmic Suspension and F1 Against Fusarium Solanum |
Cytotoxicity Test
Depending on the MIC of the NAT ophthalmic suspension and F1, we set three concentration gradients. CCK-8 was used to detect the cytotoxicity of different concentrations of the NAT ophthalmic suspension and F1 to HCE-T cells. The cell viability of HCE-T cells decreased with the increase in the concentration of the two formulations. As shown in Figure 2, when the concentration of NAT ophthalmic suspension was 2–8 μg/mL, the cell viability was more than 90%. When the F1 concentration was 2–8 μg/mL, the cell viability was only 61.0%–70.7%, which meant the cytotoxicity of F1 to HCE-T cells was higher than that of the NAT ophthalmic suspension. This might be related to the inhibition of cell proliferation or cytotoxicity of F3 blocks. According to the results, two concentrations; that is, 2 μg/mL and 4 μg/mL, were selected for staining detection of living and dead cells to verify whether F1 had a cell-killing effect.
 |
Figure 2 Cytotoxicity of the NAT ophthalmic suspension and F1 on HCE-T cells after incubating for 24 h. *P <0.05; **P <0.01 denote a statistically significant difference between the samples calculated with a two-sample t-test. |
Living and Dead Cell Staining
The cytotoxicity of F3 blocks was detected by the live/dead cell double staining kit and the results were compared with that of the NAT ophthalmic suspension. Dead cells appeared red and the living cells appeared green with fluorescence microscopy. The results showed that the death rate of HCE-T cells treated with 2 μg/mL of the NAT ophthalmic suspension and F1 was 0.27% and 0.23%, respectively, while it was 0.63% and 0.67%, respectively, when treated with 4 μg/mL NAT ophthalmic suspension and F1 (Figure 3). The cytotoxicity of the two formulations was concentration dependent, and there were no significant differences in the cell death rate of the NAT ophthalmic suspension and F1 of the same concentration (P >0.05). The number of dead cells produced by different concentrations of NAT ophthalmic suspension and F1 co-cultured with HCE-T cells was fewer, and there were no significant differences in the cell death rate between the two groups at the same concentration, indicating that F1 and the NAT ophthalmic suspension both had good biocompatibility and had no obvious killing effect on cells. Hence, we considered that when co cultured with HCE-T cells, F1 inhibited the proliferation of HCE-T cells rather than killing the cells.
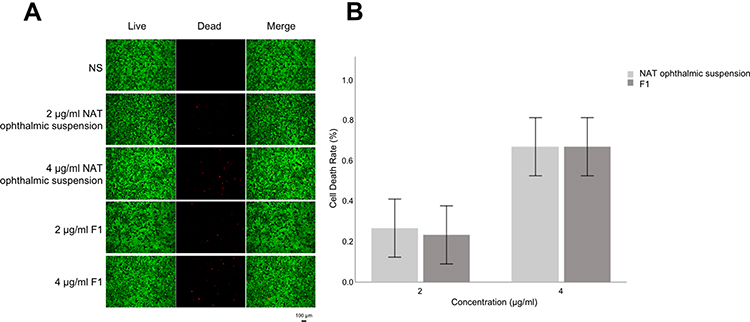 |
Figure 3 (A) Living and dead cell staining of HEC-T cells co-cultured with different concentrations of NAT ophthalmic suspension and F1 for 24 h (black scale bar=100 μm). (B) Cell death rate of HCE-T cells treated with NAT ophthalmic suspension and F1 for 24 h. |
Detection of FITC-PLGA-PEI-PEG and FITC Uptake in HCE-T Cells
PLGA was widely used in the preparation of drug carriers for its tunable biodegradability.43 The hydrophilic and long circulating properties of PLGA NPs can be enhanced by surface modification of PEG.36,44 In addition, PEI modification can increase the stability of NPs.38 We detected the uptake of FITC-PLGA-PEI-PEG and FITC in HCE-T cells to verify the function of block polymer in cell penetration. A total of 2 μg/mL of FITC-PLGA-PEI-PEG and the same content of FITC were added into the medium of HCE-T cells for incubation. HCE-T cells were observed with fluorescence microscopy after 0.5h, 1h, 2h, and 4h (Figure 4A). As shown in Figure 4B, the green fluorescence intensity was weak at 0.5 h, suggesting that only a small amount of FITC-PLGA-PEI-PEG was taken up by HCE-T cells. The fluorescence intensity of the HCE-T cells was enhanced with prolonged time, and fluorescence intensity at 4h was significantly stronger than that at 2h (P <0.01). This demonstrated that F3 could enter the cytoplasm of living HCE-T cells, and the absorption of F3 by HCE-T cells was time-dependent. Compared with FITC-PLGA-PEI-PEG, the uptake of FITC by living HCE-T cells was very low at 4 h. Microscopic observations revealed that only a small number of dead cells showed green fluorescence. With extension of the observation time, the fluorescence intensity in dead cells increased gradually, which indicated that FITC had difficulty entering living HCE-T cells without mediation of F3. The above results illustrated that block polymer could enhance the penetration of loaded drugs.
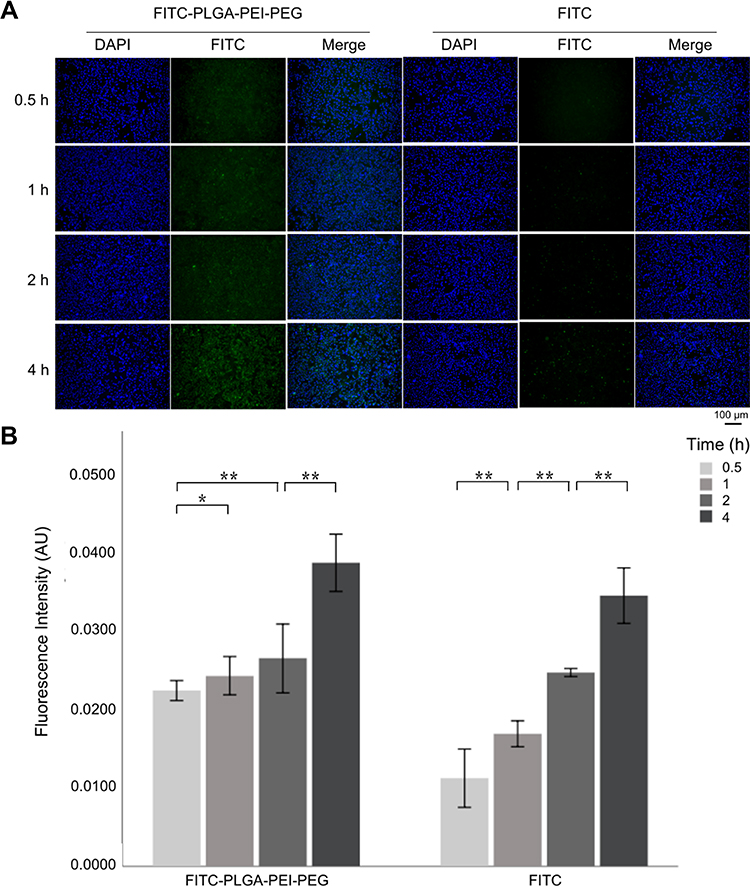 |
Figure 4 (A) Uptake of FITC-PLGA-PEI-PEG and FITC by HEC-T cells at different times. (B) The mean fluorescence intensity of FITC-PLGA-PEI-PEG and FITC in HCE-T cells and its variation with time. *P <0.05; **P <0.01 denote a statistically significant difference between the samples calculated by a two-sample t-test. Notes: blue fluorescent, DAPI labeled nucleus; green fluorescent, FITC labeled F3 or FITC. |
In vivo Trans-Corneal Permeation
An aqueous humor test was performed 24 hours after the last administration. As shown in Figure 5, the content of NAT from 50 mg/mL of the NAT ophthalmic suspension (5%) in the aqueous humor was 58.5 ng/mL, which was significantly higher than that from F2 (P <0.01). Before administration, the concentration of the NAT ophthalmic suspension (5%) was five times that of 10 mg/mL of F2. However, after entering the anterior chamber, the concentration of NAT from the NAT ophthalmic suspension (5%) was only 2.25 times that of 10 mg/mL of F2. The NAT ophthalmic suspension (5%) was diluted to the concentration of 10 mg/mL (1%) and administered. The NAT content from the 10 mg/mL NAT ophthalmic suspension (1%) in the aqueous humor was lower than that of the 10 mg/mL F2 (P <0.05), and there was no significant difference in the NAT content between the 10 mg/mL NAT ophthalmic suspension (1%) and the 2.5 mg/mL F2. The above results showed that F2 could enter the anterior chamber through the cornea and F2 had stronger cornea permeation than the NAT ophthalmic suspension. The administration of F2 loaded NAT could increase the intracameral drug content, which might be attributed to the improved penetrability and sustained release property of F2.27 The formulations of the thermosensitive gel also extended the residence time of drugs at the ocular surface and effectively increased the NAT contents entering the eye.33
 |
Figure 5 NAT content from different NAT formulations in the aqueous humor measured 24 h after the last administration. *P <0.05; **P <0.01 denote a statistically significant difference between the samples calculated with a two-sample t-test. |
Observation and Evaluation of the Animal Models
The F. solani suspensions were injected into the corneal stroma of the rabbits. On the 1st, 3rd, 5th, and 7th day after inoculation, the rabbits were observed and photographed (Figure 6A). At 24 h after successful inoculation, the eyelids of the experimental eyes were red and swollen, the conjunctiva was congested and edematous, and the corneal inoculation area was slightly opacified and bulged. On the third day after inoculation, the corneal ulcers showed infiltration development and an increased lesion area and bulge. The corneal infiltration foci were white and dense, and the surface was rough and toothpaste-like. Corneal scrapes were taken from the infected area and F. solanum was identified. On the fifth day after inoculation, the infection foci were further developed. All the experimental eyes showed corneal limbal neovascularization near the lesion area and some experimental eyes showed flocculent hypopyon in the anterior chamber. On the seventh day after inoculation, drugs were administered. The experimental groups were treated with NAT ophthalmic suspension (5%), 10 mg/mL F2, 5 mg/mL F2, and 2.5 mg/mL F2. The control group was treated with sterile NS.
 |
Figure 6 (A) Changes in the ocular surface at different time intervals during therapy. (B) Changes in the corneal ulcer area after treatment. (C) Changes in the clinical scores of keratitis after treatment. (D) Photomicrography of the histopathological study of the examined rabbit corneas. Infiltration of the inflammatory cells and neovascularization in the corneal stroma are indicated by arrows. Notes: a, saline group; b, NAT ophthalmic suspension group; c, 10 mg/mL F2 group; d, 5 mg/mL F2 group; e, 2.5 mg/mL F2 group. |
After one week of treatment, the ulcer area of the NS group and most experimental samples showed an expanding trend. After two weeks of treatment, the areas of corneal ulcers in the NS group continued to increase, while the areas of corneal ulcers in the experimental group decreased compared with that at one week of treatment. After three weeks of treatment, the corneal ulcer area in all the experimental groups decreased compared with that before treatment.
A repeated measures ANOVA was used to analyze the changes in the corneal ulcer area at different time intervals during therapy and an LSD-t-test was used for pairwise comparisons between the groups. The results showed that the difference between the corneal ulcer area and the initial ulcer area of each experimental group after three weeks of treatment were statistically significant compared with that of the NS group (P <0.05; Figure 6B). The results showed that the NAT ophthalmic suspension (5%), 10 mg/mL F2, 5 mg/mL F2, and 2.5 mg/mL F2 all had therapeutic effects on keratitis caused by F. solanum. After three weeks of treatment in each experimental group, the differences between the changes in the ulcer areas were compared pairwise, and the results were not statistically significant (P >0.05). There was no significant difference in the efficacy of the three different concentrations of F2 in the treatment of keratitis caused by F. solanum, and the efficacy was similar to that of the NAT ophthalmic suspension. According to the Wu et al39 scoring system, the ocular surface before and after administration was scored. The scores of rabbit eyes treated with the NAT ophthalmic suspension and different concentrations of F2 were significantly lower than those of the normal saline group (P <0.05). There was no significant difference in clinical scores between the three concentrations of F2 and NAT ophthalmic suspension (5%; Figure 6C).
After 21 days of administration, pathological sections were made. As shown in Figure 6D, healing of the corneal epithelial injury, abnormal morphology of epithelial tissue, irregular cell arrangement, disordered arrangement of collagen fibers in the corneal stroma, massive infiltration of inflammatory cells, and invasion of new blood vessels were observed.
Evaluation of Ocular Surface Retention and Corneal Penetration
In this experiment, drugs mixed with sodium fluorescein were dropped into the conjunctival sac of the rabbits, and the ocular surface retention time was observed and evaluated with cobalt blue light. As shown in Figure 7A, most of the NAT ophthalmic suspension (5%) remained in the conjunctival sac, while F2 adhered to the cornea and conjunctiva after administration. The fluorescence of the NAT ophthalmic suspension (5%) disappeared at 15 min after administration. However, the fluorescence of F2 at different concentrations basically disappeared at about 35 min after administration. In summary, F2 had a significantly longer precorneal retention time than that of the NAT ophthalmic suspension (5%), which meant a stronger eye retention ability.
 |
Figure 7 (A) Ocular surface retention time of the NAT ophthalmic suspension (5%) and different concentrations of F2. (B) Penetrating ability of different concentrations of F2 into the cornea. |
Fluorescence microscopy was performed after continuous administration of FITC-Gel@PLGA-PEI-PEG@NAT with different concentrations for 2 h. The fluorescence signal could be observed in the whole cornea of all the experimental groups, among which the fluorescence signal in the corneal epithelium was the most obvious, while that in the stroma and endodermis was relatively weak. The 10 mg/mL, 5 mg/mL, and 2.5 mg/mL FITC-Gel@PLGA-PEI-PEG@NAT could penetrate the whole cornea in a short time with good permeability (Figure 7B).
Eye Irritation Assessment
According to the scoring criteria of Diebold et al40 eye irritation with the NAT ophthalmic suspension and three concentrations of F2 were evaluated (Figure 8A). No obvious discomfort symptoms were observed in all the experimental rabbits. No abnormalities were observed upon eye examination, including eyelid swelling, corneal opacity, conjunctival congestion or edema, and sticky secretions.
 |
Figure 8 (A) Ocular surface changes after different drug administrations. (B) Photomicrography of the histopathological study of the examined rabbit corneas. Notes: a, saline group; b, NAT ophthalmic suspension (5%) group; c, 10 mg/mL F2 group; d, 5 mg/mL F2 group; e, 2.5 mg/mL F2 group. |
As shown in Figure 8B, compared with the blank control group, the corneal tissue and cell morphology of the experimental group were normal, without obvious epithelial injury and inflammatory cell infiltration. The results indicated that neither of the three concentrations of F2 nor NAT ophthalmic suspension (5%) caused obvious damage to the corneal tissue structure.
Conclusions
In conclusion, F2 as a safe and effective nanodrug delivery system was used to load NAT for fungal keratitis. Our results showed that, F2 with a good antifungal activity and biocompatibility had better tissue penetrability and ocular surface adhesion than the NAT ophthalmic suspension (5%). Moreover, 2.5 mg/mL of F2 could achieve a similar therapeutic effect as the NAT ophthalmic suspension at 50 mg/mL. Hence, as a more effective antifungal ophthalmic formulation, F2 has a great potential to improve the cure rate and reduce the frequency of administrations during the treatment process, which will help to improve patient compliance.
Acknowledgments
This work was supported by the National Natural Science Foundation of China (grant number 81970806) and Medical Scientific Research Foundation of Guangdong Province of China (grant number A2019098). Xiaoyuan Sha and Leung Chan are co-first authors.
Ethics Approval and Consent to Participate
This study approved by the Ethics Committee of the First Affiliated Hospital of Jinan University.
Disclosure
The authors report no conflicts of interest in this work.
References
1. Prajna NV, Srinivasan M, Lalitha P, et al. Differences in clinical outcomes in keratitis due to fungus and bacteria. JAMA Ophthalmol. 2013;131:1088–1089. doi:10.1001/jamaophthalmol.2013.1612
2. Verma A, Sharma G, Jain A, et al. Systematic optimization of cationic surface engineered mucoadhesive vesicles employing Design of Experiment (DoE): a preclinical investigation. Int J Biol Macromol. 2019;133:1142–1155. doi:10.1016/j.ijbiomac.2019.04.118
3. Khames A, Khaleel MA, El-Badawy MF, El-Nezhawy AOH. Natamycin solid lipid nanoparticles - sustained ocular delivery system of higher corneal penetration against deep fungal keratitis: preparation and optimization. Int J Nanomedicine. 2019;14:2515–2531. doi:10.2147/IJN.S190502
4. Wang L, Sun S, Jing Y, Han L, Zhang H, Yue J. Spectrum of fungal keratitis in central China. Clin Exp Ophthalmol. 2009;37:763–771. doi:10.1111/j.1442-9071.2009.02155.x
5. He D, Hao J, Zhang B, et al. Pathogenic spectrum of fungal keratitis and specific identification of Fusarium solani. Invest Ophthalmol Vis Sci. 2011;52:2804–2808. doi:10.1167/iovs.10-5977
6. Xie L, Zhong W, Shi W, Sun S. Spectrum of fungal keratitis in North China. Ophthalmology. 2006;113:1943–1948. doi:10.1016/j.ophtha.2006.05.035
7. Lin Y, Zhang J, Han X, Hu J. A retrospective study of the spectrum of fungal keratitis in southeastern China. Ann Palliat Med. 2021;10(9):9480–9487. doi:10.21037/apm-21-1949
8. El-Emam GA, Girgis GNS, MMA E-S, El-Azeem Soliman OA, Abd El Gawad AEGH. Ocular inserts of voriconazole-loaded proniosomal gels: formulation, evaluation and microbiological studies. Int J Nanomedicine. 2020;15:7825–7840. doi:10.2147/IJN.S268208
9. Huang J-F, Zhong J, Chen G-P, et al. A hydrogel-based hybrid theranostic contact lens for fungal keratitis. ACS Nano. 2016;10:6464–6473. doi:10.1021/acsnano.6b00601
10. Huang D, Chen Y-S, Rupenthal ID. Overcoming ocular drug delivery barriers through the use of physical forces. Adv Drug Deliv Rev. 2018;126:96–112. doi:10.1016/j.addr.2017.09.008
11. Lalu L, Tambe V, Pradhan D, et al. Novel nanosystems for the treatment of ocular inflammation: current paradigms and future research directions. J Control Release. 2017;268:19–39. doi:10.1016/j.jconrel.2017.07.035
12. O’day DM, Head WS, Robinson RD, Clanton JA. Corneal penetration of topical amphotericin B and natamycin. Curr Eye Res. 1986;5:877–882. doi:10.3109/02713688609029240
13. Morsi N, Ghorab D, Refai H, Teba H. Ketoroloac tromethamine loaded nanodispersion incorporated into thermosensitive in situ gel for prolonged ocular delivery. Int J Pharm. 2016;506:57–67. doi:10.1016/j.ijpharm.2016.04.021
14. Kalavathy CM, Parmar P, Kaliamurthy J, et al. Comparison of topical itraconazole 1% with topical natamycin 5% for the treatment of filamentous fungal keratitis. Cornea. 2005;24(4):449–452. doi:10.1097/01.ico.0000151539.92865.3e
15. Prajna NV, Krishnan T, Mascarenhas J, et al. The mycotic ulcer treatment trial: a randomized trial comparing natamycin vs voriconazole. JAMA Ophthalmol. 2013;131:422–429. doi:10.1001/jamaophthalmol.2013.1497
16. Patil A, Majumdar S. Echinocandins in ocular therapeutics. J Ocul Pharmacol Ther. 2017;33:340–352. doi:10.1089/jop.2016.0186
17. Singh J, Chhabra G, Pathak K. Development of Acetazolamide-loaded, pH-triggered polymeric nanoparticulate in situ gel for sustained ocular delivery: in vitro. ex vivo evaluation and pharmacodynamic study. Drug Dev Ind Pharm. 2014;40:1223–1232. doi:10.3109/03639045.2013.814061
18. Djekic L, Ibric S, Primorac M. The application of artificial neural networks in the prediction of microemulsion phase boundaries in PEG-8 caprylic/capric glycerides based systems. Int J Pharm. 2008;361:41–46. doi:10.1016/j.ijpharm.2008.05.002
19. Chhonker YS, Prasad YD, Chandasana H, et al. Amphotericin-B entrapped lecithin/chitosan nanoparticles for prolonged ocular application. Int J Biol Macromol. 2015;72:1451–1458. doi:10.1016/j.ijbiomac.2014.10.014
20. Younes NF, Abdel-Halim SA, Elassasy AI. Corneal targeted Sertaconazole nitrate loaded cubosomes: preparation, statistical optimization, in vitro characterization, ex vivo permeation and in vivo studies. Int J Pharm. 2018;553:386–397. doi:10.1016/j.ijpharm.2018.10.057
21. Tavakoli N, Taymouri S, Saeidi A, Akbari V. Thermosensitive hydrogel containing sertaconazole loaded nanostructured lipid carriers for potential treatment of fungal keratitis. Pharm Dev Technol. 2019;24:891–901. doi:10.1080/10837450.2019.1616755
22. Patil A, Lakhani P, Taskar P, et al. Formulation development, optimization, and in vitro-in vivo characterization of natamycin-loaded PEGylated nano-lipid carriers for ocular applications. J Pharm Sci. 2018;107(8):2160–2171. doi:10.1016/j.xphs.2018.04.014
23. Hosny KM, Rizg WY, Alkhalidi HM, et al. Nanocubosomal based in situ gel loaded with natamycin for ocular fungal diseases: development, optimization, in-vitro, and in-vivo assessment. Drug Deliv. 2021;28:1836–1848. doi:10.1080/10717544.2021.1965675
24. Guo Y, Karimi F, Fu Q, Qiao G, Zhang H. Reduced administration frequency for the treatment of fungal keratitis: a sustained natamycin release from a micellar solution. Expert Opin Drug Deliv. 2020;17:407–421. doi:10.1080/17425247.2020.1719995
25. Kapoor DN, Bhatia A, Kaur R, Sharma R, Kaur G, Dhawan S. PLGA: a unique polymer for drug delivery. Ther Deliv. 2015;6:41–58. doi:10.4155/tde.14.91
26. Mir M, Ahmed N, Ur Rehman A. Recent applications of PLGA based nanostructures in drug delivery. Colloids Surf B Biointerfaces. 2017;159:217–231. doi:10.1016/j.colsurfb.2017.07.038
27. Ganaha F, Kao EY, Wong H, et al. Stent-based controlled release of intravascular angiostatin to limit plaque progression and in-stent restenosis. J Vasc Interv Radiol. 2004;15(6):601–608. doi:10.1097/01.rvi.0000127888.70058.93
28. Agrahari V, Agrahari V. Advances and applications of block-copolymer-based nanoformulations. Drug Discov Today. 2018;23:1139–1151. doi:10.1016/j.drudis.2018.03.004
29. Russo E, Villa C. Poloxamer hydrogels for biomedical applications. Pharmaceutics. 2019;11:671. doi:10.3390/pharmaceutics11120671
30. Agrahari V, Agrahari V, Mitra AK. Nanocarrier fabrication and macromolecule drug delivery: challenges and opportunities. Ther Deliv. 2016;7:257–278. doi:10.4155/tde-2015-0012
31. Qian Y, Wang F, Li R, Zhang Q, Xu Q. Preparation and evaluation of in situ gelling ophthalmic drug delivery system for methazolamide. Drug Dev Ind Pharm. 2010;36(11):1340–1347. doi:10.3109/03639041003801893
32. Permana AD, Utami RN, Layadi P, et al. Thermosensitive and mucoadhesive in situ ocular gel for effective local delivery and antifungal activity of itraconazole nanocrystal in the treatment of fungal keratitis. Int J Pharm. 2021;602:120623. doi:10.1016/j.ijpharm.2021.120623
33. Kong X, Xu W, Zhang C, Kong W. Chitosan temperature-sensitive gel loaded with drug microspheres has excellent effectiveness, biocompatibility and safety as an ophthalmic drug delivery system. Exp Ther Med. 2018;15(2):1442–1448. doi:10.3892/etm.2017.5586
34. Nafea EH, El-Massik MA, El-Khordagui LK, Marei MK, Khalafallah NM. Alendronate PLGA microspheres with high loading efficiency for dental applications. J Microencapsul. 2007;24:525–538. doi:10.1080/02652040701439807
35. Figueiredo M, Esenaliev R. PLGA nanoparticles for ultrasound-mediated gene delivery to solid tumors. J Drug Deliv. 2012;2012:767839. doi:10.1155/2012/767839
36. Rafiei P, A. H. Docetaxel-loaded PLGA and PLGA-PEG nanoparticles for intravenous application: pharmacokinetics and biodistribution profile. Int J Nanomedicine. 2017;12:935–947. doi:10.2147/IJN.S121881
37. Lv J, Yang J, Hao X, Ren X, Feng Y, Zhang W. Biodegradable PEI modified complex micelles as gene carriers with tunable gene transfection efficiency for ECs. J Mater Chem B. 2016;4(5):997–1008. doi:10.1039/c5tb02310f
38. Wang J, Li S, Chen T, et al. Nanoscale cationic micelles of amphiphilic copolymers based on star-shaped PLGA and PEI cross-linked PEG for protein delivery application. J Mater Sci Mater Med. 2019;30:93. doi:10.1007/s10856-019-6294-y
39. Wu TG, Wilhelmus KR, Mitchell BM. Experimental keratomycosis in a mouse model. Invest Ophthalmol Vis Sci. 2003;44:210–216. doi:10.1167/iovs.02-0446
40. Diebold Y, Jarrín M, Sáez V, et al. Ocular drug delivery by liposome–chitosan nanoparticle complexes (LCS-NP). Biomaterials. 2007;28:1553–1564. doi:10.1016/j.biomaterials.2006.11.028
41. Gratieri T, Gelfuso GM, Rocha EM, Sarmento VH, de Freitas O, Lopez RFV. A poloxamer/chitosan in situ forming gel with prolonged retention time for ocular delivery. Eur J Pharm Biopharm. 2010;75(2):186–193. doi:10.1016/j.ejpb.2010.02.011
42. Kojarunchitt T, Baldursdottir S, Dong Y-D, Boyd BJ, Rades T, Hook S. Modified thermoresponsive Poloxamer 407 and chitosan sol-gels as potential sustained-release vaccine delivery systems. Eur J Pharm Biopharm. 2015;89:74–81. doi:10.1016/j.ejpb.2014.11.026
43. Ulery BD, Nair LS, Laurencin CT. Biomedical applications of biodegradable polymers. J Polym Sci B Polym Phys. 2011;49:832–864. doi:10.1002/polb.22259
44. Arbade GK, Srivastava J, Tripathi V, Lenka N, Patro TU. Enhancement of hydrophilicity, biocompatibility and biodegradability of poly(ε-caprolactone) electrospun nanofiber scaffolds using poly(ethylene glycol) and poly(L-lactide-co-ε-caprolactone-co-glycolide) as additives for soft tissue engineering. J Biomater Sci. 2020;31(13):1648–1670. doi:10.1080/09205063.2020.1769799
 © 2022 The Author(s). This work is published and licensed by Dove Medical Press Limited. The
full terms of this license are available at https://www.dovepress.com/terms
and incorporate the Creative Commons Attribution
- Non Commercial (unported, 3.0) License.
By accessing the work you hereby accept the Terms. Non-commercial uses of the work are permitted
without any further permission from Dove Medical Press Limited, provided the work is properly
attributed. For permission for commercial use of this work, please see paragraphs 4.2 and 5 of our Terms.
© 2022 The Author(s). This work is published and licensed by Dove Medical Press Limited. The
full terms of this license are available at https://www.dovepress.com/terms
and incorporate the Creative Commons Attribution
- Non Commercial (unported, 3.0) License.
By accessing the work you hereby accept the Terms. Non-commercial uses of the work are permitted
without any further permission from Dove Medical Press Limited, provided the work is properly
attributed. For permission for commercial use of this work, please see paragraphs 4.2 and 5 of our Terms.