Back to Journals » International Journal of Nanomedicine » Volume 16
Therapeutic Potential of Novel Mastoparan-Chitosan Nanoconstructs Against Clinical MDR Acinetobacter baumannii: In silico, in vitro and in vivo Studies
Authors Hassan A ![]() , Ikram A, Raza A
, Ikram A, Raza A ![]() , Saeed S, Zafar Paracha R
, Saeed S, Zafar Paracha R ![]() , Younas Z, Khadim MT
, Younas Z, Khadim MT
Received 13 December 2020
Accepted for publication 27 March 2021
Published 1 June 2021 Volume 2021:16 Pages 3755—3773
DOI https://doi.org/10.2147/IJN.S296717
Checked for plagiarism Yes
Review by Single anonymous peer review
Peer reviewer comments 4
Editor who approved publication: Dr Thomas Webster
Afreenish Hassan,1 Aamer Ikram,1 Abida Raza,2 Sidra Saeed,2 Rehan Zafar Paracha,3 Zumara Younas,1 Muhammad Tahir Khadim1
1Department of Microbiology, Armed Forces Institute of Pathology, National University of Medical Sciences, Rawalpindi, Pakistan; 2NILOP Nanomedicine Research Laboratories, National Institute of Lasers and Optronics College, Pakistan Institute of Engineering and Applied Sciences, Islamabad, Pakistan; 3National University of Sciences and Technology, Islamabad, Pakistan
Correspondence: Abida Raza
NILOP Nanomedicine Research Laboratories, National Institute of Lasers and Optronics College, Pakistan Institute of Engineering and Applied Sciences, Lehtrar Road, Nilore, Islamabad, Pakistan
Tel +92519248671-6 ext. 3103, 3177
Fax +92 51 2208051
Email [email protected]
Afreenish Hassan
Department of Microbiology, Armed Forces Institute of Pathology, National University of Medical Sciences, Rawalpindi, Pakistan
Tel +92515176406 ext. 345
Email [email protected]
Purpose: Acinetobacter baumannii antibiotic resistant infections in high-risk patients are a great challenge for researchers and clinicians worldwide. In an effort to achieve potent bactericidal outcomes, a novel chitosan–mastoparan nanoconstruct (Mast-Cs NC) was designed and assessed for its therapeutic potential through in silico, in vitro and in vivo experimentation against clinical multidrug-resistant (MDR) A. baumannii.
Methods: Optimized 3D structures of mastoparan and chitosan were coupled computationally through an ionic cross-linker to generate a circular ring of chitosan encasing mastoparan. The complex was assessed for interactions and stability through molecular dynamic simulation (MDS). Binding pocket analysis was used to assess the protease–peptide interface. Mast-Cs NC were prepared by the ionic gelation method. Mast-Cs NC were evaluated in vitro and in vivo for their therapeutic efficacy against drug-resistant clinical A. baumannii.
Results: MDS for 100 ns showed stable bonds between chitosan and mastoparan; the first at chitosan oxygen atom-46 and mastoparan isoleucine carbon atom with a distance of 2.77 Å, and the second between oxygen atom-23 and mastoparan lysine nitrogen atom with a distance of 2.80 Å, and binding energies of − 3.6 and − 7.4 kcal/mol, respectively. Mast-Cs complexes approximately 156 nm in size, with +54.9 mV zeta potential and 22.63% loading capacity, offered > 90% encapsulation efficiency and were found to be geometrically incompatible with binding pockets of various proteases. The MIC90 of Mast-Cs NC was significantly lower than that of chitosan (4 vs 512 μg/mL, respectively, p< 0.05), with noticeable bacterial damage upon morphological analysis. In a BALB/c mouse sepsis model, a significant reduction in bacterial colony count in the Mast-Cs treated group was observed compared with chitosan and mastoparan alone (p< 0.005). Mast-Cs maintained good biocompatibility and cytocompatibility.
Conclusion: Novel mastoparan-loaded chitosan nanoconstructs signify a successful strategy for achieving a synergistic bactericidal effect and higher therapeutic efficacy against MDR clinical A. baumannii isolates. The Mast-Cs nano-drug delivery system could work as an alternative promising treatment option against MDR A. baumannii.
Keywords: Acinetobacter baumannii, mastoparan, antimicrobial resistance, simulation, chitosan, antimicrobial peptides, therapeutic efficacy, interactions
Introduction
Antibiotic-resistant bacterial infections are a critical healthcare challenge which is being faced globally.1 Acinetobacter baumannii has rapidly gained significant attention over the time, from being an innocuous organism to a superbug. It is one of the leading pathogens in nosocomial infections, responsible for ventilator-associated pneumonia, wound infections, septicemia and urinary tract infections, especially in the immunocompromised patients.2,3 Its genome has the ability to acquire resistance and to adapt its virulence mechanisms with the passage of time.4,5 Some A. baumannii strains even show resistance to the last-line available drugs, such as carbapenems and colistin.6 The Infectious Diseases Society of America has included A. baumannii in the hit list of the top six priority pathogens (ESKAPE) against which either no or very limited treatment options are available.7 In a nationwide surveillance program in China, conducted during 2005–2014, high resistance against imipenem (57%) and meropenem (61%) was reported in Acinetobacter spp.8 Drug-resistant A. baumannii can contribute as much as 63% to nosocomial infections.9 The mortality rate in ventilator-associated pneumonia caused by extensively drug-resistant A. baumannii strains can be as high as 84.3%.10 The alarmingly high disease burden of resistant A. baumannii has led to the exploration of alternative approaches. A phototheranostic nanoparticle-based antibiotic,11 photothermal eradication of bacterial biofilms,12 physical cavitation through laser irradiation,13 photodynamic therapy14 and polylactic co–glycolic acid nanocapsules15 have been applied to address the bacterial resistance phenomenon.
The therapeutic potential of antimicrobial peptides (AMPs) has been highlighted over the years. The unique electrostatic interactions between AMPs and bacterial cells have shown promising therapeutic results. Furthermore, AMPs, being small in nature, have the ability to penetrate cells and tissues and can show effective antimicrobial activity against both Gram-positive and Gram-negative bacteria without any specific binding to receptors.16–19 LL-37, melittin, indolicidin, Cec4, Agelaia-MP1, polybia–MPII, PolydimI and Con10 have shown high bactericidal activity against A. baumannii.20–24 LysAB2 P0–P3 has also demonstrated reasonably good in vitro and in vivo antibacterial activity (minimal inhibitory concentration [MIC] 4–64 μM) against multidrug-resistant (MDR) A. baumannii.25
Mastoparan is a 1479-Da positively charged peptide, extracted from wasp venom, which contains 14 amino acid residues (Ile–Asn–Leu–Lys–Ala–Leu–Ala–Ala–Leu–Ala–Lys–Lys–Ile–Leu–NH2).26 It is rich in hydrophobic residues (71%) and forms amphipathic helical structures. The proposed mechanism of action of mastoparan includes disruption of the cell membrane, through the barrel stave, toroidal pore, carpet or interfacial model,27 causing increased membrane permeability, cell lysis and ultimately death.
The in vitro and in vivo behavior of AMPs against bacteria can be predicted using in silico methodologies. Majumder et al applied a quantitative structure–activity relationship model based on an artificial neural network, and rationally predicted the MIC for mastoparan to be 14 μg/mL.28 Similarly, Ramachandran et al conducted molecular docking and free energy calculations to understand the drug interactions with oxacillinases produced by A. baumannii.29–31 The presence of proteases (serine protease, lysosomal acid alpha-glucosidase, cysteine protease, human calpain-1, prolylcarboxypeptidase, thimet oligopeptidase, dipeptidyl peptidase) lowers the stability of AMPs in biological fluids. This impedes the therapeutic application of AMPs in clinical practice.19,32,33 Several researchers have suggested encapsulating AMPs in smart and efficient drug delivery nanosystems, which not only provide protection from proteolytic degradation but also have the ability to generate synergistic effects.34–38 Fu et al reported a synergistic effect of chitosan and polymyxin B-loaded liposomes against biofilm producing A. baumannii.39 Similarly, Tamara et al used chitosan nanovehicles for protamine to enhance the antimicrobial activity toward Escherichia coli.40 In a study by Pourhajibagher et al, chitosan nanoparticles were used as an efficient vehicle for indocyanine green against A. baumannii.41
The aim of the present work is to develop a novel smart chitosan-encapsulated mastoparan drug delivery system and to assess its therapeutic efficacy against MDR A. baumannii clinical isolates both in vivo and in vitro. We have adopted innovative approaches to study the stability parameters of Mast-Cs NC using in silico molecular dynamic simulation (MDS). The suggested nanocomplex has been shown to be bactericidal against these bacteria, and may be a promising treatment solution against rapidly emerging drug resistance in A. baumannii organisms.
Materials and Methods
Ethical Approval
The Institutional Review Board at the Armed Forces Institute of Pathology, National University of Medical Sciences, Rawalpindi, approved the whole study, including the cell-line work (PhD-PATH-17-01/READ–IRB/19/202 NUMS, dated 4th March 2019), and the National Institute of Health, Islamabad, approved the use of animals (F.1-5/ERC/2019, dated 29th July 2019). The handling and use of animals followed International Council for Harmonisation guidelines.42 Human rhabdomyosarcoma (RD) cells ATCC CCL 136 were received as a gift from the National Institute of Health, Islamabad, Pakistan, for the cytocompatibility study only.
Materials
The mastoparan sequence (INLKALAALAKKIL-NH2), retrieved from antimicrobial peptide database AP00201, was synthesized with a purity of 97.48% and molecular weight of 1478.94 Da (Bio Basic, Canada). Chitosan (molecular weight 210 kDa, titration 77%, degree of deacetylation 92%). Other materials were acquired as follows: sodium tripolyphosphate (TPP, Na5P3O10; Daejung, Korea); acetic acid (Merck, Germany); MicroBCA assay kit (Bio Basic, Canada); DMEM, bovine calf serum, L-glutamine, Dulbecco’s phosphate-buffered saline (PBS), penicillin/streptomycin and MTT 3-(4,5-dimethylthiazol-2-yl)-2,5-diphenyltetrazolium bromide (Sigma Aldrich, USA). Immunocompetent BALB/c male mice weighing 16–20 g and aged 4–6 weeks were obtained from the National Institute of Health, Islamabad, Pakistan.
Confirmation of Multidrug-Resistant A. baumannii from Clinical Specimens
Acinetobacter baumannii was isolated from clinical specimens (including blood, pus, intravenous catheter tip and bronchoalveolar lavage) at the Armed Forces Institute of Rawalpindi, Pakistan, and confirmed biochemically. Antimicrobial susceptibility was checked using the Kirby–Bauer disk diffusion method/broth microdilution for cefotaxime (30 μg), ceftriaxone (30 μg), ceftazidime (30 μg), meropenem (10 μg), imipenem (10 μg), amikacin (30 μg), gentamicin (10 μg), tobramycin (10 μg), ciprofloxacin (5 μg), doxycycline (30 μg), minocycline (30 μg), tetracycline (30 μg), trimethoprim–sulphamethoxazole (1.25/23.75 μg) and polymyxin B (MIC ≤2 μg/mL sensitive; ≥4 μg/mL resistant). Results were interpreted as “sensitive” or “resistant” according to Clinical and Laboratory Standard Institute (M100) guidelines.43 The isolates that were concurrently resistant to more than one antimicrobial agent were further confirmed by PCR for aminoglycosides, quinolones and tetracyclines.44 The PCR mix was prepared as a volume of 25 μL comprising 200 µM dNTPs, 1.5 mM MgCl2, 1.25 U Taq DNA polymerase, 0.5 µM of each primer (forward and reverse of each gene), 5 µL PCR buffer (10×) and 2.5 µL DNA template. The PCR conditions were 95°C for 4 min, 30 cycles of 95°C for 50 s, 58°C for 60 s, 72°C for 45 s and final extension at 72°C for 5 min. Gel electrophoresis of the PCR amplified product was carried out in 1.5% agarose gel in 1× TBE buffer for 30 min at 80 V, stained with ethidium bromide. The gel was examined under ultraviolet illumination (Fisher Scientific, USA). A 100-bp ladder was used as the standard for determining the molecular mass of PCR products (Table 1).
 |
Table 1 Susceptibility and Genotypic Characterization of Acinetobacter baumannii Clinical Isolates Used in the Current Study |
In Silico Positioning and MDS of Mast-Cs Complex
The structure of mastoparan with PDB ID 1D7N (INLKALAALAKKIL) was retrieved from the RCSB database. The three-dimensional (3D) structure of mastoparan was prepared by correcting the bond orders, addition of hydrogens and filling in missing side chains in Maestro software, using the default parameters.45 Mastoparan was energy minimized to 0.3 Å RMSD. The two-dimensional (2D) structure of chitosan was sketched in MarvinSketch (https://chemaxon.com/) and converted to the 3D structure in Maestro visualizer.46 Ten monomers of chitosan were connected with TPP, as an ionic cross-linker, to create a circular ring. The structure was minimized using Macromodel with the Merck Molecular Force Field (MMFF).46 UCSF Chimera (1.13.1) was used to align the chitosan ring with mastoparan.47
MDS of the Mast-Cs complex was carried out for 100 ns using the Desmond module in Schrodinger.48 The complex was solvated using water model TIP3P in a cubic box. Counter ions were added to neutralize system charge. Desmond’s default minimization protocol was used to minimize the system. A temperature of 300K and 1 bar pressure were selected for equilibration. Finally, the system was simulated for 100 ns. A total of 1000 frames were collected. Trajectories were further investigated using the Simulation Quality Analysis tool available with Desmond.48 Root mean square deviation (RMSD), ligand torsion, hydrogen bonding and radius of gyrations were calculated to predict the complex structural changes and conformations in Mast-Cs. The complex was analyzed for interactions using Molecular Operating Environment (MOE) software.49 Electrostatic interactions of Mast-Cs were assessed using Pymol version 2.2.0.50
Computational Analysis of Enzyme–Peptide Behavior
Peptides are sensitive to degradation by proteases in serum. Vlieghe et al listed human proteolytic enzymes that are frequently involved in peptide degradation.19,51 The role of protein binding pockets is crucial for interaction specificity. To understand the interaction of Mast-Cs NC with human proteases, surface area, volume and binding pocket analysis was conducted.52 The surface binding analysis tool in UCSF Chimera (1.13.1) was used to analyze the total surface area, depth and enclosed volume of Mast-Cs nanoconstruct. The DoGsiteScorer (https://proteins.plus/) binding pocket analysis tool was used for the proteases, including serine protease, prolyl oligopeptidase, human neutrophil elastase, human chymotrypsin C, lysosomal acid alpha glucosidase, cysteine protease, human calpain-1, prolylcarboxypeptidase, thimet oligopeptidase and dipeptidyl peptidase.53 The algorithm behind the tool is a grid-based method which uses the difference of Gaussian filter to detect binding pockets, and calculates the size, shape and chemical features of pockets. Based on volume, hydrophobicity and enclosure, it generates a druggability score. Various binding pockets were detected for the analyzed proteins, centered on 3D heavy atom coordinates of the enzyme/protein (Table 2).
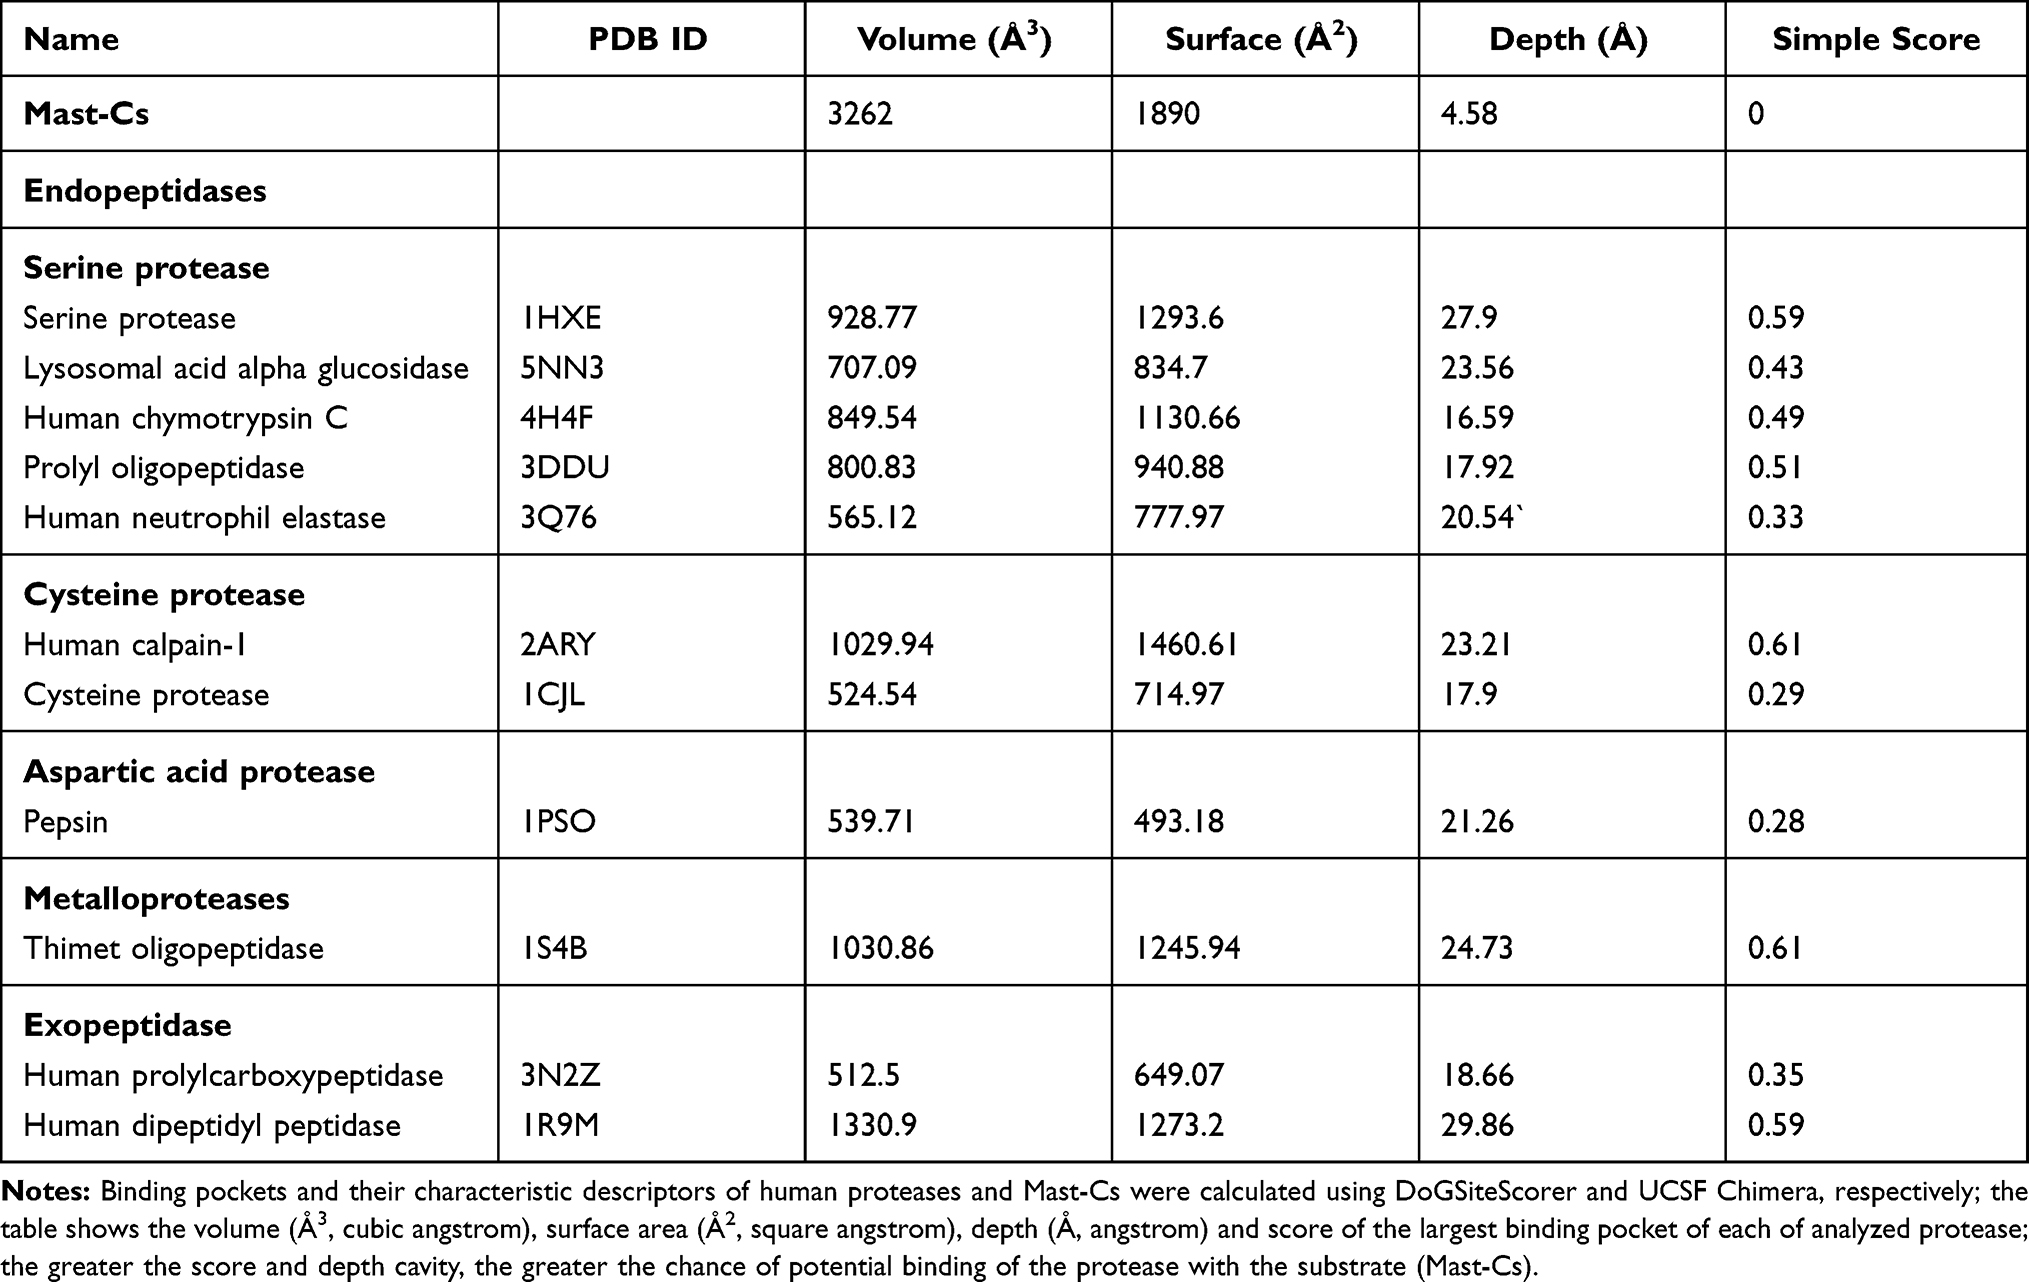 |
Table 2 Estimation of Mast-Cs–Proteases Interface |
Synthesis of Mast-Cs Nanoconstructs
Mast-Cs NC were prepared by an ionic gelation method.54 In brief, a stock solution of TPP was prepared in double-distilled water (5 mg/mL). Mastoparan (400 μg) was added to chitosan (1 mg/mL) in mild acetic acid (1% v/v, pH 5) under continuous stirring (600 rpm) at room temperature (22–25°C). Nanoformulations were sonicated with a probe sonicator of 6 mm diameter for 10 min, with sonication amplitude 60%, and pulse rate set at 40 s on, 20 s off (Vibra-Cell; Sonics, USA). They were then centrifuged for 10 min at 14,000 g and 4°C. The supernatant was assessed for the unconjugated mastoparan.
Characterization of Mast-Cs NC
The hydrodynamic size and zeta potential of Mast-Cs NC were measured by dynamic light scattering (DLS) (Nanotrac Wave II; Microtrac, USA). The formulation was diluted (1:1000) for testing. The dielectric constant of acetic acid as the solvent and the refractive index of chitosan at 25°C were adjusted. The morphology of Mast-Cs NC was studied by scanning electron microscopy (TESCAN Mira3; Alpha Contec, Germany).
Encapsulation Efficiency and Loading Capacity of Mast-Cs NC
The encapsulation efficiency (EE) and loading capacity (LC) were calculated using the bicinchoninic method (MicroBCA protein assay kit; Bio Basic, Canada) with standard controls. Optical density was measured at 562 nm (UV-1900, UV-visible spectrophotometer; Shimadzu, Japan). EE and LC were calculated using the formula:


Fourier Transform Infrared Spectroscopy (FTIR) of Mast-Cs NC
Functional groups involved in Mast-Cs interactions were assessed by FTIR spectroscopy. The results were recorded in the mid-IR range 4000−400 cm−1 using an FTIR spectrophotometer, with OMNIC™ version 6.0a software (Thermo Fisher Scientific, USA). FTIR spectra of optimized Mast-Cs NC, mastoparan alone and chitosan alone were compared to analyze interactions.
In Vitro A. baumannii Bactericidal Assay of Mast-Cs NC
Mast-Cs NC, mastoparan alone and chitosan (control) were tested against MDR A. baumannii using the broth microdilution method described by Weigand et al.55 Chitosan was used as the control for the test. For chitosan, concentrations ranging from 512 to 2 μg/mL were used. One row was used for each isolate, with up to 10 different dilutions of mastoparan and Mast-Cs solution (32, 16, 8, 4, 2, 1, 0.5, 0.25, 0.125 and 0.0625 μg/mL). Thus, 50 μL of each of the tested solutions (Mast-Cs, chitosan and mastoparan solution) was added to each well. Bacterial dilutions were prepared to obtain final concentrations of 5×10⁵ CFU/mL. For the purity plate, 10 μL from the growth control well was taken and added to 990 μL of sterile saline. It was further diluted (1:10) in sterile saline and 100 μL of the dilution was plated in nutrient agar plates. Microtiter plates were read after incubation at 37°C for 16–20 h using an ELISA plate reader (EZ Read 400 Microplate Reader; Biochrom, UK).
Data analysis was carried out using GraphPad Prism version 8.4.2. The t-test with 95% confidence intervals was used for statistical analysis of MIC values obtained for Mast-Cs NC, chitosan and mastoparan. A p-value <0.05 was taken as statistically significant.
Morphological Analysis of A. baumannii Treated with Mast-Cs NC
The copper grid was sputtered with gold using a Smart Coater (JEOL, USA) containing 0.1 mm gold target. Gold-coated grids were fixed with bacterial suspension (control, Mast-Cs NC treated and chitosan treated) for 30 s. The cells were stained with a drop of 1% phosphotungstic acid, pH 7.2, for 30 s. The excess stain was removed with filter paper. The grid was air dried before viewing. Images were recorded at magnifications ranging from 3000 to 18,000× under a scanning electron microscope (JSM IT200; JEOL, USA). An A. baumannii suspension without any treatment was taken as the control group.
Biocompatibility Assay of Mast-Cs NC
For this assay, 500 μL of washed red blood cells (RBCs) was suspended in PBS (10% in volume), mixed with Mast-Cs and mastoparan solution in varying concentrations (0.0625, 0.125, 0.25, 0.5, 1, 2, 4, 8 and 16 μg/mL), and incubated for 1 h at 37°C. The supernatant was measured for hemoglobin content along with the negative control (RBCs in PBS) and positive control (RBCs exposed to 1% Triton X-100). Percent hemolysis was calculated as follows:

Results were expressed as the mean ± SD of triplicate experiments. The t-test (GraphPad Prism version 8.02) was used to compare the groups; a p-value <0.05 was taken as significant.
Cytocompatibility Assay of Mast-Cs NC
For the in vitro cytocompatibility assay, 3×10³ RD cells were seeded in 96-well plates. After 24 h at 37°C in 5% CO2 and 85% humidity, the culture medium was removed and wells were exposed with Mast-Cs NC and mastoparan (concentrations ranging from 0.28 to 36 μg/mL) for a further 24, 48 and 72 h at 37°C in 5% CO2. Cells in DMEM alone were used as the blank. At the prescribed times, the formulations were removed and 3-(4,5-dimethylthiazol-2-yl)-2,5-diphenyltetrazolium bromide (MTT) (diluted 1:10) was added and incubated for 4 h at 37°C. The salt was reduced to formazan only by metabolically active cells. The solution was removed, and the formazan crystals were dissolved in DMSO. Measurement of formazan dye absorbance was carried out and cytocompatibility was expressed in terms of percent viability, Mast-Cs and mastoparan-treated cells were observed under a cell imager (EVOS FL; Life Technologies, UK) establish their morphology. Statistical analysis was performed using GraphPad Prism version 8.02. The t-test was used to compare the groups; a p-value <0.05 was taken as significant.
Bactericidal Activity of Mast-Cs NC in A. baumannii Sepsis Mouse Model
The sepsis model was optimized in BALB/c immunocompetent mice using MDR A. baumannii strain B10 (Table 1). Four groups (n=5 per group) of mice were categorized according to time of exposure of bacteria (a: 30 min; b: 1 h; c: 2 h; d: 4 h). The groups were challenged with a bacterial concentration of 1×10⁷ CFU/mL. At specified time intervals, mice were anesthetized for exsanguination and cardiac blood was collected. Then, 100 μL of collected blood thoroughly mixed in normal saline was used to make 10-fold serial dilutions. Each dilution (500 μL) was streaked on MacConkey’s agar plates, than incubated for 24–48 h at 37°C, followed by colony counts and culturing.
The group that was exposed for 1 h showed the highest bacterial count in blood. Therefore, the time interval of 1 h was selected for subsequent experiments. The Mast-Cs NC, chitosan (control) and mastoparan (control) were injected into mice in groups A, B and C, respectively, with five mice per group, at 1 h postinfection; group D was kept as a control without any treatment. At 30 min postinjection, mice were anesthetized for exsanguination and blood was drawn by cardiac puncture. The same procedure was followed for serial dilutions, culturing and colony counts as mentioned in the previous paragraph.
Statistical Analysis
Statistical analysis was carried out using GraphPad Prism version 8.02. Data are presented as mean with standard deviation where applicable. Student t-test was applied to assess statistical differences between the groups.
Results
In Silico Analysis of Mast-Cs Complex
We adapted innovative in silico approaches to understand the molecular interactions between mastoparan and chitosan before performing wet laboratory experiments. 3D structures of mastoparan and chitosan were positioned and Mast-Cs interactions were analyzed using MOE software.49 Interactions were observed between chitosan oxygen atom-46 and mastoparan isoleucine carbon atom with a distance of 2.77 Å, and between oxygen atom-23 and mastoparan lysine nitrogen atom with a distance of 2.80 Å. The binding energies of the two hydrogen bonds were found to be −3.6 and −7.4 kcal/mol, respectively. These factors resulted in the stability of the complex. Figure 1B shows the basic amino acids as pink circles with a blue outline, greasy as green circles with a gray outline, receptor exposure as clear white circles with a light blue glow and ligand exposure as dark blue circles with a dark blue glow. Electrostatic interactions were assessed on the Mast-Cs complex by Pymol version 2.2.0. Mastoparan is an amphiphilic peptide with both hydrophilic and hydrophobic ends, and the chitosan ring with anionic TPP encloses the peptide in its center. During in vitro experiments, the pH was kept at 5 (after repetitive optimizations), which enabled the repulsion of the two structures to be overcome. This led to the enhancement of the loading content of mastoparan in the nanoconstruct (Figure 1A–C).
 |
Figure 1 Computational analysis of the Mast-Cs complex. (A) Side view of the complex showing mastoparan surface (cyan) encapsulated by 10 chitosan monomers (attached by TPP) (green). Oxygen atoms are highlighted in red, nitrogen in blue and hydrogen in white. (B) Mastoparan–chitosan interactions obtained by Molecular Operating Environment software. Interactions were observed between chitosan oxygen atom-46 and mastoparan LEU9 carbon atom with a distance of 2.77 Å (blue dotted line) and between oxygen atom-23 and mastoparan LYS11 nitrogen atom with a distance of 2.80 Å (green dotted line). The binding energies of the two hydrogen bonds were −3.6 and −7.4 kcal/mol, respectively. Basic amino acids are presented as pink circles with a blue outline, greasy as green circles with a gray outline, receptor exposure as clear white circles with a light blue glow, and ligand exposure as dark blue circles with a dark blue glow. (C) Electrostatic interactions between mastoparan and chitosan were calculated by Pymol 2.2.0, demonstrated by positive (blue) and negative (red) charges on mastoparan, and chitosan, being positively charged, tends to attach to the negative end of mastoparan. Abbreviations: TPP, sodium tripolyphosphate; LEU, isoleucine; LYS, lysine. |
Mastoparan’s interactions with chitosan were evaluated during 100 ns molecular dynamics simulations in Desmond. RMSD values of the mastoparan and chitosan (ligand) were calculated relative to the structure present in the minimized equilibrated system. The ligand RMSD indicated the stability of chitosan with respect to mastoparan, while mastoparan RMSD demonstrated the stability of mastoparan throughout the simulation. The maximum RMSD found to be 2.5 Å at 5 ns, and the plot reached a plateau at 5 ns which remained nearly constant until 100 ns. This showed the stability of the complex during the simulations. The initial change in the RMSD that was observed between 1 and 4 ns may be due to adjustments of steric hindrances and atomic interactions. After 5 ns, the complex remained stable without any major conformational changes. The root mean square fluctuation (RMSF) showed the average mobility of mastoparan residues in the complex from its mean position. The interacting residues of mastoparan showed minor fluctuations. This caused adjustments of the molecules with each other and and an increase in stability (Figure 2A and B).
 |
Figure 2 In silico analysis of chitosan and mastoparan. (A) RMSD plot for Mast-Cs complex during 100 ns of molecular dynamic simulation. Mastoparan is shown in blue and chitosan in red. The RMSD values of mastoparan (left y-axis) and chitosan (right y-axis), calculated in angstroms (Å), were plotted against simulation time (x-axis 0–100 ns). (B) RMSF of mastoparan (Å) illustrated no/less fluctuation in the structure, and more rigidity in α-helices of mastoparan. (C) Mastoparan–chitosan interactions. Mastoparan–chitosan/ligand interactions are presented with interaction fractions on the y-axis and amino acids on the x-axis (green represents hydrogen bonding, pink represents ionic interactions, blue represents water bridges, purple representes hydrophobic interactions). (D) Timeline illustration of the Mast-Cs interactions presented with amino acids on the y-axis and time from 0 to 100 ns on the x–axis. The orange band on the right-hand side of the graph represents the number of contacts, ranging from zero (white) to more than four (dark orange). The graph shows alanine 7, alanine 10, isoleucine 13 and lysine 4 contributing to stable backbone hydrogen bonding throughout the 100 ns simulation. (E) Ligand torsion analysis over the course of the trajectory (0–100 ns). Each rotatable bond in the chitosan (ligand) is color coded. The dial plot (0–180°) represents the conformational changes in the bond over time. (F) Chitosan (ligand) properties over 100 ns simulation. Ligand RMSD (cÅ), radius of gyration (Å), intramolecular hydrogen bond, MolSA (Å), SASA (cÅ) and PSA Å) values during the simulation (y-axis) are presented with reference to time (100 ns on the x-axis). (G and H) Graphical illustrations of SSE analysis, with SSE (α-helix) represented in orange. SSE vs residue index (amino acids) shows an α-helix distribution by residue index; time (100 ns) vs residue index shows the SSE composition for each frame over the 100 ns simulation, and the plot shows the contribution of each residue over time. The structure of Mast-Cs remained globally conserved throughout the 100 ns simulation. Abbreviations: RMSD, root mean square deviation; RMSF, root mean square fluctuation; MolSa, molecular surface area; SASA, solvent-accessible surface area; PSA, polar surface area; SSE, secondary structure element. |
The mastoparan–chitosan (ligand) contact was assessed and plotted against time. This demonstrated the contribution of each amino acid to the interactions with chitosan. Lysine and isoleucine showed stable hydrogen bonding throughout the 100 ns simulation. The chitosan/ligand torsion plot demonstrated the conformational evolution of the ligand over the course of the trajectory. Mastoparan’s secondary structure (alpha helix) was monitored during the entire simulation. The secondary structure element (SSE) distribution was observed as the residue index. The secondary structure remained globally conserved during the entire simulation. The chitosan/ligand RMSD, intramolecular hydrogen bond within the ligand molecule, molecular surface area, solvent-accessible surface area and polar surface area were calculated during the 100 ns simulation study. The radius of gyration maintained a relatively steady value, which confirmed that the chitosan/ligand remained compact during the simulation (Figure 2C–H).
Computational Analysis of Enzyme–Peptide Behavior
Binding pocket analysis is an advanced and innovative approach which was used in this work to explore the effect of proteases on Mast-Cs nanocomplexes. The overall volume of the Mast-Cs structure was estimated as 3262 Å3 and the surface area as 1890 Å2. The volume of Mast-Cs NC was much greater than the volume of the largest binding pocket size of each of the analyzed proteases/peptidases. The interaction of the enzyme with the substrate depends on binding pocket conformation.56 The ligand binds with pockets when they are geometrically compatible with binding site assembly.57 A binding site score of zero for the Mast-Cs complex indicated that mastoparan binding sites were well encapsulated in the chitosan ring and there was no opportunity to interact with proteases and peptidases. This made the Mast-Cs nanocomplex suitable for in vivo therapeutic evaluation (Table 2).
Characterization of Mast-Cs NC
The prepared suspension of nanoparticles appeared homogeneous and opalescent. The hydrodynamic size of Mast-Cs NC was measured as approximately 156 nm and the zeta potential as +54.9 mV by DLS. Scanning electron microscopy estimated the size of particles as 93±8 nm (Figure 3). The formulation was kept at 2–8°C and continuously monitored for 4 days. The size remained constant at approximately 150 nm, with a zeta potential of about 54 mV. The FTIR spectrum of raw chitosan indicated a characteristic broad absorption peak at 3448 cm−1, which corresponded to the amino and hydroxyl group stretching vibrations (N–H and O–H bonds, stretch). The peak at 2870 cm−1 was responsible for –CH2 stretching (C–H bond, stretch). The characteristic bend at 1388 cm−1 represented the C–H bend. Mastoparan alone showed angular deformations at N–H bonds of the amino groups at 1540 cm−1. The spectrum of the conjugated formulation of mastoparan and chitosan indicated conformational change in peaks and bands: the N–H and O–H peak had broadened at 3200 cm−1, the N–H bands/peaks had widened at 1540–1590 cm−1, and the 1130 cm−1 peak had disappeared, owing to the interaction between mastoparan and the polymeric structure of chitosan (Figure 4). The EE was found to be 90.54%, indicating the high percentage of mastoparan enclosed in the nanoconstruct, while the LC was estimated as 22.63%.
 |
Figure 3 (A–C) Scanning electron microscopy (SEM) micrographs and dynamic light scattering analysis (DLS) of Mast-Cs NC. (A) SEM micrograph at magnification 70.0 k×, voltage 10.0 kV, working distance 11.91 mm, with 500 nm scale bar. (B) SEM micrograph at magnification 70.0 k×, voltage 10.0 kV, working distance 12.65 mm, with 500 nm scale bar. The size of synthesized nanoparticles on micrographs ranged from approximately 85 to 101 nm. (C) DLS particle size distribution graph represented with percent passing on the y-axis and size (nm) on the x-axis. The hydrodynamic size of Mast-Cs NC was measured as approximately 156 nm. Abbreviations: kV, kilovolts; Mast, mastoparan; Cs, chitosan; NC, nanoconstruct; A baumannii, Acinetobacter baumannii. |
 |
Figure 4 Fourier transform infrared spectra of Mast-CS NC, chitosan and mastoparan. The y-axis shows the percent transmittance and the x-axis the wave number (cm−1). The spectrum of raw chitosan (black line) indicates the characteristic broad absorption peak at 3448 cm−1, which corresponds to the amino and hydroxyl group stretching vibrations (N–H and O–H bonds, stretch). The peak at 2870 cm−1 is responsible for –CH2 stretching (C–H bond, stretch). The characteristic bend at 1388 cm−1 shows the C–H bend. Mastoparan (red line) shows angular deformations at the N–H bonds of the amino groups at 1540 cm−1. The spectrum of Mast-Cs NC (blue line) indicates conformational change in peaks/bands; the N–H and O–H peak has broadened at 3200 cm−1, and N–H bands/peaks have widened at 1540–1590 cm−1; the 1130 cm−1 peaks have disappeared, owing to the interaction between mastoparan and the polymeric structure of chitosan. Abbreviations: N–H, nitrogen–hydrogen; O–H, oxygen–hydrogen; C–H, carbon–hydrogen; Mast, mastoparan; Cs, chitosan; NC, nanoconstruct; A. baumannii, Acinetobacter baumannii. |
Susceptibility and Molecular Characterization of A. baumannii Clinical Isolates
Fifteen different clinical isolates of A. baumannii were tested in the present work. According to the age-wise distribution, three were isolated from patients in the age group 0–15 years, five in the age group 16–30 years, two in the age group 31–45 years and five in the age group 46–60 years. The male to female ratio was 13:2. Four isolates were from nasobronchial lavage, three from sputum, three from blood and two from pus, and one came from an intravenous catheter specimen. Fourteen different antibiotics were tested against these clinical isolates. All 15 A. baumannii strains were MDR and simultaneously resistant to more than one antimicrobial agent, ie, ceftazidime, ceftriaxone, cefotaxime, ciprofloxacin, tobramycin, tetracycline and trimethoprim–sulphamethoxazole. With regard to other antibiotics, A. baumannii was resistant to meropenem (73%), imipenem (73%), amikacin (80%), gentamicin (67%), doxycycline (87%) and minocycline (54%). All isolates were sensitive to polymyxin B. Antibiotic resistance genes for aminoglycosides (94%), quinolones (100%) and tetracyclines (100%) were observed in the strains. B10 isolate, which was used in the in vivo A. baumannii studies, was resistant to all 13 antibiotics, with the exception of polymyxin B (Table 1).
Mast-Cs NC Inhibits Bacterial Growth (In Vitro)
The antibacterial activities of Mast-Cs NC, chitosan (control) and mastoparan alone were tested against all clinical MDR A. baumannii isolates by both the spectrophotometric method and visual inspection.58 The MIC was taken as the lowest concentration that inhibits the growth of bacteria. Using the spectrophotometric method, the MIC was taken as the concentration of formulation where there is an abrupt decline in the absorbance value compared to drug-free growth control. The MIC50 and MIC90 were calculated using the formula (n + 1) × 0.5 and n × 0.9 (as n is an odd number of tested organisms in this study), respectively. Chitosan was used as the control and concentrations from 512 to 2 μg/mL were tested. The MIC50 for chitosan was calculated as 256 μg/mL and the MIC90 as 512 μg/mL; the MIC50 and MIC90 for Mast-Cs NC were calculated as 2 and 4 μg/mL, respectively; while for mastoparan alone, the MIC50 and MIC90 were calculated as 8 and 16 μg/mL, respectively (Figure 5A–C). The chitosan inhibited bacterial growth at high concentrations. It was observed that the addition of mastoparan with chitosan increased the antibacterial activity at low concentrations. A statistically significant difference (p<0.05) was found between the MIC values for Mast-Cs NC: chitosan alone and Mast-Cs NC: mastoparan alone.
 |
Figure 5 In vitro bactericidal assays of Mast-Cs NC against MDR A. baumannii. The MIC was measured for Mast-Cs NC, mastoparan and chitosan using a broth microdilution assay against 15 different MDR A. baumannii strains. (A) Graph showing absorbance (OD) on the y-axis and Mast-Cs NC concentration (μg/mL) on the x-axis. The MIC90 for Mast-Cs NC was calculated as 4 μg/mL. The patterns in MIC by visual turbidity in 96-well microtiter plates after treatment with Mast-Cs NC are presented below the graph. (B) Graph showing absorbance (OD) on the y-axis and chitosan concentration (μg/mL) on the x-axis. The MIC90 for chitosan alone (used as control) was calculated as 512 μg/mL. Patterns in MIC by visual turbidity in 96-well microtiter plates after treatment of A. baumannii with chitosan alone are presented below the graph. (C) Graph showing absorbance (OD) on the y-axis and mastoparan concentration (μg/mL) on the x-axis. The MIC90 for mastoparan was calculated as 16 μg/mL. The patterns in MIC by visual turbidity in 96-well microtiter plates after treatment with mastoparan alone are presented below the graph. Abbreviations: MIC, minimum inhibitory concentration; Mast, mastoparan; Cs, chitosan; NC, nanoconstruct; A. baumannii, Acinetobacter baumannii; MDR, multidrug-resistant; OD, optical density. |
The effect of Mast-Cs NC against bacteria was analyzed by fluorescence microscopy (Evos FL, Cell Imaging System; Thermo Fisher Scientific). The bacterial cells were treated with Nile red stain and imaged with a fluorescent microscope under a GFP cube. The untreated live bacteria appeared as fluorescent and maintained clear round structures, while the bacteria after treatment with Mast-Cs NC ceased to fluoresce and appeared deformed (Figure 6).
 |
Figure 6 Antibacterial effect of Mast-Cs NC against A. baumannii by fluorescence microscopy (Evos FL, Cell Imaging System; Thermo Fisher Scientific). (A and B) The A. baumannii cells were stained with Nile red and imaged with a fluorescent microscope under a GFP filter. Untreated live bacterial cells (10×X) (A) appeared as fluorescent and maintained clear round structures, while bacteria after treatment with Mast-Cs NC (6b) ceased to fluoresce and appeared deformed. (C and D) Unstained bacterial cells imaged with a fluorescent microscope. Untreated live bacterial cells (100×) (C) appeared as uniform round structures while bacteria after treatment with Mast-Cs NC (D) appeared distorted. Abbreviations: Mast, mastoparan; Cs, chitosan; NC, nanoconstruct; A. baumannii, Acinetobacter baumannii; GFP, green fluorescence protein. |
Morphology of A. baumannii Cells Treated with Mast-Cs NC Under SEM
In SEM micrographs, bacterial cells appeared dark when imaged on gold-coated grids with negative staining. The untreated A. baumannii (control) cells had a smooth surface with an intact membrane. After treatment with Mast-Cs NC, the A. baumannii cells lost their integrity and extracellular thread-like structures appeared around the cells. Chitosan-treated cells had intact surface integrity, with relatively round cells (Figure 7A–C). The synergistic action of nano-based formulations is supported by other studies. Mei et al reported increased membrane damage due to the activity of multicomponent nanostructures against Gram-positive and Gram-negative bacteria.59,60
 |
Figure 7 Scanning electron microscopy of A. baumannii treated with Mast-Cs NC and chitosan (control). (A) Image taken in high vacuum mode, magnification 14,000×, at a working distance of 12.3 mm, landing voltage 5.0 kV, FOV 9.143×6.857 µm, probe current 35.0, scan rotation 21.1°, with scale bar 1 µm. A. baumannii cells appeared as coccobacilli with an average diameter of 1.301 µm. The untreated bacterial cells were taken as a control group. (B) Image taken in high vacuum mode, magnification 18,000×, working distance 12.8 mm, landing voltage 5.0 kV, FOV 7.111×5.333 µm, probe current 35.0 A, scan rotation 21.1°, with scale bar 1 µm, showing A. baumannii cells after treatment with Mast-Cs NC. The damage to the cells’ integrity and extracellular projections can be observed. (C) Image taken in high vacuum mode, magnification 13,000×, working distance 12.7 mm, landing voltage 5.0 kV, FOV 9.846×7.385 µm, probe current 35.0 A, scan rotation 21.1°, with scale bar 1 µm, showing that bacterial cell surface integrity was maintained after exposure to chitosan. Abbreviations: FOV, field of view; kV, kilovolts; Mast, mastoparan; Cs, chitosan; NC, nanoconstruct; A. baumannii, Acinetobacter baumannii. |
Biocompatibility of Mast-Cs NC
Evaluation of the biocompatibility of synthesized Mast-Cs NC is essential for biomedical applications. The effect of different concentrations of Mast-Cs NC on total blood hemoglobin demonstrated that it remained biocompatible. No hemolysis was observed, even at higher concentrations, compared to the positive control. The intrinsic biocompatible nature of the polymer helped to maintain the integrity of RBC membranes. Mastoparan when tested alone showed dose-dependent hemolytic activity. There was increasing hemolysis as the concentration of mastoparan increased. The amino acid residues in mastoparan interacted with the zwitterionic membrane of the RBCs, leading to cytolysis. With a 95% confidence interval, 16 degrees of freedom and tcrit at 2.649, a two-tailed p-value of <0.0001 was obtained between the Mast-Cs and chitosan groups, which showed a statistically significant reduction in the two groups (Figure 8A and B).
 |
Figure 8 Biocompatibility assay of Mast-Cs NC and mastoparan. (A) Percent hemolysis is presented on the y-axis and concentration (μg/mL) on the x-axis. Mast-Cs NC percent hemolysis is shown in purple and mastoparan percent hemolysis is shown in blue. Mast-Cs NC at different concentrations (0.0625, 0.125, 0.25, 0.5,1, 2, 4, 8, 16, 32 μg/mL) showed 0% hemolysis. In contrast, mastoparan showed dose-dependent increasing hemolytic activity (0.0625, 0.125, 0.25, 0.5,1, 2, 4, 8, 16, 32 μg/mL). (B) Microtiter plate wells with mastoparan-treated RBC, Mast-Cs NC-treated RBC and Triton X-100-treated RBC (as positive control). No visible hemolytic phenomenon was observed with Mast-Cs NCs compared to the positive control of Triton X-100, which showed 100% hemolysis. Abbreviations: Mast, mastoparan; Cs, chitosan; NC, nanoconstruct; A. baumannii, Acinetobacter baumannii; RBC, red blood cells. |
Cytocompatibility of Mast-Cs NC
Human RD cells were exposed to different concentrations of Mast-Cs NC and mastoparan. At 24, 48 and 72 h of incubation, approximately 98% viability was observed with Mast-Cs NC compared to mastoparan, which presented 42–56% viability. Statistically significant differences (p<0.05) were observed for the two formulations tested at 24 and 48 h. RD cells maintained their regular morphology when treated with Mast-Cs NC, whereas mastoparan-treated cells lost their regular morphology after 24, 48 and 72 h of exposure (Figure 9A–D).
 |
Figure 9 Cytocompatibility assay of Mast-Cs NC against human RD cell lines. (A) Percent viability is presented on the y-axis and concentration (μg/mL) on the x-axis. Mastoparan results at 24, 48 and 72 h exposure are presented in light blue, purple and pink, respectively. Mast-CS NC results at 24, 48 and 72 h exposure are presented in green, dark blue and dark purple. The graph shows the rhabdomyosarcoma cell lines exposed to Mast-Cs and mastoparan concentrations (ranging from 0.28 to 36 μg/mL) for different durations (24, 48 and 72 h). At 24, 48 and 72 h of incubation with cell lines at ambient temperature, approximately 98% viability was observed with Mast-Cs NC, compared to mastoparan, which showed 42–56% viability. (B) Real-time microscopy of untreated RD cell lines, which are used as control (untreated cells). (C) Real-time microscopy of RD cells after treatment with Mast-Cs NC; the cells maintained their regular morphology, which is indicative of the viability of cells. (D) Real-time microscopy of mastoparan-treated cells, which have lost their regular morphology, indicating the cytotoxic effect of mastoparan. Abbreviations: Mast, mastoparan; Cs, chitosan; NC, nanoconstruct; A. baumannii, Acinetobacter baumannii; RD, rhabdomyosarcoma. |
Bactericidal Activity of Mast-Cs NC in A. baumannii Sepsis Mouse Model
The mice in the control group, 1 h postinoculation, were lethargic and showed decreased physical activity. The mice showed normal physical activity in the group that was treated with Mast-Cs NC. At 30 min, blood was withdrawn from each group, serially diluted and cultured. After 18–24 h of incubation at 37°C, the bacterial load in the control group was 4.47 log10 ±29,000 CFU/mL, compared to 3.53 log10 ±3400 CFU/mL in Mast-Cs NC, 4.33 log10 ±22,000 CFU/mL in the mastoparan test group and 4.2 log10 ±12,500 CFU/mL in the chitosan test group. Statistically significant differences were observed between the groups. With a 95% confidence interval, 4 degrees of freedom and tcrit at 14.48, a two-tailed p-value of <0.0001 was obtained between the Mast-Cs and chitosan groups, which indicated a statistically significant reduction in the study groups. Similarly, with a 95% confidence interval, 4 degrees of freedom and tcrit at 17.93, the student t-test was applied between mastoparan alone and Mast-Cs NC, which revealed a two-tailed p-value of <0.0001. A significant reduction in colony count (p<0.05) was seen in the in Mast-Cs NC-treated group compared to the control chitosan and mastoparan-treated groups. Thus, Mast-Cs NC led to significant bactericidal activity in the MDR A. baumannii septicemic mouse model (Figure 10).
 |
Figure 10 Bactericidal activity of Mast-Cs NC in an A. baumannii sepsis mouse model. The mean log(10) CFU/mL (blood) is presented on the y-axis, and control (black), chitosan (blue), Mast-Cs NC (yellow) and mastoparan (light blue) groups are presented on the x-axis. Bacterial load in the control group at 1 h 30 min after inoculation was 4.47 log10 CFU/mL. Bacterial load in the test group (Mast-Cs NC) at 30 min postinfection was 3.53 log10 CFU/mL, in the mastoparan test group at 30 min postinfection was 4.33 log10 CFU/mL and in the chitosan test group at 30 min postinfection was 4.2 log10 CFU/mL. Significant bactericidal activity was seen after treatment with Mast-Cs NC in multidrug-resistant septicemia. A statistically significant reduction in colony count (p<0.005) in the Mast-Cs NC-treated group was observed compared to the control and mastoparan-treated groups. Abbreviations: Mast, mastoparan; Cs, chitosan; NC, nanoconstruct; A. baumannii, Acinetobacter baumannii; CFU, colony-forming units; p value, level of significance/probability value. |
Discussion
Treatment of drug-resistant A. baumannii infections is a challenge for clinicians all over the world. Bacteria acquire resistance against conventional antibiotics through various mechanisms including decreased uptake of antibiotics, plasmid-mediated antibiotic resistance genes, enzymic inactivation of antibiotics and activation of efflux pumps.61 These rapidly emerging drug-resistant pathogens impede the development process of novel antibiotics, as these evolve rapidly to resist the effects of antibiotics. Alternate approaches such as antimicrobial peptides and chitosan-based nano-drug delivery systems offer promising directions.62 These can be deployed in nanotherapeutics to treat microbial infections. Nanotechnology has undoubtedly opened new avenues, particularly with regard to their function as vehicles for drug delivery. In the present work, mastoparan-loaded chitosan nanoconstructs were developed which effectively targeted MDR A. baumannii clinical isolates, both in vitro and in vivo. Moreover, computational studies on Mast-Cs complex helped us to understand their behavior at the molecular level (Figure 11).
 |
Figure 11 Illustrative diagram depicting the workflow of the present work: synthesis of Mast-Cs NC followed by in vitro characterization (DLS, SEM and FTIR), in silico analysis (MDS and peptide–enzyme behavior), in vitro studies (biocompatibility and cytocompatibility, broth microdilution MIC) and in vivo therapeutic efficacy studies. Abbreviations: Mast, mastoparan; Cs, chitosan; NC, nanoconstruct; A. baumannii, Acinetobacter baumannii; DLS, dynamic light scattering; SEM, scanning electron microscopy; FTIR, Fourier transform infrared spectroscopy; MDS, molecular dynamic simulation; MIC, minimum inhibitory concentration. |
Mastoparan, an amphiphilic antimicrobial peptide, is derived from wasp (Vespula lewissi) venom. Upon interaction with bacterial cell membrane, it binds along its long axis to the phospholipid bilayer, thus interfering with expansion of the outer structure of the bilayer. AMPs confer a distinctive mode of interaction with the bacterial cell wall, which evades specific protein binding sites or receptor-mediated uptake mechanisms.63 Vila-Farres et al reported that mastoparan inhibits bacterial growth with an MIC90 of 8 μg/mL.34 The MIC50 of mastoparan against A. baumannii isolates was observed to be 8–16 μg/mL.64 In our study, Mast-Cs NC showed a lower MIC90 value (2 μg/mL) compared to mastoparan alone (16 μg/mL). It is worth mentioning that in our study a statistically significantly reduction (p<0.05) in MIC values was observed with Mast-Cs NC compared to those of chitosan and mastoparan alone. Entrapment of mastoparan in chitosan nanovehicles enhanced its therapeutic efficacy. This confirms the success of this nanoformulation and its potential application against rapidly prevailing antibiotic-resistant strains.
Computational approaches were found to be helpful in understanding the dynamics of the interaction between chitosan and mastoparan. Chitosan is computationally aligned with mastoparan to achieve a spherical shape/structure. It is assumed that mastoparan becomes encased in the polymer matrix. Initially, during positioning, chitosan and TPP demonstrated structural steric clashes between amine groups and sodium groups, respectively. The repulsive forces due to overlapping electronic clouds may result in steric effects. Energy minimization was performed to overcome this hindrance and obtain a stable conformation. The resulting structure had reduced imprecision and formed a stable shape. MD simulations predicted the stable behavior of two structures as early as 5 ns, and supported in vitro and in vivo experimentation. Hydrophobic interactions were observed between mastoparan (amino acids) and chitosan, which were responsible for increases in EE and LC for mastoparan. Protease stability plays a pivotal role in the success of peptides.63,65 Zha et al used nanofibers to stabilize an anticancer peptide, which otherwise could be degraded by hyaluronidase enzyme.66 The lock-and-key interaction of enzymes with substrates is crucial for their substantial activity.52 In our study, computational examination showed that the total volume and surface area of the nanocomplex were geometrically incompatible with the protease binding pockets. This led to the good clinical outcome of the nanocomplex in the in vivo study.
During in vitro preparation, the size of the nanoconstruct was optimized by chitosan, with optimal TPP, temperature, pH of the solution and stirring rate. The polyphosphoric groups of TPP interacted with the ammonium groups of chitosan.67 The nanosize (85−101 nm) provided a larger surface area to volume ratio and increased the concentration gradient for mastoparan. The high encapsulation efficiency (90.54%) achieved in the present work undoubtedly demonstrates the success of the method. The appropriate size of the nanoparticles (~93 nm) attained in our work is a notable feature. It has been reported previously that a size of 200 nm or more can lead to the immediate activation of the lymphatic system and clearance from the body.68 Charge repulsion between chitosan and mastoparan is reduced by keeping the pH of solution acidic during preparation. The average particle size (93±8 nm) observed by SEM was less than that seen by DLS, which is attributed to the hydrodynamic diameter of nanoparticles compared to the microscopically observed particle size. A positive zeta potential (54.9 mV) of the nanoformulation was observed, which resulted in increased stability owing to the large electrostatic repulsion between particles.69
Chitosan has been reported to have bactericidal potential as a result of electrostatic interactions.70 Liu et al reported that chitosan-treated E. coli showed altered outer membranes in electron micrographs.64 Costa et al reported MIC values of 0.5–1 mg/mL against A. baumannii, while another study reported chitosan MIC ranging from 160 to 310 μg/mL.71,72 In the present in vitro experiments, chitosan alone showed an MIC50 of 256 μg/mL, whereas the Mast-Cs complex showed bacterial inhibition at concentrations as low as 2 μg/mL. The synergistic effect of chitosan with mastoparan led to a greater bactericidal effect, ie, an MIC90 of 512 μg/mL, and scanning electron micrographs confirmed the damage. Tamara et al also proved the synergistic effect of a combination of protamine (an AMP) and chitosan against pathogenic E. coli.40
A sepsis model was created by intraperitoneal inoculation of an extensively drug-resistant clinical strain of A. baumannii in BALB/c mice. In previous work, low-virulence A. baumannii strains were used to create sepsis models, and in order to achieve sustained infection, immunosuppressive agents were used.73 In our study, we used a highly virulent clinical MDR strain and studied the effect of a novel nanoconstruct in immunocompetent mice. This approach is also supported in other studies in which researchers have developed successful models using clinical isolates.74,75 Considering the bacterial inocula, freshly grown culture during the exponential phase were used. This helped to avoid the presence of dead bacterial cells in the inoculation dose. A significant reduction (p<0.05) in bacterial count was seen with Mast-Cs NC compared with mastoparan and chitosan alone. This indicated that once mastoparan had been encapsulated in the chitosan nanocarrier, it remained effective in the in vivo environment. However, results obtained in mouse sepsis models may not manifest all of the pathological mechanisms occurring in the human body. Despite the intrinsic limitations of the models, the present work provides fundamental understanding of antimicrobial-based nanosystems in an in vivo environment. Further work is warranted to evaluate the pharmacokinetic behavior of the suggested nanosystems.
Conclusion
The clinical utility of antimicrobial peptides can be enhanced with the use of nano-drug delivery systems. The present study has proposed a therapeutic solution for resistant microbial infections. Multiple in silico approaches have been used in an innovative way to understand and confirm the molecular interactions between mastoparan and chitosan prior to wet laboratory synthesis of Mast-Cs NC. We have successfully evaluated our hypothesis on the conjugation behavior of mastoparan with chitosan. In addition, the binding pocket score of “zero” of the Mast-Cs nanocomplex reveals that this nano-drug delivery system can evade the effects of proteases and peptidases. Mast-Cs NC causes a synergistic bactericidal effect, damaging the integrity of the bacterial cell surface more than mastoparan and chitosan alone. The lower MIC against A. baumannii signifies the potential worth of this system as an effective therapeutic tool. In an in vivo A. baumannii sepsis model created against extensively drug -resistant indigenous clinical isolates, this novel mastoparan chitosan drug delivery system led to good clinical outcomes. In this post-antibiotic era, when clinicians face challenges in treating drug-resistant infections, such innovative antimicrobial peptide-based nanosystems will be a valuable addition to the fields of clinical microbiology and nanomedicine.
Disclosure
All authors declare no conflicts of interest.
References
1. Andersson DI, Hughes D. Antibiotic resistance and its cost: is it possible to reverse resistance? Nat Rev Microbiol. 2010;8(4):260. doi:10.1038/nrmicro2319
2. Dexter C, Murray GL, Paulsen IT, Peleg AY. Community-acquired Acinetobacter baumannii: clinical characteristics, epidemiology and pathogenesis. Expert Rev Anti Infect Ther. 2015;13(5):567–573. doi:10.1586/14787210.2015.1025055
3. Wong D, Nielsen TB, Bonomo RA, Pantapalangkoor P, Luna B, Spellberg B. Clinical and pathophysiological overview of Acinetobacter infections: a century of challenges. Clin Microbiol Rev. 2017;30(1):409–447.
4. Nowak J, Zander E, Stefanik D, et al. High incidence of pandrug-resistant Acinetobacter baumannii isolates collected from patients with ventilator-associated pneumonia in Greece, Italy and Spain as part of the MagicBullet clinical trial. J Antimicrob Chemother. 2017;72(12):3277–3282. doi:10.1093/jac/dkx322
5. Harding CM, Hennon SW, Feldman MF. Uncovering the mechanisms of Acinetobacter baumannii virulence. Nat Rev Microbiol. 2018;16(2):91. doi:10.1038/nrmicro.2017.148
6. Ahmed SS, Alp E, Hopman J, Voss A. Global epidemiology on colistin resistant Acinetobacter baumannii. J Infect Dis Ther. 2016.
7. Cho YL, Yun JY, Chae SE, et al. Cephalosporin Derivatives and Pharmaceutical Compositions Thereof. Google Patents; 2017.
8. Hu F-P, Guo Y, Zhu D-M, et al. Resistance trends among clinical isolates in China reported from CHINET surveillance of bacterial resistance, 2005–2014. Clin Microbiol Infect. 2016;22:S9–S14. doi:10.1016/j.cmi.2016.01.001
9. Ventola CL. The antibiotic resistance crisis: part 1: causes and threats. Pharm Ther. 2015;40(4):277.
10. Inchai J, Pothirat C, Bumroongkit C, Limsukon A, Khositsakulchai W, Liwsrisakun C. Prognostic factors associated with mortality of drug-resistant Acinetobacter baumannii ventilator-associated pneumonia. J Intensive Care. 2015;3(1):9. doi:10.1186/s40560-015-0077-4
11. Guo X, Cao B, Wang C, Lu S, Hu XJN. In vivo photothermal inhibition of methicillin-resistant Staphylococcus aureus infection by in situ templated formulation of pathogen-targeting phototheranostics. Nanoscale. 2020;12(14):7651–7659. doi:10.1039/d0nr00181c
12. Wang C, Zhao W, Cao B, et al. Biofilm-responsive polymeric nanoparticles with self-adaptive deep penetration for in vivo photothermal treatment of implant infection. Chem Mater. 2020;32(18):7725–7738.
13. Cao B, Lyu X, Wang C, Lu S, Xing D, Hu XJB. Rational collaborative ablation of bacterial biofilms ignited by physical cavitation and concurrent deep antibiotic release. Biomaterials. 2020;262:120341. doi:10.1016/j.biomaterials.2020.120341
14. Xiao F, Cao B, Wen L, et al. Photosensitizer conjugate-functionalized poly (hexamethylene guanidine) for potentiated broad-spectrum bacterial inhibition and enhanced biocompatibility. Chin Chem Lett. 2020;31(9):2516–2519. doi:10.1111/jce.14669
15. Gao M, Long X, Du J, et al. Enhanced curcumin solubility and antibacterial activity by encapsulation in PLGA oily core nanocapsules. Food & Function. 2020;11(1):448–455. doi:10.1039/c9fo00901a
16. Mahlapuu M, Håkansson J, Ringstad L, Björn C. Antimicrobial peptides: an emerging category of therapeutic agents. Front Cell Infect Microbiol. 2016;6:194. doi:10.3389/fcimb.2016.00194
17. Sun E, Belanger CR, Haney EF, Hancock RE. Host defense (antimicrobial) peptides. In: Peptide Applications in Biomedicine, Biotechnology and Bioengineering. Elsevier; 2018:253–285.
18. Rossi LM, Rangasamy P, Zhang J, Qiu XQ, Wu GY. Research advances in the development of peptide antibiotics. J Pharm Sci. 2008;97(3):1060–1070. doi:10.1002/jps.21053
19. Vlieghe P, Lisowski V, Martinez J, Khrestchatisky M. Synthetic therapeutic peptides: science and market. Drug Discov Today. 2010;15(1–2):40–56. doi:10.1016/j.drudis.2009.10.009
20. Vila-Farres X, De La Maria CG, López-Rojas R, Pachón J, Giralt E, Vila J. In vitro activity of several antimicrobial peptides against colistin-susceptible and colistin-resistant Acinetobacter baumannii. Clin Microbiol Infect. 2012;18(4):383–387. doi:10.1111/j.1469-0691.2011.03581.x
21. Spencer JJ, Pitts RE, Pearson RA, King LB. The effects of antimicrobial peptides WAM-1 and LL-37 on multidrug-resistant Acinetobacter baumannii. Pathog Dis. 2018;76(2):fty007. doi:10.1093/femspd/fty007
22. Das Neves RC, Mortari MR, Schwartz EF, Kipnis A, Junqueira-Kipnis AP. Antimicrobial and antibiofilm effects of peptides from venom of social Wasp and scorpion on multidrug-resistant Acinetobacter baumannii. Toxins. 2019;11(4):216. doi:10.3390/toxins11040216
23. Peng J, Long H, Liu W, et al. Antibacterial mechanism of peptide Cec4 against Acinetobacter baumannii. Infect Drug Resist. 2019;12:2417. doi:10.2147/IDR.S214057
24. Neshani A, Sedighian H, Mirhosseini SA, Ghazvini K, Zare H, Jahangiri A. Antimicrobial peptides as a promising treatment option against Acinetobacter baumannii infections. Microb Pathog. 2020;146:104238.
25. Peng SY, You RI, Lai MJ, Lin NT, Chen LK, Chang KC. Highly potent antimicrobial modified peptides derived from the Acinetobacter baumannii phage endolysin LysAB2. Sci Rep. 2017;7(1):1–12. doi:10.1038/s41598-017-11832-7
26. Howl J, Howl L, Jones S. The cationic tetradecapeptide mastoparan as a privileged structure for drug discovery: enhanced antimicrobial properties of mitoparan analogues modified at position-14. Peptides. 2018;101:95–105. doi:10.1016/j.peptides.2018.01.007
27. Brogden KA. Antimicrobial peptides: pore formers or metabolic inhibitors in bacteria? Nat Rev Microbiol. 2005;3(3):238–250. doi:10.1038/nrmicro1098
28. Majumder A, Biswal MR, Prakash MK. Computational screening of antimicrobial peptides for Acinetobacter baumannii. PLoS One. 2019;14(10):e0219693. doi:10.1371/journal.pone.0219693
29. Skariyachan S, Muddebihalkar AG, Badrinath V, et al. Natural epiestriol-16 act as potential lead molecule against prospective molecular targets of multidrug resistant Acinetobacter baumannii-Insight from in silico modelling and in vitro investigations. Infect Genet Evol. 2020;82:104314.
30. Ramachandran B, Jeyakanthan J, Lopes BS. Molecular docking, dynamics and free energy analyses of Acinetobacter baumannii OXA class enzymes with carbapenems investigating their hydrolytic mechanisms. J Med Microbiol. 2020;69(8):1062–1078. doi:10.1099/jmm.0.001233
31. Amera GM, Khan RJ, Pathak A, Jha RK, Muthukumaran J, Singh AK. Computer aided ligand based screening for identification of promising molecules against enzymes involved in peptidoglycan biosynthetic pathway from Acinetobacter baumannii. Microb Pathog. 2020;147:104205.
32. Saito H, Sakakibara Y, Sakata A, et al. Antibacterial activity of lysozyme-chitosan oligosaccharide conjugates (LYZOX) against Pseudomonas aeruginosa, Acinetobacter baumannii and Methicillin-resistant Staphylococcus aureus. PLoS One. 2019;14(5):e0217504.
33. Meng H, Kumar KJ. Antimicrobial activity and protease stability of peptides containing fluorinated amino acids. J Am Chem Soc. 2007;129(50):15615–15622. doi:10.1021/ja075373f
34. Vila-Farrés X, López-Rojas R, Pachón-Ibánez ME, et al. Sequence-activity relationship, and mechanism of action of mastoparan analogues against extended-drug resistant Acinetobacter baumannii. Eur J Med Chem. 2015;101:34–40. doi:10.1016/j.ejmech.2015.06.016
35. Kobsa S, Saltzman WM. Bioengineering approaches to controlled protein delivery. Pediatr Res. 2008;63(5):513. doi:10.1203/PDR.0b013e318165f14d
36. Eslam ED, Astaneh SDA, Rasooli I, Nazarian S, Jahangiri A. Passive immunization with chitosan-loaded biofilm-associated protein against Acinetobacter baumannii murine infection model. Gene Rep. 2020;20:100708.
37. Fan T, Yu X, Shen B, Sun LJ. Peptide self-assembled nanostructures for drug delivery applications. J Nanomater. 2017;2017. doi:10.1155/2017/1806461
38. Brandelli A. Nanostructures as promising tools for delivery of antimicrobial peptides. Mini Rev Med Chem. 2012;12(8):731–741. doi:10.2174/138955712801264774
39. Fu YY, Zhang L, Yang Y, et al. Synergistic antibacterial effect of ultrasound microbubbles combined with chitosan-modified polymyxin B-loaded liposomes on biofilm-producing Acinetobacter baumannii. Int J Nanomed. 2019;14:1805. doi:10.2147/IJN.S186571
40. Tamara F, Lin C, Mi FL, Ho YC. Antibacterial effects of chitosan/cationic peptide nanoparticles. Nanomaterials. 2018;8(2):88. doi:10.3390/nano8020088
41. Pourhajibagher M, Hosseini N, Boluki E, Chiniforush N, Bahador AJ. Photoelimination potential of chitosan nanoparticles-indocyanine green complex against the biological activities of Acinetobacter baumannii strains: a preliminary in vitro study in burn wound infections. J Lasers Med Sci. 2020;11(2):187.
42. International Council for Harmonisation. ICH guidelines. homepage on internet; 2019. Available from: http://www.ich.org/products/guidelines/safety/article/safety-guidelines.html.
43. Clinical and Laboratory Standards Institute. Performance standards for antimicrobial susceptibility testing; Twenty-second Informational supplement. CLSI document M100-S22. Wayne, PA: Clinical and Laboratory Standards Institute; 2015.
44. Magiorakos AP, Srinivasan A, Carey R, et al. Multidrug‐resistant, extensively drug‐resistant and pandrug‐resistant bacteria: an international expert proposal for interim standard definitions for acquired resistance. Clin Microbiol Infect. 2012;18(3):268–281. doi:10.1111/j.1469-0691.2011.03570.x
45. Schrödinger Release 2016–2: Maestro. New York, NY: Schrödinger, LLC; 2017.
46. Schrödinger Release 2016–3: MacroModel. New York, NY: Schrödinger, LLC; 2016.
47. Pettersen EF, Goddard TD, Huang CC, et al. UCSF Chimera—a visualization system for exploratory research and analysis. J Computat Chem. 2004;25(13):1605–1612. doi:10.1002/jcc.20084
48. Schrödinger Release 2017–3: Desmond molecular dynamics system. New York, NY: DE Shaw Research; 2017.
49. Chemical Computing Group. Molecular operating environment (MOE). Montreal: Chemical Computing Group Inc; 2016.
50. DeLano WL. The PyMOL Molecular Graphics System. San Carlos, CA: Delano Scientific; 2002.
51. Razzaq A, Shamsi S, Ali A, et al. Microbial proteases applications. Front Bioeng Biotechnol. 2019;7:110. doi:10.3389/fbioe.2019.00110
52. Stank A, Kokh DB, Fuller JC, Wade RC. Protein binding pocket dynamics. Acc Chem Res. 2016;49(5):809–815. doi:10.1021/acs.accounts.5b00516
53. Volkamer A, Kuhn D, Rippmann F, Rarey M. DoGSiteScorer: a web server for automatic binding site prediction, analysis and druggability assessment. Bioinformatics. 2012;28(15):2074–2075. doi:10.1093/bioinformatics/bts310
54. Piras AM, Maisetta G, Sandreschi S, et al. Chitosan nanoparticles loaded with the antimicrobial peptide temporin B exert a long-term antibacterial activity in vitro against clinical isolates of Staphylococcus epidermidis. Front Microbiol. 2015;6:372. doi:10.3389/fmicb.2015.00372
55. Wiegand I, Hilpert K, Hancock RE. Agar and broth dilution methods to determine the minimal inhibitory concentration (MIC) of antimicrobial substances. Nature Protocols. 2008;3(2):163. doi:10.1038/nprot.2007.521
56. Coleman RG, Sharp KA. Protein pockets: inventory, shape, and comparison. J Chem Informat Model. 2010;50(4):589–603. doi:10.1021/ci900397t
57. Uddin R, Rafi S. Structural and functional characterization of a unique hypothetical protein (WP_003901628. 1) of Mycobacterium tuberculosis: a computational approach. Med Chem Res. 2017;26(5):1029–1041.
58. Balouiri M, Sadiki M, Ibnsouda SK. Methods for in vitro evaluating antimicrobial activity: a review. J Pharm Anal. 2016;6(2):71–79. doi:10.1016/j.jpha.2015.11.005
59. Mei L, Xu Z, Shi Y, et al. Multivalent and synergistic chitosan oligosaccharide-Ag nanocomposites for therapy of bacterial infection. Sci Rep. 2020;10(1):1–9.
60. Mei L, Zhang X, Wang Y, et al. Multivalent polymer–Au nanocomposites with cationic surfaces displaying enhanced antimicrobial activity. Polym Chem. 2014;5(8):3038–3044. doi:10.1038/ncomms4038
61. Sultan I, Rahman S, Jan AT, Siddiqui MT, Mondal AH, Haq QMR. Antibiotics, resistome and resistance mechanisms: a bacterial perspective. Front Microbiol. 2018;9:2066. doi:10.3389/fmicb.2018.02066
62. Cruz J, Ortiz C, Guzman F, Fernandez-Lafuente R, Torres R. Antimicrobial peptides: promising compounds against pathogenic microorganisms. Curr Med Chem. 2014;21(20):2299–2321. doi:10.2174/0929867321666140217110155
63. Bechinger B, Gorr S-U. Antimicrobial peptides: mechanisms of action and resistance. J Dent Res. 2017;96(3):254–260. doi:10.1177/0022034516679973
64. Liu H, Du Y, Wang X, Sun L. Chitosan kills bacteria through cell membrane damage. Int J Food Microbiol. 2004;95(2):147–155. doi:10.1016/j.ijfoodmicro.2004.01.022
65. Biswaro LS, da Costa Sousa MG, Rezende T, Dias SC, Franco OL. Antimicrobial peptides and nanotechnology, recent advances and challenges. Front Microbiol. 2018;9:855. doi:10.3389/fmicb.2018.00855
66. Zha RH, Sur S, Stupp SI. Self‐assembly of cytotoxic peptide amphiphiles into supramolecular membranes for cancer therapy. Adv Healthcare Mater. 2013;2(1):126–133. doi:10.1002/adhm.201200118
67. Qi L, Xu Z, Jiang X, Hu C, Zou X. Preparation and antibacterial activity of chitosan nanoparticles. Carbohydr Res. 2004;339(16):2693–2700. doi:10.1016/j.carres.2004.09.007
68. Bachmann MF, Jennings GT. Vaccine delivery: a matter of size, geometry, kinetics and molecular patterns. Nat Rev Immunol. 2010;10(11):787. doi:10.1038/nri2868
69. Honary S, Zahir F. Effect of zeta potential on the properties of nano-drug delivery systems-a review (Part 2). Trop J Pharm Res. 2013;12(2):265–273.
70. Landriscina A, Rosen J, Friedman AJ. Biodegradable chitosan nanoparticles in drug delivery for infectious disease. Nanomedicine. 2015;10(10):1609–1619. doi:10.2217/nnm.15.7
71. Costa E, Silva S, Vicente S, Veiga M, Tavaria F, Pintado M. Chitosan as an effective inhibitor of multidrug resistant Acinetobacter baumannii. Carbohydr Polym. 2017;178:347–351. doi:10.1016/j.carbpol.2017.09.055
72. Cobrado L, Azevedo M, Silva-Dias A, Ramos JP, Pina–Vaz C, Rodrigues AJ. Cerium, chitosan and hamamelitannin as novel biofilm inhibitors? J Antimicrob Chemother. 2012;67(5):1159–1162. doi:10.1093/jac/dks007
73. Harris G, KuoLee R, Xu HH, Chen W. Mouse models of Acinetobacter baumannii infection. Curr Protoc Microbiol. 2017;46(1):
74. Valentine SC, Contreras D, Tan S, Real LJ, Chu S, Xu HH. Phenotypic and molecular characterization of Acinetobacter baumannii clinical isolates from nosocomial outbreaks in Los Angeles County, California. J Clin Microbiol. 2008;46(8):2499–2507. doi:10.1128/JCM.00367-08
75. Jacobs AC, Thompson MG, Black CC, et al. AB5075, a highly virulent isolate of Acinetobacter baumannii, as a model strain for the evaluation of pathogenesis and antimicrobial treatments. MBio. 2014;5(3). doi:10.1128/mBio.01076-14
 © 2021 The Author(s). This work is published and licensed by Dove Medical Press Limited. The
full terms of this license are available at https://www.dovepress.com/terms
and incorporate the Creative Commons Attribution
- Non Commercial (unported, 3.0) License.
By accessing the work you hereby accept the Terms. Non-commercial uses of the work are permitted
without any further permission from Dove Medical Press Limited, provided the work is properly
attributed. For permission for commercial use of this work, please see paragraphs 4.2 and 5 of our Terms.
© 2021 The Author(s). This work is published and licensed by Dove Medical Press Limited. The
full terms of this license are available at https://www.dovepress.com/terms
and incorporate the Creative Commons Attribution
- Non Commercial (unported, 3.0) License.
By accessing the work you hereby accept the Terms. Non-commercial uses of the work are permitted
without any further permission from Dove Medical Press Limited, provided the work is properly
attributed. For permission for commercial use of this work, please see paragraphs 4.2 and 5 of our Terms.