Back to Journals » International Journal of Nanomedicine » Volume 16
Theranostic Nanoplatform with Sequential SDT and ADV Effects in Response to Well-Programmed LIFU Irradiation for Cervical Cancer
Authors Zhou J, Hou J, Liu S, Xu J, Luo Y, Zheng J, Li X, Wang Z ![]() , Ran H, Guo D
, Ran H, Guo D
Received 14 September 2021
Accepted for publication 15 November 2021
Published 7 December 2021 Volume 2021:16 Pages 7995—8012
DOI https://doi.org/10.2147/IJN.S339257
Checked for plagiarism Yes
Review by Single anonymous peer review
Peer reviewer comments 3
Editor who approved publication: Dr Yan Shen
Jun Zhou,1,* Jingxin Hou,1,2,* Shuling Liu,1 Jie Xu,1 Ying Luo,1 Jun Zheng,2 Xin Li,1 Zhigang Wang,2 Haitao Ran,2 Dajing Guo1
1Department of Radiology, Second Affiliated Hospital of Chongqing Medical University, Chongqing, 400010, People’s Republic of China; 2Chongqing Key Laboratory of Ultrasound Molecular Imaging & Department of Ultrasound, Second Affiliated Hospital of Chongqing Medical University, Chongqing, 400010, People’s Republic of China
*These authors contributed equally to this work
Correspondence: Dajing Guo Email [email protected]
Background: Some patients with cervical cancer have the need to preserve fertility; therefore, a minimally invasive treatment option that can effectively inactivate tumors in these patients is necessary.
Methods: In this paper, we designed and prepared nanoparticles (NPs) carrying IR780 and perfluorohexane (PFH) and characterized their properties. We focused on the promotion of programmed low-intensity focused ultrasound (LIFU) irradiation on the penetration and treatment of cervical cancer. First we used penetration-enhancing LIFU irradiation to promote the penetration of the NPs into 3D multicellular tumor spheroids (MCTSs) and tumors in tumor-bearing nude mice. Then we used re-therapeutic LIFU irradiation to achieve antitumor effects in vitro and in vivo. Photoacoustic (PA) and magnetic resonance (MR) imaging were used to monitor and evaluate the targeting and therapeutic effects of these NPs on tumor tissues.
Results: The NPs prepared in this paper exhibited high affinity for HeLa cells, and can selectively achieve mitochondrial localization in the cell due to IR780 assistance. The penetration-enhancing LIFU irradiation have the ability to promote the penetration of the NPs into cervical cancer models in vivo and in vitro. Under LIFU irradiation, the cytotoxic reactive oxygen species (ROS) produced by IR780 during the first half of the re-therapeutic LIFU irradiation and the physical acoustic droplet vaporization (ADV) effect after PFH phase transition during the second half of the re-therapeutic LIFU irradiation can achieve synergistic minimally invasive treatment of tumors, which can be visualized and evaluated by PA and MR imaging in vivo.
Conclusion: Well-programmed LIFU irradiation can promote NP penetration into deep tumor tissue and achieve antitumor effects simultaneously. Linking ROS + ADV effects can induce cell coagulation necrosis and lead to a comprehensive, long-term impact on tumor tissue, providing a conceptual theranostic nanoplatform for cervical cancer.
Keywords: cervical cancer, HeLa cell, sonodynamic therapy, reactive oxygen species, acoustic droplet vaporization, magnetic resonance
Introduction
In most regions, especially developing countries, cervical cancer is the second most common cause of cancer in females. Globally, an estimated 604,000 new cases of cervical cancer and 342,000 cervical cancer-related deaths occurred in 2020.1,2 The treatment of cervical cancer by radiotherapeutic and chemotherapeutic strategies have serious complications, such as the development of gastrointestinal-vaginal fistulae and gastrointestinal perforation,3 and some patients show resistance to radiotherapy and chemotherapy.4 Notably, traditional surgical treatment is not conducive to the preservation of uterine function in young women. Therefore, exploring a minimally invasive treatment technique that can effectively combat cancer and reduce the risk of various complications is of great significance for women who wish to retain their fertility, elderly individuals who cannot tolerate traditional treatment methods, and patients with advanced cervical cancer [International Federation of Gynecology and Obstetrics (FIGO) stages III–IV].
Photodynamic therapy (PDT) and photothermal therapy (PTT) have been extensively studied for minimally invasive tumor treatment.5–7 However, since the penetration depth of light waves into the human body is less than 10 mm,8 these methods have only certain effects on superficial tumors, which limit their effects to treat cervical cancer and its metastases at different FIGO stages. In addition, nanomedicines for PDT or PTT cannot penetrate deep into the tumor.9 A study has found that compared with the marginal area of the tumor, the hypoxic-ischemic microenvironment inside the tumor makes the genome of the intratumoral cancer cells more unstable and invasive.10 Thus, the abnormal physiological characteristics tumors are a large obstacle to the delivery of antitumor nanodrugs. A large number of studies have taken advantage of the enhanced permeability and retention (EPR) effect to passively target nanodrugs to tumors.11–13 However, only a small amount of nanodrugs gather at the tumor site, with the majority located around the tumor.14 Unfortunately, damaging only the marginal tissues of the tumor will increase the risk of tumor invasion and metastasis.15 During sonodynamic therapy (SDT), ultrasound (US) waves, which can reach a depth of 10 cm, are used to penetrate muscles and soft tissues,8 and its curative effects are not limited by the location of the tumor; thus, SDT has the potential to treat deep metastases. Studies16,17 have shown that in addition to the reactive oxygen species (ROS) mechanism, SDT can promote the penetration of nanoparticles (NPs) into tumors, thus overcoming many of the shortcomings of PDT treatment. However, due to the hypoxic microenvironment inside the tumor, a sustained antitumor effect is difficult to produce due to the insufficient amount of ROS produced at the tumor site during PDT or SDT.
Herein, to solve the above problems, as shown in Figure 1, we designed and prepared NPs loaded with the sonosensitizer IR780 and the phase transition material perfluorohexane (PFH). IR780 can produce cytotoxic ROS under light wave and sound wave irradiation for PDT and SDT treatment. Moreover, for photoacoustic (PA) imaging, IR780 contains a rigid cyclohexenyl ring on its heptamethine chain, which results in a stronger PA intensity and a more stable structure than indocyanine green. In addition, IR780 can selectively accumulate in tumor cells due to the overexpression of organic anion-transporting polypeptides (OATPs) on tumor cells to actively target the mitochondria of tumor cells.18–20 In view of the versatility of small molecules, the poorly water-soluble IR780 has been loaded into nanodrug carrier systems and used for the targeted diagnosis and treatment of tumors, which has caused an extensive research boom.21–23 PFH can produce a controllable acoustic droplet vaporization (ADV) effect under US irradiation and induce tumor vascular rupture and tissue erosion so that nanodrugs can more easily penetrate the tumor vascular barrier and effectively penetrate the tumor interior.17 In addition to the EPR effect and the active targeting effects of IR780, we proposed the use of penetration-enhancing low-intensity focused ultrasound (LIFU) irradiation and verified its effects to promote NP penetration. This system was evaluated in both 3D multicellular tumor spheroids (MCTSs) and in vivo experiments. Moreover, on the basis of the toxicity of ROS produced by SDT to tumor cells during the first half of the re-therapeutic LIFU irradiation, we used the ADV effects caused by PFH phase transition during the second half of the re-therapeutic LIFU irradiation to carry out cascade-amplifying sequential therapy to kill tumor cells. With the help of photoacoustic (PA) and magnetic resonance (MR) imaging, monitoring the targeted penetration and tumor treatment could both be achieved due to the effects of the theranostic NPs in response to the well-programmed LIFU irradiation in the tumor site in vivo. This minimally invasive antitumor therapy is expected to become a useful supplement for minimally invasive treatment for patients with cervical cancer.
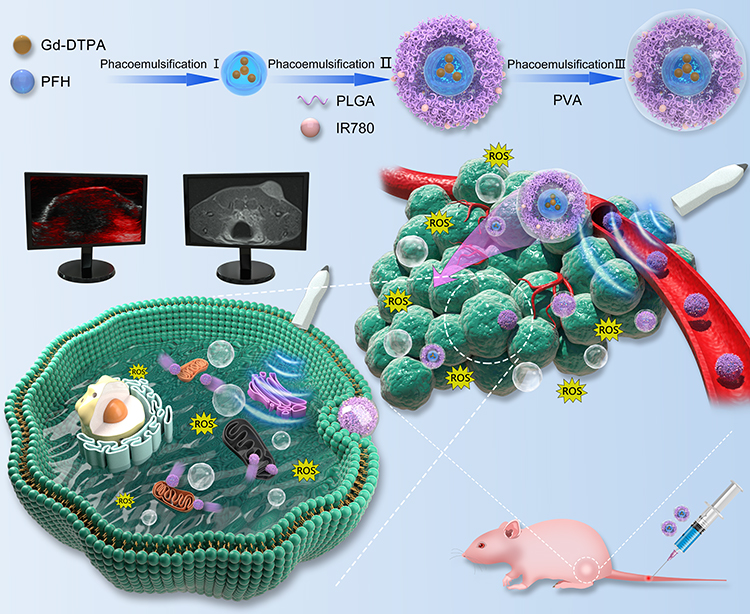 |
Figure 1 Schematic diagram of the preparation of the IGP@P NPs, the cascade-amplifying sequential therapeutic impacts of ROS generation and ADV effects caused by LIFU irradiation on tumors and real-time monitoring of the targeted penetration and therapeutic effects with the help of PA and MR imaging. |
Materials and Methods
Materials
Poly (lactic-co-glycolic acid) (PLGA) (75:25, PLGA 12,000 Da MW) was obtained from Daigang Biology Engineer Corp. (China). Gd-DTPA (0.5 mmol/mL) was obtained from GE Pharmaceutical Corp. (USA). PFH was acquired from J&K Scientific Corp. (China). IR780 iodide, 2,7-dichlorodihydrofluorescein diacetate (DCFH-DA) and 4,6-diamidino-2-phenylindole (DAPI) were from Sigma-Aldrich Corp. (USA). Cell Counting Kit-8 (CCK-8), an Annexin V-FITC apoptosis detection kit, calcein-AM (CAM) and propidium iodide (PI) were acquired from Dojindo (Japan). Singlet oxygen sensor green (SOSG) and MitoTracker Deep Red FM were purchased from Thermo Fisher Corp. (USA). 1,1′-Dioctadecyl-3,3,3′,3′-tetramethylindocarbocyanine perchlorate (DiI) and Hoechst 33342 were obtained from Beyotime Biotechnology Corp. (China). All other reagents used were of at least analytical grade.
NP Preparation
The I(IR780)G(Gd-DTPA)P(PFH)@P(PLGA) NPs were prepared by the emulsification method. First, Gd-DTPA (200 µL) and PFH (200 µL) were mixed, and an ultrasonic vibrometer (Sonics & Materials, Inc., USA) was used for the first emulsification (90 W, 6 min). PLGA (50 mg) and IR780 (0.5 mg) were fully dissolved in CH2Cl2 (2 mL) as the original solution, and the first emulsification was added to the original solution for the second emulsification (90 W, 3 min). Next, 4% polyvinyl alcohol solution (9 mL) was added, and the third emulsification (60 W, 2 min) was performed. Then, a 2% isopropanol solution (10 mL) was added and the mixture was magnetically stirred in an ice water bath for 3 h to remove the CH2Cl2. After stirring, the mixture was centrifuged (10,000 rpm, 5 min), and the precipitate was washed 3 times to collect the IGP@P NPs, which were freeze-dried for later use. IG@P NPs, IP@P NPs, and GP@P NPs were all prepared at the same time. In the first step, the PFH (200 µL) or Gd-DTPA (200 µL) was replaced with double distilled water (200 µL) to obtain IG@P NPs and IP@P NPs, respectively. To prepare the GP@P NPs, PLGA (50 mg) was added to the original solution without IR780. To prepare DiI-labeled NPs, an appropriate amount of DiI was added to the CH2Cl2 in addition to PLGA and IR780.
NP Characterization
The size and zeta potential of the NPs were detected by dynamic light scattering (DLS; ZEN3600, Malvern Instruments, UK). Scanning electron microscope (SEM; Hitachi S-3400N, Hitachi, Ltd., Tokyo, Japan) was used to characterize the three-dimensional structure of IGP@P. Confocal laser scanning microscope (CLSM; A1R, Nikon, Tokyo, Japan) was used to characterize DiI-labeled IGP@P. High-resolution transmission electron microscope (HRTEM; JEM 2100, JEOL Ltd., Tokyo, Japan) was used to detect the morphology and structure of IGP@P with electron-dense Gd and IP@P without Gd, and the distribution of various elements (I, Gd, F) in the NPs was observed in combination with energy dispersive spectrometry (EDS). Inductively coupled plasma optical emission spectrometer (ICP-OES; ICP-OES730, Agilent Co. Ltd., USA) was used to determine the carrier rate of Gd-DTPA in each group of Gd-containing NPs. The appearance of the GP@P and IGP@P NP solutions were observed, and photos were recorded, the size distribution of the IGP@P NPs dispersed in PBS (1 mg mL-1) within 7 days were recorded. An ultraviolet-visible-near-infrared (UV-Vis-NIR) spectrophotometer (UV-3600, Shimadzu, Japan) was used to record the UV-Vis-NIR absorption spectra of free IR780 and the IG@P, GP@P, and IGP@P NPs at room temperature. By constructing a standard concentration curve of free IR780 at 790 nm, the carrier rate of IR780 in the IG@P and IGP@P NPs was determined. To quantitatively evaluate the ROS generation of IGP@P after LIFU irradiation in vitro, 10 µL of a 50 µM SOSG methanol solution was added to 2 mL of IGP@P NP suspension (100 µg/mL) followed by treatment with LIFU (2.5 W/cm2) for 2, 4, or 6 min, and the fluorescence intensity of SOSG was measured in the range of 500–800 nm with a fluorescence spectrophotometer (RF-5301PC, Shimadzu, Japan). Additionally, the changes in the size and morphology of the NPs were observed with an optical microscope at various time points (2, 4, and 6 min).
PA and MR Imaging of the NPs in vitro
An IGP@P NP suspension (0.5 mg/mL) was used to perform PA imaging in vitro at different laser excitation wavelengths from 680 to 970 nm, and the best excitation wavelength was determined to be 790 nm. Subsequently, PA imaging was performed on different concentrations of IGP@P (0, 0.625, 1.25, 2.5, 5, 10 mg/mL) at an excitation wavelength of 790 nm to obtain PA images of the NPs. A Vevo LAZR PA system (VEVO 2100, FUJIFILM Visual Sonics, Inc., USA) was used to measure the PA intensity in the region of interest (ROI) with different concentrations of NPs.
To perform MR imaging of the NPs in vitro, IGP@P NPs were combined with a 1% agar solution to obtain a mixed solutions with Gd-DTPA concentrations of 0.2, 0.6, 1.0, 1.4, 1.8, and 2.2 mM, and each sample was then transferred to a 5 mL Eppendorf (EP) tube with a diameter of 1 cm. After solidification, a 3.0 T MR scanner (MAGNETOM Prisma, Siemens Healthcare, Erlangen, Germany) was used for T1-weighted image (T1WI) scanning with the following scanning parameters: TR = 650, TE = 11, flip angle = 150°, FOV = 70 mm, slice thickness = 1.4 mm. According to the obtained T1WI, the T1 signal intensity in the ROI was measured. The measurement was repeated three times, the r1 value of the NPs was calculated, and postprocessing software was used to obtain the corresponding pseudocolor image.
Cell Experiments
Cervical cancer (HeLa) cells obtained from the Chinese Academy of Sciences were cultured in modified Eagle’s medium (MEM) containing 10% fetal bovine serum and 1% dual antibiotics. Cells were cultured under the recommended conditions at 37°C in a simulated normoxic environment containing 5% CO2.
In vitro Safety Test of the NPs
Cells were seeded in a 96-well culture plate at 37°C with 5% CO2 in MEM and seeded at a density of 1×10⁴ cells/well for 24 h for cell adherence to the culture plate. Then, the above medium was replaced with fresh medium containing different concentrations (0, 2.5, 5, 7.5 and 10 mg/mL) of IGP@P NPs. After incubation for 3, 6, 12 or 24 h, cell viability was determined by the CCK-8 method. The optical density (OD) at 450 nm was measured with an EL×800 universal microplate reader (BioTek Instruments Inc., USA).
Intracellular NP Uptake and Their Colocalization with Mitochondria
To observe NP uptake into cells, HeLa cells (1 × 10⁵/dish) were passaged in a CLSM culture dish for 24 h followed by incubation with DiI-GP@P or DiI-IGP@P NPs (1 mL, 1 mg/mL) for different lengths of time (1, 3, and 6 h). Then, the dish was washed with PBS, fixed with 4% paraformaldehyde for 15 min and stained with DAPI for 15 min. CLSM was used to observe the NP uptake by HeLa cells at different time points. To quantitatively evaluate the intracellular uptake, quantitative fluorescence maps were constructed using ImageJ (National Institutes of Health, Bethesda, Maryland, USA).
To verify the affinity targeting and location of the NPs containing IR780 (IGP@P) to the mitochondria, HeLa cells (1 × 10⁵/dish) were passaged in CLSM culture dishes, and DiI-GP@P or DiI-IGP@P NPs (1 mL, 1 mg/mL) were dispersed in MEM for incubation with the cells for 6 h. Then, MitoTracker was used to label the HeLa cell mitochondria for 30 min, and CLSM was used to observe the mitochondrial localization of DiI-IGP@P, quantitative fluorescence maps were constructed using ImageJ.
Targeted Penetration of the NPs into 3D MCTSs
A 3D MCTS model was used to verify the penetration ability of the IGP@P NPs in vitro. Specifically, HeLa cells were inoculated in spheroid microplates (6 × 10⁴ cells per well). After one week of culture, DiI-IGP@P NPs in MEM diluent (1 mL, 2 mg/mL) containing Hoechst 33342 were added, and pulsed penetration-enhancing LIFU irradiation (2.5 W/cm2 for 20 s, with two total treatments at a 10 min interval) was applied followed by incubation for 6 h. Then, the cells were washed with PBS and multiscanned by CLSM with an interval of 3 μm to observe the effects of LIFU irradiation on the ability of DiI-IGP@P NPs to penetrate the MCTSs. The control group did not have LIFU irradiation applied.
Evaluation of the Cell Therapy Effects and Treatment Mechanism
To analyze the cell therapy effects and treatment mechanism, this experiment evaluated the generation of ROS, the phase transition of the NPs inside HeLa cells, and the apoptosis/necrosis rate of HeLa cells at the cellular level after treatment. The groupings were as follows: IG@P + LIFU group, GP@P + LIFU group, IGP@P + LIFU group, and IGP@P without LIFU group, HeLa cells cultured in MEM without any treatment were as control group. The different groups of NPs (1 mg/mL) were dispersed in MEM (1 mL), incubated with HeLa cells (1×10⁵ cells/dish) for 6 h, washed with PBS, and treated or not with LIFU at an intensity of 2.5 W/cm2 for 2, 4, or 6 min, and each index was evaluated. Each experiment was repeated three times, the average values were taken as the experimental results, and the measurement data for each indicator was transformed into count data.
Cellular ROS Generation
Intracellular ROS production was detected using DCFH-DA in a ROS assay kit. DCFH-DA was added to each dish followed by incubation for 30 min, and CLSM was used to observe the fluorescence intensity of the above groups at different time points. ImageJ was used to quantify the fluorescence intensities. When the fluorescence intensity of ROS is ≤ 200 (a.u.), the ROS generation is negative (-); 200 (a.u.) < fluorescence intensity ≤ 2000 (a.u.), the ROS generation is positive (+); and when the fluorescence intensity is > 2000 (a.u.), the ROS generation is highly positive (++).
NP Phase Transition Inside Cells
Cells were gently scraped with a cell scraper at different time points (2, 4, and 6 min). Each cell suspension from each time point was placed into a 1.5 mL pointed EP tube, and the samples were centrifuged (1000 rpm, 5 min). The supernatant was aspirated, and 1 mL of 2.5% glutaraldehyde fixative solution was slowly added at 4°C. Then, the cells were fixed, dehydrated and dried with a critical point dryer. TEM was used to observe the phase transition and morphological changes to the NPs inside the cells after LIFU irradiation (2.5 W/cm2) for different lengths of time. When the number of NPs undergoing phase transition inside the cell is 0, the result is negative (-); 1 ≤ the number of NPs undergoing phase transition inside the cell ≤ 10, the result is positive (+); and when the number of NPs undergoing phase transition inside the cell is > 10, the result is highly positive (++).
Assessment of Apoptosis/Necrosis
At each time point (2, 4, or 6 min), cell viability was detected by the standard CCK-8 method, and the apoptosis/necrosis rate of each group was calculated. To observe the therapeutic effects more intuitively, CAM and PI staining were performed at different time points in the control and IGP@P + LIFU group to distinguish between live and dead cells. In addition, HeLa cells were collected by centrifugation (1000 rpm, 5 min), fixed into clumps with 2.5% glutaraldehyde fixing solution (4°C), dehydrated and critically dried. SEM (SU8020, Japan) was used to observe the changes in cell morphology in the control and IGP@P + LIFU group at different time points. When the apoptosis/necrosis rate ≤ 10%, the result is negative (-); 10% < apoptosis/necrosis rate ≤ 20% the result is positive (+); 20% < apoptosis/necrosis rate ≤ 40% is highly positive (++); 40% < apoptosis/necrosis rate ≤ 90% is very highly positive (+++); and when the apoptosis/necrosis rate is > 90%, the result is extremely highly positive (++++).
Animal Experiments
Establishment of a Cervical Cancer Model
Female nude mice (4–6 weeks; 18–22 g) were purchased from the Animal Center of Chongqing Medical University and kept in a suitable environment with free access to food and water. All experiments were approved by the Institutional Animal Protection and Utilization Committee of Chongqing Medical University. All experimental procedures were performed in conformity with the guidelines of the National Institutes of Health Guide for the Care and Use of Laboratory Animals (NIH publication No. 85–23, revised 1996). To construct HeLa tumor xenografts, 1×10⁶ HeLa cells suspended in 100 µL of PBS solution were subcutaneously injected into the right side of each nude mouse.
PA Monitoring of in vivo Targeting
When the tumor volumes reached 100 mm3, the nude mice (n = 5) were anesthetized with 3% isoflurane, and IGP@P NPs (5 mg/mL, 200 µL) were injected through the tail veins. In vivo PA imaging was performed at time 0 (before injection) and at 3, 6, and 12 h after injection. The ROI was placed at the center of the tumor, and the PA intensity was analyzed at different time points (0, 3, 6, and 12 h).
MR Imaging and the Corresponding in vivo Pathological Evaluation of Targeted Penetration
For targeted MR imaging in vivo, DiI-labeled IGP@P NPs (5 mg/mL, 200 µL) were injected through the tail vein of the nude mice (n = 10), and a 3.0 T MR scanner was used for T1WI scanning at time 0 (before the injection) and at 3 and 6 h after injection. The scan parameters were as follows: TR = 650 ms, TE = 11ms, flip angle = 150°, FOV = 70 mm, slice thickness = 1.4 mm. Based on the results from the 3D MCTS model, we believe that LIFU irradiation can promote the penetration of NPs into tumors. Therefore, 6 h after the injection of DiI-labeled IGP@P NPs, we performed the first penetration-enhancing LIFU irradiation treatment at the tumor site (n = 5, 2.5 W/cm2 for 10 min, with two total treatments at a 10 min interval). Six hours after irradiation (12 h after NP injection), T1WI scanning was performed again. In the control group (n = 5), DiI-labeled IGP@P NPs (5 mg/mL, 200 µL) were injected through the tail vein, T1WI scanning was performed at 0, 3, 6, and 12 h after injection; however, the first penetration-enhancing LIFU treatment was not applied at 6 h. The T1 signal intensity of the tumor and adjacent muscle tissue was measured at different time points, and the signal-to-noise ratio (SNR) was calculated (SNR = S/N, where S = T1 signal intensity of the tumor and N = T1 signal intensity of the adjacent muscle tissue). Syngo.via Frontier-cenimatic rendering VRT tool was adopted to obtain tumor 3D maps.
After MR T1WI scanning, the tumor masses were removed and immersed in 4% paraformaldehyde for pathological analysis. The nuclei were stained with DAPI for 15 min after the tumor mass was pathologically sectioned (slice thickness of 5 µm), and the distribution and penetration of DiI-labeled IGP@P NPs in the tumor were observed with an inverted fluorescence microscope.
In vivo Antitumor Efficacy
MR imaging and corresponding pathological evaluation were used to evaluate antitumor efficacy in vivo. We irradiated the mouse tumors with re-therapeutic LIFU (2.5 W/cm2, 20 min) 12 h after injection of IGP@P NPs (IGP@P + LIFU group, n = 5), and T2WI scanning was performed before and 6 h after the re-therapeutic LIFU irradiation (ie, 18 h after NP injection). The scan parameters were as follows: TR = 5560 ms, TE = 85 ms, flip angle = 150°, FOV = 80 mm, slice thickness = 0.7 mm. The other group (normal saline + LIFU group, n = 5) was injected with normal saline. The first penetration-enhancing LIFU irradiation and re-therapeutic LIFU irradiation were applied at the appropriate time points. The T2 signal intensities of the tumor and adjacent muscle tissue were measured at different time points, and the SNR was calculated (SNR = S/N, where S = T2 signal intensity of the tumor and N = T2 signal intensity of adjacent muscle tissue). Syngo.via Frontier workstation was adopted to obtain pseudocolor images of the tumor cross sections.
After the tumor-bearing mice were again irradiated with re-therapeutic LIFU and MR T2WI scanning was completed 6 h later, we used pathological slices to verify the therapeutic effects after MR scanning. The nude mice were sacrificed, and the tumors were removed and stored in 4% paraformaldehyde. Changes in tumor tissue were observed after treatment with hematoxylin and eosin (H&E) staining on 5 µm thick slices.
In addition, for the evaluation of the in vivo therapeutic effects of sequential SDT and ADV effects on tumor growth, 15 mice were randomly separated into three groups (n = 5), including the control, normal saline + LIFU, and IGP@P + LIFU groups. The mice in the control group did not receive any treatment. The tumor growth in each group was monitored and the tumor volumes and body weights were recorded within 16 days.
In vivo Systemic Toxicity
To evaluate the in vivo systemic toxicity, several biochemical and physiological indexes were determined. Briefly, blood samples from the mice in the IGP@P +LIFU and normal saline +LIFU groups were obtained from the heart after treatment. These blood samples were used for blood biochemical and hematological parameter analysis. In addition, the major organs were harvested after euthanasia, sectioned and further stained with H&E.
Statistical Analysis
Statistical analyses were conducted using the Statistical Package for the Social Sciences (SPSS; IBM, Armonk, NY, USA). Data are presented as the means ± standard deviations. Student’s t-test and one-way ANOVA were used for statistical evaluation. Differences were considered significant at *P < 0.05, **P < 0.01, ***P < 0.001.
Results and Discussion
NP Characterization
Using PLGA as a carrier, IR780 was loaded onto the shell of the NPs, Gd-DTPA and PFH were loaded into the core of the NPs, and the shell-core structure of the NPs (named IGP@P NPs) was formed by phacoemulsification.
The particle sizes and zeta potentials of each type of NP (IG@P, GP@P, IGP@P NPs) are shown in Table S1. The average particle size of the IGP@P NPs was 174.5 ± 3.10 nm and the zeta potential was −5.5 ± 3.31 mV. To improve targeting performance, we controlled the particle size of the IGP@P NPs between 100 and 200 nm (174.5 nm ± 3.10 nm) by adjusting the preparation method. Notably, drugs smaller than 5 nm will be quickly cleared by the kidney, those smaller than 50 nm will be mainly deposited in the liver, and those larger than 200 nm will be taken up in large quantities by the spleen. Therefore, NPs with a size of 100–200 nm can better accumulate at the tumor site by the EPR effect.20 After introducing the metal cationic compound IR780 into the PLGA NPs, the NP zeta potential was −5.5 ± 3.31 mV, which falls in the neutrally charged range (−10 mV - +10 mV); thus, these NPs can promote cellular uptake by minimizing electrostatic repulsion and are suitable for tumor treatment applications.24 The SEM image of the IGP@P NPs showed that the NPs had a relatively regular spherical appearance (Figure 2A). By CLSM, the DiI-labeled IGP@P NPs displayed a strong red ring of fluorescence, a uniform size, and good dispersion (Figure 2B). After the successful loading of Gd-DTPA, the HRTEM image (Figure 2C) showed that the IGP@P NPs presented a higher black density than the IP@P NPs (Figure 2D). EDS (Figure 2E) showed that iodine (purple) is uniformly distributed in the shell structure of the NPs in a ring shape, and Gd (yellow) and F (green) were uniformly distributed in the core. The ICP method quantitatively calculated the carrier rate of Gd-DTPA in the IGP@P NPs to be 57.60 ± 5.42% (Table S1). Additionally, the absorption spectra are shown in Figure 2G. Free IR780 and the IG@P and IGP@P NPs showed the characteristic absorption peak of IR780 (at approximately 790 nm). However, the GP@P NPs did not show this characteristic absorption peak. Compared with the GP@P NP solution, the IGP@P NP solution loaded with IR780 changed from milky white to green (Figure 2F). The above results are consistent with the EDS results, and both sets of data show that IR780 was successfully loaded into the IGP@P NPs. The size of the IGP@P NPs did not change significantly within 7 days (Figure 2I), indicating the good stability of the IGP@P NPs. According to the calculation from the UV-Vis absorption curve, the carrier rate of IR780 in the IGP@P NPs was 67.39 ± 4.07% (Table S1). Figure 2H shows that the absorbance of the IGP@P NPs varies with IR780 concentration, presenting a positive linear correlation. SOSG, which can release a fluorescent signal after capturing ROS, can be used to detect the ability of NPs to generate ROS. As shown in Figure 2J, after LIFU irradiation for 2 and 4 min, the fluorescence intensity of the IGP@P NPs rose to between 2000–3000 a.u. This result indicates that the IR780 loaded in the NPs can generate a large amount of ROS under LIFU irradiation, which guarantees the effectiveness of SDT. After LIFU irradiation for 6 min, the fluorescence intensity of the IGP@P NPs was significantly reduced compared with that at 2 and 4 min (P < 0.001). Optical microscopy (Figure 2K) showed that at 4 min, a small amount of PFH-containing IGP@P NPs began to undergo phase transition and became larger, and this effect was further enhanced at 6 min. After phase transition, the size of the IGP@P NPs increased to approximately 3 µm. The above results show that under the experimental conditions, the IR780 from the IGP@P NPs can be induced to produce a large amount of ROS after irradiation for 2 and 4 min. However, when the irradiation time was extended to 6 min, ROS production reduced significantly, which was caused by the depletion of IR780. The phase transition of PFH in the IGP@P NPs is time-dependent, and a wide and sufficient phase transition can take place after 6 min of LIFU irradiation. During this process, the simple, well-programmed LIFU irradiation can simultaneously cause the sonochemical reaction and sono-induced ADV effects to lay a solid foundation for the superior antitumor treatment effects.
 |
Figure 2 NP characteristics. SEM image of the IGP@P NPs (A). CLSM image of the DiI-labeled IGP@P NPs (B). HRTEM images of the IGP@P NPs (C) and IP@P NPs (D). Elemental mapping of I, Gd, and F and a merged image by HRTEM (E). Digital photos of GP@P and IGP@P NP solutions (F). UV-Vis-NIR absorbance spectra of free IR780 and IG@P, GP@P and IGP NPs (G). Relative absorbance intensity of IR780 at different concentrations at a wavelength of 790 nm (H). The size distribution of the IGP@P NPs dispersed in PBS (1 mg mL−1) within 7 days (I). SOSG absorption spectra of IGP@P NPs (100 µg/mL) under LIFU irradiation (2.5 W/cm2) for 2, 4, and 6 min (J). Light microscopy images of the phase transition of IGP@P NPs under LIFU irradiation (2.5 W/cm2) at 2, 4, and 6 min (K). (***P < 0.001, ANOVA.). |
PA and MR Imaging of NPs in vitro
As determined by PA imaging with different laser excitation wavelengths (680–970 nm), the optimal excitation wavelength for PA imaging of IGP@P NPs was 790 nm; therefore, the PA imaging capability of the IGP@P NPs was evaluated at an excitation wavelength of 790 nm. PA intensity increased with increasing IGP@P NP concentration and is linearly correlated (Figure S1A and D), indicating that IR780-loaded IGP@P NPs have good PA imaging performance.
We verified the MR imaging performance of IGP@P NPs in vitro, and the results showed that the T1 signal intensity of the IGP@P NPs increased with increasing Gd-DTPA concentration in both the grayscale and pseudocolor images (Figure S1B, C and E). The r1 value calculated from the plot of 1/T1 (Figure S1F) was 5 mM−1s−1, indicating that IGP@P NPs had a good MR positive contrast enhancement function.
Cell Experiments
NP Safety Test in vitro
After HeLa cells were incubated with different concentrations of IGP@P NPs (0, 2.5, 5, 7.5, and 10 mg/mL) for 3, 6, 12, and 24 h, the CCK-8 method detected a dose-dependent change in cell viability. The higher the NP concentration was, the greater the cytotoxicity. Importantly, when the NP concentration reached 10 mg/mL and the incubation time was 24 h, the cell viability was still 85.67% (Figure S2), indicating that the IGP@P NPs have reliable cell safety.
Intracellular NP Uptake and Colocalization with Mitochondria
We used CLSM to observe NP endocytosis by HeLa cells. The red fluorescence around the nuclei of the HeLa cells in the DiI-labeled GP@P and DiI-labeled IGP@P groups increased with the extension of incubation time and was most obvious after 6 h of coincubation. However, at various time points (1, 3, and 6 h), the trend in the DiI-IGP@P group was stronger than that in the DiI-labeled GP@P group (Figure 3A and B). This difference is due to the highly efficient internalization of IR780 mediated by the OATPs that are overexpressed on the HeLa cell membrane.20 After 6 h of coincubation with NPs, as shown in Figure 3C and D, in the IGP@P group, the green fluorescence (mitochondria stained with MitoTracker) and the red fluorescence (DiI-labeled IGP@P NPs) overlapped well whereas the colocalization in the GP@P group was poor, suggesting that the IGP@P NPs have a certain affinity for HeLa cell mitochondria. The above results show that IGP@P NPs not only have high affinity for HeLa cells but also can selectively achieve mitochondrial localization in the cell due to IR780 assistance; moreover, the mitochondria, as a functional structure of energy metabolism, are extremely sensitive to ROS.25
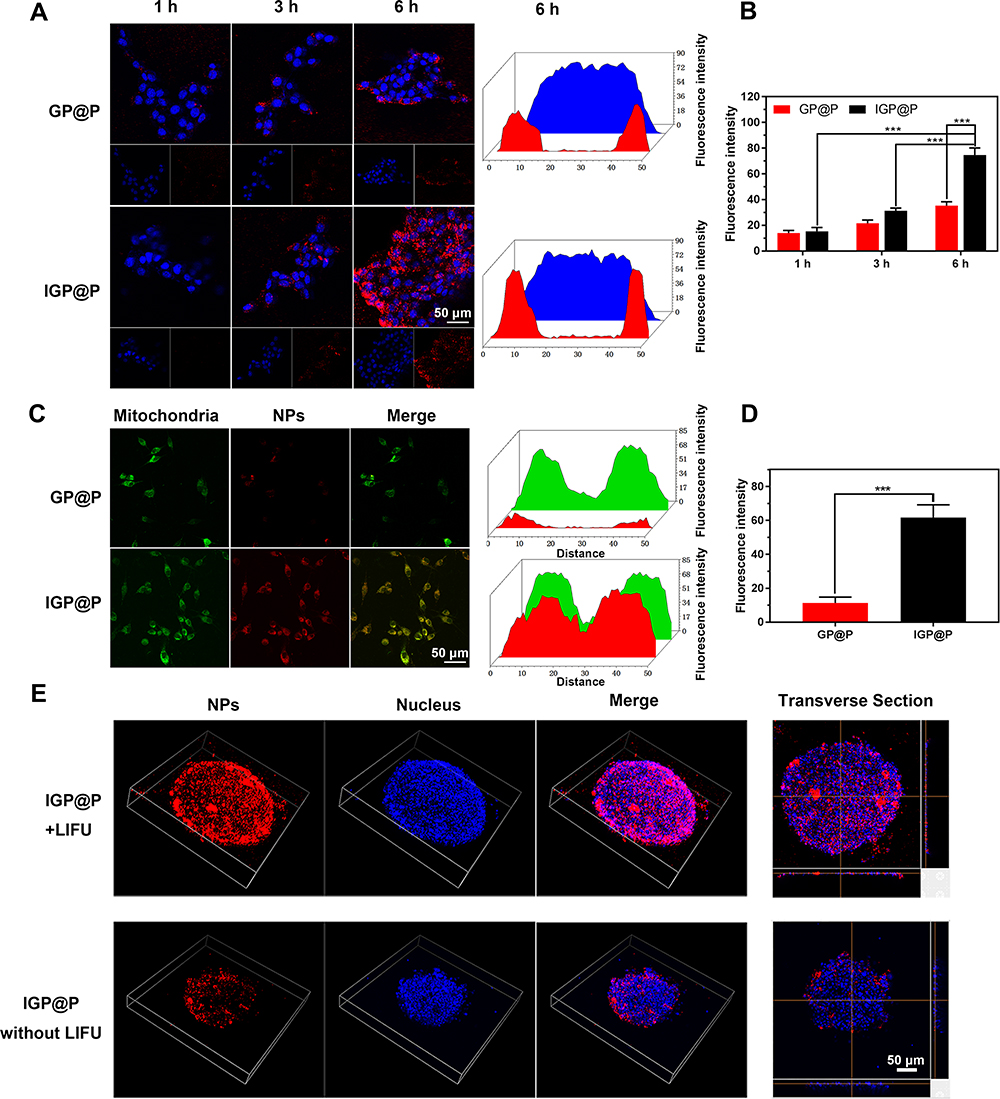 |
Figure 3 CLSM images and quantitative fluorescence maps of HeLa cells incubated with DiI-labeled GP@P or IGP@P NPs for 1, 3, or 6 h (A). The corresponding fluorescence intensity value of NPs in different groups at different timepoints (B). CLSM images and quantitative fluorescence maps of DiI-labeled GP@P and IGP@P NPs colocalized with a mitochondrial tracker in HeLa cells (C). The corresponding fluorescence intensity value of NPs in different groups (D). Analysis of the penetration of DiI-labeled IGP@P NPs in 3D multicellular tumor spheroids (MCTSs) with or without LIFU irradiation and the corresponding transverse section (E). (***P < 0.001, ANOVA.). |
Targeted Penetration of the NPs into MCTSs
Due to the heterogeneity of the tumor vascular system and the increased interstitial pressure, hypertension at the tumor site limits the penetration of NPs from the surface of the tumor area to the core,15,26 and the peripheral coverage of NPs in solid tumors always affects the therapeutic effects of NPs.27 Therefore, a satisfactory penetration depth and uniform NP diffusion are usually required to maximize the therapeutic effects. We used a 3D MCTS model that simulates the complex situation of the tumor site28 to evaluate the ability of the IGP@P NPs to penetrate into the tumor with the assistance of LIFU irradiation. In the absence of LIFU irradiation, we found that the red fluorescent DiI-labeled IGP@P NPs were mainly distributed on the surface of the 3D MCTSs, and only a small amount of the NPs penetrated into the model. However, after LIFU irradiation, a large number of DiI-labeled IGP@P NPs penetrated the tumor (Figure 3E) and were evenly distributed throughout the MCTSs, as observed in the transverse sections. This result confirmed that the force of LIFU irradiation can assist the penetration of the IGP@P NPs into the tumor and the accompanying ADV effects can also destroy the solid tumor vascular barrier,17 thus guaranteeing the adequate treatment of internal tumor tissues.
Evaluation of the Cell Therapy Effects and Treatment Mechanism
Cellular ROS Generation
The ROS generated in the cell were captured by DCFH-DA and converted into DCF (green fluorescence) for detection. The results showed that the IR780-containing NPs (IG@P, IGP@P) produced very strong green fluorescence (fluorescence intensity of 2000–3000 a.u.) after LIFU irradiation for 2 and 4 min. There was no significant difference in the fluorescence intensity between the two time points (P > 0.05), but at 6 min, the fluorescence intensity was significantly reduced (less than 200 a.u.) (P < 0.001). No obvious green fluorescence was observed in the GP@P + LIFU group and IGP@P without LIFU group (Figure 4A and B). These findings and the results from the in vitro SOSG experiment indicate that IGP@P NPs can be used as a good sonosensitizer to generate a large amount of ROS inside and outside tumor cells after LIFU irradiation for 2 and 4 min. ROS play two roles during cell metabolism: at low to moderate levels, ROS act as a signal transducer to activate cell proliferation, migration, invasion and angiogenesis; however, high levels of ROS can cause damage to proteins, nucleic acids, lipids, cell membranes and organelles, resulting in cell death.29 In this experiment, LIFU irradiation was used to exogenously manipulate ROS levels through SDT and ensure antitumor efficacy after LIFU irradiation was applied for 2 and 4 min.
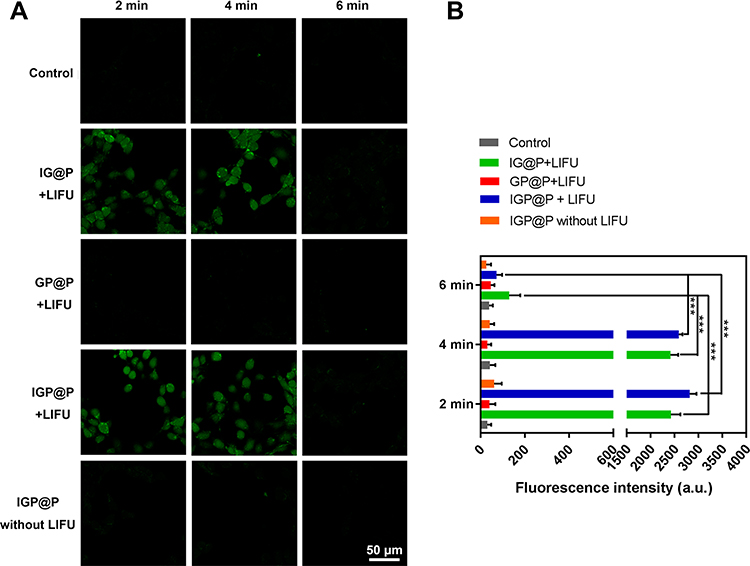 |
Figure 4 CLSM images of HeLa cells dyed with DCFH-DA after various treatments (A). Fluorescence intensity of ROS after various treatments as quantified by ImageJ (B). (***P < 0.001, ANOVA.). |
NP Phase Transition Inside the Cells
HeLa cells in each group were irradiated with LIFU for different lengths of time. At 4 min, in the PFH-containing NP (GP@P, IGP@P) groups, a small number of phase-transitioned NPs (red pattern) were observed inside the cells. The largest diameter of the phase-transitioned NPs was approximately 1 µm. At 6 min, a large number of phase-transitioned NPs (red pattern) were observed in the cells, most of them with a particle size range of 0.5–2 µm. No significant NP phase transition was observed in the IG@P + LIFU group and the IGP@P without LIFU group (Figure 5). These results indicated that IGP@P NPs can undergo a time-dependent controllable phase transition under LIFU irradiation. When the size of the NPs after the phase transition is large enough, they will implode, generating micro-shock waves that may damage the surrounding tissues,27 which is the basis for the ADV effects to cause damage to HeLa cells.
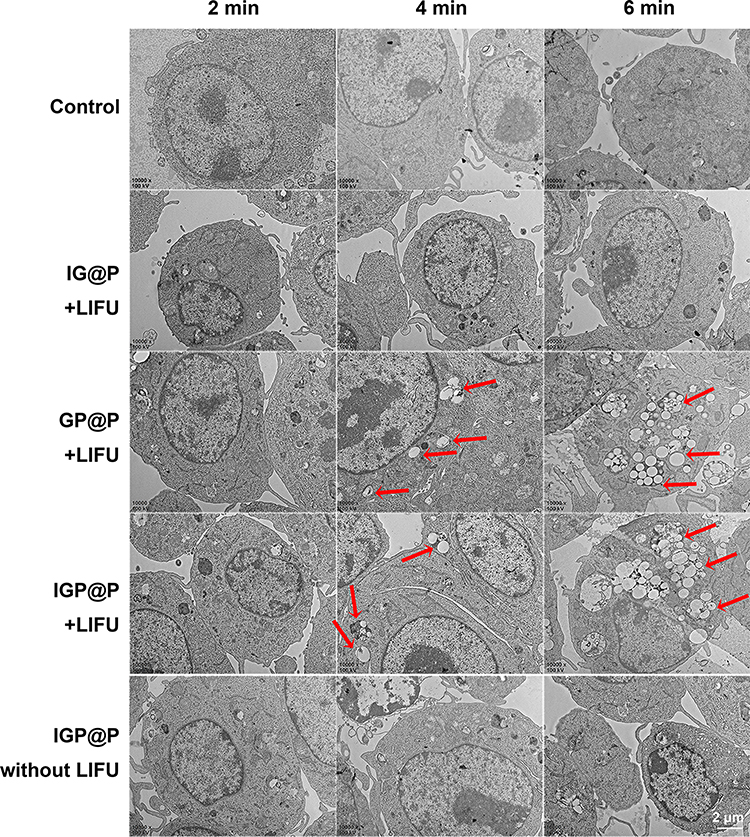 |
Figure 5 TEM images of HeLa cells in control group or treated with different NPs and exposed with or without LIFU irradiation at 2, 4, and 6 min. Red patterns represent NPs that had undergone phase transitions. |
Assessment of Apoptosis/Necrosis
After 2 min of LIFU irradiation, some cells in the IG@P + LIFU, GP@P + LIFU, and IGP@P + LIFU groups exhibited apoptosis/necrosis, and the apoptosis/necrosis rates were all less than 20%. At 4 min, the apoptosis/necrosis rates of the HeLa cells in each group were between 20–40%, among which the IGP@P + LIFU group had the highest rate (33.00%). At 6 min, the apoptosis/necrosis rates of the IG@P + LIFU and GP@P + LIFU groups were 30.34% and 65.00%, respectively, while the IGP@P + LIFU group had a rate of 95.33% (> 90%) (Figure 6A). Observed by CLSM, in the IGP@P + LIFU group, with the extension of LIFU irradiation time (2, 4, and 6 min), there were an increasing number of apoptotic/necrotic cells showing red fluorescence after CAM and PI staining (Figure 6B), and the changes in cell morphology and structure became increasingly clear as observed by SEM (Figure 6C).
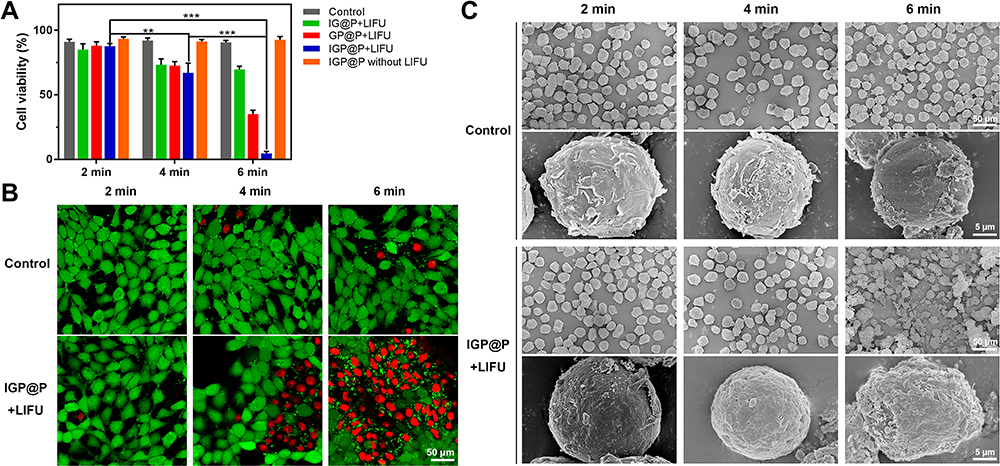 |
Figure 6 Relative viability of HeLa cells in control groups or after treatment with different NPs and exposure or not to LIFU at 2, 4, and 6 min (A). CLSM images of HeLa cells stained with CAM and PI in control group or after treatment with DiI-labeled IGP@P NPs and exposure to LIFU irradiation at 2.5 W/cm2 for 2, 4, and 6 min (B). SEM images of HeLa cells in control group or after treatment with IGP@P NPs and exposure to LIFU at 2.5 W/cm2 for 2, 4, and 6 min. The magnification of the upper row is 1000× and that of the lower row is 10,000× (C). (**P < 0.01, ***P < 0.001, ANOVA.). |
We then converted the abovementioned measurement data from the cellular ROS generation, NP phase transition inside the cells, and HeLa cell apoptosis/necrosis rate experiments into count data, which is listed in Table S2.
According to the cell therapy effect and treatment mechanism evaluation results, in the GP@P + LIFU group, the ADV effects caused by phase transition became gradually clearer with prolonged irradiation time, which was accompanied by a gradual increase in the cell apoptosis/necrosis rate, with highest cell apoptosis rate reaching 65.00% after 6 min. In the IG@P + LIFU group, at 2 min and 4 min, the ROS produced by the IR780 from the NPs after LIFU irradiation induced the apoptosis/necrosis of some cells. However, when the irradiation time was extended to 6 min and IR780 was depleted, there was no clear ROS production, and compared with 4 min, there was no further significant increase in the rate of HeLa cell apoptosis/necrosis at 6 min. Thus, the ADV effects and ROS produced in the above two groups can induce only partial HeLa cell apoptosis/necrosis and cannot produce sufficient and sustained damage alone. In the IGP@P + LIFU group, under the synergistic effects of ROS generation and the ADV effect, both of which were induced by LIFU irradiation, the apoptosis/necrosis rate continued to increase, especially at 6 min. When IR780 was depleted from the NPs, TEM showed that a large number of NPs in the cell underwent phase transition, and the particle sizes changed from the nanometer level to the micrometer level. The ADV effect, which was abruptly triggered when the NPs reached the phase transition threshold, became the dominant force, leading to complete tumor cell apoptosis/necrosis. The first half of the treatment regimen relies mainly on ROS to achieve antitumor effects while the second half is mainly dependent on the ADV effect, which generates cascade-amplifying sequential therapy against tumor cells. This transformation process of sonochemical and sono-induced ADV effects is a well-programmed strategy for antitumor treatment and provides a guarantee for the effective tumor killing. Notably, in the IGP@P group without LIFU, no obvious ROS production, phase transition, or cell apoptosis/necrosis were observed throughout the experiment.
Animal Experiments
PA Monitoring of in vivo Targeting
In vivo PA imaging showed that the PA intensity in the tumor area gradually increased over time (Figure 7A). The PA intensity of the tumor area was measured and recorded, as shown in Figure 7D. PA intensity was the strongest 12 h after IGP@P NP injection, which showed that the IGP@P NPs had good tumor-homing ability and can realize targeted diagnosis with the help of PA imaging due to the loaded IR780. However, in addition to the strong PA intensity observed inside and at the edges of the tumor, some irregular PA signals were also seen in the adjacent nontumor area at various time points; this result suggested that PA imaging may not characterize the details of the tumor edges and contours. It is very important to distinguish the boundary between tumor tissue and the adjacent normal tissues to precisely strike tumor tissues and preserve normal tissues to the greatest extent possible, which is particularly important during tumor treatment.19
 |
Figure 7 PA images of tumor regions after intravenous administration of IGP@P NPs at various time points (0, 3, 6, and 12 h) (A). Distribution of DiI-labeled IGP@P NPs in the tumors after MR scans of the two groups as observed by fluorescence microscopy of pathological sections (B). Tumor 3D map and MR T1 images at various time points (0, 3, 6, and 12 h) with or without the first penetration-enhancing LIFU irradiation at 6 h after DiI-labeled IGP@P NP injection. The yellow dotted line outlines the edge of the tumor tissue (C). Corresponding PA intensities of the tumor sites (D). MR SNR values of the two groups (0, 3, 6, and 12 h) (E). (*P < 0.05, **P < 0.01, ANOVA.). |
MR Imaging and the Corresponding Targeted Penetration Pathological Evaluation in vivo
For in vivo MR imaging, we introduced the positive contrast agent Gd-DTPA into the NPs. Compared with the negative contrast agent, Gd-DTPA can change the T1 signal of the target tissue from black to white (light-on effect) and improve the recognition accuracy.30 Before IGP@P NP injection, the T1 signal at the tumor site in the mice was iso-signal compared with the adjacent muscle tissue. Three hours and 6 h after the injection of IGP@P NPs, we observed a slightly uneven rise in the T1 signal in the tumor area compared with the adjacent muscle tissue, and the SNR values were statistically higher at both of these time points than the SNR at 0 h (P < 0.01), confirming the targeting effects of a small portion of the NPs to the tumors (Figure 7C and E). Six hours after IGP@P NP injection, we performed the first penetration-enhancing LIFU irradiation on the tumor site. Then, 6 h after irradiation (ie, 12 h after NP injection) MR T1WI scanning showed that the T1 signal at the tumor site was further increased, the SNR value was significantly higher than that at 6 h (P < 0.05), and the distribution in the tumor was more uniform (Figure 7C and E). These results indicated that a large number of IGP@P NPs had now accumulated at the tumor, and this may be the best time point for subsequent re-therapeutic LIFU irradiation. In addition, the boundary between the tumor tissue and the adjacent normal tissue can be clearly distinguished in Figure 7C (yellow dotted line). However, in the group without the first penetration-enhancing LIFU irradiation, there was no significant difference in the SNR values between 6 h and 12 h after NP injection at the tumor site (P > 0.05), which indicates that the first penetration-enhancing LIFU irradiation can promote the deep penetration of NPs into the tumor in vivo. MR images can be used for visual evaluation and, for the first time, to achieve targeted permeation monitoring.
We verified the targeting effects from MR scans with the help of pathological slices. Twelve hours after the DiI-labeled IGP@P NPs were injected and the targeted MR T1WI scan was completed, a large number of DiI-labeled IGP@P NPs with red fluorescence were seen inside the tumor in the prepared pathological slices from the group that received the first penetration-enhancing LIFU irradiation. However, in the group that did not receive the first penetration-enhancing LIFU irradiation treatment, scattered and unevenly distributed NPs were seen inside and on the edges of the tumor (Figure 7B), which was consistent with the difference in MR T1 signals between the two groups.
In vivo Antitumor Efficacy
Twelve hours after NP injection, MR T1WI scanning revealed the accumulation of a large number of IGP@P NPs that had been targeted to the tumor site. At this time point, re-therapeutic LIFU irradiation was performed (2.5 W/cm2, 20 min). We used T2WI to evaluate the treatment effects because T2WI is more sensitive to changes in tissue composition.31 The mice were scanned for T2WI before irradiation and again 6 h after irradiation. The tumors in the nude mice before irradiation had similar T2WI signals to those of most other tumors due to the increase in water content with a slightly higher T2 signal than the adjacent muscle tissue. Six hours after irradiation, the T2 signal of tumors was unevenly reduced (Figure 8A), and the SNR was significantly decreased compared with that of the control group (normal saline + LIFU) (P < 0.001) (Figure 8C). In the normal saline + LIFU group, 6 h after irradiation, no significant decreases in the tumor T2 signal (Figure 8A) or SNR (Figure 8C) were observed (P > 0.05). In these two groups, the boundary between the tumor tissue and adjacent normal tissue was clearly distinguished, as shown in Figure 8A (yellow dotted line).
 |
Figure 8 MR T2 images and pseudocolor images before and after re-therapeutic LIFU irradiation in the IGP@P + LIFU and normal saline + LIFU groups. The yellow dotted line outlines the edge of the tumor tissue (A). H&E-stained slices after re-therapeutic LIFU irradiation of tumors in the two groups (B). SNR values of the IGP@P and normal saline groups before and after re-therapeutic LIFU irradiation (C). Typical photographs of tumor-bearing mice with different treatments (D). Tumor volumes in each group (E). Body weight changes in each group during a period of time (F). (***P < 0.001, ANOVA.). |
We then verified the therapeutic effects observed from the MR scans with the help of pathological slices. When the tumor-bearing mice were treated with re-therapeutic LIFU irradiation and completed the MR T2WI scan 6 h later, no significant change in the morphology of the tumor cells in the normal saline + LIFU group was observed, and there were no obvious abnormalities in the tumor stroma (Figure 8B). In the IGP@P + LIFU group, there were scattered bleeding points in the tumor stroma, and the structures of the cell nuclei and membranes became blurred, indicating that the tumor had undergone coagulative necrosis, which explained the decrease in the MR T2 signal of tumor tissue after treatment. From a pathophysiological viewpoint, this change in the MR T2 signal could be explained by the dehydration effect that occurs within the tumor site and hemorrhage inside the tumor.32
In IGP@P + LIFU group, after the mice were injected with IGP@P NPs and received the first penetration-enhancing and re-therapeutic LIFU irradiation, the tumor volumes did not increased significantly within 16 days, while the tumor volumes in the control and normal saline + LIFU group increased significantly (Figure 8D and E), indicating the sequential SDT and ADV effects had good antitumor effect. The body weights showed negligible differences throughout the duration of therapy in each group (Figure 8F), indicating the desirable biosafety of IGP@P NPs.
Thus, we have achieved effective tumor treatment at the cellular level through LIFU irradiation, which has an effect similar to that of high-intensity focused ultrasound (HIFU) treatment; that is, coagulative necrosis of tumor cells.33 The transmission path of HIFU is accompanied by serious side effects, such as temporary pain, skin burns, and nerve damage.34 If the ideal treatment effects can be obtained with lower irradiation energy, such as LIFU, the dilemma of clinical tumor treatment can be overcome to a certain extent. Compared with HIFU, LIFU technology has unique advantages, the greatest being the precise targeting and effective tumor penetration by the IGP@P NPs. However, this strategy will work only when the tumor is filled with bullets (IGP@P NPs) and the trigger (LIFU) is pulled. For the surrounding normal tissues that are not filled with bullets, the intensity of LIFU irradiation is not enough to cause damage, as confirmed by the cell and in vivo experiments, which minimizes the damage to the surrounding normal tissues and preserves body functions.
To accurately determine IGP@P NP tumor-targeting ability and evaluate the therapeutic effects, imaging technology assistance is particularly important. Among various imaging technologies, PA and near-infrared fluorescence (NIRF) imaging cannot provide information such as tumor structure and boundary characteristics. Although US can compensate for the above shortcomings, it cannot identify the internal components of a tumor, and due its poor resolution, whether the boundary tissues are damaged and the degree of damage to the targeted tissues cannot be predicted.19 In comparison with other imaging modalities, MR imaging has multisequence and multiparameter characteristics, giving it the advantage of allowing both functional assessment and tissue characterization in a single examination without the use of ionizing radiation.35 MR imaging can evaluate the size, contour, boundary and internal components of the tumor simultaneously. In this paper, with the help of MR imaging, in one step, evaluation of the passive targeting of the NPs in the tumor area, the penetration-promoting targeting effects and the therapeutic effects of LIFU irradiation were achieved. Additionally, the boundary between the tumor tissue and adjacent normal tissue was clearly distinguished, which is of great significance for the accurate assessment of tumors and the minimization of side effects from tumor treatment. More importantly, MR imaging can evaluate changes in the internal components of the tumor. It was shown above that MR imaging can not only play a targeted monitoring role but also immediately evaluate the curative effects via the molecular imaging of tumors to assist in the time-space controllability of treatment.
In vivo Systemic Toxicity
The in vivo toxicity of the IGP@P NPs was systematically investigated. The biochemical analysis results and hematological parameters of the mice were within the normal range, and there was no significant difference in the various parameters between the IGP@P + LIFU and normal saline + LIFU groups (P > 0.05) (Figure S3A and B). The major organs of the mice, including the heart, liver, spleen, lung and kidney, were collected and sectioned for H&E staining. The histological results showed no adverse effects in either the IGP@P + LIFU group or the normal saline + LIFU group (Figure S3C). These results suggest that IGP@P NPs are safe for use in vivo.
Conclusion
Herein, we designed a time-space controllable theranostic nanoplatform loaded with IR780 and PFH for cervical cancer. We verified the targeting of IR780 to mitochondria in HeLa cells, and under the penetration-promoting LIFU irradiation, enhanced penetration of NPs into the tumor was realized in 3D MCTSs and in vivo, thus ensuring the precise spatial positioning of cervical cancer. Under re-therapeutic LIFU irradiation, a large amount of ROS was generated in the first half of the treatment, which was reduced in the second half of the treatment. However, the ADV effect gradually intensified with the prolongation of the irradiation time and exerted the main antitumor effect in the second half of the treatment. Linking ROS + ADV effects can induce cell coagulation necrosis to the greatest extent at both the cellular and in vivo levels. Additionally, with the help of multisequence MR molecular imaging, T1WI can be used for real-time monitoring of the targeting of the NPs to the tumor tissue and their deep penetration promoted by LIFU, whereas T2WI can be used to evaluate the antitumor efficacy and mechanism. This article provides a minimally invasive and effective treatment for cervical cancer patients with different clinical needs at different FIGO stages. However, our study has some limitations. In particular, the mechanism by which this treatment induces cell coagulative necrosis and the short-term follow-up after treatment of tumor-bearing mice should be further explored in depth.
Acknowledgments
The authors gratefully acknowledge financial support from the National Natural Science Foundation of China (grant Nos. 81701650, 81571663, and 81971608), and the Kuanren Talents Program of the Second Affiliated Hospital of Chongqing Medical University (2020-7).
Disclosure
We declare that we have no conflicts of interest.
References
1. Drolet M, Laprise J-F, Martin D, et al. Optimal human papillomavirus vaccination strategies to prevent cervical cancer in low-income and middle-income countries in the context of limited resources: a mathematical modelling analysis. Lancet Infect Dis. 2021;21(11):1598–1610. doi:10.1016/S1473-3099(20)30860-4
2. Yi M, Li T, Niu M, Luo S, Chu Q, Wu K. Epidemiological trends of women’s cancers from 1990 to 2019 at the global, regional, and national levels: a population-based study. Biomark Res. 2021;9(1):1–12. doi:10.1186/s40364-021-00310-y
3. Redondo A, Colombo N, McCormack M, et al. Primary results from CECILIA, a global single-arm Phase II study evaluating bevacizumab, carboplatin and paclitaxel for advanced cervical cancer. Gynecol Oncol. 2020;159(1):142–149. doi:10.1016/j.ygyno.2020.07.026
4. Liu X, Yuan Z, Tang Z, et al. Selenium-driven enhancement of synergistic cancer chemo-/radiotherapy by targeting nanotherapeutics. Biomater Sci. 2021;9(13):4691–4700. doi:10.1039/d1bm00348h
5. Liu D, Liu L, Liu F, Zhang M, Wei P, Yi T. HOCl-activated aggregation of gold nanoparticles for multimodality therapy of tumors. Adv Sci. 2021;8(17):e2100074. doi:10.1002/advs.202100074
6. Liu B, Jiao J, Xu W, et al. Highly efficient far-red/NIR-absorbing neutral Ir(III) complex micelles for potent photodynamic/photothermal therapy. Adv Mater. 2021;33(32):e2100795. doi:10.1002/adma.202100795
7. Zhao X, Zhao KC, Chen LJ, Liu YS, Liu JL, Yan XP. A pH reversibly activatable NIR photothermal/photodynamic-in-one agent integrated with renewable nanoimplants for image-guided precision phototherapy. Chem Sci. 2020;12(1):442–452. doi:10.1039/d0sc04408c
8. Chan MH, Pan YT, Chan YC, et al. Nanobubble-embedded inorganic 808 nm excited upconversion nanocomposites for tumor multiple imaging and treatment. Chem Sci. 2018;9(12):3141–3151. doi:10.1039/c8sc00108a
9. Zhang P, Ren Z, Chen Z, et al. Iron oxide nanoparticles as nanocarriers to improve chlorin e6-based sonosensitivity in sonodynamic therapy. Drug Des Devel Ther. 2018;12:4207–4216. doi:10.2147/dddt.s184679
10. Zhao Y, Fu X, Lopez JI, et al. Selection of metastasis competent subclones in the tumour interior. Nat Ecol Evol. 2021;5(7):1033–1045. doi:10.1038/s41559-021-01456-6
11. Wang N, Liu C, Yao W, et al. Endogenous reactive oxygen species burst induced and spatiotemporally controlled multiple drug release by traceable nanoparticles for enhancing antitumor efficacy. Biomater Sci. 2021;9(14):4968–4983. doi:10.1039/d1bm00668a
12. Luan X, Yuan H, Song Y, et al. Reappraisal of anticancer nanomedicine design criteria in three types of preclinical cancer models for better clinical translation. Biomaterials. 2021;275:120910. doi:10.1016/j.biomaterials.2021.120910
13. Guo Q, Zhang L, He M, et al. Doxorubicin-loaded natural daptomycin micelles with enhanced targeting and anti-tumor effect in vivo. Eur J Med Chem. 2021;222:113582. doi:10.1016/j.ejmech.2021.113582
14. Wang Y, Wang B, Zhang L, et al. Mitochondria-targeted nanospheres with deep tumor penetration for photo/starvation therapy. J Mater Chem B. 2020;8(34):7740–7754. doi:10.1039/d0tb00001a
15. Zhao C, Tong Y, Li X, et al. Photosensitive nanoparticles combining vascular-independent intratumor distribution and on-demand oxygen-depot delivery for enhanced cancer photodynamic therapy. Small. 2018;14(12):1703045. doi:10.1002/smll.201703045
16. Wu P, Dong W, Guo X, et al. ROS-responsive blended nanoparticles: cascade-amplifying synergistic effects of sonochemotherapy with on-demand boosted drug release during SDT process. Adv Healthcare Mater. 2019;8(18):1900720. doi:10.1002/adhm.201900720
17. Zhang L, Yi H, Song J, et al. Mitochondria-targeted and ultrasound-activated nanodroplets for enhanced deep-penetration sonodynamic cancer therapy. ACS Appl Mater Interfaces. 2019;11(9):9355–9366. doi:10.1021/acsami.8b21968
18. Huang C, Ding S, Jiang W, Wang FB. Glutathione-depleting nanoplatelets for enhanced sonodynamic cancer therapy. Nanoscale. 2021;13(8):4512–4518. doi:10.1039/d0nr08440a
19. Liu M, Zhang P, Deng L, et al. IR780-based light-responsive nanocomplexes combining phase transition for enhancing multimodal imaging-guided photothermal therapy. Biomater Sci. 2019;7(3):1132–1146. doi:10.1039/c8bm01524d
20. Alves CG, Lima-Sousa R, de Melo-diogo D, Louro RO, Correia IJ. IR780 based nanomaterials for cancer imaging and photothermal, photodynamic and combinatorial therapies. Int J Pharm. 2018;542(1–2):164–175. doi:10.1016/j.ijpharm.2018.03.020
21. Chen M, Yang D, Sun Y, et al. In situ self-assembly nanomicelle microneedles for enhanced photoimmunotherapy via autophagy regulation strategy. ACS Nano. 2021;15(2):3387–3401. doi:10.1021/acsnano.0c10396
22. Huang J, Zhang L, Zhou W, et al. Dual mitigation of immunosuppression combined with photothermal inhibition for highly effective primary tumor and metastases therapy. Biomaterials. 2021;274:120856. doi:10.1016/j.biomaterials.2021.120856
23. Zhang J, Zhao B, Chen S, et al. Near-infrared light irradiation induced mild hyperthermia enhances glutathione depletion and DNA interstrand cross-link formation for efficient chemotherapy. ACS Nano. 2020;14(11):14831–14845. doi:10.1021/acsnano.0c03781
24. Wang S, Mao J, Liu H, et al. pH-sensitive nanotheranostics for dual-modality imaging guided nanoenzyme catalysis therapy and phototherapy. J Mater Chem B. 2020;8(22):4859–4869. doi:10.1039/c9tb02731a
25. Sun Z, Chen W, Liu J, Yu B, Jiang C, Lu L. Mitochondria-targeting enhanced phototherapy by intrinsic characteristics engineered ”one-for-all” nanoparticles. ACS Appl Mater Interfaces. 2021;13(30):35568–35578. doi:10.1021/acsami.1c10850
26. Goel S, Duda DG, Xu L, et al. Normalization of the vasculature for treatment of cancer and other diseases. Physiol Rev. 2011;91(3):1071–1121. doi:10.1152/physrev.00038.2010
27. Li Q, Hou W, Li M, Ye H, Li H, Wang Z. Ultrasound combined with core cross-linked nanosystem for enhancing penetration of doxorubicin prodrug/beta-lapachone into tumors. Int J Nanomedicine. 2020;15:4825–4845. doi:10.2147/ijn.s251277
28. Goodarzi S, Prunet A, Rossetti F, et al. Quantifying nanotherapeutic penetration using a hydrogel-based microsystem as a new 3D in vitro platform. Lab Chip. 2021;21(13):2495–2510. doi:10.1039/d1lc00192b
29. Nakamura H, Takada K. Reactive oxygen species in cancer: current findings and future directions. Cancer Sci. 2021;112(10):3945. doi:10.1111/cas.15068
30. Yang C-T, Hattiholi A, Selvan ST, et al. Gadolinium-based bimodal probes to enhance T1-weighted magnetic resonance/optical imaging. Acta Biomater. 2020;110:15–36. doi:10.1016/j.actbio.2020.03.047
31. Tanaka YO, Nishida M, Tsunoda H, Okamoto Y, Yoshikawa H. Smooth muscle tumors of uncertain malignant potential and leiomyosarcomas of the uterus: MR findings. J Magn Reson Imaging. 2004;20(6):998–1007. doi:10.1002/jmri.20207
32. Kim SM, Shin SS, Lee BC, et al. Imaging evaluation of ablative margin and index tumor immediately after radiofrequency ablation for hepatocellular carcinoma: comparison between multidetector-row CT and MR imaging. Abdom Radiol. 2017;42(10):2527–2537. doi:10.1007/s00261-017-1146-z
33. Scipione R, Anzidei M, Bazzocchi A, Gagliardo C, Catalano C, Napoli A. HIFU for bone metastases and other musculoskeletal applications. Semin Intervent Radiol. 2018;35(4):261–267. doi:10.1055/s-0038-1673363
34. Zhang N, Cai X, Gao W, et al. A multifunctional theranostic nanoagent for dual-mode image-guided HIFU/chemo- synergistic cancer therapy. Theranostics. 2016;6(3):404–417. doi:10.7150/thno.13478
35. Tiwari R, Singh AK, Somwaru AS, Menias CO, Prasad SR, Katabathina VS. Radiologist’s primer on imaging of common hereditary cancer syndromes. Radiographics. 2019;39(3):759–778. doi:10.1148/rg.2019180171
 © 2021 The Author(s). This work is published and licensed by Dove Medical Press Limited. The
full terms of this license are available at https://www.dovepress.com/terms
and incorporate the Creative Commons Attribution
- Non Commercial (unported, 3.0) License.
By accessing the work you hereby accept the Terms. Non-commercial uses of the work are permitted
without any further permission from Dove Medical Press Limited, provided the work is properly
attributed. For permission for commercial use of this work, please see paragraphs 4.2 and 5 of our Terms.
© 2021 The Author(s). This work is published and licensed by Dove Medical Press Limited. The
full terms of this license are available at https://www.dovepress.com/terms
and incorporate the Creative Commons Attribution
- Non Commercial (unported, 3.0) License.
By accessing the work you hereby accept the Terms. Non-commercial uses of the work are permitted
without any further permission from Dove Medical Press Limited, provided the work is properly
attributed. For permission for commercial use of this work, please see paragraphs 4.2 and 5 of our Terms.