Back to Journals » Cancer Management and Research » Volume 12
The N6-Methyladenosine (m6A) Methylation Gene YTHDF1 Reveals a Potential Diagnostic Role for Gastric Cancer
Authors Liu T ![]() , Yang S, Cheng YP, Kong XL, Du DD
, Yang S, Cheng YP, Kong XL, Du DD ![]() , Wang X, Bai YF
, Wang X, Bai YF ![]() , Yin LH, Pu YP
, Yin LH, Pu YP ![]() , Liang GY
, Liang GY
Received 30 August 2020
Accepted for publication 22 October 2020
Published 20 November 2020 Volume 2020:12 Pages 11953—11964
DOI https://doi.org/10.2147/CMAR.S279370
Checked for plagiarism Yes
Review by Single anonymous peer review
Peer reviewer comments 2
Editor who approved publication: Dr Eileen O'Reilly
Tong Liu,1 Sheng Yang,1 Yan-ping Cheng,1 Xiao-ling Kong,1 Dan-dan Du,1 Xian Wang,1 Yun-fei Bai,2 Li-hong Yin,1 Yue-pu Pu,1 Ge-yu Liang1
1Key Laboratory of Environmental Medicine Engineering, Ministry of Education, School of Public Health, Southeast University, Nanjing 210096, People’s Republic of China; 2State Key Laboratory of Bioelectronics, School of Biological Sciences and Medical Engineering, Southeast University, Nanjing 210096, People’s Republic of China
Correspondence: Ge-yu Liang
School of Public Health, Southeast University, No. 87 Dingjiaqiao, Nanjing 210009, People’s Republic of China
Tel +86-25-83272572
Fax +86-25-832-72583
Email [email protected]
Purpose: Gastric cancer (GC) is aggressive cancer with a high mortality rate worldwide. N6-methyladenosine (m6A) RNA methylation is related to tumorigenesis, which is dynamically regulated by m6A modulators (“writer,” “eraser,” and “reader”). We conducted a comprehensive analysis of the m6A genes of GC patients in TCGA datasets to identify the potential diagnostic biomarkers.
Materials and Methods: We analyzed the expression profile of m6A genes in the TCGA cohort and constructed a diagnostic-m6A-score (DMS) by the LASSO-logistic model. In addition, by consensus cluster analysis, we identified two different subgroups of GC risk individuals by the expression profile of m6A modulators, revealing that YTHDF1’s expression variation profile in GC diagnosis. We also performed RT-qPCR and WB verification in 17 pairs of GC specimens and paired adjacent non-tumor tissues and GC cell lines, and verified the expression trend of YTHDF1 in five GEO GC datasets. YTHDF1 expression and clinical features of GC patients were assessed by the UALCAN.
Results: The DMS with high specificity and sensitivity (AUC = 0.986) is proven to distinguish cancer from normal controls better. Moreover, we found that the expression profile variation of YTHDF1 was significantly associated with the high-risk subtype of GC patients. RT-qPCR and Western blot results are consistent with silicon analysis, revealing that YTHDF1’s potential oncogene role in GC tumor.
Conclusion: In conclusion, we developed the m6A gene-based diagnostic signature for GC and found that YTHDF1 was significantly correlated with the high-risk subtype of GC patients, suggesting that YTHDF1 might be a potential target in GC early diagnosis.
Keywords: m6A, RNA methylation, diagnostic signature, YTHDF1, gastric cancer
Introduction
For decades, gastric cancer (GC) remains one of the malignant tumors currently undermining human health.1 According to the cancer statistics in 2018, GC has caused more than one million new cases and nearly 800,000 deaths worldwide.2 The primary reason for the poor prognosis of GC includes a lack of early diagnostic efficiency and incorrect prognosis prediction. Most GC patients were diagnosed with advanced tumor metastasis and invasion.3 At present, the major obstacle for patients with advanced GC is the poor prognosis (especially late recurrence) that reduces the 5-year survival rate, while others suffer from chemotherapy resistance.4,5 Therefore, novel biomarkers are needed to improve GC patients’ diagnosis efficiency that may help clinical implementation and personalized treatment strategies.6
Nowadays, N6-methyladenosine (m6A) RNA methylation has become a new epigenetic research hotspot for cancer therapy,7 which provided a new layer for depicting post-transcriptional regulation.8 Given the significance of m6A in regulating transcript, it is reasonable to deduce that it may play a vital role in carcinogenesis.9 Accumulating evidence revealed that m6A modification is involved in multiple processes of tumorigenesis.10−13 Previous studies have revealed a series of molecules that were involved in m6A RNA methylation. m6A methyltransferases, called “Writers,” including METTL3, METTL14, METTL16, Wilms’ tumor-1 associated protein (WTAP), KIAA1429, RNA binding motif protein 15 (RBM15), and zinc finger CCCH domain-containing protein 13 (ZC3H13). As the reversible epigenetic modifications of RNA, m6A be reversed by m6A demethylase, called “erasers,” including fat mass and obesity-related protein (FTO) and alkB homolog 5 (ALKBH5). Molecular compositions of m6A modification also include m6A recognition factors, known as “Readers,” including YT521-B homology (YTH) domain family (YTHDF1, 2, 3), YTH domain-containing proteins (YTHDC1 and 2), and heterogeneous nuclear ribonucleoproteins family (HNRNP).14 The dynamic m6A methylation process was involved in the different approaches of RNA regulation, such as mRNA expression, mediation of primary miRNA processing.15,16
Although evidence revealed that m6A RNA methylation was involved in the onset and development of cancers (such as AML, HCC, melanoma, bladder cancer, and colorectal cancer),11,17–20 the specific roles of m6A molecular in GC have not been fully elucidated. Thus, we systematically analyzed the fourteen m6A genes and constructed and validated the diagnostic signature based on m6A regulators’ expression profiles in the TCGA database.
Methods and Materials
Patients and Data Mining
The present study uses data from the public domain. To October 17, 2017, 415 Stomach adenocarcinoma (STAD) samples and 32 normal controls were collected according to the NIH Guidelines and the TCGA Data Access Policy. Exclusion criteria were as follows: (i) histological diagnosis excluded STAD; (ii) another malignant tumor other than STAD; (iii) tissue samples without complete RNA sequencing data and clinical feature information. Finally, 375 STAD patients were included in the study. Based on R 3.5.1 (https://cran.r-project.org/), the TCGA (http://cancergenome.nih.gov) Level 3 RNA sequencing data and relevant clinical information of patients was downloaded. According to the 8th American Joint Committee on Cancer (AJCC) TNM stage,21 there were 50 with tumor stage I, 120 with tumor stage II, 169 with tumor stage III, and 36 with tumor stage IV.
Differential Analysis of m6A Genes
To compare the relative expression of m6A genes in tumors and normal controls, the ‘‘BiocManager” packages in R software were used to compare the expression profile data. In addition, the co-expression pattern of m6A genes was assessed by the “corrplot” package in R. To depict the target gene expression in subgroups based on individual clinical features, we use the UALCAN, an online open-access website, to analyze clinical information in TCGA GC data.22
Construction and Validation of m6A Gene-Based Diagnostic Signature for GC
The least absolute shrinkage and selection operator (LASSO) logistic analysis was carried out to identify the ten significant m6A diagnostic predictors in the present study, whose predictive accuracy could be improved significantly. The diagnostic-m6A-score (DMS) model has been constructed with the candidate m6A gene, which was weighted by regression coefficients derived from the LASSO-logistic analysis (β) with the following formula:23 The diagnostic-m6A-score (DMS) = expm6A gene(1) x βm6A gene(1) + expm6A gene(2) x βm6A gene(2) + … expm6A gene(n) x βm6A gene(n). Meanwhile, the sensitivity and specificity of the diagnostic models were assessed by receiver operating characteristic (ROC) curve.
To validate the DMS model’s efficacy and further explore the role of m6A composition in the onset of gastric cancer, we next classified all samples through the “ConsensusClusterPlus” package in the R software. We depicted the expression profile variation of diagnostic candidate m6A genes in each cluster. K-Means consensus clustering was performed for candidate m6A genes.24
GC Patients’ Specimens and Paired Adjacent Non-Tumor Tissues
Seventeen pairs of GC patient specimens, aged 44–70 years, and their paired adjacent non-cancerous tissue specimens were obtained from the Zhongda Hospital, Affiliated to Southeast University (Nanjing, China). All patients’ informed consent was signed, and the Ethics Committee of Zhongda Hospital approved the study (Ethics Approval No. 2019ZDKYSB137).
Cell Culture and Reagents
The human gastric epithelial cell line (GES-1) and two gastric cancer cell lines (SGC-7901, BGC-823) were obtained from the Key Laboratory of Environmental Medicine Engineering, Southeast University (Nanjing, China). SGC-7901 and BGC-823 cells were authenticated by STR profile. The use of all cell lines was approved by the Ethics Committee of the Zhongda Hospital, affiliated to Southeast University. The cells were cultured in a 5% CO2 humidified atmosphere at 37°C, using DMEM media (Thermo Fisher Scientific, Waltham, MA, USA) supplemented with 10% fetal bovine serum, 100 μg/mL Penicillin and 100 μg/mL Streptomycin.
RNA Isolation and qRT-PCR Verification
For qRT-PCR analysis, total RNA was extracted from GC cells, and tissues with TRIzol reagent (Invitrogen, Carlsbad, CA, USA) and purity and concentration were measured using a NanoDrop 2000 spectrometer (Thermo Fisher Scientific, Waltham, MA, USA). RT reactions and qRT-PCR were both conducted according to the manufacturer’s protocol using the 214 Reverse Transcription System Kit (GenStar, Beijing, China). A two-step reverse transcription process was completed. The Step One PlusTM PCR System (Applied Biosystems, Foster City, CA, USA) was used to explore candidate genes’ expression profiles. All RNA-primers were purchased from General Biotech Co., Ltd. (Shanghai, China). The primer sequences of mRNA for candidate genes and housekeeping genes were listed as follows: YTHDF1-F: GGGGACAAGTGGGTCTCAAG; YTHDF1-R: AGGGTGTCGCTGTGAAAGC; GAPDH-F: GGACCTGACCTGCCGTCTAG; GAPDH-R: GTAGCCCAGGATGCCCTTGA. The comparative Ct method was used for the fold-change of the m6A gene in the GC cell line. The result of each sample was calculated through the 2-∆∆Ct method: ∆∆Ct= (Ct YTHDF1– Ct GADPH) GC cell line-(Ct YTHDF1 – Ct GADPH) GES-1 cell.
Western Blotting Analysis
Cells and tissue were lysed with RIPA lysis buffer supplemented with PMSF protease inhibitor (1:100) to harvest proteins. Then the protein samples were resolved by SDS-PAGE and then transferred to nitrocellulose membrane. Membranes were blocked in TBST for 2 hours, containing 5% skimmed milk, and then incubated with the primary antibody at 4°C overnight. The antibodies used for Western blot analysis were listed as follows: YTHDF1 (AB cam, 1:1000), GAPDH (AB cam, 1:1000). Then, the membrane was washed with TBST and incubated with the secondary antibody for another 1 hour. Bands were detected by the ECL chromogenic kit (Thermo Fisher, Inc., Scottsdale, CA, USA) and visualized using the Tanon-5200 chemiluminescence imaging system (Tanon Scientific Technology, Shanghai, China).
GEO Verification
We downloaded data from the Gene Expression Omnibus (GEO) dataset (http://www.ncbi.nlm.nih.gov/geo/). The target gene was normalized by log2 transformation. Finally, we selected five mRNA datasets for further validation.
Statistics Analysis
All data were summarized as mean, median, standard deviations.
Data were compared by applying analysis of variance, chi-square test, or non-parametric test when applicable. Differential analysis of expressed m6A genes and clustering analysis was performed using R version 3.5.1 by Wilcox analysis. LASSO logistic regression was performed using the “glmnet” package. Data analyses were conducted with GraphPad Prism 8.0 (La Jolla, CA, USA), and statistical significance was defined as p < 0.05.
Results
Patient Clinical Information
A total of 375 STAD patients and 32 normal controls with clinical features were available from the TCGA database. Patients were divided into sub-groups according to the clinical features. Clinical information including age, gender, TNM stage, tumor grade, and STAD patients’ outcome was presented in Table 1. Of all the patients, the mean age (mean ± standard deviation) was 64.92 ± 10.65. The overall survival time of these patients was 529.87 ± 502.56,128 of 375 (34.133%) died.
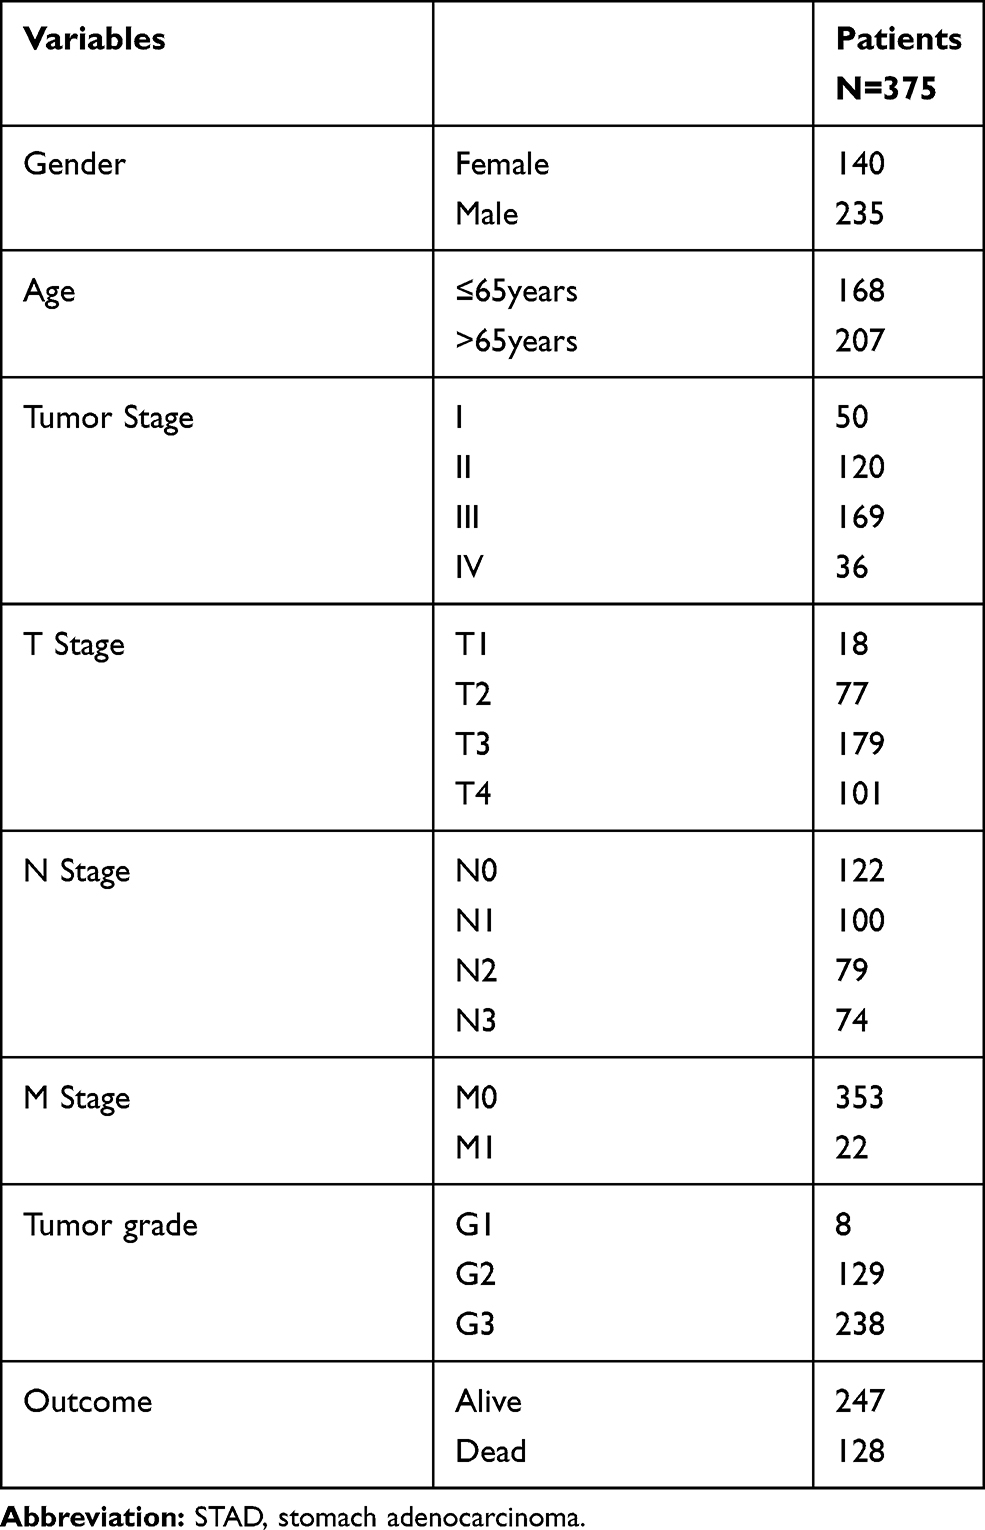 |
Table 1 Clinical Features of STAD Patients from TCGA Database |
The Expression Pattern of m6A Gene in GC
In the present study, the expression profile of fourteen m6A genes in TCGA STAD patients (n=375) was compared with adjacent normal non-tumor controls (n=32). The heat map reveals the differential analysis of fourteen expressed genes in STAD patients (Figure 1A). Vio-plots showed m6A molecules, including m6A Writer: METTL3, METTL14, METTL16, WTAP, KIAA1429, RBM15 and ZC3H13; m6A Reader: YTHDF1, YTHDF2, YTHDC1, YTHDC2, and HNRNPC were significantly up-regulated in tissues of patients with GC (Figure 1B).
 |
Figure 1 Expression profile of m6A RNA methylation modulators in TCGA GC patients. (A) The heat map of 14 m6A genes. (B) Vio-plots of 14 m6A genes. Data were presented as mean ± SEM. *P < 0.05, **P < 0.01, *** P < 0.001. |
Correlation Analysis
A correlation analysis was used to explore the association pattern between different m6A genes. The strength of the interaction between each gene can be interpreted as the sphere’s index and color. The bigger the ball, the greater the association between the two genes. Red indicates a positive correlation between two gene expressions, blue indicates a reverse correlation, and × indicates no correlation between the expression of two genes. Among m6A genes, co-expression patterns of the RBM15 and YTHDF2 were found, and YTHDF2 had the most significant positive correlation with reader HNRNPC (Figure 2). Conversely, we found a negative expression relationship between the methylation eraser FTO and the reader HNRNPC.
 |
Figure 2 Spearman correlation analysis of the 14 m6A modification modulators. X: P>0.05. |
Construction of m6A Gene-Based Diagnostic Signature
To screen potential diagnostic m6A candidates, we analyzed TCGA STAD samples (375 tumor samples and 32 normal samples) by the LASSO-logistic model. Ten potential markers were identified and were featured with nonzero coefficients in the LASSO-logistic analysis (Figure 3A-B, Supplementary Table 1). We constructed the m6A diagnostic signature by the following formula: DMS=expMETTL14*-0.3104466+expMETTL16*0.2497452+expWTAP*0.2261001+expKIAA1429*0.5311135+expZC3H13*0.1448186+expRBM15*0.4333276+expALKBH5*-0.1186324+expYTHDF1*0.3264817+expYTHDF2*0.1041577+expYTHDC1*-0.3303012.
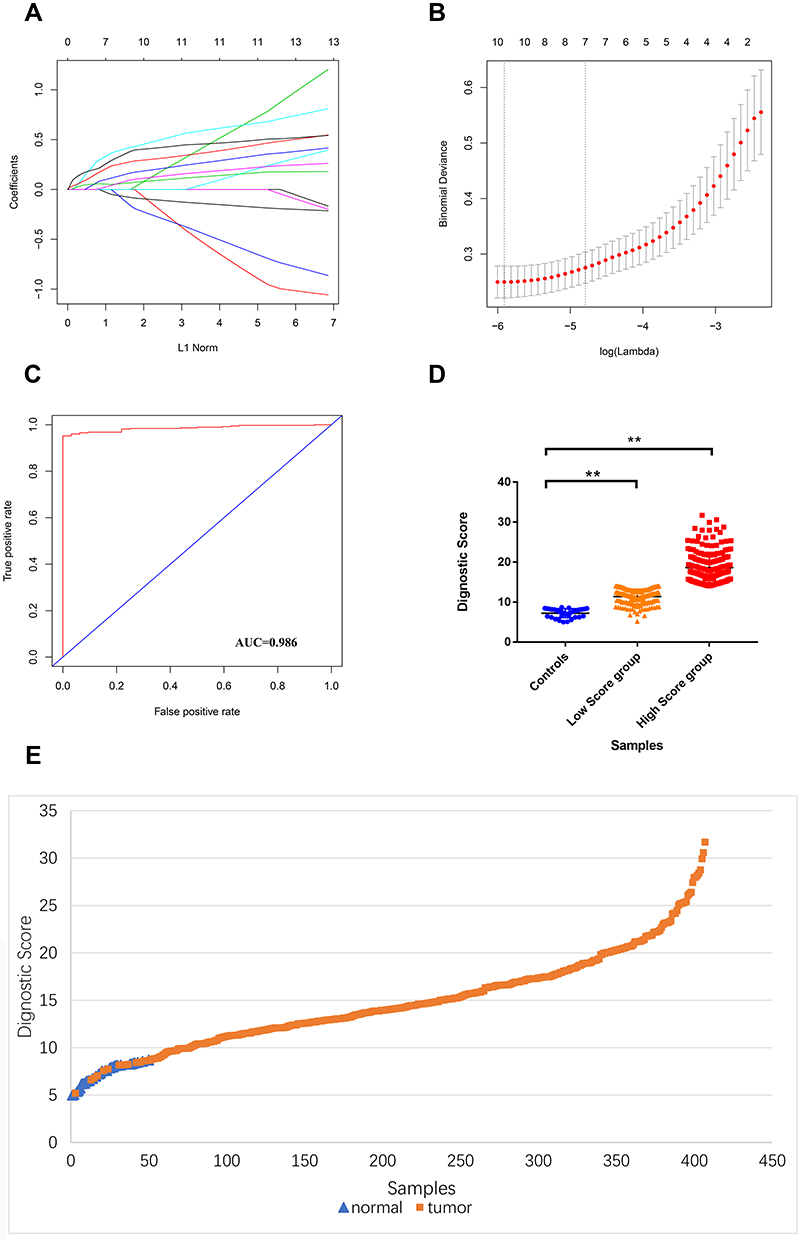 |
Figure 3 Construction of DMS. (A) LASSO coefficient profiles of the 14 m6A genes. (B) Tenfold cross-validation for tuning parameter selection in the LASSO model. (C) ROC curves of the DMS. (D) Diagnostic score comparison of GC patients and controls. (E) Diagnostic score distribution for the entire subjects. |
We evaluated DMS’s diagnostic value in distinguishing between tumors and normal controls, revealing that DMS with high diagnosis predictive accuracy (AUC = 0.986, Figure 3C). We also provided DMS distribution in two GC tumor groups tumors and normal controls, indicating that DMS in tumor tissues is significantly higher than the control and better distinguishes between high-risk individuals and normal controls (Figure 3D-E).
Composition of Diagnostic m6A Genes in DMS Clusters
Next, to assess the DMS signature value in GC subgroups, we clustered GC individuals based on ten candidates m6A markers. We performed the unsupervised clustering with the k‐means algorithm of all samples (Figure 4A). The optimal number of clusters was two (Figure 4B-C). We compared the scores in the two GC clusters and normal control group. The results showed that the average diagnostic score of patients in cluster B was 20.46±0.363 (n=114), which was significantly higher than that of patients with cluster A (13.02±0.184) and normal controls (7.232±0.197, n=32) (P<0.001, Figure 4D). Considering the various abundance of m6A genes by the individual, we depicted the ten candidate m6A gene expression proportions of each cluster.
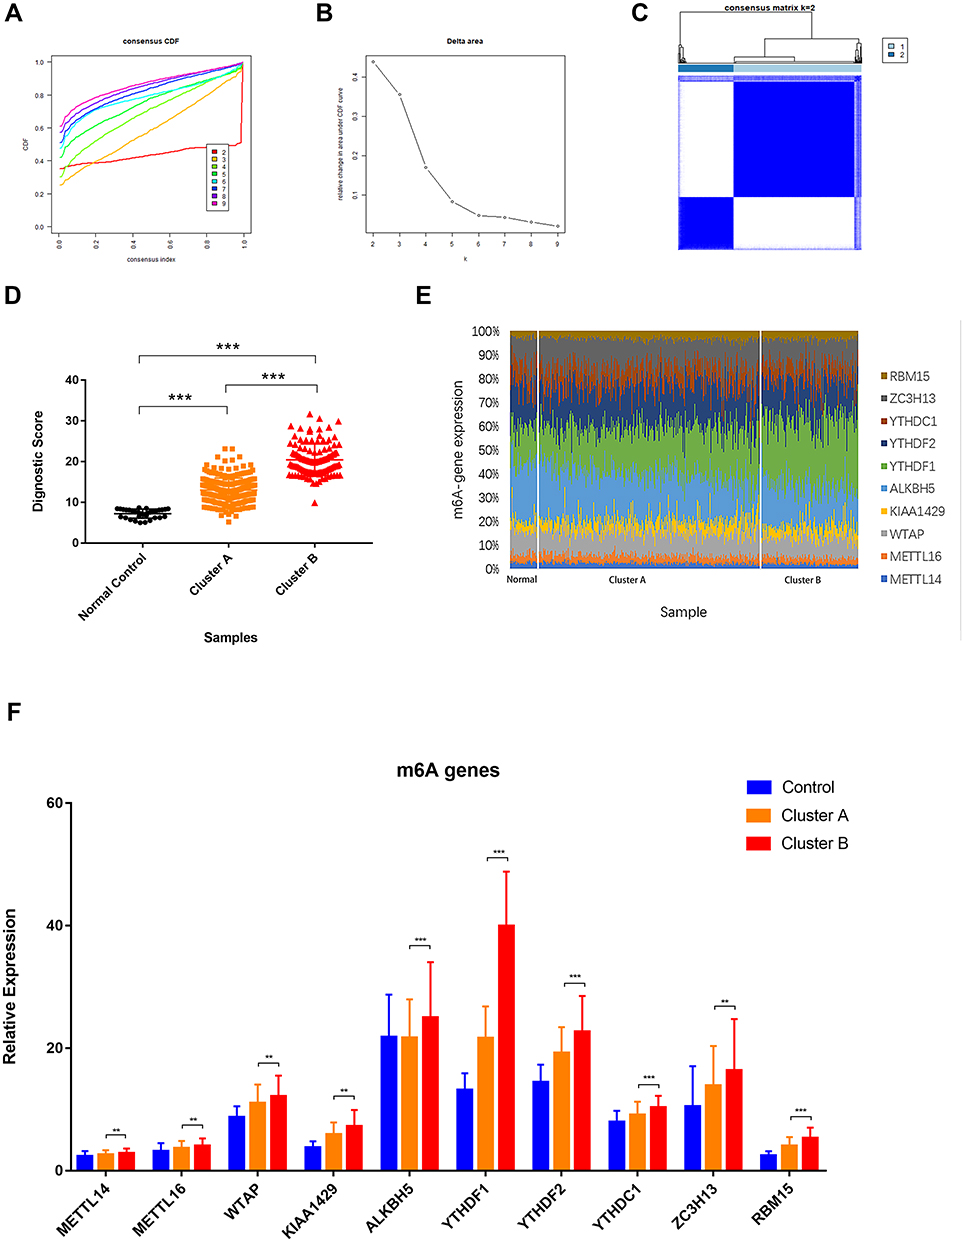 |
Figure 4 Composition of diagnostic m6A genes in DMS clusters. (A) Unsupervised clustering with the k‐means algorithm of entire samples. (B) Relative change in area under CDF curve for k = 2 to 9. (C) The optimal number of consensus clustering. (D) Diagnostic score comparison in DMS clusters and controls. (E) Diagnostic m6A regulators proportions in DMS clusters and controls. (F) Expression level of diagnostic m6A regulators in DMS clusters compared to controls. Data were presented as mean ± SEM.** P < 0.01, *** P < 0.001. |
YTHDF1’s Potential Diagnostic Role for GC Patients
We observed a significant difference in the abundance of the YTHDF1 gene in cluster A and B of the GC sample compared with the normal controls. The proportion of YTHDF1 expression was significantly increased in higher-risk groups (Figure 4E). We also compared other candidate m6A genes. The results showed that most m6A gene expressions increased, while the variance in YTHDF1 expression was the most significant (Figure 4F).
GEO Verification
To further validate the silicon analysis results, we analyzed five microarray sequencing data from the GEO database. The result was in fair consistent with the previous analysis, which enhances the up-trend of YTHDF1 expression in GC tissues (Table 2) (P<0.05).
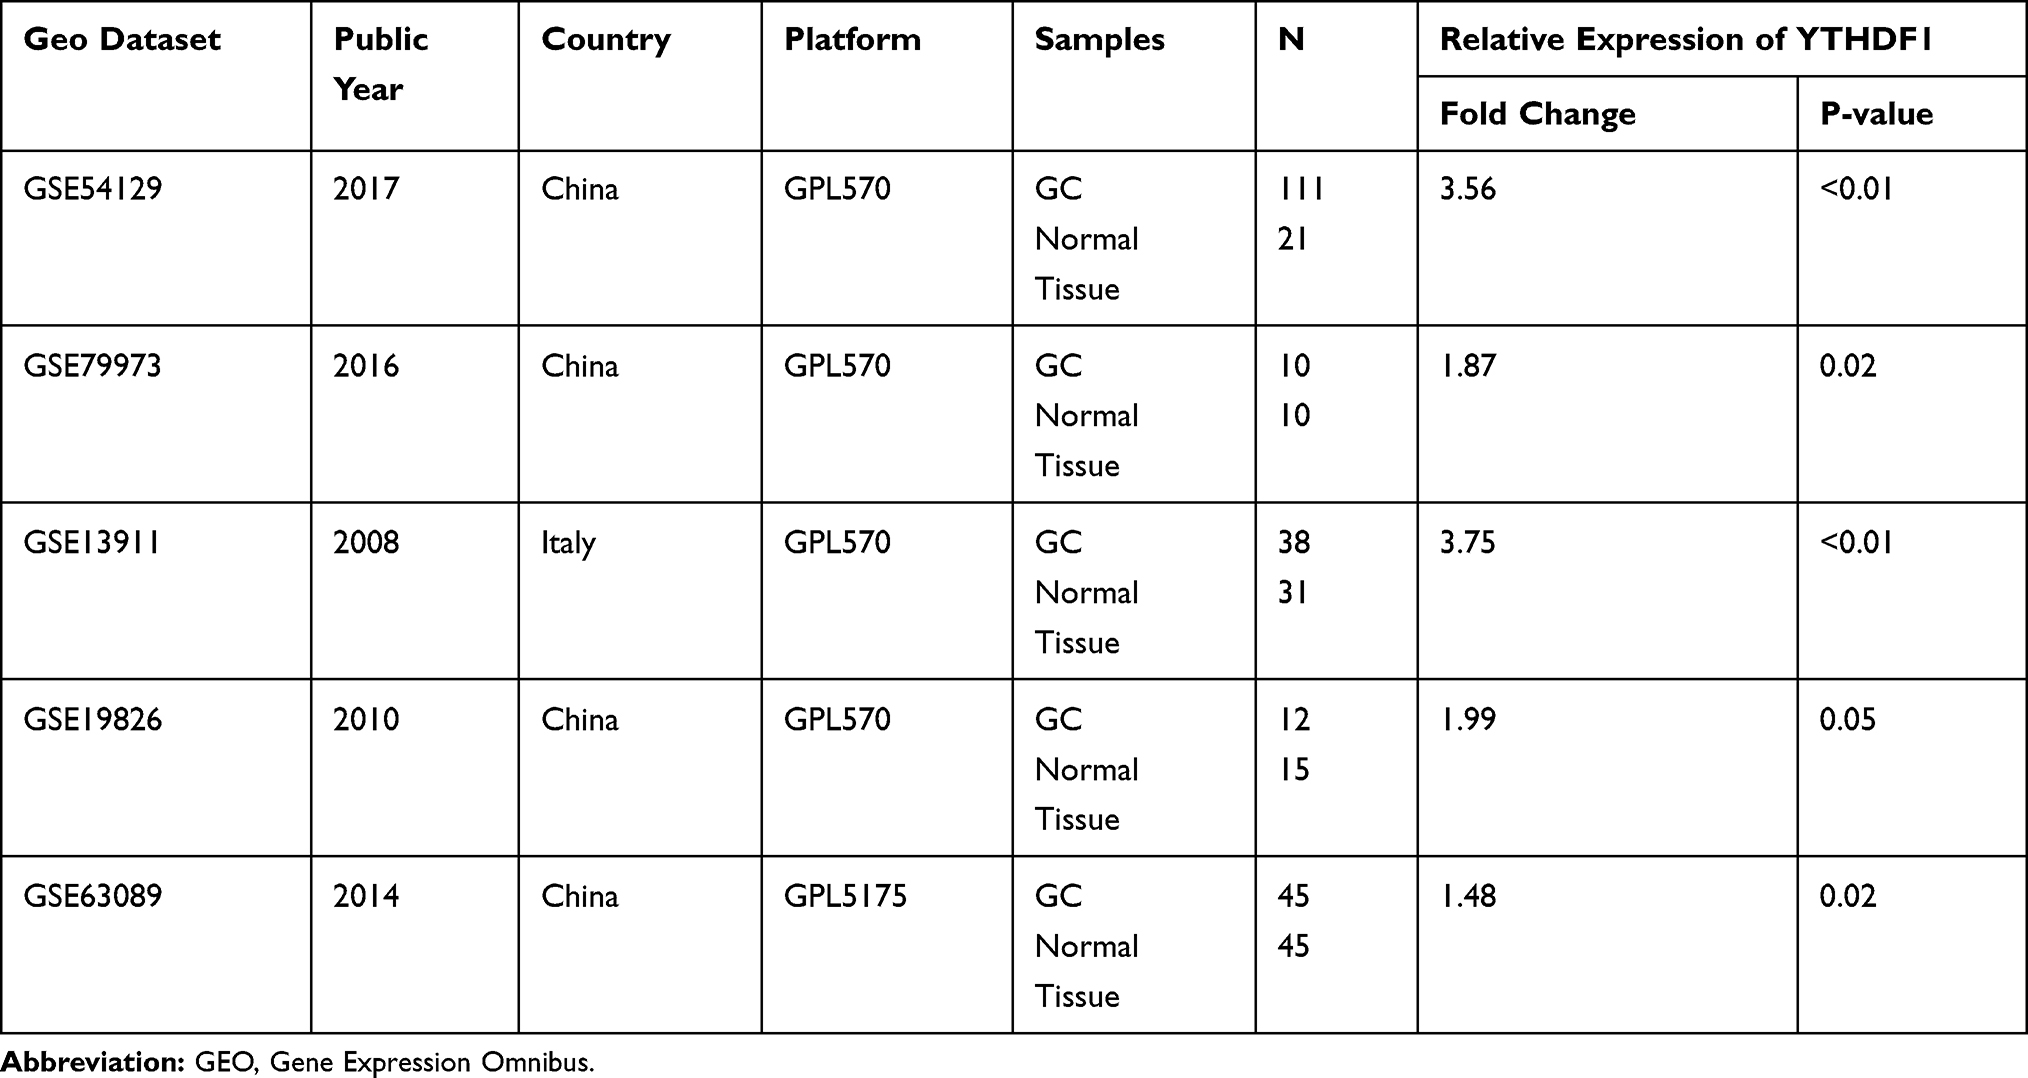 |
Table 2 The Expression Profile of YTHDF1 in GEO Database |
The Experimental Verification
To measure the expression level of YTHDF1 in CC, we collected 17 paired cancer- and adjacent normal-tissues and two GC cell lines. In the GC cell line SGC-7901 and BGC-823, YTHDF1 mRNA expression was significantly up-regulated compared to the GES-1 cell line (Figure 5A, p < 0.05). Similarly, qRT-PCR data revealed that the YTHDF1 expression level was enhanced in GC tissue when compared to the normal controls (Figure 5B, p < 0.05). The primary characteristics and clinical features of GC patients were presented in Supplementary Table 2. We verified the uptrend of the YTHDF1 protein expression level in the SGC-7901 cell-line and BGC-823 cell-line (Figure 5C).
 |
Figure 5 Expression profile of YTHDF1 in GC cell lines and tumor tissues. (A) RT-qPCR results of the YTHDF1 mRNA in GC cell line SGC-7901and BGC-823, *P < 0.05. (B) RT-qPCR results of YTHDF1 mRNA in GC tissues, *P < 0.05. (C) Western blot analysis results of YTHDF1 protein in GC cell line SGC-7901and BGC-823. |
Correlation of YTHDF1 Expression and Clinical Features
To explore the correlation between YTHDF1 expression and clinical features, we compared mRNA expression in different subgroups based on clinical characteristics, including patient age, ethnicity, TNM stage, and tumor grade. No differences were observed in YTHDF1 expression between the age and race subgroups, but higher than in adjacent non-tumor tissue controls (Figure 6A-B). According to the 8th American Joint Committee on Cancer (AJCC) TNM stage, patients were classified into Stage I, Stage II, Stage III, and Stage IV.21 YTHDF1 had higher expression levels in GC tissues of different TNM subgroups (Figure 6C), especially in stage 1 (median transcript per million of 46.73), compared to stage 2 (median transcript per million of 43.07), stage 3 (median transcript per million of 42.78), stage 4 (median transcript per million of 45.61) and adjacent normal control. The YTHDF1 expression levels also increased at different tumor grades of GC compared to normal controls, and grade 2 showed a significantly higher value than grade 1, grade 3 and adjacent normal control (Figure 6D, P<0.05).
 |
Figure 6 Correlation of YTHDF1 expression and clinical features. (A) Expression of YTHDF1 in TCGA STAD based on patients’ age. (B) Expression of YTHDF1 in TCGA STAD based on patients’ race. (C) Expression of YTHDF1 in TCGA STAD based on the TNM stage, the YTHDF1 expression level was significantly increased in stage I compared to stage II, stage III, stage IV, and adjacent normal control, *P < 0.05. (D) Expression of YTHDF1 in TCGA STAD based on tumor grade, the YTHDF1 expression level was significantly increased in grade 2 compared to grade1, grade 3 and adjacent normal control,* P < 0.05. |
Discussion
RNA could be modified through multi-ways of distinct post-transcriptional modifications, of which m6A methylation is considered the abundant reversible RNA modifications in eukaryotes.16,25 m6A methylation is involved in a variety of biological regulation, for instance, RNA stability and splicing, protein heat shock response, and circadian clock regulation.9,26–28 A growing number of studies uncovered that dysregulated m6A methylation modulators were closely correlated to development and progression in different types of cancer.19,29,30 Most previous studies were more concerned with the correlation between individual m6A molecules and disease.31–33 Here, we systematically evaluated fourteen m6A gene expression in GC patients from the TCGA database and constructed the m6A based signatures to predict the risk of onset.
We found that m6A modulators (Writer: METTL3, METTL14, METTL16, WTAP, KIAA1429, RBM15 and ZC3H13; Reader: YTHDF1, YTHDF2, YTHDC1, YTHDC2, and HNRNPC) were significantly up-regulated in GC (Figure 1). We also revealed that HNRNP and YTHDF2 were most associated with each other in GC. Moreover, a reversible expression pattern was noted between FTO and the HNRNP (Figure 2).
To develop and validate a diagnostic risk prediction model based on m6A features for individual GC risk, we constructed a DMS (Diagnostic m6A score) signature by the LASSO-logistic regression model. Similarly, Zhou et al developed a diagnostic immune-risk score model for colon cancer, which provided a new hint for cancer diagnosis.23 Ten potential diagnostic markers were selected for the DMS signature (Figure 3A-B). The results showed that the DMS value from the normal control to the GC tumor tissue increased gradually (Figure 3D-E) and had a higher AUC value (AUC = 0.986, Figure 3C).
Next, we identified two diagnostic clusters (Cluster A and Cluster B) using K-means clustering based on these m6A candidate molecules expression composition (Figure 4A-C). Similar methods have been used for immune-related diagnostic signature study.24 We compared the candidate m6A gene composition of GC patients and normal controls in different clusters. As shown in the DMS distribution of subtype diagnostic groups, DMS could effectively identify GC individuals from normal (Figure 4D). Moreover, comparing different DMS clusters, we found that the up-regulation of methylated reading protein YTHDF1 was the most significant (P<0.001). Previous studies revealed that YTHDF1 plays a vital role in different cancers. Zhao et al revealed that YTHDF1 were involved in the HCC cell cycle and metabolic process, suggesting that YTHDF1 may be a potential new therapeutic target for HCC.32 The previous study has shown that the PD-L1 checkpoint blockade’s therapeutic efficacy is significantly enhanced after knockout of YTHDF1, suggesting that YTHDF1 is a potential therapeutic target in anti-cancer immunotherapy, promoting cancer immunotherapy.34 Studies have also reported that the YTHDF1 gene overexpression in different types of cancers, such as neck squamous cell carcinoma,35 NSCLC,36 breast cancer,37 and colorectal cancer.38 We found that YTHDF1 mRNA was significantly up-regulated in GC data from TCGA and GEO databases (Figure 1, Table 2), consistent with experimental validation results (Figure 5B). Overexpression of YTHDF1 mRNA and protein was observed in two gastric cancer cell lines than the GES-1 cell line (Figure 5A and C). Analyzing clinical information, we found that the expression of the YTHDF1 gene has significantly increased in the tissues of patients with early GC (Figure 6C), suggesting that YTHDF1 may be a potential indicator for early diagnosis of GC patients.
Conclusion
In conclusion, the present study’s innovation is tantamount to developed the m6A regulator-based risk diagnostic score model, which could better distinguish high-risk GC patients from normal controls. Moreover, we found that the expression profile of YTHDF1 was significantly associated with the high-risk subtype of GC patients, suggesting that YTHDF1 might be a potential target in GC early diagnosis and carcinogenesis.
The present study might provide potential clinical implications, but it cannot be ignored that there were also limitations. In addition, it remains uncertain about the function of a single gene in early cancer diagnosis. Applying existing findings to actual clinical diagnoses in the future remains further exploration and verification. Further research needs to investigate the deep function and molecular mechanism of YTHDF1 in GC.
Abbreviations
GC, gastric cancer; m6A, N6-methyladenosine; METTL3, methyltransferase like 3; METTL14, methyltransferase like 14; METTL16, methyltransferase like 16; WTAP, Wilms’ tumor-1 associated protein; RBM15, RNA binding motif protein 15; ZC3H13, zinc finger CCCH domain-containing protein 13; FTO, fat mass and obesity-related protein; ALKBH5, alkB homolog 5; HNRNPC, heterogeneous nuclear ribonucleoprotein C; YTHDF1, YTH domain family 1; YTHDF2, YTH domain family 2; YTHDC1, YTH domain-containing 1; YTHDC2, YTH domain-containing 1YTH domain-containing 2; AML, acute myelocytic leukemia; HCC, hepatocellular carcinoma; STAD, stomach adenocarcinoma. TCGA, The Cancer Genome Atlas; GEO, Gene Expression Omnibus; DMS, Diagnostic m6A score. RT-qPCR, quantitative reverse transcription PCR; LASSO, The least absolute shrinkage and selection operator.
Data Sharing Statement
The datasets generated and analyzed during the current study are available in the [TCGA] repository (http://cancergenome.nih.gov).
Ethics Approval and Consent to Participate
The present study was approved by the Ethics Committee of the Zhongda Hospital, Affiliated to Southeast University (Ethics Approval No. 2019ZDKYSB137), and samples were obtained with written informed consent from all patients, and all informed consent were conducted in accordance with the Declaration of Helsinki.
Consent for Publication
Informed consent was obtained from all individual participants included in the study.
Author Contributions
All authors made a significant contribution to the work reported, whether that is in the conception, study design, execution, acquisition of data, analysis, and interpretation, or in all these areas; took part in drafting, revising or critically reviewing the article; gave final approval of the version to be published; have agreed on the journal to which the article has been submitted; and agree to be accountable for all aspects of the work.
Funding
The present study was supported by the National Natural Science Foundation of China (81673132 and 81472939) and Postgraduate Research & Practice Innovation Program of Jiangsu Province (KYCX19_0120).
Disclosure
The authors report no conflicts of interest in this work.
References
1. Karimi P, Islami F, Anandasabapathy S, et al. Gastric cancer, descriptive epidemiology, risk factors, screening, and prevention. Cancer Epidemiol Biomarkers Prev. 2014;23(5):700–713. doi:10.1158/1055-9965.EPI-13-1057
2. Bray F, Ferlay J, Soerjomataram I, et al. Global cancer statistics 2018, GLOBOCAN estimates of incidence and mortality worldwide for 36 cancers in 185 countries. CA Cancer J Clin. 2018;68(6):394–424. doi:10.3322/caac.21492
3. Chen QY, Lin GT, Zhong Q, et al. Laparoscopic total gastrectomy for upper-middle advanced gastric cancer, analysis based on lymph node noncompliance. Gastric Cancer. 2019.
4. Zhao L, Jiang L, He L, et al. Identification of a novel cell cycle-related gene signature predicting survival in patients with gastric cancer. J Cell Physiol. 2019;234(5):6350–6360. doi:10.1002/jcp.27365
5. Ham IH, Lee D, Hur H. Role of cancer-associated fibroblast in gastric cancer progression and resistance to treatments. J Oncol. 2019;2019:6270784. doi:10.1155/2019/6270784
6. Lobo J, Costa AL, Cantante M, et al. m(6)A RNA modification and its writer/reader VIRMA/YTHDF3 in testicular germ cell tumors, a role in seminoma phenotype maintenance. J Transl Med. 2019;17(1):79. doi:10.1186/s12967-019-1837-z
7. Chen M, Wei L, Law CT, et al. RNA N6-methyladenosine methyltransferase-like 3 promotes liver cancer progression through YTHDF2-dependent posttranscriptional silencing of SOCS2. Hepatology. 2018;67(6):2254–2270.
8. Fu Y, Dominissini D, Rechavi G, et al. Gene expression regulation mediated through reversible m(6)A RNA methylation. Nat Rev Genet. 2014;15(5):293–306. doi:10.1038/nrg3724
9. Liu N, Zhou KI, Parisien M, et al. N6-methyladenosine alters RNA structure to regulate binding of a low-complexity protein. Nucleic Acids Res. 2017;45(10):6051–6063. doi:10.1093/nar/gkx141
10. Song H, Feng X, Zhang H, et al. METTL3 and ALKBH5 oppositely regulate m(6)A modification of TFEB mRNA, which dictates the fate of hypoxia/reoxygenation-treated cardiomyocytes. Autophagy. 2019;15(8):1419–1437.
11. Paris J, Morgan M, Campos J, et al. Targeting the RNA m(6)A Reader YTHDF2 selectively compromises cancer stem cells in acute myeloid leukemia. Cell Stem Cell. 2019;25(1):137–148 e6. doi:10.1016/j.stem.2019.03.021
12. Klinge CM, Piell KM, Tooley CS, et al. HNRNPA2/B1 is upregulated in endocrine-resistant LCC9 breast cancer cells and alters the miRNA transcriptome when overexpressed in MCF-7 cells. Sci Rep. 2019;9(1):9430.
13. Yang S, Wei J, Cui YH, et al. m(6)A mRNA demethylase FTO regulates melanoma tumorigenicity and response to anti-PD-1 blockade. Nat Commun. 2019;10(1):2782. doi:10.1038/s41467-019-10669-0
14. Zhou J, Wang J, Hong B, et al. Gene signatures and prognostic values of m6A regulators in clear cell renal cell carcinoma - a retrospective study using TCGA database. Aging (Albany NY). 2019;11(6):1633–1647. doi:10.18632/aging.101856
15. Cao G, Li HB, Yin Z, et al. Recent advances in dynamic m6A RNA modification. Open Biol. 2016;6(4):160003. doi:10.1098/rsob.160003
16. Tuncel G, Kalkan R. Importance of m N(6)-methyladenosine (m(6)A) RNA modification in cancer. Med Oncol. 2019;36(4):36. doi:10.1007/s12032-019-1260-6
17. Zhou Y, Yin Z, Hou B, et al. Expression profiles and prognostic significance of RNA N6-methyladenosine-related genes in patients with hepatocellular carcinoma, evidence from independent datasets. Cancer Manag Res. 2019;11:3921–3931. doi:10.2147/CMAR.S191565
18. Dahal U, Le K, Gupta M. RNA m6A methyltransferase METTL3 regulates invasiveness of melanoma cells by matrix metallopeptidase 2. Melanoma Res. 2019;29(4):382–389. doi:10.1097/CMR.0000000000000580
19. Han J, Wang JZ, Yang X, et al. METTL3 promote tumor proliferation of bladder cancer by accelerating pri-miR221/222 maturation in m6A-dependent manner. Mol Cancer. 2019;18(1):110. doi:10.1186/s12943-019-1036-9
20. Li T, Hu PS, Zuo Z, et al. METTL3 facilitates tumor progression via an m(6)A-IGF2BP2-dependent mechanism in colorectal carcinoma. Mol Cancer. 2019;18(1):112. doi:10.1186/s12943-019-1038-7
21. In H, Solsky I, Palis B, et al. Validation of the 8th Edition of the AJCC TNM staging system for gastric cancer using the national cancer database. Ann Surg Oncol. 2017;24(12):3683–3691. doi:10.1245/s10434-017-6078-x
22. Chandrashekar DS, Bashel B, Balasubramanya SAH, et al. UALCAN, a portal for facilitating tumor subgroup gene expression and survival analyses. Neoplasia. 2017;19(8):649–658. doi:10.1016/j.neo.2017.05.002
23. Zhou R, Zhang J, Zeng D, et al. Immune cell infiltration as a biomarker for the diagnosis and prognosis of stage I-III colon cancer. Cancer Immunol Immunother. 2019;68(3):433–442. doi:10.1007/s00262-018-2289-7
24. Yang S, Liu T, Cheng Y, Bai Y, Liang G. Immune cell infiltration as a biomarker for the diagnosis and prognosis of digestive system cancer. Cancer Sci. 2019;110:3639–3649. doi:10.1111/cas.14216
25. Song T, Yang Y, Wei H, et al. Zfp217 mediates m6A mRNA methylation to orchestrate transcriptional and post-transcriptional regulation to promote adipogenic differentiation. Nucleic Acids Res. 2019;47(12):6130–6144. doi:10.1093/nar/gkz312
26. Wang X, Lu Z, Gomez A, et al. N6-methyladenosine-dependent regulation of messenger RNA stability. Nature. 2014;505(7481):117–120. doi:10.1038/nature12730
27. Zhou J, Wan J, Gao X, et al. Dynamic m(6)A mRNA methylation directs translational control of heat shock response. Nature. 2015;526(7574):591–594. doi:10.1038/nature15377
28. Lokody I. Gene regulation, RNA methylation regulates the circadian clock. Nat Rev Genet. 2014;15(1):3. doi:10.1038/nrg3638
29. Yang F, Jin H, Que B, et al. Dynamic m(6)A mRNA methylation reveals the role of METTL3-m(6)A-CDCP1 signaling axis in chemical carcinogenesis. Oncogene. 2019;38(24):4755–4772. doi:10.1038/s41388-019-0755-0
30. Wu L, Wu D, Ning J, et al. Changes of N6-methyladenosine modulators promote breast cancer progression. BMC Cancer. 2019;19(1):326. doi:10.1186/s12885-019-5538-z
31. Li Y, Zheng D, Wang F, et al. Expression of demethylase genes, FTO and ALKBH1, is associated with prognosis of gastric cancer. Dig Dis Sci. 2019;64(6):1503–1513. doi:10.1007/s10620-018-5452-2
32. Zhao X, Chen Y, Mao Q, et al. Overexpression of YTHDF1 is associated with poor prognosis in patients with hepatocellular carcinoma. Cancer Biomark. 2018;21(4):859–868. doi:10.3233/CBM-170791
33. Lin S, Liu J, Jiang W, et al. METTL3 promotes the proliferation and mobility of gastric cancer cells. Open Med (Wars). 2019;14:25–31. doi:10.1515/med-2019-0005
34. Han D, Liu J, Chen C, et al. Anti-tumour immunity controlled through mRNA m(6)A methylation and YTHDF1 in dendritic cells. Nature. 2019;566(7743):270–274. doi:10.1038/s41586-019-0916-x
35. Zhao X. Cui L, development and validation of a m(6)A RNA methylation regulators-based signature for predicting the prognosis of head and neck squamous cell carcinoma. Am J Cancer Res. 2019;9(10):2156–2169.
36. Shi Y, Fan S, Wu M, et al. YTHDF1 links hypoxia adaptation and non-small cell lung cancer progression. Nat Commun. 2019;10(1):4892. doi:10.1038/s41467-019-12801-6
37. Liu L, Liu X, Dong Z, et al. N6-methyladenosine-related genomic targets are altered in breast cancer tissue and associated with poor survival. J Cancer. 2019;10(22):5447–5459. doi:10.7150/jca.35053
38. Li D, Lin C, Chen M, et al. Comprehensive bioinformatics analysis of the characterization and determination underlying mechanisms of over-expression and co-expression of genes residing on 20q in colorectal cancer. Oncotarget. 2017;8(45):78642–78659. doi:10.18632/oncotarget.20204
 © 2020 The Author(s). This work is published and licensed by Dove Medical Press Limited. The
full terms of this license are available at https://www.dovepress.com/terms
and incorporate the Creative Commons Attribution
- Non Commercial (unported, 3.0) License.
By accessing the work you hereby accept the Terms. Non-commercial uses of the work are permitted
without any further permission from Dove Medical Press Limited, provided the work is properly
attributed. For permission for commercial use of this work, please see paragraphs 4.2 and 5 of our Terms.
© 2020 The Author(s). This work is published and licensed by Dove Medical Press Limited. The
full terms of this license are available at https://www.dovepress.com/terms
and incorporate the Creative Commons Attribution
- Non Commercial (unported, 3.0) License.
By accessing the work you hereby accept the Terms. Non-commercial uses of the work are permitted
without any further permission from Dove Medical Press Limited, provided the work is properly
attributed. For permission for commercial use of this work, please see paragraphs 4.2 and 5 of our Terms.