")
Back to Journals » International Journal of General Medicine » Volume 14
The Value of Combined Serum Amyloid A Protein and Neutrophil-to-Lymphocyte Ratio Testing in the Diagnosis and Treatment of Influenza A in Children
Authors Fu S, Zhang MM, Zhang L, Wu LF, Hu QL
Received 1 April 2021
Accepted for publication 9 June 2021
Published 22 July 2021 Volume 2021:14 Pages 3729—3735
DOI https://doi.org/10.2147/IJGM.S313895
Checked for plagiarism Yes
Review by Single anonymous peer review
Peer reviewer comments 2
Editor who approved publication: Dr Scott Fraser
Shui Fu,1 Miao-Miao Zhang,2 Liang Zhang,1 Li-Feng Wu,1 Qi-Lei Hu1
1Department of Clinical Laboratory, The First People’s Hospital of Yuhang District, Hangzhou, Zhejiang, 311100, People’s Republic of China; 2Department of Emergency, The Fifth People’s Hospital of Yuhang District, Hangzhou, Zhejiang, 311100, People’s Republic of China
Correspondence: Qi-Lei Hu
The First People’s Hospital of Yuhang District, No. 369 Yingbin Road of Nanyuan Street, Yuhang District, Hangzhou, 311100, People’s Republic of China
Tel +86 571 89369404
Email [email protected]
Objective: The aim of this study was to explore the value of serum amyloid A protein (SAA) and neutrophil-to-lymphocyte ratio (NLR) testing in the diagnosis and treatment of children with influenza A.
Methods: Specimens were collected from 85 children with influenza A, 85 children with a bacterial infection, and 86 healthy children. The levels of SAA and C-reactive protein (CRP) were measured, and routine blood tests were performed.
Results: The levels of SAA and CRP in the bacterial infection group were significantly higher than those in the influenza A group, and the levels in the influenza A group were higher than those in the healthy children. The NLR level in the influenza A group was not different from that in the bacterial infection group, but the NLR levels in the influenza A group and the bacterial infection group were higher than that in the healthy controls. The number of white blood cell (WBC) in the influenza A group was not different from that in healthy children, while the WBC counts in the control and bacterial infection groups were higher than that in the influenza A group. The distribution width of red blood cells in the bacterial infection group was higher than that in healthy controls. The receiver operating characteristic curve analysis showed that the area under the curve for the diagnoses of influenza A for SAA, NLR, and CRP was 0.806, 0.768, and 0.699, respectively. The sensitivity, specificity, positive predictive value, negative predictive value, and accuracy of SAA/NLR (SAA and NLR in the series) were 68.24%/76.47% (57.65%), 84.88%/72.09% (96.76%), 81.69%/73.03% (96.08%), 73.00%/75.61% (70.00%), and 76.61%/74.27% (77.78%), respectively.
Conclusion: In the early diagnosis of children with influenza A, the values of SAA and NLR are high. Thus, they could be used for monitoring and efficacy evaluation during the course of the disease.
Keywords: influenza A, serum amyloid protein; SAA, neutrophil/lymphocyte ratio, white blood cell, C-reactive protein
Introduction
Influenza is an acute respiratory infectious disease caused by different types of viruses. There are three main types of influenza virus: type A, type B, and type C, of which type A is the most common. Influenza A has the characteristics of wide epidemic spread, strong contagion, and susceptibility in children. It can seriously damage children’s physical and mental health.1,2 Serum amyloid A protein (SAA) is a non-specific acute phase reaction protein, which not only increases early with a large amplitude and high sensitivity in bacterial infectious diseases but also increases considerably in viral infectious diseases. It can therefore be used as a sensitive indicator for the diagnosis of viral and bacterial infections.3–5 The neutrophil-to-lymphocyte ratio (NLR) has emerged as an inflammatory indicator in recent years. Its clinical value in acute pancreatitis, septic shock, ulcerative colitis, and other inflammatory injury-related diseases has already been confirmed.6,7 However, there are relatively few authoritative studies of its practical value in the diagnosis and treatment of infectious diseases such as influenza A virus infection, and the usefulness of the combined measurement of SAA and NLR in the diagnosis and treatment of influenza A has not been reported. In the present study, the levels of SAA and NLR during the diagnosis and treatment of children with influenza A virus infection were analyzed to explore the value of their combined detection in the diagnosis and treatment of influenza A.
Materials and Methods
Samples
Between January and December 2019, 170 children with upper respiratory tract infection symptoms in The First People’s Hospital of Yuhang District, Hangzhou were screened as the study subjects. All the patients underwent blood and sputum cultures on the day of admission (before treatment). According to the results of the influenza A virus antigen test, 85 patients were infected with influenza A (the influenza A group), and the other 85 were infected with a bacteria (the bacterial infection group). In the influenza A group, there were 43 males and 42 females. Their ages ranged from 2–5 years old, with an average age of 3.52 ± 1.49 years old. Among them, 28 patients were aged 2.01–3 years old, 32 patients were 3.01–4 years old, and 25 patients were 4.01–5 years old. In the bacterial infection group, there were 43 males and 42 females aged 2–5 years old, with an average age of 3.49 ± 1.52 years old. Among them, 30 cases were aged 2.01–3 years old, 30 cases were 3.01–4 years old, and 25 cases were 4.01–5 years old. There were 35 cases of Streptococcus pneumoniae, 20 cases of Staphylococcus aureus, 15 cases of Haemophilus influenzae, 6 cases of Klebsiella pneumoniae, 5 cases of Branhamella catarrhalis, and 4 cases of Escherichia coli. During the same period, 86 healthy children of the same age group, who had physical examinations at the hospital, were selected as the control group. There were 43 males and 43 females, aged 2–5 years old, with an average age of 3.54 ± 1.48 years old. Among them, 30 patients were aged 2.01–3 years old, 30 patients were 3.01–4 years old, and 26 patients were 4.01–5 years old. The diagnostic criteria of all the enrolled subjects were based on the “Influenza Diagnosis and Treatment Plan (2018 Edition).” The diagnosis of influenza A was confirmed by the positive test result of the influenza A nucleic acid test. Those with other viruses (influenza B virus, respiratory syncytial virus, adenovirus, or mycoplasma pneumonia), infections, immune system diseases, blood system diseases, and those with severe liver and kidney dysfunction were excluded. Blood samples were collected from all the enrolled subjects on the day of admission and transferred to a procoagulant tube and an ethylenediaminetetraacetic acid anticoagulant tube. Throat swabs were also taken from these subjects following the blood collection. Patients in the influenza A group also underwent blood collection and were tested for SAA, NLR, and CRP on day three, day five, and day seven. The samples were processed within two hours.
Instruments and Consumables
The influenza A virus antigen detection kit (using the immune colloidal gold method), produced by the Hangzhou Innovative Biological Control Technology Co. Ltd., was used for the detection of the influenza A virus antigen. The routine blood test (absolute white blood cell [WBC] count, absolute neutrophil count, absolute lymphocyte count, and distribution width of red blood cells [RDW]) was tested using the Sysmex XE 2100 automatic blood analyzer (Sysmex, Kobe, Japan) and reagents. The NLR was calculated using the equation of the absolute neutrophils count/absolute lymphocytes count. The immune analyzer Jet-iStar3000 (tested by Zhonghan Shengtai Biotechnology Co. Ltd.) was used for the detection of SAA and C-reactive protein (CRP).
Detection Methods
The Detection of Influenza A Viral Antigen
The samples for the throat swab were collected, and the test was completed in accordance with the test kit operation manual.
The Routine Blood Test (WBC, Absolute Neutrophil Count, Absolute Lymphocyte Count, and RDW)
The Sysmex XE 2100 was subjected to a background test and indoor quality control daily before use. (The Sysmex XE 2100 was used in the inter-office quality evaluation of the Clinical Laboratory Center of the Ministry of Health and the Zhejiang Provincial Clinical Laboratory Center, with excellent results.) The on-machine operation testing was conducted carefully, following the operating procedures of each instrument.
The Detection of SAA and CRP
The SAA protein determination kit was used for the detection of SAA. The sample was mixed with the detection buffer containing fluorescence detection antibody. Then the sample mixture was added to the plate. It was diffused to the nitrocellulose membrane by capillary action and was captured by the paired antibody immobilized on the membrane. The quantity of deposited complexes was proportional to the amount of antigen contained in the sample. The intensity of the fluorescent antibody signal was proportional to the amount of antigen captured by the reaction. The concentration of the antigen in the sample was calculated using an immune analyzer.
The CRP determination kit was used for the detection of CRP. The sample was mixed with the detection buffer containing fluorescence detection antibody. Then the sample mixture was added to the plate and captured by the paired antibody fixed on the membrane of the detection area to form a CRP antibody-CRP-labeled complex. The fluorescence signal was proportional to the concentration of CRP. The concentration of the antigen in the sample was calculated with an immune analyzer.
Treatment of Patients
Patients infected with influenza A were treated with an anti-influenza virus drug (oseltamivir) and given nutritional support. Based on the results of their bacterial culture, the bacterial infection group received antibiotic treatment and nutritional support.
Statistical Analysis
SPSS22.0 software was used for data processing. A normality test was conducted for relevant data. Data conforming to the normal distribution were expressed as  ± s, and the t-test was used for the comparison between the two groups. An analysis of variance was used for the comparison between the three groups. The data that did not conform to the normal distribution were represented by the median (M) [quartile (P25–P75)]. The nonparametric Mann–Whitney U-test was used for the comparison between two groups, and the Kruskal–Wallis H-test was used for the comparison between the three groups. The receiver operating characteristic (ROC) curve was used to analyze the value of SAA and NLR in diagnosing influenza A. A p-value < 0.05 was considered statistically significant.
Results
The Comparison of Laboratory Indicators Between the Influenza A Group, the Bacterial Infection Group, and the Normal Control Group
The differences in SAA, NLR, WBC, CRP, and RDW between the three groups were statistically significant (see Table 1). The levels of SAA and CRP in the bacterial infection group were higher than those in the influenza A group, and those in the influenza A group were higher than those in the normal control group. The differences were statistically significant (see Figure 1A and C). The NLR level in the influenza A group was not different from that in the bacterial infection group. The NLR levels in the influenza A group and the bacterial infection group were higher than that in the normal control group (see Figure 1B). The WBC count in the influenza A group was not different from that in the normal control group. The WBC count in the bacterial infection group were higher than that in the normal control group and influenza A group (see Figure 1D). The RDW in the bacterial infection group was higher than that in the normal control group. There was no significant difference in the RDW between the bacterial infection group and the influenza A group and between the normal control group and the influenza A group (see Figure 1E).
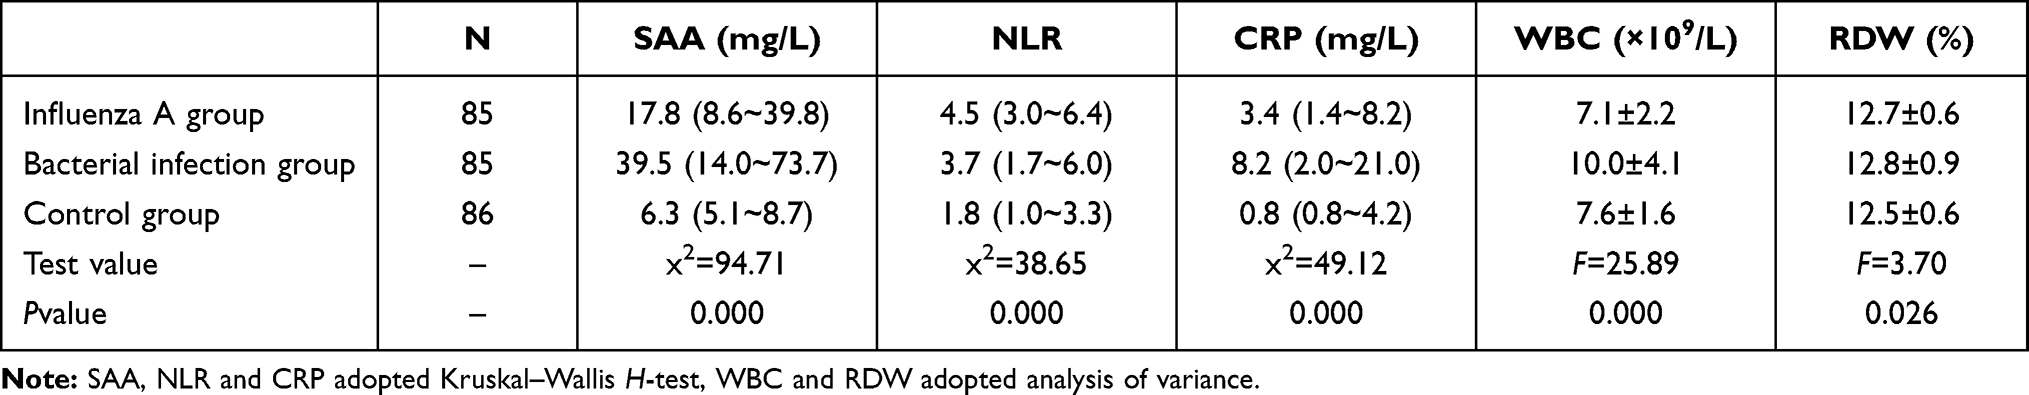 |
Table 1 The Comparison of Laboratory Indicators Among the Influenza A Group, Bacterial Infection Group and Normal Control Group |
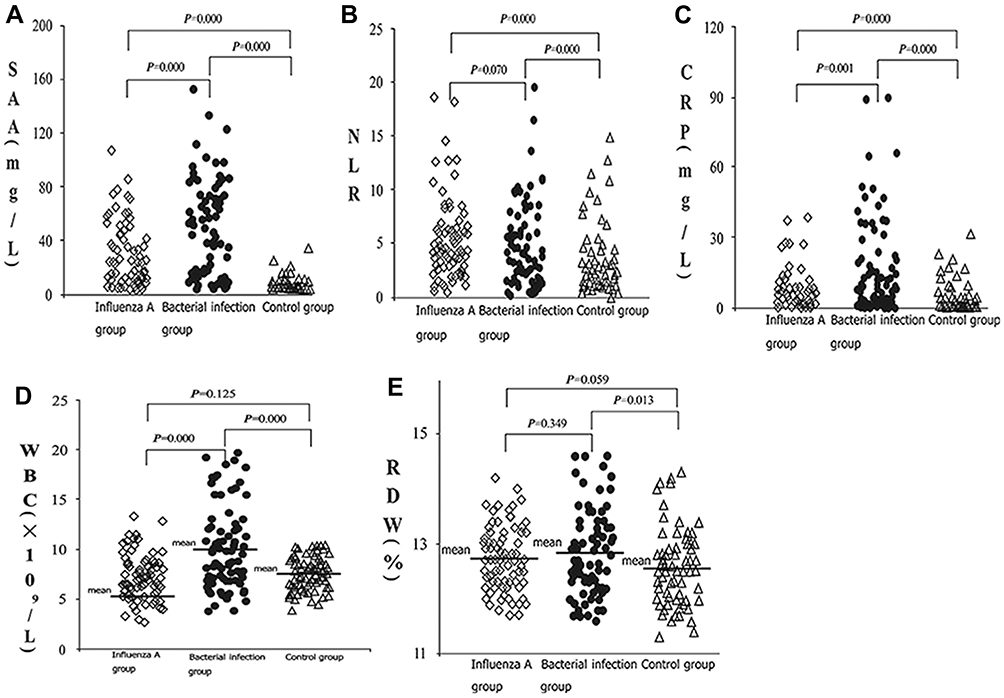 |
Figure 1 The comparison of SAA, NLR, WBC, CRP, and RDW levels. The levels of SAA, NLR, WBC, CRP, and RDW in the influenza A, bacterial infection, and control groups at admission are compared. Notes: The analyses of SAA in (A), NLR in (B), and CRP in (C) were made with a Mann–Whitney U-Test. The analyses of WBC in (D) and RDW in (E) were made with a t-test. |
The Value of SAA, NLR, and CRP in the Diagnosis of Influenza A
The results of ROC curve analysis of SAA, NLR, and CRP in children with influenza A showed that the area under the curve (95% confidence interval) of SAA, NLR, and CRP for the diagnosis of influenza A was 0.806 (0.737–0.874), 0.768 (0.695–0.841), and 0.699 (0.620–0.799), respectively, and the best cut-off points were 11.75 mg/L, 2.96, and 5.9 mg/L, respectively (see Figure 2). The diagnostic efficiency of SAA was slightly higher than that of NLR. The in-series detection of SAA and NLR was able to improve the specificity and reduce the sensitivity for making a diagnosis (see Table 2).
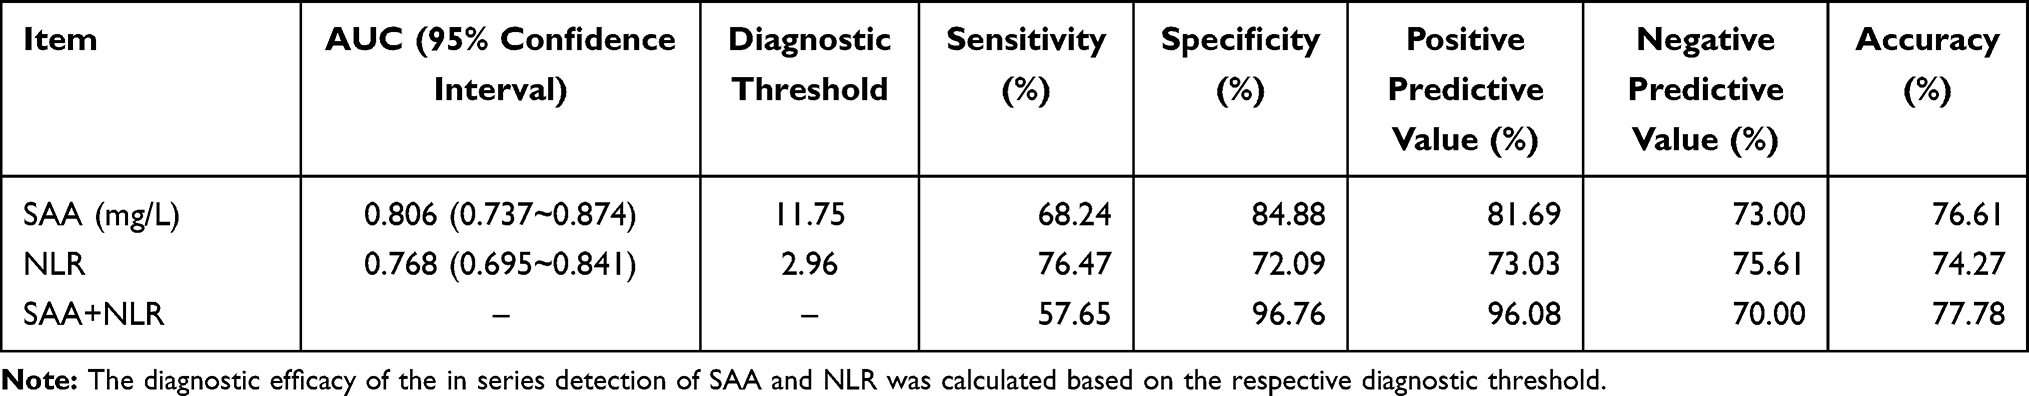 |
Table 2 The Value of SAA and NLR in the Diagnosis of Influenza A |
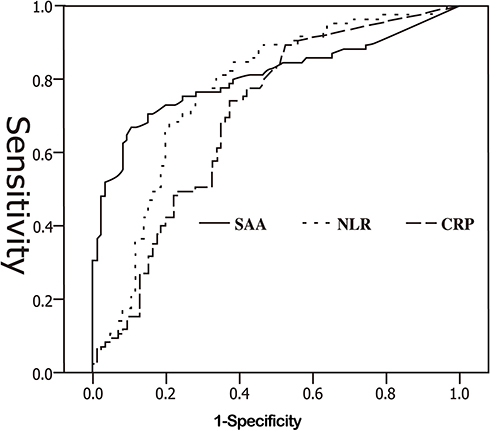 |
Figure 2 The ROC curve of SAA, NLR, and CRP. An ROC curve analysis was performed to assess the diagnostic efficacy of SAA, NLR, and CRP for influenza A. The cut-off points of SAA, NLR, and CRP were 11.75 mg/L, 2.96, and 5.9 mg/L, respectively. |
The Dynamic Changes of SAA and NLR in Influenza A Group During Diagnosis and Treatment
SAA and NLR showed a tendency to decline and return to a normal level by day five (see Figures 3 and 4). No patients showed any clinical symptoms of infection, such as fever, by day 7 of admission.
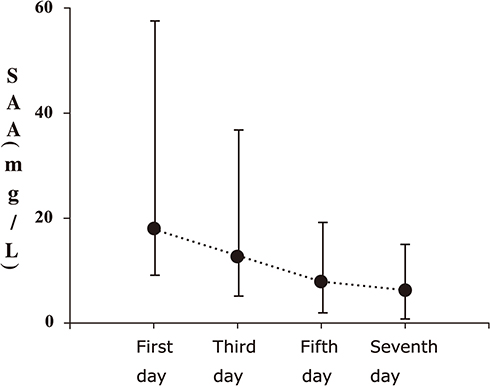 |
Figure 3 The dynamic changes of SAA in the influenza A group. Patients in the influenza A group underwent blood collection, and the SAA was measured on the first, third, fifth, and seventh day of admission. It fell to normal levels by day five of admission. |
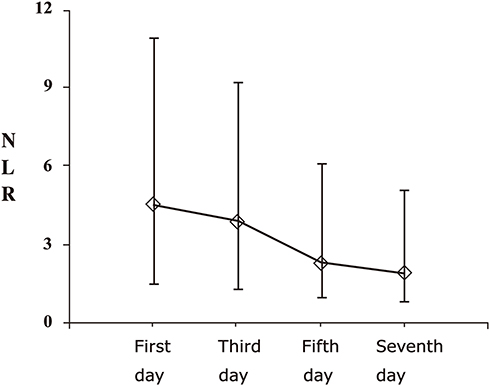 |
Figure 4 The dynamic changes of NLR in influenza A group. Patients in the influenza A group underwent blood collection, and the NLR was recorded on the first, third, fifth, and seventh day of admission. It dropped to normal levels by day five of admission. |
Discussion
Influenza A virus is the most common influenza virus and has the most variants. Influenza A is a highly infectious viral disease, and the clinical manifestations are easy to confuse with acute upper respiratory tract infections caused by bacteria in the early stage.8 SAA is an acute phase response protein, which is more sensitive than CRP during viral infection. The level of SAA increases rapidly during the onset period and decreases significantly during the recovery period, making SAA a sensitive indicator for the early detection of viral infections in children.9,10 The blood routine test is the most commonly used laboratory screening item in clinical practice. In theory, WBC counting and classification, and the counting of neutrophils and lymphocytes, can be used as differential diagnostic indicators for viral and bacterial infections, but the application is limited by the many influencing factors that reduce the diagnostic effectiveness.11,12 The NLR is a ratio, which is more accurate than WBC counting. Neutrophils and lymphocytes not only reflect the role of neutrophils in infection but also reflect the changes in lymphocytes in the body in a timely manner to identify the type of pathogen.
Some domestic and foreign researchers have confirmed the clinical value of SAA in infectious diseases in children, but there are still few reports on the diagnosis and treatment of influenza A.4,9,10 The results of the present study revealed that the levels of SAA and CRP in children with bacterial infection were significantly higher than those in children with influenza A infection and were even higher than those in healthy children. In addition, the WBC count in children with bacterial infection was higher than that in those in children with influenza A infection and healthy children. These results suggest that SAA and CRP are valuable indicators in distinguishing bacterial and viral infections. However, there was no difference in WBC counts between children with influenza A infection and healthy children. There was also no difference in the RDW between children with influenza A and children with bacterial infection. The RDW in children with bacterial infection was higher than that in healthy children, and this was statistically significant. The NLR in children with influenza A and bacterial infection was higher than that in healthy children, but there was no difference between the children with influenza A and those with a bacterial infection. These results suggest that WBC counts and RDW on their own cannot be used to diagnose influenza A. The reason might be that the study subjects were children, and the classification of WBC in different age groups changes and correlates with the vigorous process of hematopoiesis in red blood cells in children. The NLR was able to make a distinction between the physiological and pathological conditions, which was consistent with the results of Russell et al11 and Han et al,12 but NLR could not be used to distinguish the type of pathogen. Therefore, in daily clinical practice, the recommendation is to calculate the NLR first and then conduct SAA and CRP testing if abnormalities exist. The combination of the three could then give a preliminary determination of the type of pathogen.
The results of the ROC analysis demonstrated that the AUCs of SAA, NLR, and CRP for the diagnosis of influenza A was 0.806, 0.768, and 0.699, respectively, and the diagnostic cut-off points were 11.75 mg/L, 2.96, and 5.9 mg/L, respectively. This indicates that all three had high diagnostic efficacy, but that of SAA was higher than that of NLR and CRP, while that of NLR was higher than that of CRP. The AUC of CRP was 0.699, which indicated high diagnostic accuracy, but the diagnostic cut-off point of 5.9 mg/L was much lower than the normal reference value of ≤8.0 mg/L, which made it difficult to distinguish abnormalities in clinical practice. Thus, CRP can only be used as a sensitivity indicator in distinguishing bacterial infections. The specificity, positive predictive value and accuracy of SAA were higher than those of NLR, and the sensitivity and negative predictive value of SAA were slightly lower than that of NLR. This suggests that the in-series detection of SAA and NLR can improve the specificity, positive predictive value, and accuracy.
Through the dynamic monitoring of the changes in SAA and NLR in children with influenza A, it was found that effective treatment can quickly improve the clinical symptoms, together with the fact that the levels of SAA and NLR in the body can quickly return to normal. The present study found that it took approximately seven days for the levels of SAA and NLR to return to normal. This was consistent with the pathophysiological process of the influenza A virus, thus further supporting the value of SAA and NLR in the diagnosis of influenza A. It indicates that SAA and NLR can be used to evaluate the therapeutic effect in children with influenza A and as a monitoring indicator throughout the course of the disease. In the case of significant elevations in SAA and NLR, the changes in the body and the treatment plan should be fully evaluated to prevent the occurrence of complications in time to prevent the disease from progressing. The reason that SAA could be used as a high-efficiency diagnosis and treatment indicator for influenza A is inseparable from the fast response time to inflammatory factors, short half-life, and increasing amplitude. SAA rapidly increases by approximately 1000 times within 4–6 hours and has a half-life of about 50 minutes, while CRP rises rapidly after 5–8 hours and reaches a peak at 24 hours, with a half-life of approximately 6 hours. However, the application of SAA as an emerging indicator, coupled with high testing costs and expensive equipment, makes it difficult to popularize its use in many hospitals. The first consultation for children with influenza A is generally in a regular hospital, which would easily lead to conflicts between the detection levels and clinical needs. Therefore, in daily clinical practice, it is recommended to calculate the NLR first and then combine it with CRP (the CRP in patients with influenza A is basically normal or slightly increased) to make a pre-diagnosis and then conduct a therapeutic diagnosis. If possible, the levels of SAA, NLR, and CRP should be tested to better differentiate whether an illness is influenza A and provide a reliable guarantee of effective early intervention in children.
Ethics Approval
This study was conducted with approval from the Ethics Committee of The First People’s Hospital of Yuhang District, Hangzhou. This study was conducted in accordance with the declaration of Helsinki. The parent or legal guardian of the patients provided informed consent.
Disclosure
The authors report no conflicts of interest in this work.
References
1. Gaitonde DY, Moore FC, Morgan MK. Influenza: diagnosis and treatment. Am Fam Physician. 2019;100(12):751–758.
2. Labuda SM, Yang C, Daniels C, et al. Influenza-related parotitis during a large mumps outbreak - arkansas, 2016–2017. Arch Clin Case Rep. 2019;2(2):6–8.
3. Niu T, Liu Y, Zhu F, et al. Time-resolved fluorescent immunoassay-based combined detection of procalcitonin, C-reactive protein, heparin binding protein, and serum amyloid A1 to improve the diagnostic accuracy of early infection. J Clin Lab Anal. 2019;33(2):e22694. doi:10.1002/jcla.22694
4. Enniwal IJ, Gan L, Lei L, Jiang J. Clinical significance of combined detection of SAA, CRP and WBC in the diagnosis of infectious diseases in children. J Guizhou Med Univ. 2019;44(6):721–724.
5. Ather JL, Dienz O, Boyson JE, et al. Serum Amyloid A3 is required for normal lung development and survival following influenza infection. Sci Rep. 2018;8(1):16571. doi:10.1038/s41598-018-34901-x
6. Fei Y, Zhang H, Zhang C. The application of lymphocyte*platelet and mean platelet volume/platelet ratio in influenza A infection in children. J Clin Lab Anal. 2019;33(9):e22995. doi:10.1002/jcla.22995
7. Zhang Y, Zou P, Gao H, et al. Neutrophil-lymphocyte ratio as an early new marker in AIV-H7N9-infected patients: a retrospective study. Ther Clin Risk Manag. 2019;15(6):911–919. doi:10.2147/TCRM.S206930
8. National Health and Family Planning Commission, National Administration of Traditional Chinese Medicine. Diagnosis and treatment of influenza (2018 Edition). Chin J Infect Control. 2018;17(2):181–184.
9. Laboratory Medicine Committee of Chinese Association of Integrated Traditional and Western Medicine. Expert consensus on the clinical use of serum amyloid A in infectious diseases. Int J Lab Med. 2019;42(3):186–192. (in Chinese with English abstract).
10. Pomorska-Mól M, Markowska-Daniel I, Kwit K, et al. Immune and inflammatory response in pigs during acute influenza caused by H1N1 swine influenza virus. Arch Virol. 2014;59(10):2605–2614. doi:10.1007/s00705-014-2116-1
11. Russell CD, Parajuli A, Gale HJ, et al. The utility of peripheral blood leucocyte ratios as biomarkers in infectious diseases: a systematic review and meta-analysis. J Infect. 2019;78(5):339–348. doi:10.1016/j.jinf.2019.02.006
12. Han SY, Lee IR, Park SJ, Kim JH, Shin JI. Usefulness of neutrophil-lymphocyte ratio in young children with febrile urinary tract infection. Korean J Pediatr. 2016;59(3):139–144. doi:10.3345/kjp.2016.59.3.139
 © 2021 The Author(s). This work is published and licensed by Dove Medical Press Limited. The full terms of this license are available at https://www.dovepress.com/terms.php and incorporate the Creative Commons Attribution - Non Commercial (unported, v3.0) License.
By accessing the work you hereby accept the Terms. Non-commercial uses of the work are permitted without any further permission from Dove Medical Press Limited, provided the work is properly attributed. For permission for commercial use of this work, please see paragraphs 4.2 and 5 of our Terms.
© 2021 The Author(s). This work is published and licensed by Dove Medical Press Limited. The full terms of this license are available at https://www.dovepress.com/terms.php and incorporate the Creative Commons Attribution - Non Commercial (unported, v3.0) License.
By accessing the work you hereby accept the Terms. Non-commercial uses of the work are permitted without any further permission from Dove Medical Press Limited, provided the work is properly attributed. For permission for commercial use of this work, please see paragraphs 4.2 and 5 of our Terms.