Back to Journals » Diabetes, Metabolic Syndrome and Obesity » Volume 14
The Triglyceride–Glucose Index is Associated with Diabetic Retinopathy in Chinese Patients with Type 2 Diabetes: A Hospital-Based, Nested, Case–Control Study
Authors Yao L, Wang X, Zhong Y, Wang Y ![]() , Wu J, Geng J, Zhou Y, Chen J, Guan P
, Wu J, Geng J, Zhou Y, Chen J, Guan P ![]() , Xu Y
, Xu Y ![]() , Chen L, Liu L
, Chen L, Liu L ![]() , Hu Y
, Hu Y
Received 27 November 2020
Accepted for publication 20 March 2021
Published 9 April 2021 Volume 2021:14 Pages 1547—1555
DOI https://doi.org/10.2147/DMSO.S294408
Checked for plagiarism Yes
Review by Single anonymous peer review
Peer reviewer comments 3
Editor who approved publication: Professor Ming-Hui Zou
Litong Yao,1,2,* Xinyu Wang,2,* Yifan Zhong,3,* Yan Wang,4,* Jingyang Wu,3 Jin Geng,3 Yun Zhou,3 Jun Chen,3 Peng Guan,5 Yingying Xu,1 Lei Chen,3 Lei Liu,3 Yuedong Hu3
1Department of Breast Surgery, First Affiliated Hospital of China Medical University, Shenyang, 110001, People’s Republic of China; 2China Medical University, Shenyang, 110001, People’s Republic of China; 3Department of Ophthalmology, First Affiliated Hospital of China Medical University, Shenyang, 110001, People’s Republic of China; 4Department of Radiology, General Hospital of Liaohe Oil Field, Panjin, 124010, People’s Republic of China; 5Department of Epidemiology, School of Public Health, China Medical University, Shenyang, 110122, People’s Republic of China
*These authors contributed equally to this work
Correspondence: Lei Liu; Yuedong Hu
Department of Ophthalmology, First Affiliated Hospital of China Medical University, 155 Nanjing North Street, Heping District, Shenyang, Liaoning Province, People’s Republic of China
Tel/Fax +86-24-8328-2277
Email [email protected]; [email protected]
Background: This study aimed to investigate the association between the triglyceride–glucose (TyG) index and diabetic retinopathy (DR) in Chinese patients with type 2 diabetes.
Methods: In this nested case–control study, all diabetic participants were registered hospitalizations during 2012– 2018, including 596 with DR as cases and three matching controls per case. DR was assessed using Early Treatment Diabetic Retinopathy Study criteria. The TyG index was calculated: Ln (fasting blood glucose [mg/dL] × fasting triglycerides [mg/dL] ÷ 2). Multivariate logistic regression, a receiver-operating characteristic (ROC) curve, linear regression models, and mediation analysis were used to explore associations.
Results: The TyG index was lower in DR and decreased as its severity advanced among 2,112 subjects (P=0.005). After confounders (sex, duration of diabetes, use of antidiabetic agents, heart rate, systolic blood pressure, pulse pressure, height, weight, body-mass index, and glycated hemoglobin) had been accounted for, there were significant associations between the TyG index and any-severity DR (OR 0.83, 95% CI 0.73– 0.95; P=0.006), as well as vision-threatening DR (VTDR; OR 0.53, 95% CI 0.36– 0.76; P=0.001). ROC analysis indicated that the TyG index showed significant discriminatory ability in any-severity DR (area under curve [AUC] 0.534, P=0.015) and VTDR (AUC 0.624, P=0.001).
Conclusion: The TyG index was associated with the presence and severity of DR. Our findings suggest that the TyG index may become a useful biomarker in evaluating and following the presence of DR and VTDR.
Keywords: diabetic retinopathy, triglyceride–glucose index, type 2 diabetes, hospital-based nested case–control study
Introduction
A frequent chronic complication of diabetes, diabetic retinopathy (DR) is caused by lasting damage to retinal microcirculation.1–3 Based on numerous epidemiological studies and clinical trials, the presence and development of DR are complicated and are related to many factors, such as longer duration of diabetes, dysglycemia, or unstable blood pressure (BP).4–6 The homogeneity, pattern, and intensity of these factors vary considerably.4 Currently, screening and diagnosis of DR depends on retina photography, and there is no exact detectable biomarker to predict the existence of DR.
Microvascular complications of diabetes are considered consequences of chronic metabolic disturbances induced by dysglycemia,7 and as a causal factor, dysglycemia is strongly implicated in diabetic complications, especially retinopathy.2 However, purported associations of total cholesterol (TC) and triglycerides (TGs) with DR are still controversial. Higher TC was supposed to be protective against DR in the Singapore Malay Eye Study,8 but a national study in South Korea found that there was no significant association between TC levels and DR.9 As for TGs, one cross-sectional study involving 13,473 participants found an independent positive relationship between TG levels and the risk of DR.6 Conversely, Zhang et al found that Chinese with lower TG levels suffered from DR more frequently.5
To further clarify the influence of blood glucose and lipids in the presence and development of DR, the triglyceride–glucose (TyG) index can be used, which is calculated on the basis of fasting glycemia (mg/dL) and TGs (mg/dL).10 As a parameter to evaluate cardiovascular and metabolic function, the TyG index is also thought to be relevant to insulin resistance (IR).10,11 Meanwhile, IR plays a pivotal role in the development of type 2 diabetes and its microvascular and macrovascular complications.12,13 Recently, a retrospective cross-sectional study demonstrated that TyG was significantly associated with the risk of microalbuminuria and cerebrovascular disease, rather than DR, but these outcomes should be viewed with caution, due to study design, diagnostic methods, and adjusted confounders.14 No relevant population-based or clinical investigation has focused on the impact of TyG on DR in patients with diabetes. In this study, we aimed to explore the relationship between the TyG index and DR by using comprehensive registry data with a nested case–control design in a study cohort of patients with type 2 diabetes in China.
Methods
Study Design
This was a hospital-based, nested, case–control study of all diabetes patients registered at the Diabetic Eye Disease Center and Department of Endocrinology and Metabolism of the First Affiliated Hospital of China Medical University. The authors identified 683 cases of any type of diabetes who had been diagnosed with DR during 2012–2018, and two researchers (LL and LTY) reviewed all clinical and biochemical information to ascertain DR diagnosis. Subsequently, 87 cases were excluded: not type 2 diabetes, pregnant or lactatioing, major mental or physical illness for >3 years (including cerebral infarction, myocardial infarction, chronic kidney disease, malignant tumors, severe organ dysfunction, and mental disorders), and incomplete information, leaving 596 (87.3%) confirmed cases of DR with type 2 diabetes. Type 2 diabetes was defined following American Diabetes Association standards.15 The first test during hospitalization at the time of diagnosis was used as the parameter for these cases. We set a ratio of one case to three controls and randomly selected controls from the same hospital registry, using individual matching by year of birth (5-year intervals) and sex. None of the controls had a history of DR. Exclusion criteria for the control group were the same as those of the case group, so 272 controls were excluded, leaving 1,516 (84.8%) controls eligible for analysis. The parameters of control group were obtained from the first assessment results at the time of hospitalization of corresponding age-groups. Ultimately, 2,112 adults omprising cases and controls were analyzed (Supplementary Material Figure S1). All participants provided informed consent.
Each participant had a standardized assessment done after admission, covering anthropometric and clinical parameters: age, sex, height, weight, body mass index (BMI), heart rate (HR), systolic BP (SBP), diastolic BP (DBP), pulse pressure (PP), smoking and alcohol consumption, duration of diabetes, and use of antidiabetic agents (hypoglycemic agents and insulin use). BMI was calculated using weight over height (kg/m2). BP was estimated three times and the mean recorded. PP was measured as SBP minus DBP. Smokers were defined as self-reported history of or current smoking, regardless of frequency, and the definition of drinkers was similar to smokers. Fasting (≥ 8 hours) venous blood parameters comprised glycated hemoglobin (HbA1c), fasting plasma glucose (FPG), TC, TGs, high density–lipoprotein cholesterol (HDL-C), low density–lipoprotein cholesterol (LDL-C), and insulin levels. The TyG index was calculated using Ln (fasting glucose [mg/dL] × fasting TG levels (mg/dL ÷ 2).10 IIR was calculated based on homoeostasis-model assessment (HOMA): (fasting plasma insulin [mU/L] × FPG (mmol/L] ÷ 22.5).16 All laboratory outcomes were measured at the Endocrinology Laboratory of China Medical University.
Exposure and Testing
Two-field fundus photographs centered on the optic disk and fovea were taken by trained photographers, using a nonmydriatic fundus camera (TRC-NW 200; Topcon, Tokyo, Japan). The presence of DR was assessed blindly by ophthalmologists at the Department of Ophthalmology, First Affiliated Hospital of China Medical University following Early Treatment for Diabetic Retinopathy Study (ETDRS) criteria.17 DR was diagnosed as existentd if characteristic lesions were present: cotton-wool spots, hard exudates, intraretinal microvascular abnormalities, microaneurysms, venous bleeding, hemorrhages, or new vessels. Data from the worse eye were assessed. Retinopathy was classified according to the modified Airlie House classification system.18 DR severity was classed as absent, mild nonproliferative DR (NPDR), moderate NPDR, severe NPDR, and proliferative DR (PDR). Vision-threatening DR (VTDR) was defined as the presence of severe NPDR, PDR, or clinically significant macular edema.
Statistical Analysis
Analysis was performed using SPSS 23.0. Data are given as means ± SD (continuous variables) or percentages (categorical variables), unless otherwise indicated. For continuous variables, one-way ANOVA or Jonckheere–Terpstra tests were performed for normally distributed variables with homogeneous or heterogeneous variance, while Kruskal–Wallis H tests used for abnormal distribution. For categorical variables, comparisons were made using χ2 and Fisher’s exact tests. Quartiles were defined as the 25th, 50the, and 75th percentiles of the TyG index and treated as categorized variables (quartile 1 [Q1] ≤8.85; quartile 2 [Q2] 8.86–9.33, quartile 3 [Q3] 9.34–9.92, quartile 4 [Q4] >9.92), with the lowest tertile being the reference tertile. Logistic regression models (model 1 adjusted for age and sex, model 2 adjusted for age, sex, duration of diabetes, use of antidiabetic agents, HR, SBP, PP, height, weight, BMI, and HbA1c, model 3 adjusted for all aforementioned confounders and TC) were used to assess correlations between DR-severity strata and the TyG index individually. A receiver-operating characteristic (ROC) curve was used to estimate the predictive value of the TyG index and related anthropometric indices, as well as calculate optimal cutoff points. Theese cutoff points were determined by the Youden index. Linear regression was conducted to reveal associations between the TyG index and DR-related variables in models 2 and 3. Mediation analysis was implemented to estimate the direct correlation between DR and the TyG index and their indirect linkage through possible mediating index. Mediation analysis was performed using linear regression. Proportion of mediation by intermediate variable was defined as ratio of indirect effect to total effect. P<0.05 was considered statistically significant.
Results
Characteristics of all individuals are shown in Table 1. Among confirmed cases, 446 (74.8%) were classified as mild NPDR, 87 (14.6%) moderate NPDR, and 63 (10.6%) VTDR. Age, duration of diabetes, use of antidiabetic agents, HR, SBP, PP, height, weight, BMI, HbA1c, FPG, TGs, HOMA-IR levels, and TyG-index levels were correlated with DR severity. TyG-index levels for participants with non-DR, mild NPDR, moderate NPDR, and VTDR were 9.44±0.83, 9.39±0.78, 9.28±0.73, and 9.08±0.54, respectively. TyG-index values were lower in DR subjects compared with non-DR subjects (9.34±0.76 vs 9.44±0.83, P=0.015), and showed significant association with DR-severity strata among all observed biochemical parameters (P=0.005). In Supplementary Material Table S1, clinical characteristics are compared among quartiles of the TyG index. All eight blood biochemical parameters (HbA1c, FPG, TC, TGs, HDL, LDL, insulin, and HOMA-IR) were related to quartiles significantly (all P<0.001). DR severity increased with descending TyG-index quartiles (P=0.007).
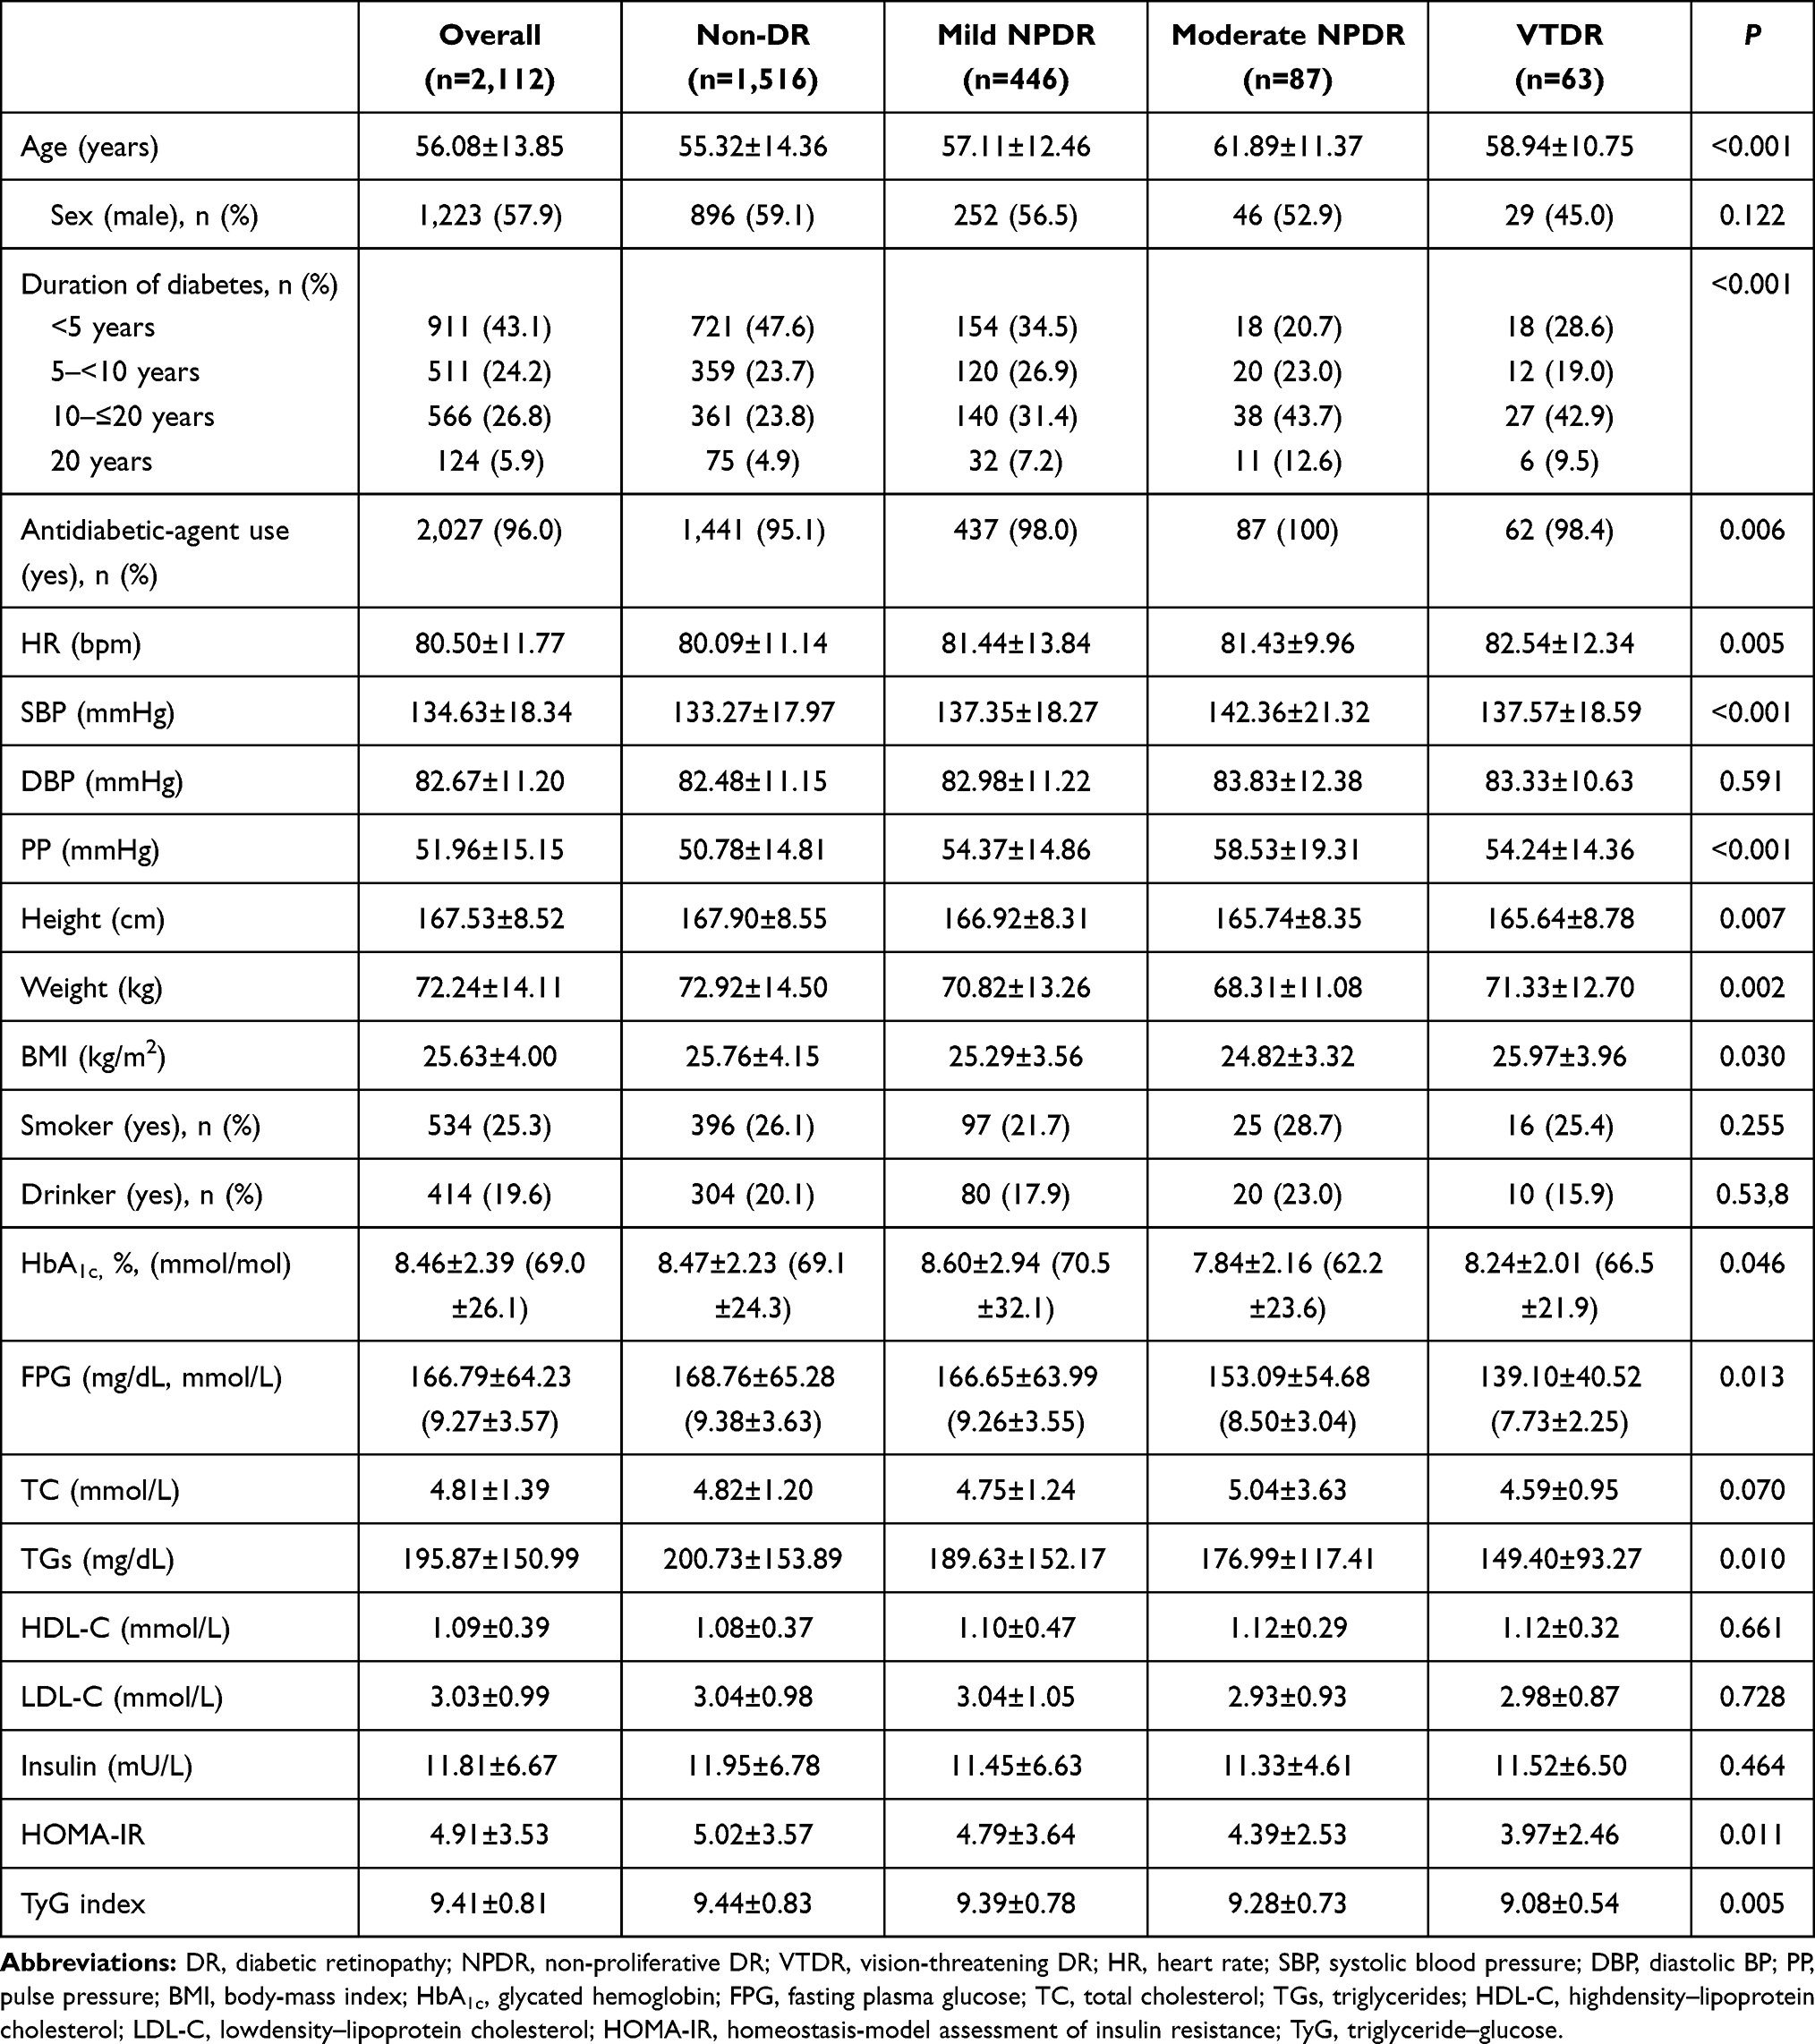 |
Table 1 Characteristics of study participants by presence and severity of DR |
Table 2 shows the relationship between the TyG index and presence of DR by the logistic regression models. In model 1, the relationship between the TyG index and presence of DR was significant (OR 0.85, 95% CI 0.76–0.96, P=0.009). The relationship between the TyG index and VTDR was also significant (OR 0.54, 95% CI 0.38–0.76; P<0.001), but not significant for mild NPDR or moderate NPDR. After further adjustment for confounders factors in model 3 — duration of diabetes, use of antidiabetic agents, HR, SBP, PP, height, weight, BMI, HbA1c, and TC — the TyG index was still significantly correlated with VTDR (OR 0.53, 95% CI 0.36–0.79; P=0.001) and any-severity DR (OR 0.83, 95% CI 0.72–0.95; P=0.007).
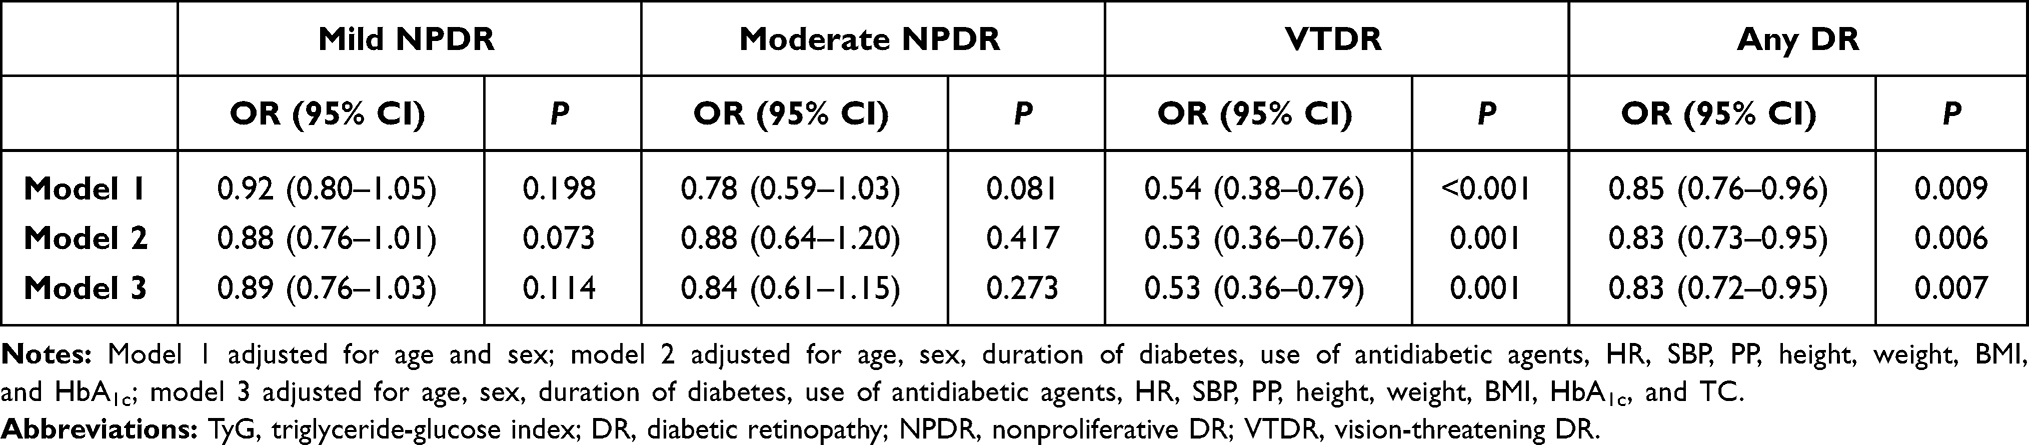 |
Table 2 Associations between TyG index and various stages of DR after controlling for confounding factors |
Associations between TyG-index quartiles and DR severity are shown in Table 3. After adjustment for age, sex, duration of diabetes, use of antidiabetic agents, HR, SBP, PP, height, weight, BMI, HbA1c, and TC, ORs for any-severity DR and VTDR associated with the highest quartile of the TyG index were 0.66 (95% CI 0.48–0.89) and 0.14 (95% CI 0.04–0.48), respectively. There were also dose–response relationships for any-severity DR (Ptrend=0.006) and VTDR (Ptrend=0.002).
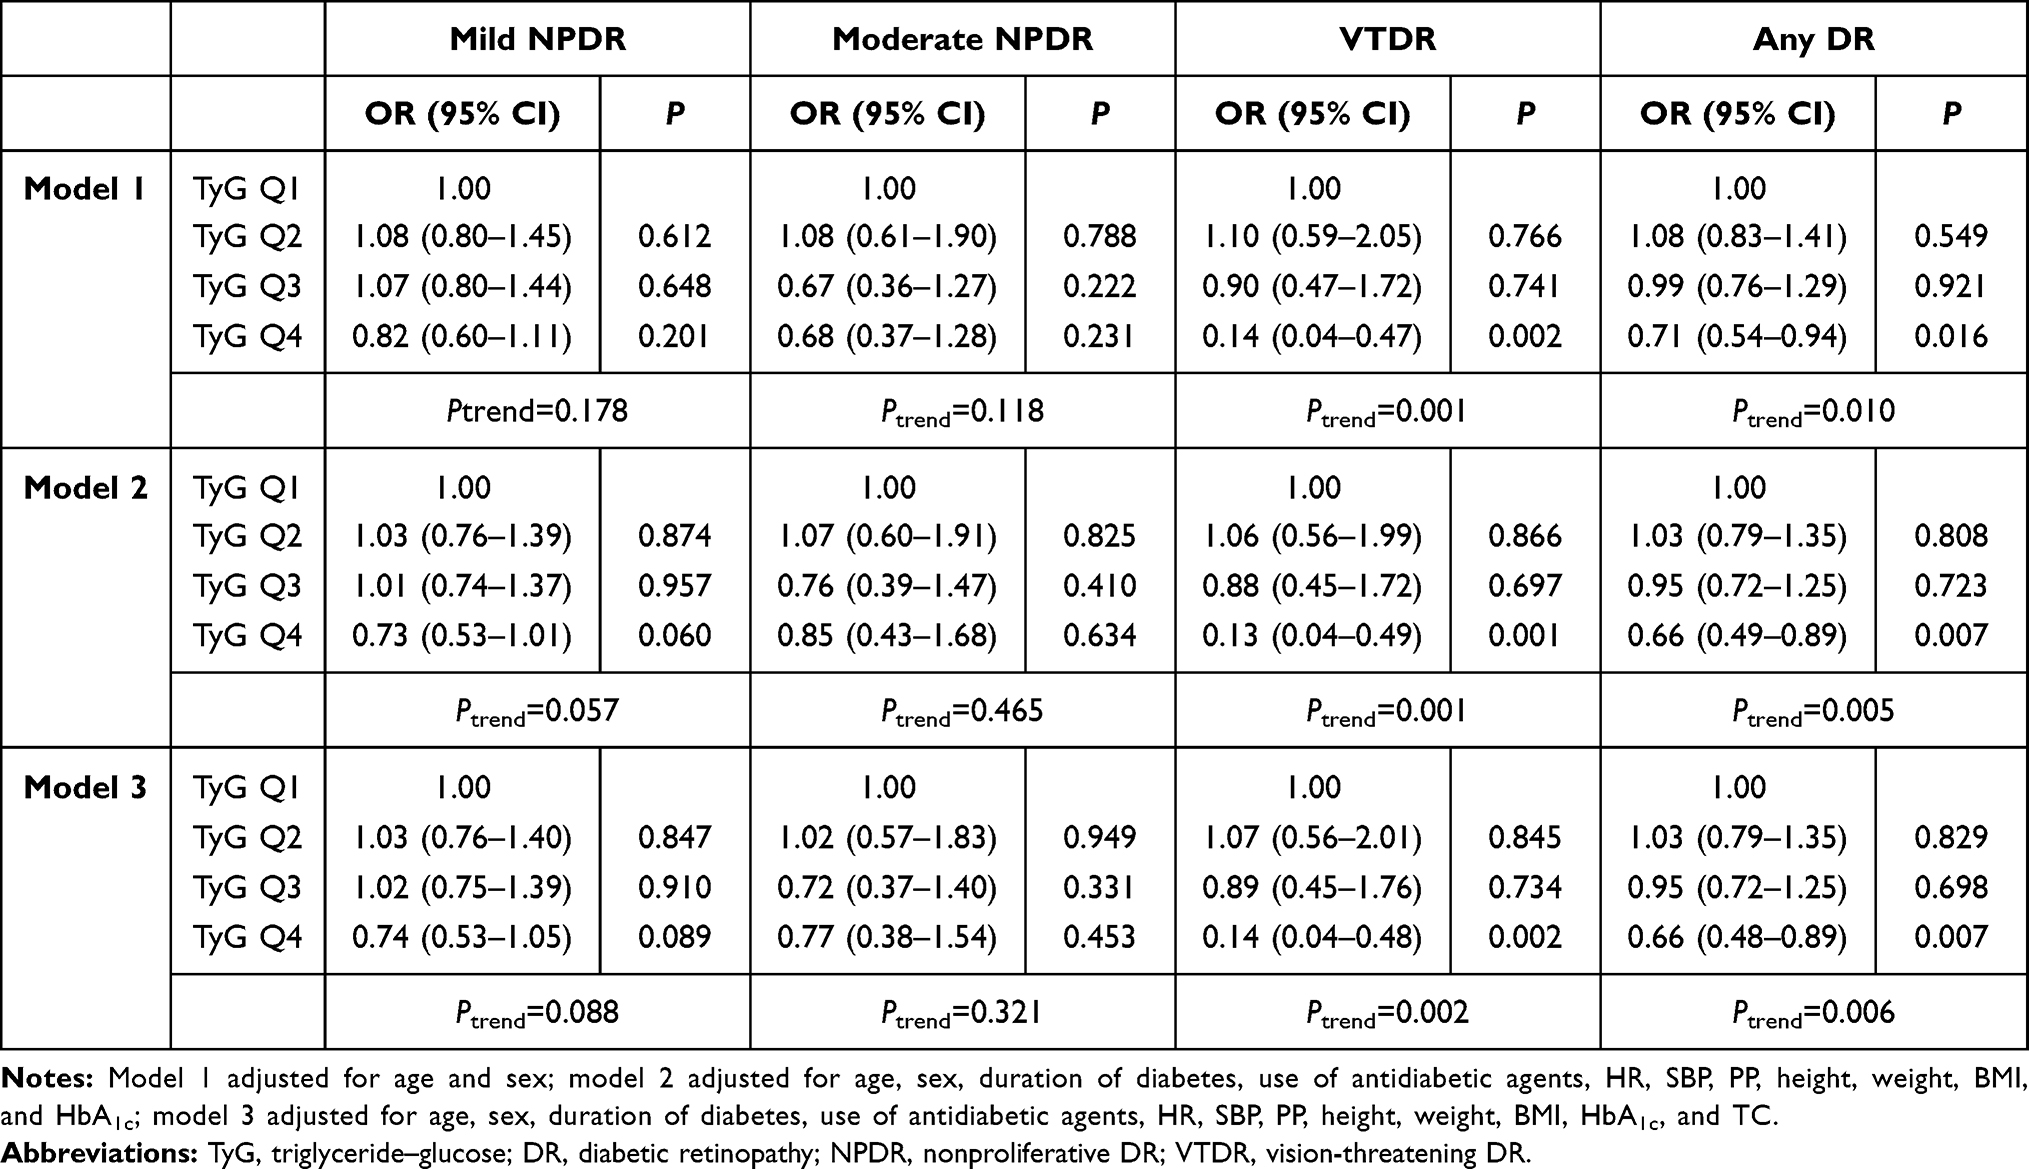 |
Table 3 Associations between quartiles of TyG index and various stages of DR after controlling for confounding factors |
Predictive values of the TyG index and other parameters in the presence of any-severity DR and VTDR are shown in Table 4 and Supplementary Material Figure S2. According to ROC-curve analysis, FPG, TGs, HOMA-IR, levels, and the TyG index were significantly associated with DR severity (all P<0.05). The TyG index showed significant discriminatory ability in any-severity DR (area under curve [AUC] 0.534, P=0.015) and VTDR (AUC 0.624, P=0.001), respectively. Optimal cut-off points estimated withthe Youden index for any-severity DR and VTDR according to the TyG index were 9.67 and 9.77, respectively.
 |
Table 4 Prediction of DR and VTDR by TyG index and four biochemical blood parameters |
Table 5shows the mediation analysis between DR, HOMA-IR, and the TyG index through linear regression. The framework of the mediation analysis is shown in Supplementary Material Figure S3. Model 1 adjusted by age, gender, duration of diabetes, use of antidiabetic agents, HR, SBP, PP, height, weight, BMI, and HbA1c. HOMA-IR was considering a mediator, and the direct-effect coefficient between DR and the TyG index was –0.037 (P=0.042). Indirect-effect coefficients of DR with HOMA-IR and HOMA-IR withthe TyG index were –0.043 (P=0.045) and 0.466 (P<0.001), respectively. The proportion of mediation was 35.1%. Outcomes in model 2 were similar.
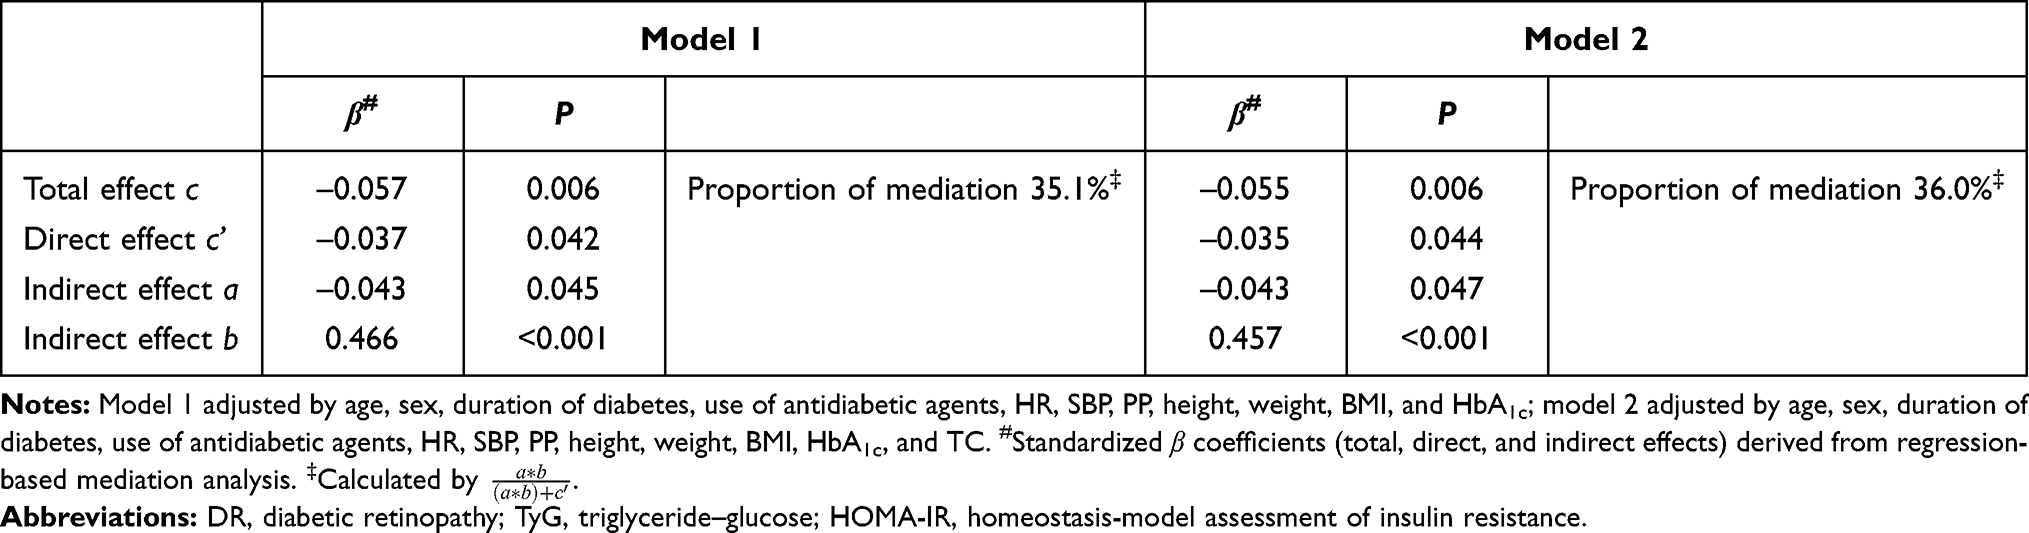 |
Table 5 Direct and indirect effects of DR on TyG index with HOMA-IR |
Supplementary Material Table S2 shows the correlations between the TyG index and biochemical factors regarding DR. Univariate linear regression showed that duration of diabetes, SBP, weight, HbA1c, FPG, TC and TGs had positive correlations with the TyG index. Conversely, the TyG index was inversely associated with age, sex, antidiabetic-agent use, PP, height, and BMI. On stepwise linear regression, only FPG, TC, and TGs showed significantly positive associations (all P<0.001). Associations of FPG and TGs with the TyG index on standardized partial regression analyses are shown in Supplementary Material Figure S4. Supplementary Material Table S3 summarizes further associations on stratified analysis for FPG, TC, TGs, and HOMA-IR. Although low TyG-index values were related to higher risk of DR in all strata, the inverse association between the TyG index and risk of any-severity DR was more pronounced in participants with high levels of FPG (Ptrend=0.029) and TC (Ptrend=0.006). In addition, multiplicative interactions between the TyG index and FPG (P=0.010), TGs (P=0.018), and HOMA-IR (P=0.027) for any-severity DR was detected.
Discussion
In this large-scale, hospital-based, nested case–control study, we assessed TyG-index levels in Chinese adults with type 2 diabetes, and a significant dose–response relationship was identified between the TyG index and the risk of DR. When stratified by disease severity, the TyG index had a significant association with VTDR, but not mild NPDR or moderate NPDR. In addition, there were significant multiplicative interactions between the TyG index and FPG, TGs, and HOMA-IR on any-severity DR, which may explain the association between decreased TyG index and presence of DR in Chinese adults with type 2 diabetes. Compared with other biochemical blood parameters, such as FPG and TGs, the TyG index had a predictive value regarding the management of DR and VTDR in patients with type 2 diabetes. TyG-index cutoff points for indicating the danger of DR and VTDR were 9.67 and 9.77, respectively. Mediation analysis was conducted between both DR and HOMA-IR and the TyG index, and we found that HOMA-IR had significant mediating effects in the correlation between DR and the TyG index.
Generally, DR symptoms affect about 35% of diabetic patients, and their individual lifetime morbidity risk is 50%–60%, gradually resulting in visual deterioration and vision loss.1,4 This indicates the potential for expenditure savings with early retinal screening programs. Although HbA1c level is considered an evaluation standard for diabetes management, diabetes is also a heterogeneous syndrome featuring anomalous glucose and lipid metabolism.1–3
Previous studies have considered that the TyG index was predictive of the development of cardiovascular events and nonalcoholic fatty-liver disease19,20 and related to IR.10,11 In contrast to our findings, a retrospective cross-sectional study proposed that the TyG index was not associated with DR.14 These inconsistent results may be due to differences in participant characteristics and study design. Notably, such findings should be interpreted with cautiou, due to unadjusted variables, such as duration of diabetes, IR, or DR severity. In our study, the nested case–control design enabled us to select all DR cases with matched control subjects to avoid the selection bias. We adjusted for all potential confounders. According to our findings, it is reasonable to speculate that variations in the TyG index may be relevant for HOMA-IR level–induced DR. It is known that IR is associated with type 2 diabetes and lipids,12,13,21 which is one of the causes of microangiopathy and macroangiopathy in type 2 diabetes. Moreover, as a mediator of the effect between DR and the TyG index, HOMA-IR has also been proved to be associated with cardiovascular risk.22 Patients with DR have two to four times the risk of developing cardiovascular events as those without DR.23 PStudies have revealed that IR is correlated with severe DR in type 1 diabetes, especially in PDR.24,25 HOMA-IR is calculated based on FPG and insulin,16 mainly reflecting the state of glucose metabolism, while the TyG index is calculated on the basis of FPG and TGs,10 representing the joint effects of glucose and lipids.
Several studies have suggested that the TyG index should be considered a candidate parameter for classifying metabolic status,10,26 with its fluctuations over time altering the prevalence and danger of diabetes.27 Type 2 diabetes commonly coexists with dyslipidemia, known for being an endothelial aggressors.28 Lipid-induced atherosclerosis is one of the dominant pathological factors of DR.29 Dysglycemia expedites oxidative stress, endothelial dysfunction, and inflammatory reactions,30–32 which are associated with progression of microangiopathic complications. The combination of glucotoxicity and lipotoxicity stimulates reactive oxygen–species production in mitochondria, and brings further exacerbation of endothelial dysfunction.33 In the eye, microcirculation changes caused by capillary damage are related to retinal hypoxia and metabolic abnormalities,34 also promoting vision loss through inflammation, macular edema, and capillary proliferation.3 Risk factors related to metabolic diseases, including dysglycemia and dyslipidemia, are considered to lead to the presence of DR.35
The strengths of this study include the fact that cases and controls were matched in the same registry data set by important confounders, including age and sex, large samples of comprehensive variables ensured the authenticity and reliability of the findings, and associations between the TyG index and DR were adjusted for multiple factors to minimize the effects of these confounders and verify the stability of outcomes. However, several limitations should be taken into account. First, two-field fundus photography was used to assess the presence of DR, which might have affected evaluation of DR severity, especially where pathological lesions were located in the peripheral areas, or mild NPDR. Recommended by the ETDRS, highly sensitive seven-field fundus photographs play a valuable role in providing a more accurate assessment of DR. Second, participants with chronic kidney disease were excluded, and thus potential confounders, such as urinary microalbumin and serum creatinine, were not adjusted for. Third, all participants in this study were Chinese type 2 diabetes inpatients. Based on characteristic features, the findings may not be applicable to other ethnic and nonhospitalized patients.
Conclusion
The TyG index was strongly associated with the presence of DR, especially VTDR. More importantly, the evidence demonstrated that the TyG index was an affordable and easily utilized laboratory parameter in clinical practice and could be expected to become a potential indicator for early warning of DR and VTDR in patients with type 2 diabetes. Further research is warranted to explore the pathological role of the TyG index and test its application value in the onset and development of DR so as to improve the prognosis of these patients and prevent the progression of DR.
Abbreviations
AUC, area under curve; BMI, body-mass index; DBP, diastolic blood pressure; DR, diabetic retinopathy; ETDRS, Early Treatment for Diabetic Retinopathy Study; FPG, fasting plasma glucose; HbA1c, glycated hemoglobin; HDL-C, high density–lipoprotein cholesterol; HOMA-IR, homeostasis-model assessment of insulin resistance; HR, heart rate; IRB, institutional review board; LDL-C, low density–lipoprotein cholesterol; NPDR, nonproliferative DR; PDR, proliferative DR; PP, pulse pressure; ROC, receiver-operating characteristic; ROS, reactive oxygen species; SBP, systolic BP; TC, total cholesterol; TGs, triglycerides; TyG, triglyceride–glucose; VEGF, vascular endothelial growth factor; VTDR, vision-threatening DR.
Data Sharing Statement
All data sets used and/or analyzed during the current study are available from the corresponding author on reasonable request. Please email [email protected].
Ethics Approval and Informed Consent
All this research adhered to the tenets of the Declaration of Helsinki, and was confirmed by the IRB of the First Affiliated Hospital of China Medical University (AF-SOP-07-1.1-01/2019-13).
Acknowledgments
Thanks to Shenyang Young and the Middle-Aged Science and Technology Innovation Talent Support Program (RC190146) and other investigators in the Department of Endocrinology and Metabolism, First Hospital of China Medical University.
Funding
This research was supported by the National Natural Science Foundation of China (81300783), China Postdoctoral Science Foundation (2019TQ0358, 2019M661162), LiaoNing Revitalization Talents Program (XLYC1807082), and General Research Project of Liaoning Provincial Department of Education (LQNK201707). Sponsors/funding organizations had no role in the design or conduct of this study.
Disclosure
The authors declare no competing interests.
References
1. Wong TY, Cheung CM, Larsen M, Sharma S, Simó R. Diabetic retinopathy. Nat Rev Dis Primers. 2016;2(1):16012. doi:10.1038/nrdp.2016.12
2. Gerstein HC, Werstuck GH. Dysglycaemia, vasculopenia, and the chronic consequences of diabetes. Lancet Diabetes Endocrinol. 2013;1(1):71–78. doi:10.1016/s2213-8587(13)70025-1
3. Antonetti DA, Klein R, Gardner TW. Diabetic retinopathy. N Engl J Med. 2012;366(13):1227–1239. doi:10.1056/NEJMra1005073
4. Yau JW, Rogers SL, Kawasaki R, et al. Global prevalence and major risk factors of diabetic retinopathy. Diabetes Care. 2012;35(3):556–564. doi:10.2337/dc11-1909
5. Zhang G, Chen H, Chen W, Zhang M. Prevalence and risk factors for diabetic retinopathy in China: a multi-hospital-based cross-sectional study. Br J Ophthalmol. 2017;101(12):1591–1595. doi:10.1136/bjophthalmol-2017-310316
6. Liu Y, Yang J, Tao L, et al. Risk factors of diabetic retinopathy and sight-threatening diabetic retinopathy: a cross-sectional study of 13 473 patients with type 2 diabetes mellitus in mainland China. BMJ Open. 2017;7(9):e016280. doi:10.1136/bmjopen-2017-016280
7. Skrha J, Soupal J, Skrha J
8. Wong TY, Cheung N, Tay WT, et al. Prevalence and risk factors for diabetic retinopathy: the Singapore Malay Eye Study. Ophthalmology. 2008;115(11):1869–1875. doi:10.1016/j.ophtha.2008.05.014
9. Yang JY, Kim NK, Lee YJ, et al. Prevalence and factors associated with diabetic retinopathy in a Korean adult population: the 2008–2009 Korea National Health and Nutrition Examination Survey. Diabetes Res Clin Pract. 2013;102(3):218–224. doi:10.1016/j.diabres.2013.10.016
10. Simental-Mendía LE, Rodríguez-Morán M, Guerrero-Romero F. The product of fasting glucose and triglycerides as surrogate for identifying insulin resistance in apparently healthy subjects. Metab Syndr Relat Disord. 2008;6(4):299–304. doi:10.1089/met.2008.0034
11. Du T, Yuan G, Zhang M, Zhou X, Sun X, Yu X. Clinical usefulness of lipid ratios, visceral adiposity indicators, and the triglycerides and glucose index as risk markers of insulin resistance. Cardiovasc Diabetol. 2014;13(1):146. doi:10.1186/s12933-014-0146-3
12. Reaven GM. Pathophysiology of insulin resistance in human disease. Physiol Rev. 1995;75(3):473–486. doi:10.1152/physrev.1995.75.3.473
13. Barrett EJ, Liu Z, Khamaisi M, et al. Diabetic microvascular disease: an Endocrine Society Scientific Statement. J Clin Endocrinol Metab. 2017;102(12):4343–4410. doi:10.1210/jc.2017-01922
14. Chiu H, Tsai H-J, Huang J-C, et al. Associations between triglyceride-glucose index and micro- and macro-angiopathies in type 2 diabetes mellitus. Nutrients. 2020;12(2):328. doi:10.3390/nu12020328
15. American Diabetes A. (2) Classification and diagnosis of diabetes. Diabetes Care. 2015;38(Supplement_1):S8–S16. doi:10.2337/dc15-S005
16. Matthews DR, Hosker JP, Rudenski AS, Naylor BA, Treacher DF, Turner RC. Homeostasis model assessment: insulin resistance and beta-cell function from fasting plasma glucose and insulin concentrations in man. Diabetologia. 1985;28(7):412–419. doi:10.1007/BF00280883
17. Early Treatment Diabetic Retinopathy Study Research Group. Grading diabetic retinopathy from stereoscopic color fundus photographs–an extension of the modified Airlie House classification. ETDRS report number 10. Ophthalmology. 1991;98(5Suppl):786–806. doi:10.1016/S0161-6420(13)38012-9
18. Wilkinson CP, Ferris FL, Klein RE, et al. Proposed international clinical diabetic retinopathy and diabetic macular edema disease severity scales. Ophthalmology. 2003;110(9):1677–1682. doi:10.1016/s0161-6420(03)00475-5
19. Kitae A, Hashimoto Y, Hamaguchi M, Obora A, Kojima T, Fukui M. The triglyceride and glucose index is a predictor of incident nonalcoholic fatty liver disease: a Population-Based Cohort Study. Can J Gastroenterol Hepatol. 2019;2019:5121574. doi:10.1155/2019/5121574
20. Sánchez-íñigo L, Navarro-González D, Fernández-Montero A, Pastrana-Delgado J, Martínez JA. The TyG index may predict the development of cardiovascular events. Eur J Clin Invest. 2016;46(2):189–197. doi:10.1111/eci.12583
21. Meikle PJ, Summers SA. Sphingolipids and phospholipids in insulin resistance and related metabolic disorders. Nat Rev Endocrinol. 2017;13(2):79–91. doi:10.1038/nrendo.2016.169
22. Voruganti VS, Lopez-Alvarenga JC, Nath SD, et al. Genetics of variation in HOMA-IR and cardiovascular risk factors in Mexican-Americans. J Mol Med (Berl). 2008;86(3):303–311. doi:10.1007/s00109-007-0273-3
23. Gerstein HC, Ambrosius WT, Danis R, et al. Diabetic retinopathy, its progression, and incident cardiovascular events in the ACCORD trial. Diabetes Care. 2013;36(5):1266–1271. doi:10.2337/dc12-1311
24. Rowe CW, Haider AS, Viswanathan D, et al. Insulin resistance correlates with maculopathy and severity of retinopathy in young adults with type 1 diabetes mellitus. Diabetes Res Clin Pract. 2017;131:154–160. doi:10.1016/j.diabres.2017.06.022
25. Duţă I, Fica S, Ion DA. The association between insulin resistance and proliferative retinopathy in type 1 diabetes. Rom J Intern Med. 2015;53(3):261–266. doi:10.1515/rjim-2015-0034
26. Lee SH, Han K, Yang HK, et al. Identifying subgroups of obesity using the product of triglycerides and glucose: the Korea National Health and Nutrition Examination Survey, 2008–2010. Clin Endocrinol (Oxf). 2015;82(2):213–220. doi:10.1111/cen.12502
27. Lee SH, Yang HK, Ha HS, et al. Changes in metabolic health status over time and risk of developing type 2 diabetes: a Prospective Cohort Study. Medicine (Baltimore). 2015;94(40):e1705. doi:10.1097/md.0000000000001705
28. da Silva A, Caldas APS, Hermsdorff HHM, et al. Triglyceride-glucose index is associated with symptomatic coronary artery disease in patients in secondary care. Cardiovasc Diabetol. 2019;18(1):89. doi:10.1186/s12933-019-0893-2
29. Klein R, Sharrett AR, Klein BE, et al. The association of atherosclerosis, vascular risk factors, and retinopathy in adults with diabetes: the atherosclerosis risk in communities study. Ophthalmology. 2002;109(7):1225–1234. doi:10.1016/s0161-6420(02)01074-6
30. Ceriello A, Novials A, Ortega E, et al. Hyperglycemia following recovery from hypoglycemia worsens endothelial damage and thrombosis activation in type 1 diabetes and in healthy controls. Nutr Metab Cardiovasc Dis. 2014;24(2):116–123. doi:10.1016/j.numecd.2013.05.003
31. Ceriello A, Novials A, Ortega E, et al. Vitamin C further improves the protective effect of glucagon-like peptide-1 on acute hypoglycemia-induced oxidative stress, inflammation, and endothelial dysfunction in type 1 diabetes. Diabetes Care. 2013;36(12):4104–4108. doi:10.2337/dc13-0750
32. Yousefzade G, Nakhaee A. Insulin-induced hypoglycemia and stress oxidative state in healthy people. Acta Diabetol. 2012;49(Suppl 1):S81–S85. doi:10.1007/s00592-011-0311-z
33. Kumar B, Kowluru A, Kowluru RA. Lipotoxicity augments glucotoxicity-induced mitochondrial damage in the development of diabetic retinopathy. Invest Ophthalmol Vis Sci. 2015;56(5):2985–2992. doi:10.1167/iovs.15-16466
34. Grauslund J, Green A, Kawasaki R, Hodgson L, Sjølie AK, Wong TY. Retinal vascular fractals and microvascular and macrovascular complications in type 1 diabetes. Ophthalmology. 2010;117(7):1400–1405. doi:10.1016/j.ophtha.2009.10.047
35. Chua J, Lim CXY, Wong TY, Sabanayagam C. Diabetic retinopathy in the Asia-Pacific. Asia Pac J Ophthalmol (Phila). 2018;7(1):3–16. doi:10.22608/apo.2017511
 © 2021 The Author(s). This work is published and licensed by Dove Medical Press Limited. The
full terms of this license are available at https://www.dovepress.com/terms
and incorporate the Creative Commons Attribution
- Non Commercial (unported, 3.0) License.
By accessing the work you hereby accept the Terms. Non-commercial uses of the work are permitted
without any further permission from Dove Medical Press Limited, provided the work is properly
attributed. For permission for commercial use of this work, please see paragraphs 4.2 and 5 of our Terms.
© 2021 The Author(s). This work is published and licensed by Dove Medical Press Limited. The
full terms of this license are available at https://www.dovepress.com/terms
and incorporate the Creative Commons Attribution
- Non Commercial (unported, 3.0) License.
By accessing the work you hereby accept the Terms. Non-commercial uses of the work are permitted
without any further permission from Dove Medical Press Limited, provided the work is properly
attributed. For permission for commercial use of this work, please see paragraphs 4.2 and 5 of our Terms.