")
Back to Journals » Drug Design, Development and Therapy » Volume 17
The Therapeutic Mechanism of Schisandrol A and Its Metabolites on Pulmonary Fibrosis Based on Plasma Metabonomics and Network Analysis
Authors Qiaolongbatu X , Zhao W, Huang X, Qian F, Yang X, Wu J, Ma C, Qu H , Wang L, Fan G, Wu Z
Received 20 October 2022
Accepted for publication 25 January 2023
Published 15 February 2023 Volume 2023:17 Pages 477—496
DOI https://doi.org/10.2147/DDDT.S391503
Checked for plagiarism Yes
Review by Single anonymous peer review
Peer reviewer comments 2
Editor who approved publication: Professor Manfred Ogris
Xijier Qiaolongbatu,1,* Wenjuan Zhao,1,* Xucong Huang,2,3,* Feng Qian,1 Xinyi Yang,1 Jiaqi Wu,2 Cui Ma,2 Han Qu,1,2 Li Wang,3 Guorong Fan,2 Zhenghua Wu2
1Engineering Research Center of Cell & Therapeutic Antibody, Ministry of Education, Pharm-X Center, School of Pharmacy, Shanghai Jiao Tong University, Shanghai, People’s Republic of China; 2Department of Clinical Pharmacy, Shanghai General Hospital, Shanghai Jiaotong University School of Medicine, Shanghai, People’s Republic of China; 3School of Pharmacy, Chongqing Medical University, Chongqing, People’s Republic of China
*These authors contributed equally to this work
Correspondence: Zhenghua Wu; Guorong Fan, Department of Clinical Pharmacy, Shanghai General Hospital, School of Medicine, Shanghai Jiaotong University, No. 85 Wujin Road, Shanghai, 200080, People’s Republic of China, Tel +86-133-0177-7863 ; +86-21-36123711, Email [email protected]; [email protected]
Background: Schisandrol A (Sch A) is the main active ingredient of Schisandra chinensis (Turcz.) Baill. Our previous study showed that Sch A has anti-pulmonary fibrosis (PF) activity, but its metabolic-related mechanisms of action are not clear.
Methods: Here, we explored the therapeutic mechanisms of Sch A on PF by ultra-high performance liquid chromatography coupled with tandem mass spectrometry (UPLC-MS/MS) metabolomics approach and network analysis. The metabolites of Sch A in mice (bleomycin + Sch A high-dose group) plasma were identified based on ultra-high performance liquid chromatography-quadrupole time-of-flight mass spectrometry (UPLC-Q-TOF/MS).
Results: 32 metabolites were detected reversed to normal level after treating bleomycin (BLM)-induced PF mice with Sch A. The 32 biomarkers were enriched in energy metabolism and several amino acid metabolisms, which was the first report on the therapeutic effects of Sch A on PF through rescuing the disordered energy metabolism. The UPLC-Q-TOF/MS analysis identified 17 possible metabolites (including isomers) of Sch A in mice plasma. Network analysis revealed that Sch A and 17 metabolites were related to 269 genes, and 1109 disease genes were related to PF. The construction of the Sch A/metabolites-target-PF network identified a total of 79 intersection genes and the TGF-β signaling pathway was determined to be the main signaling pathway related to the treatment of PF by Sch A. The integrated approach involving metabolomics and network analysis revealed that the TGF-β 1-ID3-creatine pathway, TGF-β 1-VIM-carnosine pathway were two of the possible pathways Sch A regulated to modulate metabolic disorders, especially energy metabolism, and the metabolite of Sch A M5 was identified as a most likely active metabolite.
Conclusion: The results suggested the feasibility of combining metabolomics and network analysis to reflect the effects of Sch A on the biological network and the metabolic state of PF and to evaluate the drug efficacy of Sch A and its related mechanisms.
Keywords: schisandrol A, pulmonary fibrosis, mechanism of action, network analysis, metabonomics
Graphical Abstract:
Introduction
Pulmonary fibrosis (PF) is a public health problem that seriously threatens human health. In recent years, the incidence of PF has been increasing year by year.1 Pulmonary fibrosis is primarily a continuous microinjury to the aging alveolar epithelium leading to disrupted epithelial fibroblast communication, ultimately resulting in recruitment and activation of myofibroblasts to produce a collagen-rich extracellular matrix. Excessive accumulation of this matrix can lead to irreversible collapse and loss of function of the alveoli, resulting in reduced gas exchange and dyspnea.
There are various molecules involved in the pathogenesis of pulmonary fibrosis, among which TGF- β played an important role.2 The most studied pathway is TGF- β/Smad signaling pathway.3 The effects of TGF-β/Smad signaling on pulmonary fibrosis mainly depend on the following three processes: epithelial–mesenchymal transition (EMT) and endothelial–mesenchymal transition (EndMT), myofibroblast differentiation and fibrosis.4 Dynamic regulation at the signaling and transcriptional levels is housekeeping for myofibroblast self-regulation. Transcriptional regulators include Smad, hypoxia-inducible factor-1α (HIF-1α), activating transcription factor 4 (ATF4), peroxisome proliferator activated receptor-γ (PPAR-γ) et al. Most studies about the effects of TGF-β on cellular metabolism have all focused on TGF-β/Smad independent effects of signaling. Little is known about how Smad-dependent transcription regulates cellular metabolism.
In recent years, metabolic changes associated with myofibroblast differentiation have become the focus of interest for researchers. Studies have shown that metabolic pathways abnormal in patients with pulmonary fibrosis include glycolysis, mitochondria β-oxidation, glutamate/aspartate metabolism, and the TCA cycle. One of the mechanisms of pulmonary fibrosis involves increased glycolysis, leading to glycine synthesis, which is then incorporated into collagen. Glutaminolysis also plays an important role in promoting myofibroblast differentiation.5 In addition, carnitine,6 creatine,7 and carnosine8 have been reported in recent literature to be closely associated with tissue fibrosis. These studies suggest that metabolic changes including amino acid metabolism, energy metabolism and so on are closely related to the occurrence of pulmonary fibrosis.
At present, PF cannot be cured clinically, and the existing anti-fibrosis drugs have little effect. Nintedanib and pirfenidone can only delay the progression of the disease and temporarily maintain lung function.9 In addition, these therapeutic drugs are expensive and do not change the overall progression of the disease and the high mortality within 3 to 5 years after diagnosis.10 Although lung transplantation is the only assured effective treatment for PF, the survival rate of elderly patients over 65 years old after lung transplantation is relatively low.11 Therefore, it is of great significance to develop new safe and effective drugs. According to Wang Tao’s records in Chinese Tang dynasty, fructus schisandrae decoction is often used in the treatment of idiopathic pulmonary fibrosis, etc (http://m.zhongyoo.com/fangji/wwzt_12932.html).
At present, schisandrae decoction is included in the “Chinese Prescription grand Ceremony”. Clinical practice shows that it can improve the clinical symptoms of patients with pulmonary fibrosis, improve their quality of life, prolong the survival period, and improve lung function.12 Among the prescription, schisandra (Sch) lignans play an important role,13 but its anti-fibrosis mechanism needs to be further studied. Sch lignans extract inhibits a series of fibrosis-related biological processes, including inflammation, cell proliferation, and migration.14 However, the anti-fibrosis mechanism of it and its active components need to be further studied. Recently, studies showed that schisandrin B can alleviate AngII mediated arterial vascular remodeling and fibrotic phenotypes by inhibiting EMT.15 Our previous study showed that Sch A could inhibit pulmonary fibrosis through the TGF-β signaling pathway.16 However, whether Sch A has effects on energy metabolism, amino acid metabolism, and lipid metabolism in pulmonary fibrosis and the relationship between signaling pathways and metabolic pathways warrants further exploration.
In this study, we explored the therapeutic mechanism of Sch A and its metabolites on pulmonary fibrosis based on plasma metabonomics and network analysis, so as to explore the metabolism-related mechanism of Sch A to inhibit fibrosis, proposing new strategies for the treatment of pulmonary fibrosis.
Materials and Methods
Materials
Schisandrol A (pure compound, No. J10GB151241) was purchased from Yuanye Biotech Co., Ltd. (Shanghai, China), the purity of the compounds is 98%. All of the standards of targeted metabolites were obtained from Sigma-Aldrich (St. Louis, MO, USA), Steraloids Inc. (Newport, RI, USA) and TRC Chemicals (Toronto, ON, Canada). Formic acid was optima grade and purchased from Sigma-Aldrich (St. Louis, MO, USA). Methanol (Optima LC-MS), acetonitrile (Optima LC-MS), and isopropanol (Optima LC-MS) were purchased from Thermo-Fisher Scientific (FairLawn, NJ, USA). Ultrapure water was deionized by a Milli-Q system equipped with an LC-MS Pak filter (Millipore, Billerica, MA, USA). All solutions were ultrasonically degassed before use.
Animals
C57BL/6 female mice aged 7–8 weeks were purchased from Shanghai Lingchang Biotechnology Co., Ltd (Shanghai, China). All the animals were in a climate-controlled environment (temperature of 22 ± 1°C and humidity of 45–55%) with a 12 h light/12 h dark cycle. Sterile food and water were naturally provided. All animal care and experiments were approved by the Animal Research Ethics Board of Shanghai Jiaotong University (Permission Number: A2018075), in accord with the Guide for the Care and Use of Laboratory Animals.
Preparation of Schisandrol A Solution
Schisandrol A at concentrations of 4 mg/mL and 8 mg/mL was used for intragastric administration. 8 mg/mL Sch A: dissolved 400 mg of Sch A in ethanol, and finally prepared 50 mL drug solution containing 5% ethanol and 1% CMC-Na; 4mg/mL Sch A: dissolved 200 mg of Sch A in ethanol, and finally prepared 50 mL drug solution containing 5% ethanol and 1% CMC-Na. The final dosing volume depended on the weight of the mice.
Animals Grouping and Treatments
After a week of adaptive feeding the C57BL/6 mice were randomly divided into the following five groups (n = 7 each): (1) the control group; (2) the BLM group, intratracheal instillation of BLM hydrochloride and intragastric administration of 0.9% sterilized saline; (3) BLM + Sch A low-dose group, intratracheal instillation of BLM hydrochloride and intragastric administration of 40 mg/kg schisandrol A. (4) BLM + Sch A high-dose group, intratracheal instillation of BLM hydrochloride and intragastric administration of 80 mg/kg schisandrol A; (5) positive control group, intratracheal instillation of BLM hydrochloride and intragastric administration of 50mg/kg nintedanib. Each group was administered intragastrically daily for 21 consecutive days.
Establishment of the Mice PF Model
The experiment on BLM-induced PF in mice was performed as previously reported.17 Before the surgery, all mice were ensured under anesthesia. PF was established in mice by an intratracheal instillation of BLM hydrochloride (5 mg/kg in saline). Mice in the control group received an equal volume of saline.
Sample Collection
After 21 days of the administration, the mice were sacrificed. After mice were anesthetized with 1% sodium pentobarbital (0.15 mL/100 g) via intraperitoneal injection, blood samples were collected by cardiac puncture. The blood samples were centrifuged at 6500 rpm for 10 min at 4° C, the serum samples were obtained for follow-up metabolomics studies.
HE Staining of Lung Tissues
After 48 hours of fixation in 4% paraformaldehyde, the lung samples were dehydrated, embedded in paraffin, sectioned into 5 mm with a microtome and dewaxed. The samples were then stained with H&E (Beyotime Biotechnology, Shanghai, China).
Metabolomics Analysis
Sample Preparation
Twenty microliters of serum was added to a 96-well plate. Then, the plate was transferred to the Eppendorf epMotion Workstation (Eppendorf Inc., Hamburg, Germany). One hundred and twenty microliters of methanol with partial internal standards was added to each sample, and the mixture was vortexed for 5 minutes. The plate was centrifuged at 4000g for 30 minutes. Transferred 30 μL of the supernatant to another 96-well plate, add 20 μL of derivative reagents to each well, sealed the plate, and performed derivatization at 30°C for 60 minutes. After derivatization, 330 μL of 50% methanol solution was added for dilution and the plate was stored at −20°C for 20 minutes, then centrifuged at 4000g for 30 minutes at 4°C.18 Transferred 135 µL of supernatant to a new 96-well plate containing 10 µL of internal standard per well for final LC-MS analysis.
UPLC-MS/MS Measurement
Metabonomic analysis was performed by ultra-performance liquid chromatography coupled to a tandem mass spectrometry (UPLC-MS/MS) system (ACQUITY UPLC-Xevo TQ-S, Waters Corp., Milford, MA, USA). Chromatography was performed using ACQUITY UPLC BEH C18 1.7 µM VanGuard pre-column (2.1 × 5 mm) and ACQUITY UPLC BEH C18 1.7 µM analytical column (2.1 × 100 mm). The instrument settings are briefly described below. Mobile phases: A: water with 0.1% formic acid; and B: ACN/IPA (70:30). Column temperature: 40 °C, sample manager temperature: 10°C, the gradient of the mobile phase was as follows: 0–1 min (5% B), 1–11 min (5–78% B), 11–13.5 min (78–95% B), 13.5–14 min (95–100% B), 14–16 min (100% B), 16–16.1 min (100–5% B), 16.1–18 min (5% B), flow rate: 0.40mL/min, injection volume: 5µL, capillary (Kv): 1.5 (ESI+), 2.0 (ESI-), source temperature: 150 °C, desolvation temperature: 550 °C, desolvation gas flow was set as 1000L/Hr. Quality control (QC) samples were prepared by mixing aliquots of all samples and injected periodically throughout the analytical run to ensure system robustness and data repeatability.
Data Analysis of Metabolomics
The raw data files generated by UPLC-MS/MS were processed using the TMBQ software (v1.0, Metabo-Profile, Shanghai, China) for peak integration, calibration, and quantitation. The data matrix was exported to the iMAP platform (v1.0, Metabo-Profile, Shanghai, China) for principal component analysis (PCA), orthogonal partial least squares discriminant analysis (OPLS-DA) and univariate analysis et al. Variable importance in projection (VIP) was obtained based on the OPLS-DA model. VIP score >1 and P values <0.05 were set as the criteria for identifying the differently expressed metabolites.
Analysis of Metabolites of Schisandrol A
Plasma Collection and Preparation
The blood samples (BLM + Sch A high-dose group) were centrifuged at 6500 rpm for 10 min at 4°C. Eight hundred microliters of methanol was added to 200 μL plasma, vortexed for 3 min and centrifuged at 14,000 rpm for 10 min (4°C).19 The supernatant was transferred to a new tube, then evaporated to dryness. The residue was redissolved by 50 μL 60% methanol and centrifuged at 14,000 rpm for 10 min for subsequent analysis.
UPLC-Q-TOF/MS Analysis
An Agilent 1290 Infinity UPLC system (Milford, MA, USA) equipped with an Agilent UPLC column (Poroshell 120 EC-C18 2.1 × 150 mm, 1.9 μm) was applied to the analysis. The mobile phase consisted of solvent A (0.1% formic acid aqueous solution) and solvent B (methanol), and the gradient was as follows: 0–20 min, 65–90% B; 20–22.5 min, 90–95% B; 22.5–23.5 min, 95–100% B; 23.5–25 min, 100% B, post time 1 min. The flow rate was set to 0.3 mL/min. Column temperature: 45°C. Injection volume: 5 μL. In positive ion mode, with the following conditions: scan range, 100–1000 m/z (MS) and 50–800 m/z (MS/MS); fragmentor voltage, 175 V; gas temperature, 320°C; nebulizer gas pressure, 35 psig; sheath gas temperature, 350°C; sheath gas flow, 11 L/min; and drawing gas flow, 8 L/min. Argon was used as the collision gas in MS/MS mode and the collision energy was operated at alternative voltages of 10–40 eV to obtain the fragment information of the metabolites.
Data Analysis Strategy
Post-full-scan MS and (all ion & target) MS/MS data sets were analyzed by Agilent MassHunter Qualitative Analysis (version B.10.00) using a self-built PCDL library that contained known or hypothetical chemical formula for phytochemical components (mainly lignans) and corresponding metabolites. Molecular feature extraction (MFE) and find by formula (FBF) parameters were as follows: mass error <10 ppm, absolute peak area >5000 counts, maximum number of matches 5, and chromatogram extraction window 20 ppm. The criteria for metabolites screened for further evaluation included mass error for protonated molecule being less than 5 ppm, consistent isotopic pattern, retention time plausible for the proposed structure et al. By removing metabolites with the maximum intensity in t0, removing metabolites that are only present in one experiment or one-time point sample, removing metabolites whose peak area appears to be constant across the experiment (the threshold reaction speed ratio = 3), removing metabolites that are present in the experiment but at randomly elevated concentrations (the threshold fluctuation ratio = 10), etc. method to remove false positive metabolites.
Network Analysis
UPLC-Q-TOF/MS was applied to construct a chemical information database of prototype component (Sch A) to identify the structures of its metabolites for further network analysis. The molecular files of the prototype compounds were downloaded from PubChem (https://www.ncbi.nlm.nih.gov/pccompound/), and the metabolites were drawn by ChemDraw. The 2D structural formulas of Sch A and its metabolites were imported into SwissTargetPrediction (http://www.swisstargetprediction.ch) to predict the potential gene targets of Sch A, and the targets obtained were identified as drug-related targets. The keyword “pulmonary fibrosis” was input into the OMIM database (https://omim.org) and GeneCards Database (http://www.genecards.org/) to collect the PF-related target genes. This study has received an ethics approval from Institutional Review Board for Human Research Protections of Shanghai Jiaotong University for using these two databases (permission number: B2022308I). The intersection targets of disease and drug which were identified as the core targets of Sch A in the treatment of PF were screened out with Venny2.1 (https://bioinfogp.cnb.csic.es/tools/venny/).
Integrated Analysis of Metabonomics and Network Analysis
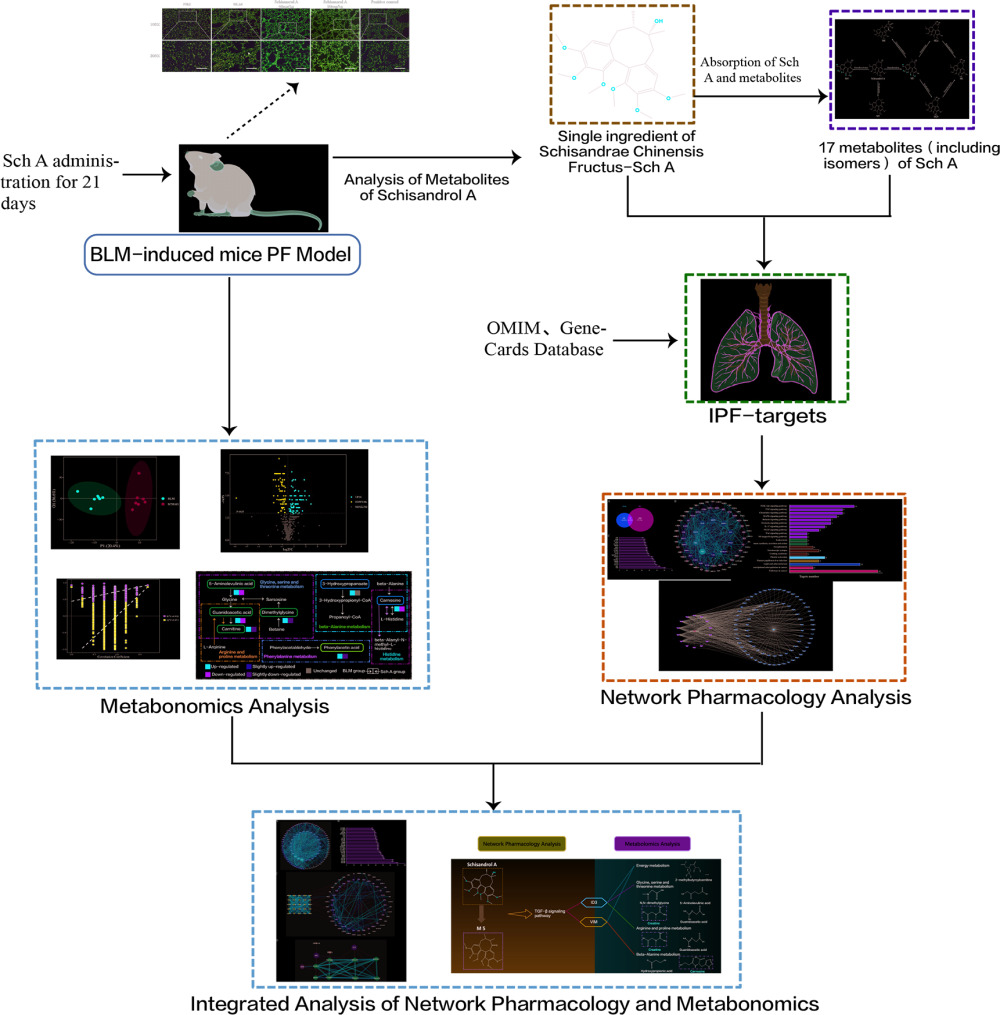
The metabolites which were reversed after the treatment of Sch A were selected as the potential biomarkers of Sch A against PF. The potential biomarkers were imported into HMDB (https://hmdb.ca) to search for the gene symbols of metabolites related enzymes and transporters, which were obtained to further explore the mechanism of Sch A treating PF. The targets related to the signaling pathway were obtained by searching the KEGG database. The String database (https://string-db.org/Version10.5) was applied to perform protein–protein interaction (PPI) analysis. The corresponding targets of potential biomarkers and core targets of signaling pathways identified by network analysis were integrated and introduced into the String database to conduct PPI analysis, “Human” was defined as the species. The information on PPI was imported into Cytoscape v3.7.2 to visualize the interaction network diagram. The overall flowchart for elucidating the mechanism of Sch A in the treatment of PF is illustrated in Graphical Abstract.
Statistical Analysis
All the data were expressed as mean ± SD. GraphPad Prism (version 8; GraphPad Software, La Jolla, CA) was used to analyze and illustrate the results.
Results
Validation of the Efficacy of Schisandrol A on PF
As collagen deposition is a typical marker of pulmonary fibrosis, we detected the effect of Sch A on BLM-induced collagen deposition in lung tissues. Figure 1 shows the results of HE staining of lung tissue. Control group mice showed collagen in normal lung tissue. Compared with the control group, the collagen deposition (pink) in the model lung tissue was significantly increased, while the collagen deposition in the Sch A-treated groups and nintedanib treatment positive control group was significantly decreased. Compared with Sch A low-dose group, the reduction in collagen deposition was more pronounced in the Sch A high-dose group. We successfully established the animal model and Sch A exhibited an anti-fibrosis effect, and thus the animal serums of Sch A high-dose group, control group and model group were used for metabolomic analysis.
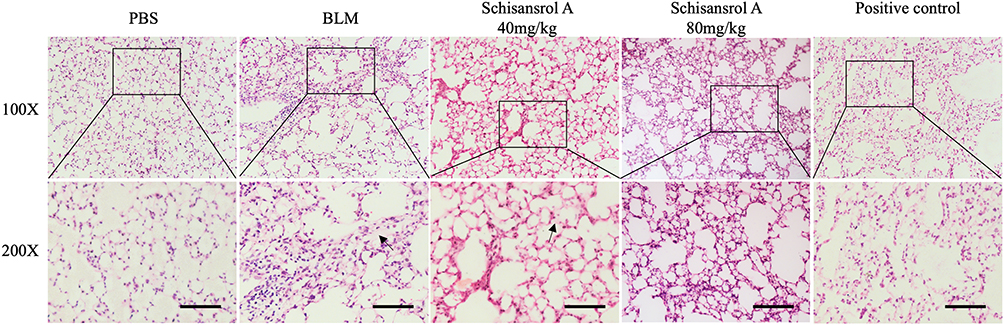 |
Figure 1 HE staining in lung tissues (deposition of collagen is pink, magnification, 100 and 200). In the lung tissue of the model group, collagen deposition(pink) was significantly increased, whereas the collagen deposition in the Sch A low-dose group was significantly reduced compared with the model group, and collagen deposition was hardly observed in the high-dose group. The Black arrow: collagen deposition. Scale bar: 50 mm. |
Serum Metabolite Profile
To get more reliable data and better achieve the goal of biomarker discovery, QC samples were applied to conduct a quality control procedure. From principal component analysis (PCA) score plots with QC samples, it shows that the QC samples are overlapping and exhibit a high degree of aggregation (Figure S1), which indicate the stability and reproducibility of data. PCA is an unsupervised method that helps to observe the characteristics of the data, and to intuitively show the distribution of the data, 3D-PCA plots were drawn to perform the degree of separation of each group (Figure S2). Since metabolomics reflects very complex biological information, sophisticated multivariate statistical modeling such as orthogonal partial least square discriminant analysis (OPLS-DA) was applied to minimize individual differences and interference from other factors. The OPLS-DA score map (Figure 2A and C) proved that the samples from the control group and the model group and the model group and the Sch A group are significantly separated from each other, and each group could be well clustered together. In order to verify the overfitting of the model, 7 rounds of cross-validation were performed, 1/7 of the sample set was eliminated in each round. Predicted each tested Y value using the model excluded from the modeling process and organized all predictions, so the resulting R2Y estimated how well the model fits the Y data. In OPLS-DA of the control group and the model group, R2Y and Q2Y values were 0.906 and 0.492 (Figure 2B), between the model group and the Sch A group R2Y and Q2Y values are 0.928 and 0.871 (Figure 2D), which suggests that the results of OPLS-DA showed a high confidence level.
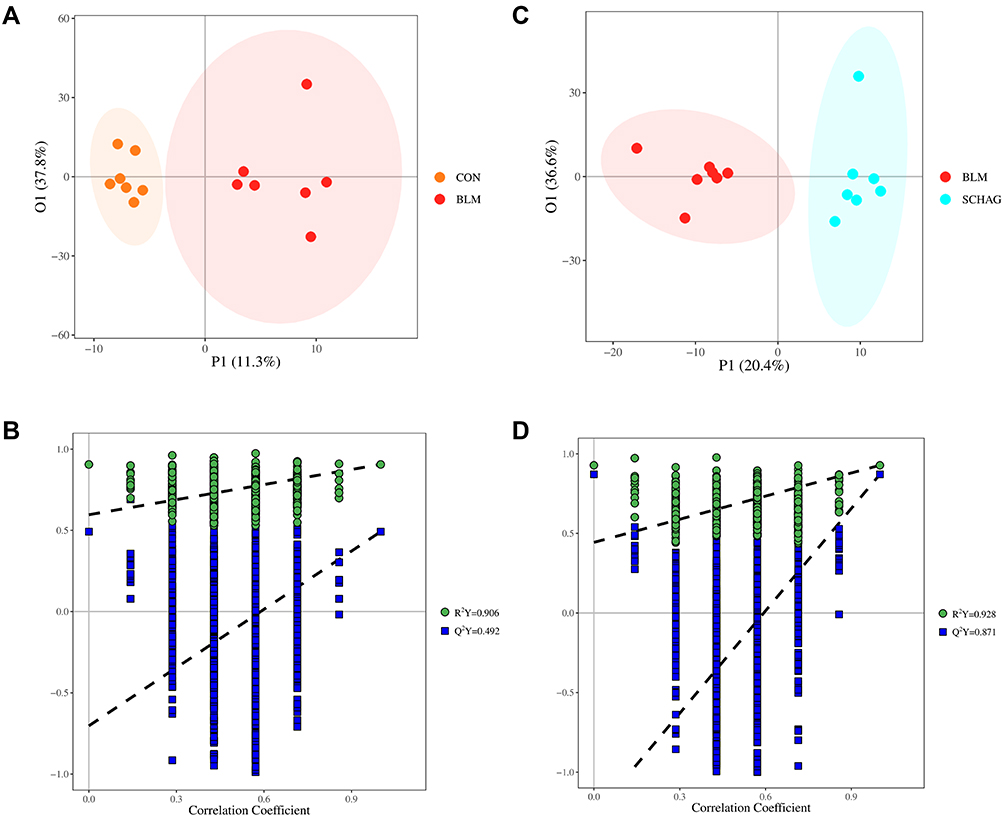 |
Figure 2 (A and B) OPLS-DA score plot and permutation score plot of serum samples from control and BLM model group; (C and D) OPLS-DA score plot and permutation score plot of serum samples from Sch A treated group and BLM model group. |
Identification of Potential Biomarkers
The VIP plots and unidimensional volcano plots were obtained based on the results of the OPLS-DA model. The VIP plots were used to screen reliable biomarkers, which comprehensively examined the contribution of metabolites to model grouping (Variable importance in projection, VIP) and the reliability of metabolites. The metabolites with the value of VIP >1 were shown in green and selected as candidates for potential biomarkers (Figure 3A and C), the higher the metabolite distributed in the VIP plots, the more significantly it contributed to the model. Uni-dimensional test was applied to avoid the situation of deviation within the group leading to an unstable multidimensional model. In uni-dimensional volcano plots, the threshold was set as: P < 0.05, |log2FC| ≥0 (FC, Fold Change). Serum metabolomics of three groups of mice showed that compared with the control group, the metabolites highlighted in the upper right corner were increased in the BLM group, and the metabolites highlighted in the upper left corner were decreased in the BLM group (Figure 3B). Compared with the BLM group, the metabolites highlighted in the upper right corner were increased in the Sch A group, and the metabolites highlighted in the upper left corner were decreased in the Sch A group (Figure 3D). Acquired the intersection of the metabolites obtained from the above multi-dimensional and uni-dimensional analysis, two categories performed a high degree of consistency which indicates the stability of the results. A total of 32 metabolites that were changed in the BLM group were down-regulated by the Sch A to the baseline levels of control groups, including 2-hydroxy-3-methylbutyric acid, 2-methylbutyroylcarnitine, N-acetyl-D-glucosamine, acetylglycine, tetradecanoylcarnitine, linoleylcarnitine, phenyllactic acid, 3-hydroxyisovalerylcarnitine, palmitoylcarnitine, adipoylcarnitine, carnitine, dodecanoylcarnitine, creatine, dimethylglycine, malonic acid, adrenic acid, indolelactic acid, glutaconic acid, gamma-glutamylalanine, 3-hydroxyisovaleric acid, guanidinoacetic acid, gluconolactone, glutarylcarnitine, hydroxypropionic acid, carnosine, DPAn-6, isocaproic acid, isovalerylcarnitine, 3-methyladipic acid, 5-aminolevulinic acid, citraconic acid, phenylacetic acid, the details of 32 reversed biomarkers were listed in Table S1. Among them, 2-Hydroxy-3-methylbutyric acid with the highest P-value was reported as a biomarker of community-acquired pneumonia and correlated with inflammation severity;20 carnitines play an important role in energy metabolism and β-oxidation, of which acylcarnitines transport long-chain fatty acids into mitochondria to be further oxidized to produce energy.21
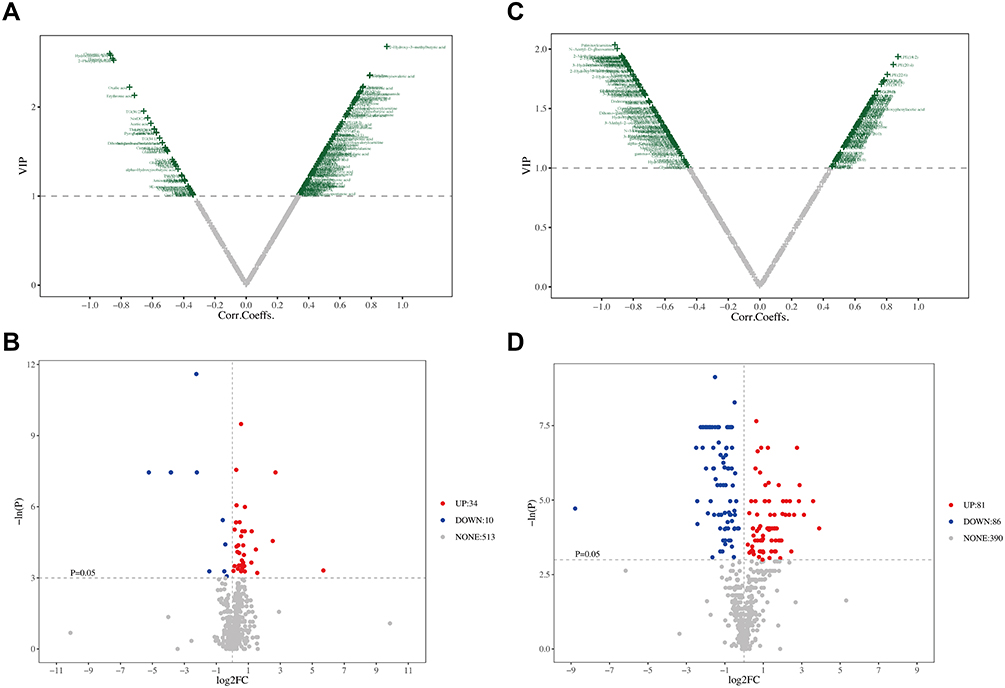 |
Figure 3 Metabolic data analysis of serums from different groups. (A and B) VIP plot and unidimensional volcano plot from OPLS-DA of serum samples from control and BLM model group (C and D) VIP plot and unidimensional volcano plot from OPLS-DA of serum samples from Sch A treated group and BLM model group. |
The regulation of these 32 metabolites indicates that they are potential biomarkers for the treatment of PF with Sch A. Most of the metabolites belong to the class of carnitines and amino acids, suggesting that the drug’s therapeutic effect works through related pathways. Especially, according to the result of metabolomics, 10 of the 32 biomarkers are carnitines, 5 of the top 9 p-value biomarkers are acylcarnitines (Figure S3), worth adding creatine and carnosine also participate in the core process of production of ATP. Creatine is naturally produced in the human body from glycine and arginine and present in all vertebrates, further promoting the recycling of ATP.22 It is mainly involved in the regulation of energy metabolism and often serves as an important energy carrier through the creatine phosphate shuttle which is pivotal in cellular energy homeostasis and closely related to the energy metabolism.23 Carnosine is a dipeptide composed of beta-alanine and L-histidine, it has been proved when added to cells, it can increase mitochondrial activity and decrease glycolysis.24 It was suggested that Sch A exerts the therapeutic effects by modulating energy metabolism disturbances caused by PF progression.
Metabolomics Pathway Profile Analysis
In order to further explore the metabolic pathways involved in the above 32 biomarkers in addition to energy metabolism, all the 32 biomarkers were imported into MetaboAnalyst5.0 (https://www.metaboanalyst.ca/) to analyze and construct a related metabolism pathway (Figure 4A). The major metabolism pathways included glycine, serine and threonine metabolism, beta-alanine metabolism, arginine and proline metabolism, phenylalanine metabolism, and histidine metabolism. Since the acylcarnitines mentioned above are not directly included in the KEGG metabolic profile, they are not enriched in the metabolic pathway map.
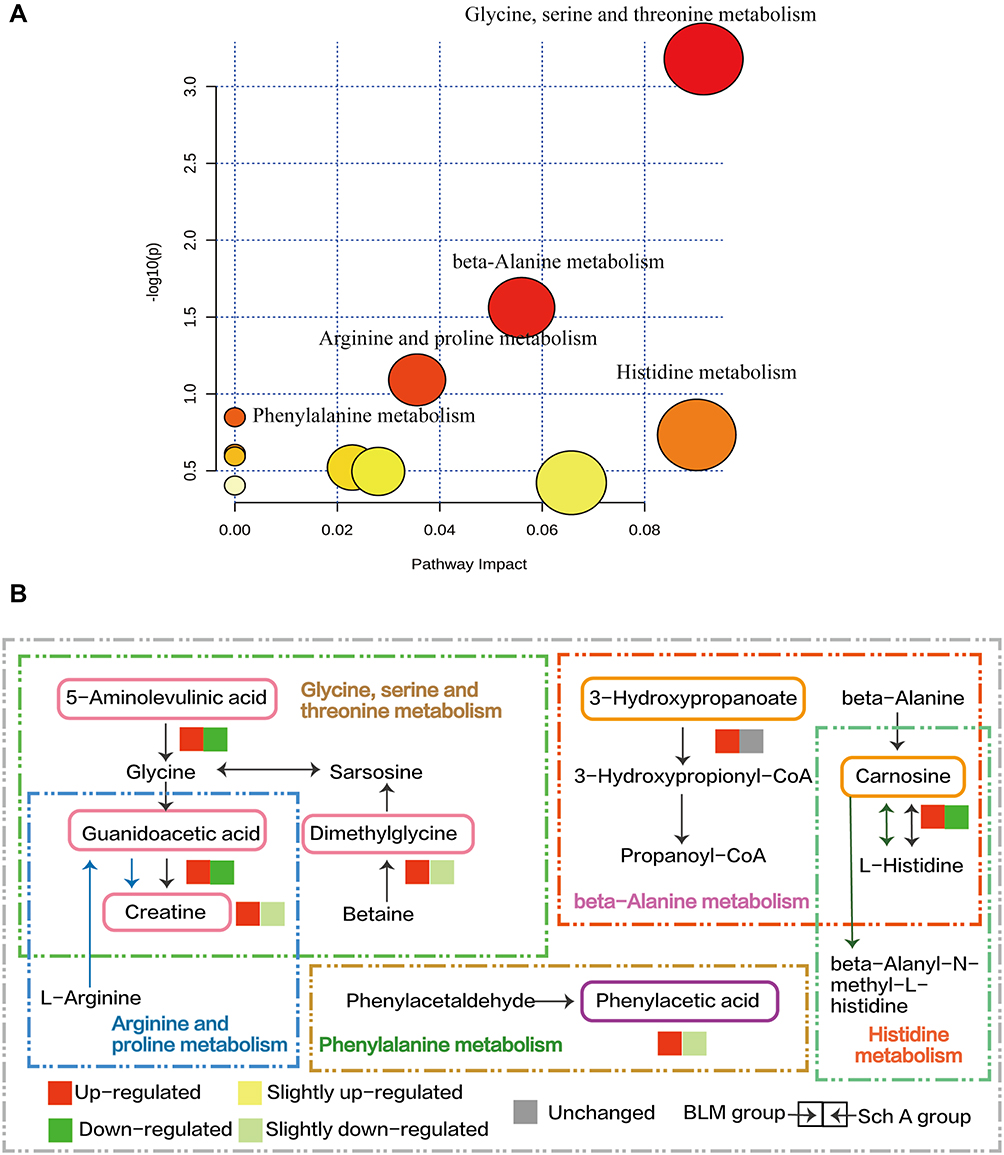 |
Figure 4 (A) Pathway Analysis of biomarkers reversed by the administration of Sch A in BLM-induced PF model. The most significant metabolic pathways were filtered out and labeled in the figure. Glycine, serine and threonine metabolism, beta-Alanine metabolism, arginine and proline metabolism, phenylalanine metabolism, histidine metabolism these five pathways were included. (B) Schematic diagram of the metabolic pathway, the up-regulation and down-regulation of metabolites were compared with the control group. The metabolites screened as biomarkers were marked with colored boxes and the trend of the biomarkers involved in each metabolic pathway in differently treated groups was represented by the color box. |
The metabolic pathways the biomarkers involved in and the upstream and downstream relationships between each metabolite were drawn based on the KEGG database (Figure 4B), which illustrated the core metabolic pathways involved in the development of PF and the healing effects of Sch A on PF. The five metabolic pathways are amino acid metabolism, glycine, serine and threonine metabolism are the most important one with the four metabolite levels presenting significant improvement, there is a partial overlap of metabolites among it and arginine and proline metabolism, guanidinoacetic acid and creatine are involved in both of them. Creatine can achieve facilitation the shuttling of high-energyphosphates between sites of ATP such as mitochondrial oxidative phosphorylation and glycolysis by combining with thephosphate group through the enzyme creatine kinase to generate phosphocreatine, complying with the transfer and storage of energy.25 It is worth noting that glycine and proline are important substrates that constitute the triple helix structure of collagen,a structural protein of the extracellular matrix (ECM) and account for 32% of the total amino acid content of collagen. 26,27 Serum metabolomic analysis suggested that compared with the BLM group, the proline level was down-regulated to a certainextent after the Sch A treatment, while the glycine level was maintained at a relatively stable level.
Identification of the Metabolites of Sch A in Mice Plasma
In order to adequately elucidate that Sch A possesses the effect of anti-pulmonary fibrosis. The model mice of BLM-induced pulmonary fibrosis were established. Based on our previous study,16 we only found three Sch A metabolites in the rat’s plasma. This result may come from the species variation between mice and rats, and the disease model. Combined with a previous study of Sch A metabolites,28,29 we finally found 7 metabolites in the plasma of the model mice. The Extracted Ion Chromatogram (EIC) of these metabolites is shown in Figure S4. Their detailed information on formulary, retention time and protonated m/z are listed in Table 1. Metabolites with bigger polarity would be eluted earlier in reversed-phase chromatography. M1, which was eluted at 1.96 min, exhibited [M+H-H2O]+ ion at 403.1762. It was demethylation after oxidation product of Sch A. M2a was eluted at 2.05 min and presented [M+H-H2O]+ ion as 417.1908. It could be speculated that M2a was the metabolite that the methyl group of Sch A at the C–3 positions was removed after the hydroxylation of the C–8 position.29 M2b, which was the isomer of M2a with a different detected time at 2.18 min, was the same precise molecular mass as M2a. It came from the removal of the methyl group at C–2 of Sch A after the hydroxylation of C–8.29 M4, which was eluted at 5.29 min, [M+Na]+ ion at 441.1884. It should be the Sch A metabolite that one molecule of OCH3 was removed.28 Sch A, M3, M5 and M6 were identified by precise m/z and retention time from our previous study.16 Consequently, the biotransformation of Sch A in the model mice mainly included demethylation, oxidization, demethoxylation, and glucuronidation (Figure 5).
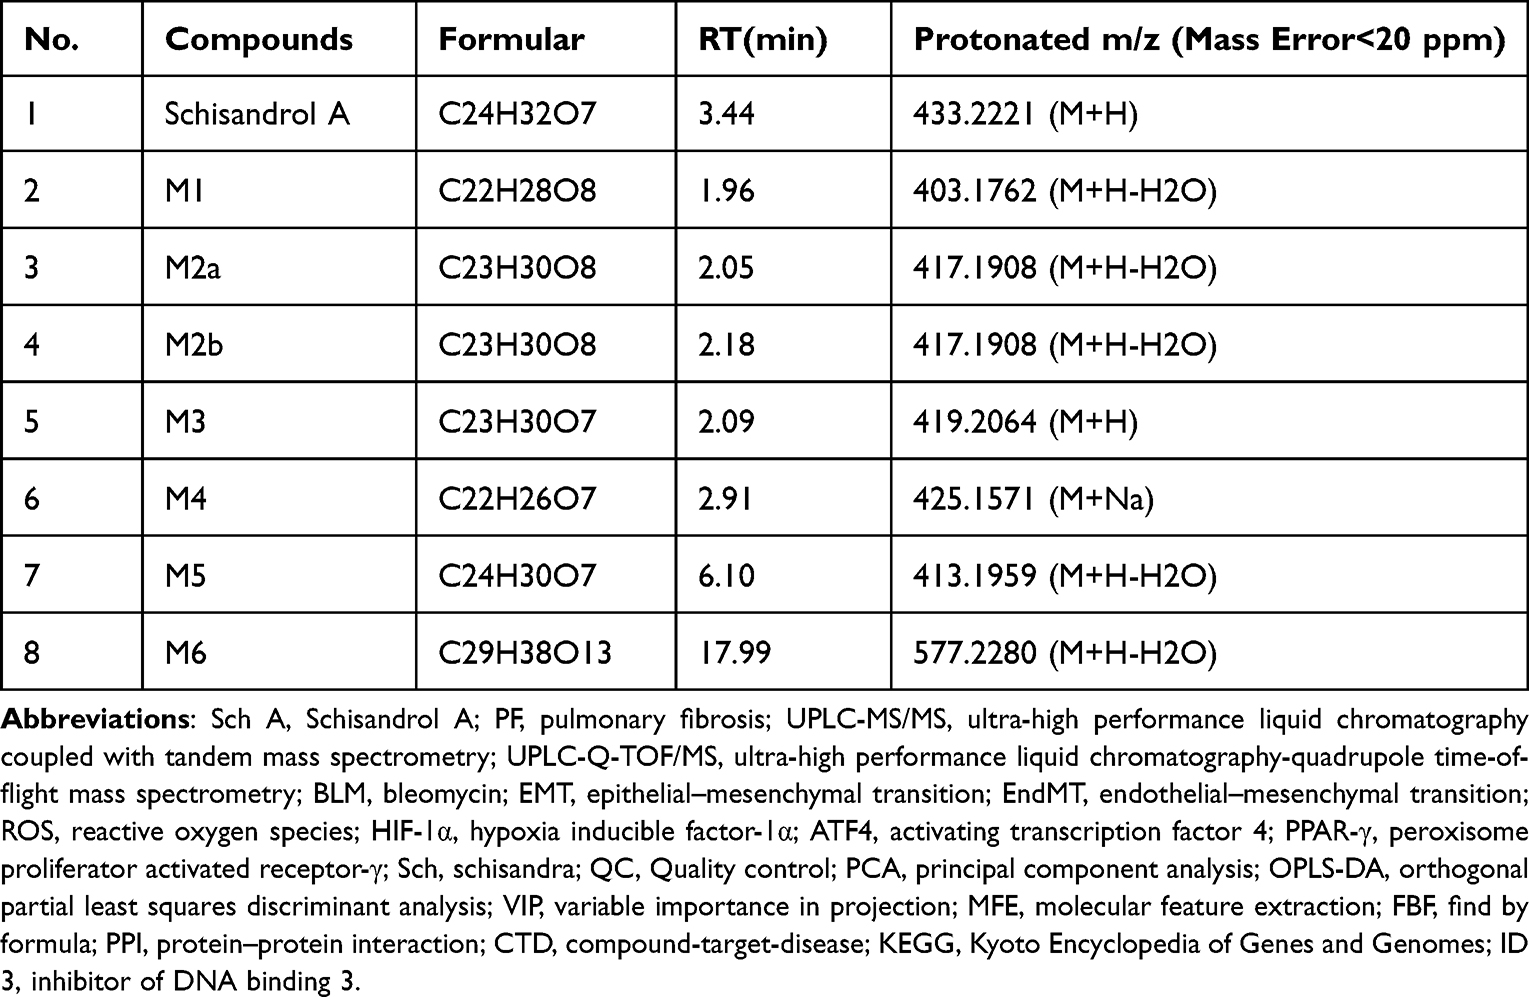 |
Table 1 Metabolites of Sch A by UPLC-Q-TOF/MS |
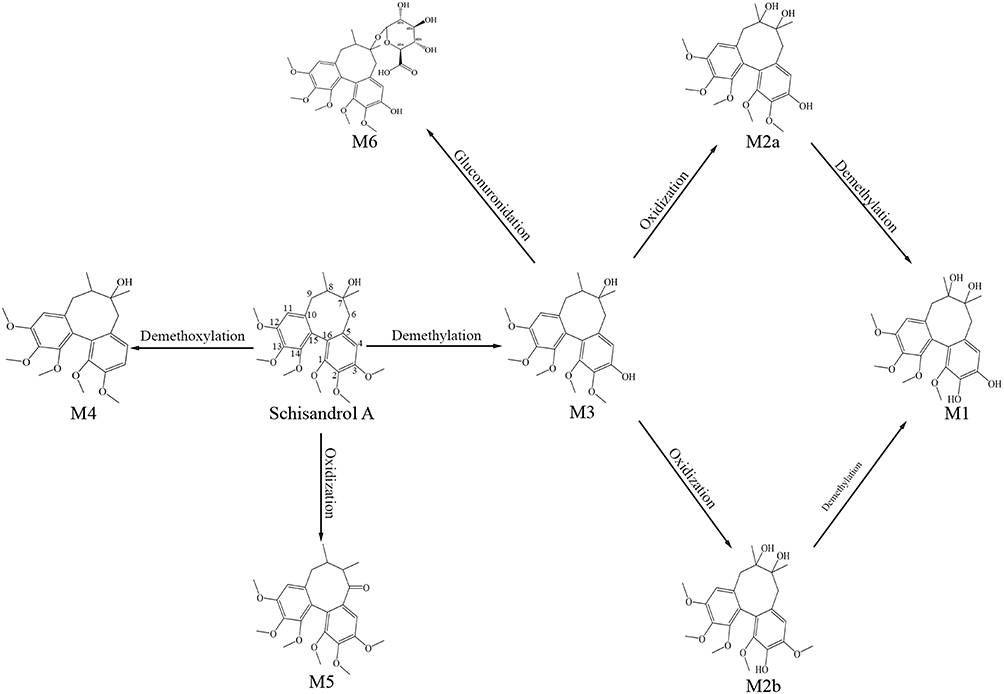 |
Figure 5 Proposed major metabolic pathway of schisandrol A. |
Network Analysis
In order to further elaborate the role of Sch A in treating pulmonary fibrosis, network analysis was used to discover targets and action pathways, better integrated with the results of metabolomics to conduct a bidirectional verification. The targets of Sch A and corresponding metabolites were searched in TCMSP (https://www.tcmsp-e.com) and predicted by SwissTargetPrediction, except M1, M2a and M2b with no target predicted, and a total of 269 targets were obtained after integration and deduplication (Table S2). PF-related genes were searched in the OMIM database and GeneCards database, and after integrating and removing duplicates, a total of 1109 targets were screened out. The targets of Sch A and 14 absorbed metabolites (including isomers) and PF-related targets were, respectively, input into the Venny2.1, and 79 overlapping targets were screened out (Figure 6A, Table S3). The integrated 79 common targets of drugs and PF were imported into the STRING database to conduct a protein–protein interaction (PPI) analysis and visualized by Cytoscape v3.7.2, a PPI network consisting of 79 nodes and 843 edges was constructed (Figure 6B), minimum required interaction score = 0.4, the average node degree was 21 (Table S4). The size of the node presents the degree, and the thicker line indicates a stronger interaction. To further elucidate nodes in the intersection targets that interacted more extensively with other targets, degree top 20 targets were filtered out and visualized by a diagram, including TNF, MAPK3, SRC and STAT3 (Figure 6C).
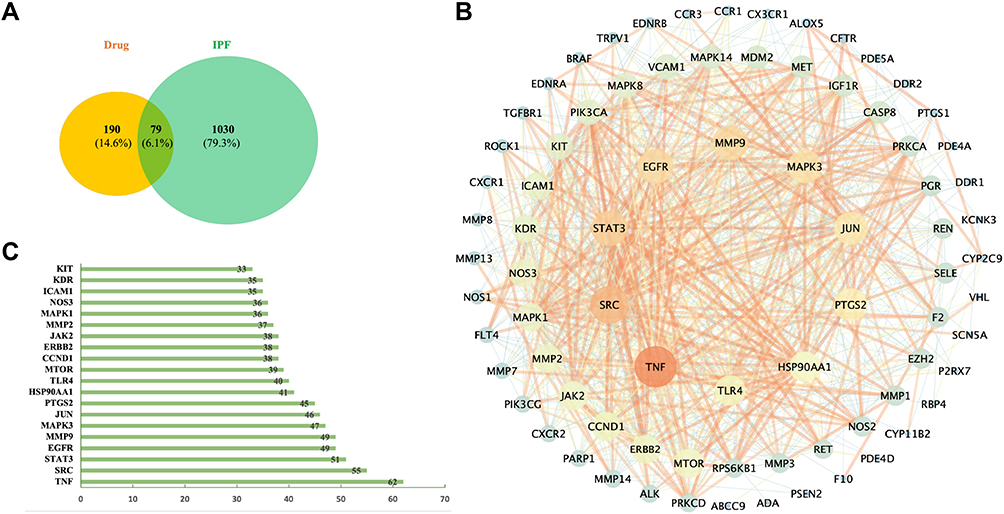 |
Figure 6 (A) Common targets of drugs (Sch A and corresponding metabolites) and PF. (B) Protein–protein interaction (PPI) analysis of integrated common targets of drugs and PF, the size of the circle represents the degree value of targets. (C) Several adjacent nodes of the top 20 common targets of drugs and PF, The X-axis represents different nodes, the Y-axis represents the number of adjacent nodes of each node, and the exact number of adjacent nodes for each node is marked on the inside of the data column. |
A compound-target-disease (CTD) network was constructed to better achieve the elucidation of the underlying mechanisms of Sch A and corresponding metabolites in the treatment of PF (Table S5), as shown in Figure 7A, the green nodes represented the Sch A and its metabolites, the yellow nodes represented the intersection genes of compounds and PF, the network consists of 95 nodes and 392 edges, including 15 compounds, 79 target genes and 1 disease (IPF). A total of 79 core targets were imported into Metascape to perform an enriched KEGG analysis to further elaborate the possible therapeutic pathway of Sch A on BLM-induced PF, and 20 pathways were identified including the TGF-β signaling pathway, pathway in cancer and proteoglycans in cancer (Figure 7B); the gene symbols in each pathway are listed in Table S6. According to the functional analysis of KEGG pathway results (Figure 7C), these pathways were mostly related to anti-cancer (4 pathways), anti-infection (3 pathways), and metabolism (1 pathway). Meanwhile, 7 signal transduction pathways were involved including the TGF-β signaling pathway (6 targets), AMPK signaling pathway (6 targets), Wnt signaling pathway (5 targets), p53 signaling pathway (3 targets), apelin signaling pathway (10 targets), calcium signaling pathway (14 targets) and chemokine signaling pathway (15 targets).
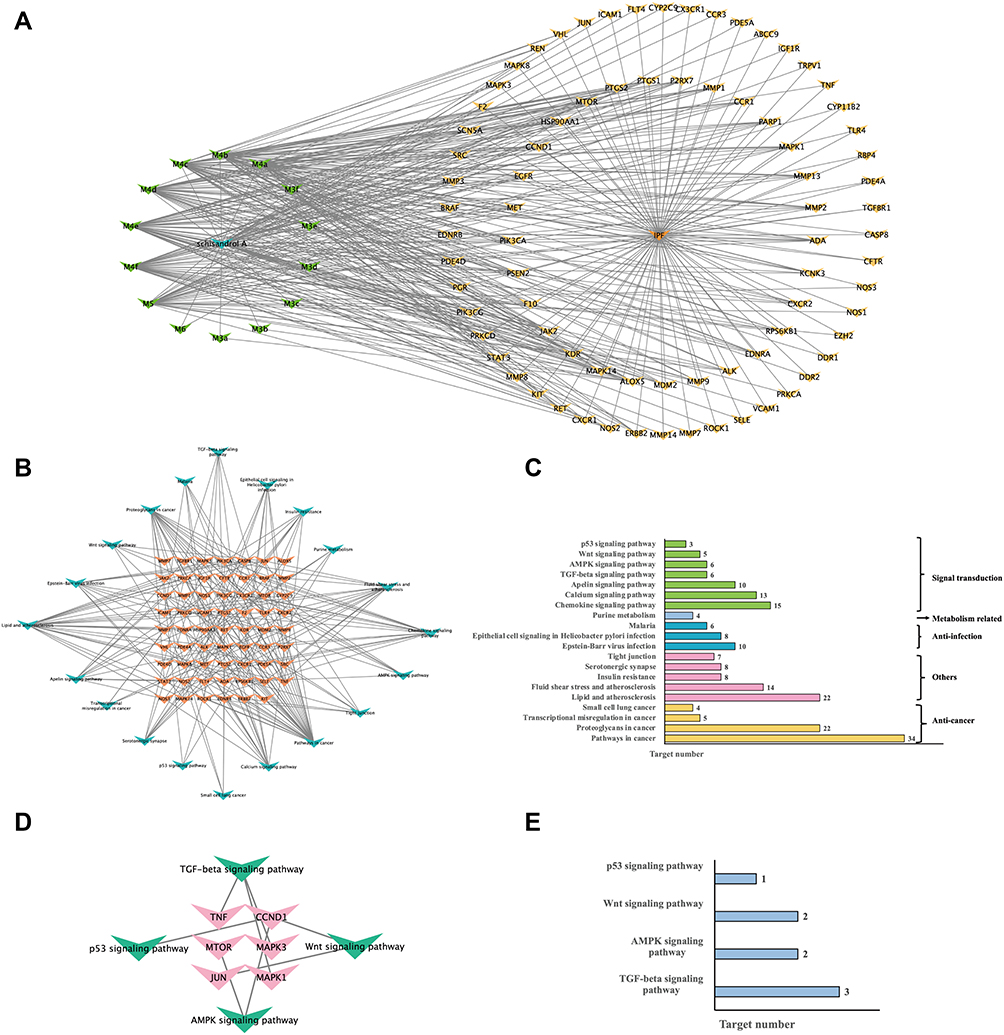 |
Figure 7 (A) “Compound-gene symbol” network consists of 15 compounds (Sch A with corresponding metabolites which were presented by green nodes) and 79 overlapping targets (yellow) of compounds and disease. (B) “Signal pathway- gene symbol” network of integrated core targets (yellow) and related pathways (blue). (C) Enriched KEGG pathways analysis of integrated core targets. (D) “Signal pathway- gene symbol” network of integrated top 20 core targets and 4 fibrosis-related pathways. (E) Enriched KEGG pathways analysis of top 20 core targets and four fibrosis related pathways. |
Further biological function analysis revealed that among these 7 signal transduction pathways enriched by network pharmacology analysis, excluding the apelin signaling pathway mainly act in physiological processes such as adipogenesis,30 angiogenesis,31 cardiovascular functions,32 calcium signaling pathway related to environmental information processing and energy supply and demand,33 chemokine signaling pathway regulates immune cell trafficking,34 TGF-β signaling pathway, AMPK signaling pathway,35 Wnt signaling pathway36 and p53 signaling pathway37 is fibrosis closely related. The top 20 degree targets in PPI analysis were filtered and constructed a target-pathway network to elaborate the key signal pathway the Sch A affected in the treatment of PF among these four fibrosis-related pathways (Figure 7D), enriched KEGG pathway analysis of top 20 degree core targets and 4 pathways are visualized in Figure 7E, and TGF-β signaling pathway (3 targets) was the pathway with highest top 20 core targets, compared with AMPK signaling pathway (2 targets), Wnt signaling pathway (2 targets), p53 signaling pathway (1 target). TGF-β signaling pathway has been proven as the powerful fibrogenic pathway and was thought to be the most important pathway the Sch A affected in the treatment of PF. Six core targets including TNF (degree = 62), MAPK3 (degree = 47), MAPK1 (degree = 36), TGFBR1 (degree = 13), ROCK1 (degree = 13), RPS6KB1 (degree = 20) were enriched in TGF-β signaling pathway according to KEGG analysis results, among them, TNF, MAPK3, MAPK1 were top 20 degree targets.
The results of network analysis suggested that TGF-β signaling pathway was the main signaling pathway that further analysis needs to focus on to clarify the Sch A anti-PF mechanism. TGF-β is considered as the master regulator of fibrosis, which can lead to myofibroblast activation, extracellular matrix (ECM) overproduction and ECM repressive degradation through canonical or non-canonical pathways.38 The over-activation of TGF-β can also promote the progression of EMT, which is characterized by loss of epithelial, to further induce the onset and development of fibrosis.39 Especially in PF, it has been demonstrated that exposure of rat alveolar epithelial cells to 100 pmol/L TGF-β1 resulted in increased expression of fibrosis markers like α-SMA, type I collagen.40 According to Table S3, the metabolite of Sch A M5 was the most potent active component in the treatment of PF through the TGF-β signaling pathway and was proved to have a strong interaction with TGFβR1.16
Integrated Analysis of Network Analysis and Metabonomics
It suggests that in our study, it is necessary to explore the relationship between the metabolic perturbation and the TGF-β signaling pathway to elucidate the therapeutic effect of Sch A on PF. Thus, a PPI network of gene symbols in the TGF-β signaling pathway was conducted by STRING (minimum required interaction score = 0.4) to filter the most important targets in this signaling pathway; 94 targets were collected through searching the KEGG database, and a macroscopic network consisting of 93 nodes and 1200 edges is visualized in Figure 8A, average numbers of neighbors = 25.8 (Table S7). The top 25 targets were selected, and details of each target are shown in Figure 8B, these 25 targets were used for further exploration.
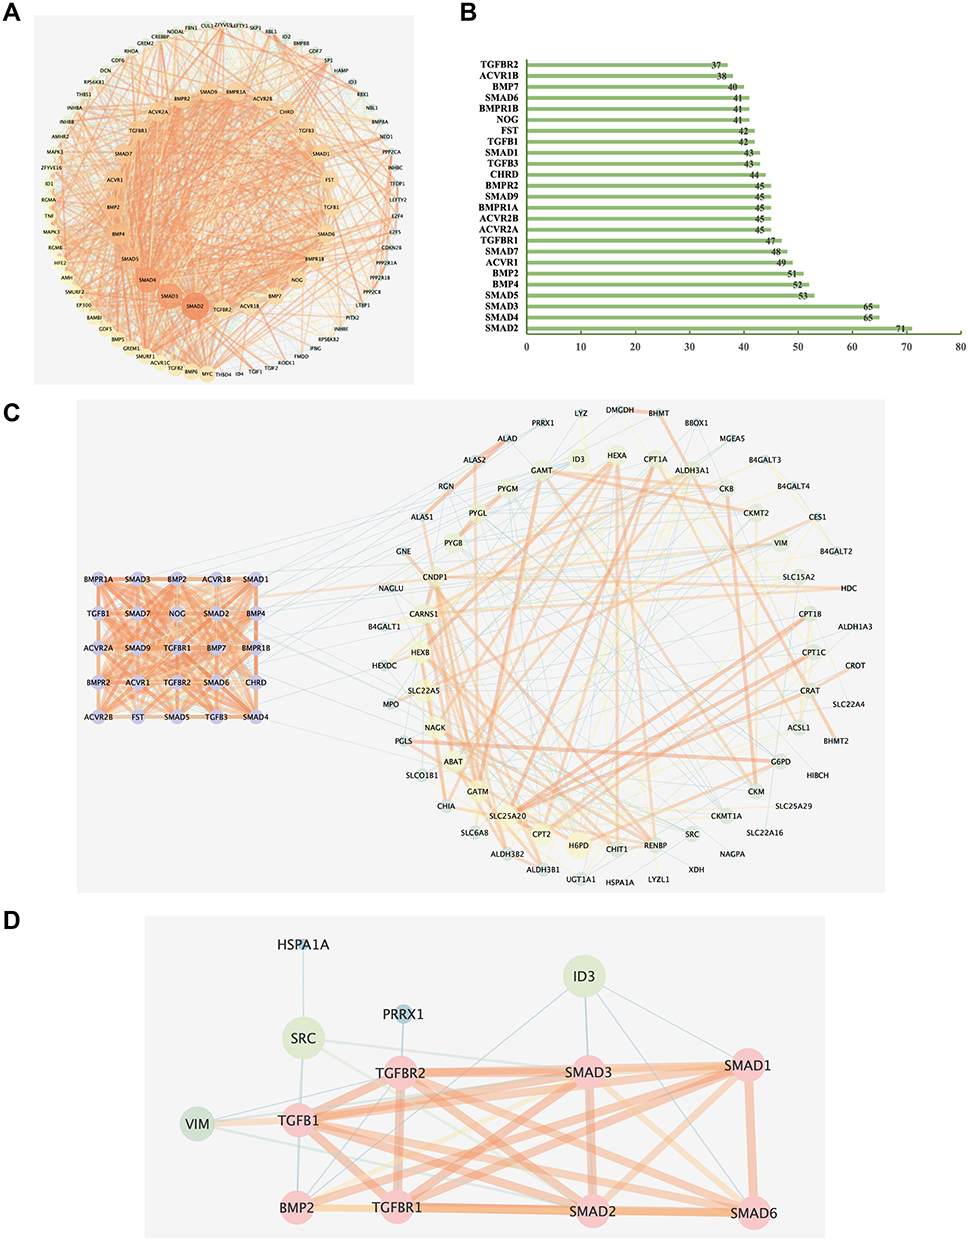 |
Figure 8 (A) Protein–protein interaction (PPI) of 94 TGF-β signaling pathway-related genes searched from the KEGG database. (B) Column chart of top 25 core genes in A. (C) PPI network analysis of 25 TGF-β signaling pathway-related core genes(purple) in B and metabolomics-related genes (minimum required interaction score=0.4). The nodes on the right are metabolomics-related genes, the bigger the size of the node, the higher the degree it has. (D) Simplified interaction network of local interactions between metabolomics-related genes and TGF-β signaling pathway-related targets. The pink nodes are the gene symbols related to the TGF-β signaling pathway, others are metabolites related, the thickness of the line represents the level of combined scores. |
A PPI network analysis was conducted to explore relevant information between the TGF-β signaling pathway and biomarkers. The top 25 core genes of the TGF-β signaling pathway in Figure 8B were selected as signaling pathway-related targets. The biomarkers-related genes were obtained by searching the HMDB database, 32 biomarkers mainly related to 80 targets, including the corresponding enzymes and transporters of metabolites (Table S8). The PPI network analysis was conducted in STRING and visualized by Cytoscape v3.7.2, minimum required interaction score = 0.4, the original network consists of 95 nodes and 462 edges, the average degree of the network is 9.7 (Table S9), the size of the node presents the degree, a thicker line indicates a stronger interaction, as shown in Figure 8C, purple nodes on the left were signaling pathway-related, nodes attributed as a circle on the right side were metabolites-related targets.
By further simplifying the original PPI network containing complex information, deleting nodes had no interaction with TGF-β signaling pathway-related targets and nodes with degrees lower than 3 to filter out the important information, the network diagram which is shown in Figure 8D is concise. The pink nodes are the gene symbols in the TGF-β signaling pathways, the green nodes are metabolites related, the thickness of the line represents the level of combined scores, and ID3 (degree = 8), VIM (degree = 7), SRC (degree = 6) were finally reserved. The integrated results from network analysis and metabolomics analysis indicated that Sch A exerts a curative effect through the TGF-β1-ID3-creatine pathway, TGF-β1-VIM-carnosine pathway and TGF-β1-SRC-malonic acid pathway, involving energy metabolism, glycine, serine and threonine metabolism, arginine and proline metabolism and beta-alanine metabolism. Among these pathways, ID3 is a negative regulator of the creatine kinase with a higher degree in the PPI network, creatine was enriched in two metabolism pathways with higher pathway impact in KEGG enriched analysis including glycine, serine and threonine metabolism and arginine and proline metabolism according to the metabolomics analysis.41 The VIM expression and carnosine levels often showed a dose-dependent increase; VIM has been reported to be a key regulator of the NLRP3 inflammasome and is closely associated with lung inflammation and fibrosis.42 Comprehensive analysis revealed that the TGF-β1-ID3-creatine pathway and TGF-β1-VIM-carnosine pathway might be the most strongly related to the treatment of PF Sch A.
The integrated results of metabolomics analysis and network analysis were depicted to further illustrate the healing effects of Sch A in PF (Figure 9). Compound-based network analysis and metabolite-based metabolomic analysis were integrated to achieve bidirectional pharmacological validation. Four metabolomics pathways were identified by evidence-based analysis and KEGG analysis of 32 biomarkers. Carnitine and 9 acylcarnitines were enriched in energy metabolism, creatine, guanidinoacetic acid, 5-Aminolevulinic acid and dimethylglycine were enriched in glycine, serine and threonine metabolism; creatine and guanidinoacetic acid were enriched in arginine and proline metabolism; carnosine and hydroxypropionic acid were enriched in beta-alanine metabolism. By linking signaling pathways and metabolisms through genes from integration analysis, it was suggested that the therapeutic effect of Sch A was mainly achieved through the regulation of the TGF-β signaling pathway to perturbate energy metabolism, glycine, serine and threonine metabolism, arginine and proline metabolism and beta-alanine metabolism further intervening the PF process. In addition, the metabolite of Sch A M5 was identified as the most likely active metabolite.
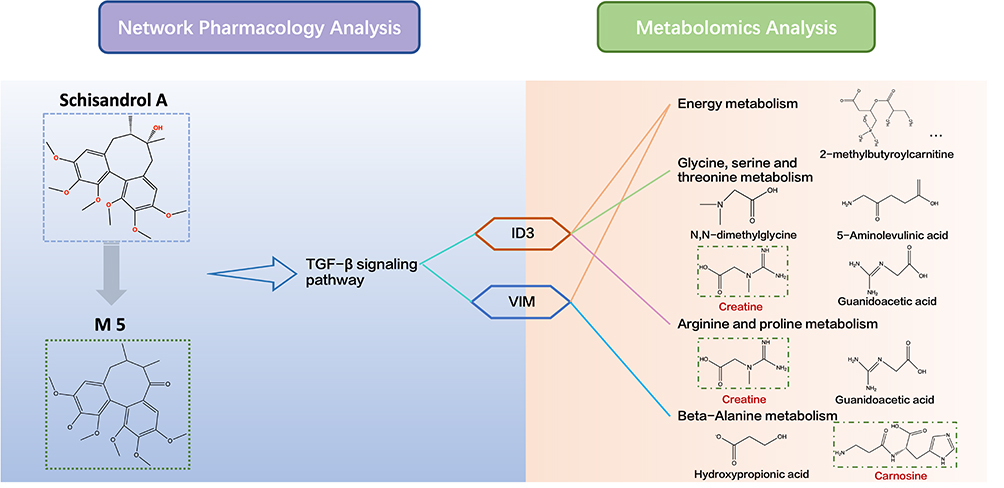 |
Figure 9 Integrated analysis of network analysis and metabolomics. The biomarkers involved in the corresponding metabolic pathways were obtained by KEGG analysis. Gene-related metabolites involved in the metabolism pathway were shown on the red label. |
Discussion
Chinese medicine has great potential in the treatment of pulmonary fibrosis.43,44 Serum Schisandra chinensis, in particular, has a significant anti-pulmonary fibrosis effect. Sch A is one of the main active ingredients of Schisandra chinensis (Turcz.) Baill., elucidating the mechanisms of active ingredients of Chinese medicine in the therapy of PF is of great significance to fully grasp the multiple levels and complex therapeutic effects played by Schisandra chinensis (Turcz.) Baill.
Metabolomics is one of the rapidly developing omics technologies, which relies on the advancement of modern biological sciences. Abnormal metabolic pathways are the key to fibrosis. The identification of perturbed metabolites in specific diseases is meaningful in new diagnostic and prognostic biomarker development. The administration of Sch A brings BLM-induced PF a series of complex changes, with 32 metabolites reversed to normal levels after the administration of Sch A in BLM – The induced mice model. It is worth noting that the administration of Sch A in the model group triggered a substantial down-regulation of most metabolites, even lower than in the control group, a possible conjecture is that the high dose is the main factor to blame. The biomarkers involved in the results of this study, such as creatine, carnosine, and multiple acylcarnitines, which are central in maintaining energy homeostasis were significantly accumulated with the development process of PF, demonstrating that the disease progression of PF was accompanied by an abnormal energy metabolism, Sch A treatment reversed this process by regulating energy metabolism disorders. The metabolic analysis identified that these metabolites were enriched in energy metabolism and several amino acid metabolisms. The process of fibrosis is an irreversible process of proliferation and differentiation of fibroblasts into myofibroblasts, and this process is often accompanied by the reprogramming of energy metabolism regulated by the TGF-β signaling pathway and the canonical WNT/beta-catenin pathway, described as Warburg effect, a shift from mitochondrial oxidative phosphorylation to aerobic glycolysis to produce ATP resulting in a shortage of energy.45–47 It was reported that inhibition of glycolysis by a kind of PFKFB3 inhibitor 3PO is an effective approach to treat PF.48 Glycine, serine and threonine metabolism are closely related to the occurrence of fibrosis, the expression of the enzymes of the de novo serine synthesis pathway and de novo glycine synthesis required for collagen synthesis is higher.49 Among these pathways, arginine and proline metabolism are related to the synthesis of NO in the body.50 NO is an anti-fibrotic factor that inhibits collagen synthesis, and upregulation of arginase expression leads to dysregulation of NO signaling.51
In order to further determine the active structure of the Sch A, identification of drug serum metabolites based on UPLC-Q-TOF/MS analysis identified 17 metabolites (including isomers) of Sch A in plasma. A network analysis was carried out, using Sch A and identified metabolites as the starting points forwardly screening disease-related genes and signaling pathways, further identified the TGF-β signaling pathway which was determined closely related to fibrosis as the main investigated signaling pathway related to the therapeutic effects of Sch A on PF.
TGF-β signaling pathway is one of the signaling pathways related to fibrosis that we are very interested in, its EMT promoting effect and ECM activating effect have an inseparable relationship with the onset and development of PF, the TGF-β ligand overactivation fibroblasts often accompanied by a decreased mitochondrial activity and an abnormal energy metabolism.52
Therefore, based on metabolomics research results, we established a PPI network for metabolism-related targets and the top 25 TGF-β signaling pathway-related targets. TGF-β1-ID3-creatine pathway, TGF-β1-VIM-carnosine pathway and TGF-β1-SRC-malonic acid pathway might be the signaling pathway Sch A regulates during the treatment of PF. Integrated analysis revealed, the TGF-β1-ID3-creatine pathway and TGF-β1-VIM-carnosine pathway were the most strongly related to the treatment of PF by Sch A. VIM is a kind of mesenchymal protein, the process of fibrosis often accompanied by an increase in the expression of VIM.40
As an important member of the differentiation inhibitor family, ID3 (inhibitor of DNA binding 3, HLH protein) is a small polypeptide containing an HLH motif lacking a basic DNA-binding domain.53 ID3 inhibits the binding of MyoD transcription factor to the muscle creatine kinase E-box enhancer by forming heterodimers with former, so the helix–loop–helix motif of MyoD transcription factor cannot bind DNA to promote the transcription of creatine kinase, so inhibition of ID3 usually results in a higher activity of creatine kinase.41,54 It was suggested that during the progression of PF, the overactivation of the TGF-β signaling pathway caused inhibition of ID3, as TGF-β can decrease the expression of ID3,55 further resulting in higher activation of creatine kinase, the increased level of creatine reflecting a more active and aggressive energy synthesis, the Sch A acted through TGF-β signaling pathway, especially TGF β1-related signaling pathway regulated genes like ID3 to correct this kind of energy metabolism disorder to achieve the energy metabolism reprogramming.
We preliminarily speculated that Sch A mainly improves the abnormal metabolic pattern dominated by energy metabolism in the process of fibrosis by inhibiting the targets in the TGF-β signaling pathway. The metabolomic results revealed that energy metabolism is disordered in the process of PF, and multiple pathways mainly the TGF-β signaling pathway mediated energy metabolism reprogramming triggering a shift from mitochondrial oxidative phosphorylation to aerobic glycolysis, which in turn resulted in a shortage of ATP, to make up for the lack of energy, further accelerated fatty acid oxidation, resulting in elevated plasma levels of fatty acid transporter acylcarnitines,56 also the accumulation of creatine also reflecting the body provided more ATP to meet the increased energy demand of fibrotic tissues for remodeling and repairing.57 Accumulation of carnosine might cause by its function of inhibiting glycolysis and enhancing mitochondrial activity to counter the onset of Warburg-like metabolism.58 The treatment with Sch A reversed this process and modulated energy metabolism resulted in an altered metabolic flux, the Sch A regulation of the TGF-β1-ID3-creatine pathway and TGF-β1-VIM-carnosine revealed by integrated analysis of network pharmacology and metabolomics consists with this point of view and be a part of this transformation.
Clearly, the results provide us an insight that the administration of Sch A mainly plays a therapeutic effect on PF by remodeling the energy metabolism and several amino acid metabolisms. The integrated analysis of network pharmacology and metabonomics suggested that Sch A might mainly act through the TGF-β1-ID3-creatine pathway and TGF-β1-VIM-carnosine pathway. Here, we first report that Sch A plays a therapeutic effect through several amino acid metabolisms and further redress the disturbances in energy metabolism.
Conclusion
In this study, we found that Sch A could improve the fibrosis development process in PF mice by mainly regulating energy metabolism and several amino acid metabolisms including glycine, serine and threonine metabolism, arginine and proline metabolism and beta-alanine metabolism. A total of 32 metabolites were back-regulated by Sch A and considered as biomarkers for the Sch A treatment of PF by UPLC-MS/MS-based metabonomic. UPLC-Q-TOF/MS was used to identify metabolites of Sch A in mice plasma, 7 metabolites were identified and applied for network analysis. We focus on the TGF-β-related signaling pathway, integrated the results of metabolomics and network analysis revealed that the regulation of Sch A on the TGF-β1-ID3-creatine pathway and TGF-β1-VIM-carnosine pathway might be part of the puzzle that former regulates energy metabolism to treat PF. In addition, the metabolite of Sch A M5 was identified as the most likely active metabolite. We will do a detailed study on the active ingredients and the specific metabolic mechanism in the future. This study preliminary clarifies the potential therapeutic mechanism of Sch A and provides new ideas for further research on the pharmacological mechanism of single ingredients of traditional Chinese medicine on specific diseases.
Acknowledgments
This work is supported by the National Natural Science Foundation of China (81973289); Shanghai key clinical discipline construction project (02.DY11.03.19.03); Scientific and Innovative Action Plan of Shanghai (22S21902000). The authors acknowledge the use of icons from BioRender.com (2020) to create schematic Graphical Abstract. Acknowledge Zhendong Pan for his contribution in the revision of the article.
Disclosure
The authors report no conflicts of interest in this work.
References
1. Cho SJ, Stout-Delgado HW. Aging and lung disease. Annu Rev Physiol. 2020;82:433–459. doi:10.1146/annurev-physiol-021119-034610
2. Hu HH, Chen DQ, Wang YN, et al. New insights into TGF-beta/Smad signaling in tissue fibrosis. Chem Biol Interact. 2018;292:76–83. doi:10.1016/j.cbi.2018.07.008
3. Werner F, Jain MK, Feinberg MW, et al. Transforming growth factor-beta 1 inhibition of macrophage activation is mediated via Smad3. J Biol Chem. 2000;275(47):36653–36658. doi:10.1074/jbc.M004536200
4. Ye Z, Hu Y. TGFbeta1: gentlemanly orchestrator in idiopathic pulmonary fibrosis (Review). Int J Mol Med. 2021;48(1). doi:10.3892/ijmm.2021.4965
5. Hamanaka RB, Mutlu GM. Metabolic requirements of pulmonary fibrosis: role of fibroblast metabolism. FEBS J. 2021;288(22):6331–6352. doi:10.1111/febs.15693
6. Nimbalkar V, Vyawahare N. L-carnitine ameliorates bile duct ligation induced liver fibrosis via reducing the nitrosative stress in experimental animals: preclinical evidences. Heliyon. 2021;7(11):e08488. doi:10.1016/j.heliyon.2021.e08488
7. Aljobaily N, Viereckl MJ, Hydock DS, et al. Creatine alleviates doxorubicin-induced liver damage by inhibiting liver fibrosis, inflammation, oxidative stress, and cellular senescence. Nutrients. 2020;13(1):41. doi:10.3390/nu13010041
8. Liu XQ, Jiang L, Lei L, et al. Carnosine alleviates diabetic nephropathy by targeting GNMT, a key enzyme mediating renal inflammation and fibrosis. Clin Sci. 2020;134(23):3175–3193. doi:10.1042/CS20201207
9. Somogyi V, Chaudhuri N, Torrisi SE, Kahn N, Muller V, Kreuter M. The therapy of idiopathic pulmonary fibrosis: what is next? Eur Respir Rev. 2019;28(153):190021. doi:10.1183/16000617.0021-2019
10. Dempsey TM, Payne S, Sangaralingham L, Yao X, Shah ND, Limper AH. Adoption of the antifibrotic medications pirfenidone and nintedanib for patients with idiopathic pulmonary fibrosis. Ann Am Thorac Soc. 2021;18(7):1121–1128. doi:10.1513/AnnalsATS.202007-901OC
11. Amor MS, Rosengarten D, Shitenberg D, Pertzov B, Shostak Y, Kramer MR. Lung transplantation in idiopathic pulmonary fibrosis: risk factors and outcome. Isr Med Assoc J. 2020;22(12):741–746.
12. Cao ZX. Professor ZHOU Xianmei in the treatment of idiopathic pulmonary fibrosis with Wuweizi decoction. Jilin J Chin Med. 2019;2019(6):4.
13. Zhou Y, Men L, Sun Y, Wei M, Fan X. Pharmacodynamic effects and molecular mechanisms of lignans from Schisandra chinensis Turcz. (Baill.), a current review. Eur J Pharmacol. 2021;892:173796. doi:10.1016/j.ejphar.2020.173796
14. Lee S, Chun JN, Lee HJ, et al. Transcriptome analysis of the anti-TGFbeta effect of Schisandra chinensis fruit extract and schisandrin B in A7r5 vascular smooth muscle cells. Life. 2021;11(2):163. doi:10.3390/life11020163
15. You S, Qian J, Wu G, et al. Schizandrin B attenuates angiotensin II induced endothelial to mesenchymal transition in vascular endothelium by suppressing NF-kappaB activation. Phytomedicine. 2019;62:152955. doi:10.1016/j.phymed.2019.152955
16. Wu Z, Jia M, Zhao W, et al. Schisandrol A, the main active ingredient of Schisandrae Chinensis Fructus, inhibits pulmonary fibrosis through suppression of the TGF-beta signaling pathway as revealed by UPLC-Q-TOF/MS, network pharmacology and experimental verification. J Ethnopharmacol. 2022;289:115031. doi:10.1016/j.jep.2022.115031
17. Ji Y, Wang T, Wei ZF, et al. Paeoniflorin, the main active constituent of Paeonia lactiflora roots, attenuates bleomycin-induced pulmonary fibrosis in mice by suppressing the synthesis of type I collagen. J Ethnopharmacol. 2013;149(3):825–832. doi:10.1016/j.jep.2013.08.017
18. Xie G, Wang L, Chen T, et al. A metabolite array technology for precision medicine. Anal Chem. 2021;93(14):5709–5717. doi:10.1021/acs.analchem.0c04686
19. Wu J, Luo Y, Shen Y, et al. Integrated metabonomics and network pharmacology to reveal the action mechanism effect of shaoyao decoction on ulcerative colitis. Drug Des Devel Ther. 2022;16:3739–3776. doi:10.2147/DDDT.S375281
20. Zhou B, Lou B, Liu J, She J. Serum metabolite profiles as potential biochemical markers in young adults with community-acquired pneumonia cured by moxifloxacin therapy. Sci Rep. 2020;10(1):4436. doi:10.1038/s41598-020-61290-x
21. Longo N, Frigeni M, Pasquali M. Carnitine transport and fatty acid oxidation. Biochim Biophys Acta. 2016;1863(10):2422–2435. doi:10.1016/j.bbamcr.2016.01.023
22. Vieira RP, Duarte AC, Claudino RC, et al. Creatine supplementation exacerbates allergic lung inflammation and airway remodeling in mice. Am J Respir Cell Mol Biol. 2007;37(6):660–667. doi:10.1165/rcmb.2007-0108OC
23. Bessman SP, Carpenter CL. The creatine-creatine phosphate energy shuttle. Annu Rev Biochem. 1985;54:831–862. doi:10.1146/annurev.biochem.54.1.831
24. Hipkiss AR. Energy metabolism, proteotoxic stress and age-related dysfunction - protection by carnosine. Mol Aspects Med. 2011;32(4–6):267–278. doi:10.1016/j.mam.2011.10.004
25. Kitzenberg D, Colgan SP, Glover LE. Creatine kinase in ischemic and inflammatory disorders. Clin Transl Med. 2016;5(1):31. doi:10.1186/s40169-016-0114-5
26. Shimizu J, Asami N, Kataoka A, et al. Oral collagen-derived dipeptides, prolyl-hydroxyproline and hydroxyprolyl-glycine, ameliorate skin barrier dysfunction and alter gene expression profiles in the skin. Biochem Biophys Res Commun. 2015;456(2):626–630. doi:10.1016/j.bbrc.2014.12.006
27. Li P, Wu G. Roles of dietary glycine, proline, and hydroxyproline in collagen synthesis and animal growth. Amino Acids. 2018;50(1):29–38. doi:10.1007/s00726-017-2490-6
28. Liu X, Cong L, Wang C, et al. Pharmacokinetics and distribution of schisandrol A and its major metabolites in rats. Xenobiotica. 2019;49(3):322–331. doi:10.1080/00498254.2017.1418543
29. Cui YY, Wang MZ. 五味子醇甲的代谢转化 [Metabolic transformation of schizandrin]. Yao Xue Xue Bao. 1992;27(1):57–63. Chinese.
30. Than A, Cheng Y, Foh LC, et al. Apelin inhibits adipogenesis and lipolysis through distinct molecular pathways. Mol Cell Endocrinol. 2012;362(1–2):227–241. doi:10.1016/j.mce.2012.07.002
31. Chang TK, Zhong YH, Liu SC, et al. Apelin promotes endothelial progenitor cell angiogenesis in rheumatoid arthritis disease via the miR-525-5p/angiopoietin-1 pathway. Front Immunol. 2021;12737990. doi:10.3389/fimmu.2021.737990
32. Wysocka MB, Pietraszek-Gremplewicz K, Nowak D. The role of apelin in cardiovascular diseases, obesity and cancer. Front Physiol. 2018;9557. doi:10.3389/fphys.2018.00557
33. Bhosale G, Sharpe JA, Sundier SY, Duchen MR. Calcium signaling as a mediator of cell energy demand and a trigger to cell death. Ann N Y Acad Sci. 2015;1350:107–116. doi:10.1111/nyas.12885
34. Salanga CL, O’Hayre M, Handel T. Modulation of chemokine receptor activity through dimerization and crosstalk. Cell Mol Life Sci. 2009;66(8):1370–1386. doi:10.1007/s00018-008-8666-1
35. Yang JY, Tao LJ, Liu B, et al. Wedelolactone attenuates pulmonary fibrosis partly through activating AMPK and regulating Raf-MAPKs signaling pathway. Front Pharmacol. 2019;10151. doi:10.3389/fphar.2019.00151
36. Li SS, Sun Q, Hua MR, et al. Targeting the wnt/beta-catenin signaling pathway as a potential therapeutic strategy in renal tubulointerstitial fibrosis. Front Pharmacol. 2021;12719880. doi:10.3389/fphar.2021.719880
37. Li S, Jiang S, Zhang Q, et al. Integrin beta3 induction promotes tubular cell senescence and kidney fibrosis. Front Cell Dev Biol. 2021;9:733831. doi:10.3389/fcell.2021.733831
38. Walton KL, Johnson KE, Harrison CA. Targeting TGF-beta mediated SMAD signaling for the prevention of fibrosis. Front Pharmacol. 2017;8461. doi:10.3389/fphar.2017.00461
39. Zeisberg M, Kalluri R. Fibroblasts emerge via epithelial-mesenchymal transition in chronic kidney fibrosis. Front Biosci. 2008;13:6991–6998. doi:10.2741/3204
40. Willis BC, Liebler JM, Luby-Phelps K, et al. Induction of epithelial-mesenchymal transition in alveolar epithelial cells by transforming growth factor-β1. Am J Pathol. 2005;166(5):1321–1332. doi:10.1016/s0002-9440(10)62351-6
41. Ling F, Kang B, Sun XH. Id proteins: small molecules, mighty regulators. Curr Top Dev Biol. 2014;110:189–216. doi:10.1016/B978-0-12-405943-6.00005-1
42. Dos Santos G, Rogel MR, Baker MA, et al. Vimentin regulates activation of the NLRP3 inflammasome. Nat Commun. 2015;6:6574. doi:10.1038/ncomms7574
43. Li XH, Bi Z, Liu SS, et al. Antifibrotic mechanism of cinobufagin in bleomycin-induced pulmonary fibrosis in mice. Front Pharmacol. 2019;101021. doi:10.3389/fphar.2019.01021
44. Guo ZJ, Li SR, Zhang N, Kang QJ, Zhai HQ. Schisandra inhibit bleomycin-induced idiopathic pulmonary fibrosis in rats via suppressing m2 macrophage polarization. Biomed Res Int. 2020;20205137349. doi:10.1155/2020/5137349
45. Warburg O. On the origin of cancer cells. Science. 1956;123(3191):309–314. doi:10.1126/science.123.3191.309
46. Pfeiffer T, Schuster S, Bonhoeffer S. Cooperation and competition in the evolution of ATP-producing pathways. Science. 2001;292(5516):504–507. doi:10.1126/science.1058079
47. Vallee A, Lecarpentier Y, Vallee JN. Thermodynamic aspects and reprogramming cellular energy metabolism during the fibrosis process. Int J Mol Sci. 2017;18(12):2537. doi:10.3390/ijms18122537
48. Xie N, Tan Z, Banerjee S, et al. Glycolytic reprogramming in myofibroblast differentiation and lung fibrosis. Am J Respir Crit Care Med. 2015;192(12):1462–1474. doi:10.1164/rccm.201504-0780OC
49. Nigdelioglu R, Hamanaka RB, Meliton AY, et al. Transforming growth factor (TGF)-beta promotes de novo serine synthesis for collagen production. J Biol Chem. 2016;291(53):27239–27251. doi:10.1074/jbc.M116.756247
50. Steppan J, Ryoo S, Schuleri KH, et al. Arginase modulates myocardial contractility by a nitric oxide synthase 1-dependent mechanism. Proc Natl Acad Sci U S A. 2006;103(12):4759–4764. doi:10.1073/pnas.0506589103
51. Kitowska K, Zakrzewicz D, Konigshoff M, et al. Functional role and species-specific contribution of arginases in pulmonary fibrosis. Am J Physiol Lung Cell Mol Physiol. 2008;294(1):L34–45. doi:10.1152/ajplung.00007.2007
52. Guido C, Whitaker-Menezes D, Capparelli C, et al. Metabolic reprogramming of cancer-associated fibroblasts by TGF-beta drives tumor growth: connecting TGF-beta signaling with “Warburg-like” cancer metabolism and L-lactate production. Cell Cycle. 2012;11(16):3019–3035. doi:10.4161/cc.21384
53. Deed RW, Bianchi SM, Atherton GT, et al. An immediate early human gene encodes an Id-like helix-loop-helix protein and is regulated by protein kinase C activation in diverse cell types. Oncogene. 1993;8(3):599–607.
54. Langlands K, Yin X, Anand G, Prochownik EV. Differential interactions of Id proteins with basic-helix-loop-helix transcription factors. J Biol Chem. 1997;272(32):19785–19793. doi:10.1074/jbc.272.32.19785
55. Nakatsukasa H, Zhang D, Maruyama T, et al. The DNA-binding inhibitor Id3 regulates IL-9 production in CD4(+) T cells. Nat Immunol. 2015;16(10):1077–1084. doi:10.1038/ni.3252
56. Zhao YD, Yin L, Archer S, et al. Metabolic heterogeneity of idiopathic pulmonary fibrosis: a metabolomic study. BMJ Open Respir Res. 2017;4(1):e000183. doi:10.1136/bmjresp-2017-000183
57. Weckerle J, Picart-Armada S, Klee S, et al. Mapping the metabolomic and lipidomic changes in the bleomycin model of pulmonary fibrosis in young and aged mice. Dis Model Mech. 2022;15(1). doi:10.1242/dmm.049105
58. Hipkiss AR, Cartwright SP, Bromley C, Gross SR, Bill RM. Carnosine: can understanding its actions on energy metabolism and protein homeostasis inform its therapeutic potential? Chem Cent J. 2013;738. doi:10.1186/1752-153x-7-38
 © 2023 The Author(s). This work is published and licensed by Dove Medical Press Limited. The full terms of this license are available at https://www.dovepress.com/terms.php and incorporate the Creative Commons Attribution - Non Commercial (unported, v3.0) License.
By accessing the work you hereby accept the Terms. Non-commercial uses of the work are permitted without any further permission from Dove Medical Press Limited, provided the work is properly attributed. For permission for commercial use of this work, please see paragraphs 4.2 and 5 of our Terms.
© 2023 The Author(s). This work is published and licensed by Dove Medical Press Limited. The full terms of this license are available at https://www.dovepress.com/terms.php and incorporate the Creative Commons Attribution - Non Commercial (unported, v3.0) License.
By accessing the work you hereby accept the Terms. Non-commercial uses of the work are permitted without any further permission from Dove Medical Press Limited, provided the work is properly attributed. For permission for commercial use of this work, please see paragraphs 4.2 and 5 of our Terms.