Back to Journals » Psychology Research and Behavior Management » Volume 16
The Symptom Network Structure of Teachers’ Burnout and Its Connection to Psychological Capital
Authors Xue D, Sun B, Li W, Zhou H, Ding F, Xiao W ![]()
Received 18 May 2023
Accepted for publication 23 August 2023
Published 31 August 2023 Volume 2023:16 Pages 3503—3518
DOI https://doi.org/10.2147/PRBM.S421932
Checked for plagiarism Yes
Review by Single anonymous peer review
Peer reviewer comments 2
Editor who approved publication: Professor Mei-Chun Cheung
Danni Xue,1,* Binghai Sun,1,* Weijian Li,1 Hui Zhou,2 Fujun Ding,1 Weilong Xiao1,3
1School of Psychology, Zhejiang Normal University, Jinhua, 321004, People’s Republic of China; 2Jinhua Advanced Research Institute, Jinhua, Zhejiang, 321004, People’s Republic of China; 3Research Unit Occupational & Organizational Psychology and Professional Learning, KU Leuven, Leuven, 3000, Belgium
*These authors contributed equally to this work
Correspondence: Fujun Ding, School of Psychology, Zhejiang Normal University, 688 Yingbin Road, Jinhua, 321004, People’s Republic of China, Email [email protected]
Background: Teacher burnout is characterized by emotional and physical exhaustion resulting from excessive work-related stress. Previous research based on traditional latent variable theory has revealed a significant negative relationship between TB and psychological capital (PsyCap). This study explored the complex symptoms of TB and the contact points of PsyCap in reducing TB using psychometric network analysis.
Methods: A total of 3991 teachers completed the burnout subscale of the Professional Quality of Life and Psychological Capital Scale.
Results: The results showed that: (a) In the TB network, the core symptoms displayed by teachers due to burnout are difficulty feeling “I am a very caring person”, “I am happy”, and “I am the person I always wanted to be”; (b) The TB-PsyCap network was closely connected, and the symptoms affected each other. PsyCap affected the TB network through “I feel optimistic and happy almost every day” and “I often feel that there is a future as a teacher”; (c) PsyCap’s bridge symptoms had a negative impact on TB, and PsyCap may reduce TB primarily through optimistic, hopeful dimensions.
Conclusion and Implications: Psychometric network analysis helps us understand the complex symptoms of TB and the contact points of PsyCap in reducing TB. This study offers valuable insights into the prevention of, and intervention in, burnout within the teaching community.
Keywords: teacher burnout, psychological capital, network analysis, network comparison
Introduction
School teachers are widely acknowledged as a vulnerable workforce, since they commonly experience negative emotions, particularly burnout.1 In secondary schools, a significant number of teachers report moderate-to-high levels of burnout, with 28.1% experiencing severe emotional exhaustion.2 The detrimental impact of burnout on teachers is evident in various aspects of their professional lives, including job performance, workforce retention, and student learning and achievement.3 Specifically, burnout diminishes teachers’ job satisfaction, commitment, and ability to provide adequate emotional and academic support to their students.3 Moreover, it has been identified as the primary contributory factor when it comes to teachers’ intentions to leave the profession within the relatively short period of five years.1 These findings underscore the urgent need to address burnout among teachers comprehensively and effectively.
The traditional latent variable theory has served as the basis of most studies on teacher burnout (TB); the aforementioned theory sees the symptoms of burnout as resulting from potential common factors, and uses the total score to explain the severity of the burnout, with equal importance assigned to each item (symptom) and no attention given to the interaction between symptoms.4 However, psychometric network analysis (PNA), which is based on dynamic system models, provides a more recent perspective for determining the internal mechanisms of TB. By constructing a model with nodes, and edges between those nodes, PNA can visually describe the complex relationships between internal nodes. Despite its potential, there has been a lack of exploration when it comes to the systemic characteristics of TB. The current study aimed to address this gap by using PNA to explore the complex symptoms of TB.
Developing effective strategies to reduce burnout among teachers is crucial for educational administrations. Previous studies have consistently found that enhancing psychological capital (PsyCap) effectively reduces burnout.5,6 Although many studies have indicated that certain aspects of burnout, such as emotional exhaustion and depersonalization, are significantly and negatively influenced by PsyCap,7 most have relied on traditional latent variable models.6,8,9 However, the use of traditional approaches poses limitations when analyzing TB and PsyCap, since they are multidimensional constructs with complex interrelationships. These conventional methods do not allow for a comprehensive examination of the individual components or symptoms within each construct or their interconnectedness. Consequently, valuable information on specific dimensions and their influence may be overlooked, thereby limiting our understanding of the intricate nature of TB and PsyCap. As such, it is essential to explore alternative methods that can capture the multidimensionality and interplay of these constructs – such as PNA, which allows for the examination of both direct and indirect relationships between TB and PsyCap – so as to gain a more comprehensive and nuanced understanding of their dynamics.
Through investigating the “contact points” of the TB-PsyCap network in this study, we can enhance our understanding of the relationships between specific symptoms or resources and their impact on burnout and mental health. These “contact points” elucidate the crucial links or characteristics that generate effects or interactions, forming a basis for further uncovering the internal mechanisms behind TB. This deeper insight enables us to understand how specific symptoms contribute to the development of TB and how PsyCap functions as a protective factor. Currently, the interventions targeting TB lack precision and effectiveness. Nevertheless, by identifying these “contact points”, precise and efficient intervention programs can be developed that provide accurate targets for professionals in the field, including researchers and management. Moreover, once we have identified the central nodes in the network and the “contact points” of the relevant networks, we can take proactive measures to target the most influential symptoms and strengthen the key psychological resources which are crucial to teachers’ mental health and well-being.
Literature Review
Burnout can occur in many professions; however, teachers are particularly susceptible.10 Teachers are at risk of burnout because teaching requires considerable investment (eg, time and psychological resources).11 In a Gallup study, 44% of K–12 educators reported feeling burned out frequently or constantly. According to a meta-analysis of studies,12 burnout among teachers in China increases annually. Several studies support the notion that burnout among teachers has been demonstrated to have harmful effects, including teacher absenteeism,13 turnover intention,14 psychological health problems,15,16 less enthusiasm for teaching,17 and attrition cognition.18
Since TB has become a global issue,19,20 many researchers, school administrators, and teachers themselves have focused on finding ways to successfully reduce TB.8,21 Scholars have found that teachers’ psychological characteristics significantly affect burnout.22 Previous studies have shown that improving psychological capital (PsyCap) is a useful strategy when it comes to preventing burnout.5 For example, Zhao et al found that enhancing teachers’ PsyCap may be effective in helping them to reduce their burnout, possibly because PsyCap acts as an essential personal resource for alleviating burnout.6 Lei et al argued that universities should seek to increase teachers’ PsyCap, which may be a way of reducing burnout by buffering role conflicts.23
PsyCap denotes the positive psychological state or capacity which individuals develop during their personal growth and development process.24 For teachers, it also refers to their internal job-related resources.8 In this article, PsyCap is defined as the personal positive psychological resource which can assist teachers in coping with challenges and achieving their goals. PsyCap can be measured, developed, and managed to improve performance.25 It comprises four characteristics: self-efficacy, optimism, hope, and resilience.26 Many studies have revealed that PsyCap is a positive and valuable resource that promotes job satisfaction and job performance.27–30
PsyCap is a defense mechanism against unfavorable employee outcomes such as resignation plans and pessimism.31 Based on the Job Demands-Resources (JD-R) model, employees who are stressed at work may experience emotional exhaustion.32 When teachers feel exhausted or burned out due to job demands, they can protect themselves by mobilizing their positive resources (PsyCap) as a coping mechanism. Job resources involve organizational, social, and physical aspects that not only help to achieve job goals, but also to reduce the psychological costs associated with job demands and promote employee growth and development.33 PsyCap is a personal resource related to how people believe they can influence their work.34 Teachers with high PsyCap may feel that they have more control over their work and work environment, and are better able to meet the demands of their job, thus increasing the likelihood of them being able to personally cope with burnout.
A large body of research supports the idea that PsyCap reduces teacher burnout. Makhdoom et al argued that TB is an occupational health issue and that improving personal resources (PsyCap) may help to address the negative relationship between educators and burnout in the country’s higher education institutions.35 For instance, a recent meta-analysis by Loghman et al (254 independent samples, over 96,000 participants), which investigated 244 studies, revealed that PsyCap was negatively associated with burnout.36 Several earlier studies confirmed these connections in teacher communities (eg,37).
PNA
The traditional view of statistics assumes that the relationships between observed variables are explained by the underlying latent variables. Latent variables are unobserved constructs representing abstract concepts or traits. These latent variables are believed to cause the correlations or relationships observed among the measured variables. From this perspective, the measured variables are considered indicators of the underlying latent variables. Network models offer a more straightforward and intuitive representation of the relationships between observed variables. They do not rely on reducing the dimensionality of the data or assuming the presence of latent constructs. Instead, they focus on visualizing and understanding the direct connections between variables. In network models, the emphasis is on identifying the direct connections between variables, which can provide insights into the underlying structure and dynamics of the variables of interest. PNA is an innovative statistical technique that effectively captures the intricate relationships between mental structures at the granular component level.38 In PNA, nodes are psychological variables such as emotional states or symptoms.39 PNA assumes that nodes (eg, symptoms or other psychopathological features) cluster together because they may have certain reciprocal interactions. These connections are referred to as “edges” in network research,40 and the weight of an edge represents the strength of the association between two nodes. Comparing PNA to the traditional latent variable approach before using PNA itself can help us to better understand the latter method. A latent variable model can be used to conceive of TB as something in a person that results in symptoms such as inefficiency, sleepiness at work, exhaustion, and overload. However, no test can truly ascertain whether an individual is experiencing burnout. Using an analogy, medicine can identify disease-causing microbes under a microscope to determine whether they are causing the disease. However, the complex psychological structure makes it difficult to use a similar approach to determine whether teachers experience burnout. The network model does not rely on such an assumption (ie, some underlying problems or potential variables cause symptoms, such as fatigue and difficulty with load). Instead, TB is now thought of as a network of various symptoms, or “nodes”, that interact and have an impact on one another in real time.
From a network perspective, PNA can provide considerable insights into TB symptoms. It can be used to effectively investigate multicollinearity and predictive mediator.41 Furthermore, the benefit of using PNA is that networks can directly observe and study the relationships between nodes. Only a few studies have used social network analysis to understand TB and explore the factors associated with burnout transmission (eg,42). However, understanding of TB from the perspective of PNA remains unclear. This study aimed to use PNA to visualize and explain the core symptoms of TB and to examine whether and how PsyCap impacts TB. If we can better capture the core symptoms of TB and elucidate the link between PsyCap and TB, this could lead to more successful and beneficial interventions. Previous research may have overlooked the unique relationship between different components of PsyCap and burnout. Using PNA, the present study aimed to examine this issue.
Current Study
The PNA method is used to clarify the component-level connections between PsyCap and TB. The current study had two aims: (1) to apply PNA to explore the complex symptoms of TB, and (2) to explore the contact points of teachers’ PsyCap in reducing TB and provide a research foundation for subsequent precise clinical intervention. To some extent, the current study increases our understanding of TB at the component level. This can help develop effective strategies to reduce TB in educational management.
Method
Participants
This study recruited 3991 teachers. No additional inclusion or exclusion criteria were applied. Notably, we only analyzed teachers who experienced professional burnout, resulting in a final sample size of 1729. These teachers were all from Zhejiang Province, China. The mean teaching experience of the participants was 17.70 years (SD = 10.94), and their mean age was 38.34 years (SD = 8.61); however, information on the age of eight (0.46%) teachers was missing. The final sample included 541 male (31.30%) and 1188 female (68.70%) teachers. Additionally, 1456 teachers (84.20%) majored in teaching programs and 273 (15.80%) majored in non-teaching programs.
Measures
Burnout was measured using the Professional Quality of Life Scale (ProQOL) subscale, which was developed by Stamm et al and revised by Chen et al for the nurse group, and by Yu et al for the teacher group.43–45 This subscale consists of 10 items rated on a 5-point Likert scoring system ranging from 1 (never) to 5 (very often). Half of the items were scored using reverse scoring, and the items included were: (1) “I am happy” (Item 1); (2) “I feel connected to others” (Item 2); (3) “I have beliefs that sustain me” (Item 5); (4) “I am the person I always wanted to be” (Item 6); and (5) “I am a very caring person” (Item 10). The Chinese version of the subscale has high validity and reliability in Chinese samples (eg,45). The Cronbach’s α coefficient of this subscale was 0.88.
The Psychology Capital Scale assesses teachers’ PsyCap.37,46 This scale consists of 19 items divided into four components. The four factors were hope (four items, eg, “Right now, I am actively achieving the goals I set for myself”), optimism (five items, eg, “I always think in the good direction for the uncertain results in my work”), resilience (six items, eg, “I’m often overwhelmed when I’m having trouble teaching’”, and confidence (four items, eg, “I am very confident in my teaching abilities”). Notably, the scale uses a 6-point Likert scoring system, with reversal scores for items 2, 3, 7, and 10. Each statement received responses ranging from 1 (strongly disagree) to 6 (strongly agree). High levels of validity and reliability have been reported for this scale in China.47,48 In the current study, the Cronbach’s α value was 0.92.
Procedure
The study was approved by the Ethics Committee of the local university and adhered to the principles of the Declaration of Helsinki, ensuring ethical conduct of the research. The study protocol was assigned code No. ZSRT2021012, and received official approval on March 15, 2021. Prior to participating in the experiment, all respondents provided written informed consent, demonstrating their willingness to take part in the study. No incentives, bonuses, or rewards were offered to the participants for their involvement. Data collection was conducted through an online survey platform, similar to the Qualtrics Online Sample, specifically tailored to the Chinese context and operated by a reliable organization, namely Credamo (www.credamo.com). To guarantee confidentiality and anonymity, the participants were assured that their responses would be treated with strict confidentiality and used exclusively for academic research purposes. The online survey encompassed various research enquiries, including demographic information, and took participants approximately 19 minutes to complete. Data collection occurred in November 2021.
Statistical Analysis
For every questionnaire item, all the data was present. Before analyzing the data, we tested kurtosis and skewness to examine the data distribution patterns. Following the recommendations of Epskamp et al, four steps were performed to estimate and evaluate the network of TB symptoms.41 R (version 4.2.2 in RStudio 2022.12.0+353) was used to compare the networks and estimate their structures, while descriptive statistical tests were conducted using SPSS version 26.0.
Estimating the Network
The Gaussian graphical model (GGM) is a statistical model used to represent dependencies between variables in multivariate data. The authors recommended using the GGM when the data followed a multivariate normal distribution,39 because its edges could be easily interpreted as partial correlation coefficients.49 In this study, we employed the graph package to estimate a regularized GGM that integrates the Graphical Lasso (a statistical method used for estimating inverse covariance matrices in high-dimensional data) and Extended Bayesian Information Criterion model selection methods (a model selection criterion that is used in statistical modeling to determine the best-fitting model among a set of candidate models).50 The expected network structure was determined using the EBIC glasso function, which allowed us to eliminate small partial correlations from the network using the “least absolute shrinkage and selection operator” (LASSO).51 The tuning parameter in the LASSO was selected by minimizing the EBIC.52 For this study, a hyperparameter value of 0.5 was set based on the findings of Foygel and Drton.53
In a GGM, the absence of an edge between two variables indicates conditional independence, suggesting that their relationship can be explained by the intermediate variables in the network. Conversely, the presence of an edge indicates a direct dependency between variables. The thickness of an edge, which represents the estimation of the partial correlation coefficient indicating the correlation between two nodes while controlling for all other nodes, can be considered as the strength of the association. The positive and negative edges are represented by green and red lines, respectively.
Estimating Centrality
Centrality indices play a crucial role in network analysis, enabling researchers to understand the significance and impact of individual nodes in a network and facilitating informed decision-making and strategic planning. Various centrality indices were considered, namely strength, closeness, betweenness, and expected influence. We utilized the centrality plot function in the graph package to calculate the centrality indices.54 Centrality of strength is the key index used in this section to measure the importance of nodes within a network. Strength centrality refers to the number of non-zero edges that a node has in the network. Nodes with higher centrality counts are considered more prominent within the network.49 The betweenness centrality measures the frequency with which a node acts as a bridge for the shortest path between other nodes. It reflects the role and influence of a node or edge on the entire network. The definition of betweenness centrality is based on the percentage of total shortest paths that circumvent the node.55 Closeness centrality is the inverse sum of the shortest pathways in which a node is involved. In PNA, nodes with a higher closeness centrality tend to have a higher frequency of short pathways passing through them.56 The expected influence centrality considers weighted networks that account for both positive and negative relationships between nodes. It is calculated as the sum of the edge weights and aims to assess the overall influence of a node on the network and its potential role in network activation, persistence, and remission.57 The relative importance of a given node to other nodes in a network is revealed by centrality indices.58
Network Accuracy and Stability
We calculated the accuracy and stability using the Bootnet package. First, 95% confidence intervals (CI) with non-parametric bootstrapped samples were used to assess edge weight accuracy.49 Narrower CIs suggest a more accurate edge calculation. Second, case-dropping subset bootstrapping (with replacement and 1000 bootstrapped samples) can be used to evaluate centrality stability.49 Between the centrality indices in the initial sample and the subset centrality based on various subsets of the initial samples (eg, 95% of the sample, 25%, etc.), various correlation values were obtained.49,56 The node centrality stability should ideally be above 0.5 for interpretability and stability, using the correlation stability coefficient (CS-coefficient), which was utilized to characterize node centrality stability.49,59 Finally, bootstrap difference tests were used to determine whether the centrality indices of the nodes varied considerably.
Results
Accuracy and Stability of the Network
The accuracy and stability of our network were evaluated by assessing the edge-weight accuracy and centrality stability, in addition to and looking out for statistically significant variations among centrality indices. Initially, 95% bootstrapped CIs were used to assess the edge-weight accuracy. As shown in Figure 1, a significant amount of bias is implied by the comparatively large bootstrapped CIs, since they suggest more variability in the calculation of edge weights. Greater CIs indicate a wider “shaded area” surrounding the mean bootstrapped estimated edge weights (black line), which leads to decreased confidence in the “correctness” of calculating the edge weights between pairs of specific nodes.49,60 Next, we applied a case-dropping subset bootstrap to calculate the correlation stability (CS) coefficient. To maintain a correlation of 0.7 for at least 95% of the sample, the CS coefficient (correlation = 0.7) is the maximum percentage of sample instances that can be omitted from the initial full set of cases.61 The results are shown in Figure 2, which displays the outcomes. Additionally, we employed a bootstrap differential test to evaluate variations in network features (namely variations in edge weights and node strengths).49 Finally, and as per Epskamp et al, CS coefficients above 0.70 indicate the maximum acceptable level of sample reduction, with a CS coefficient above 0.50, which is acceptable, and a minimum of no less than 0.25.41 Our results showed that strength = 0.67, closeness = 0.52, and betweenness = 0.52 of the CS coefficients, thus indicating that the network’s overall stability was good. The results are shown in Appendix Figures 1 and 2.
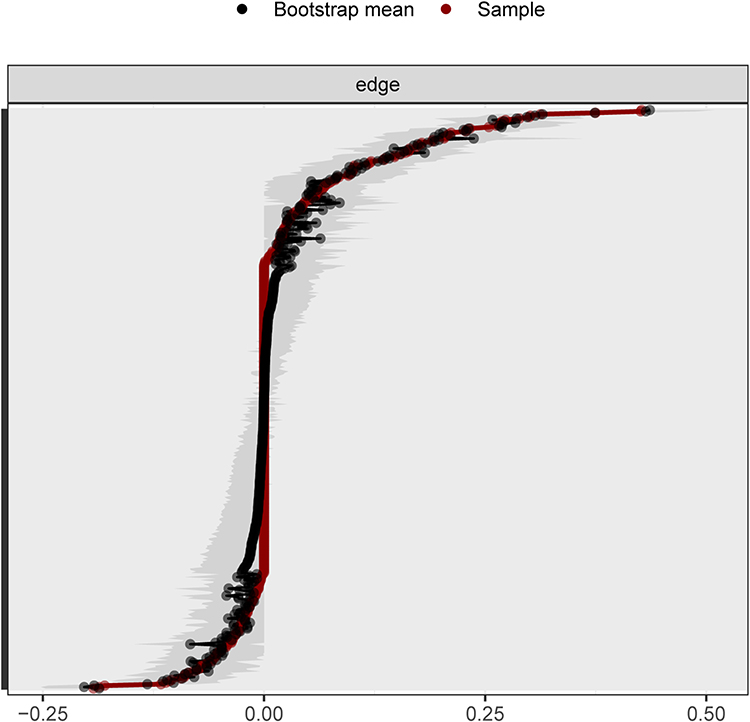 |
Figure 1 The accuracy and stability of the burnout and PsyCap symptom network are displayed together with the confidence intervals (CIs) of the guided edge weights estimated. The red line represents the sample value, and the gray area represents the CI. The black line represents the mean edge weight estimated by bootstrap. The x-axis represents the estimated edge weight coefficient, and the y-axis represents each estimated edge weight of the network, ranked from the highest to the lowest average guided edge weight. |
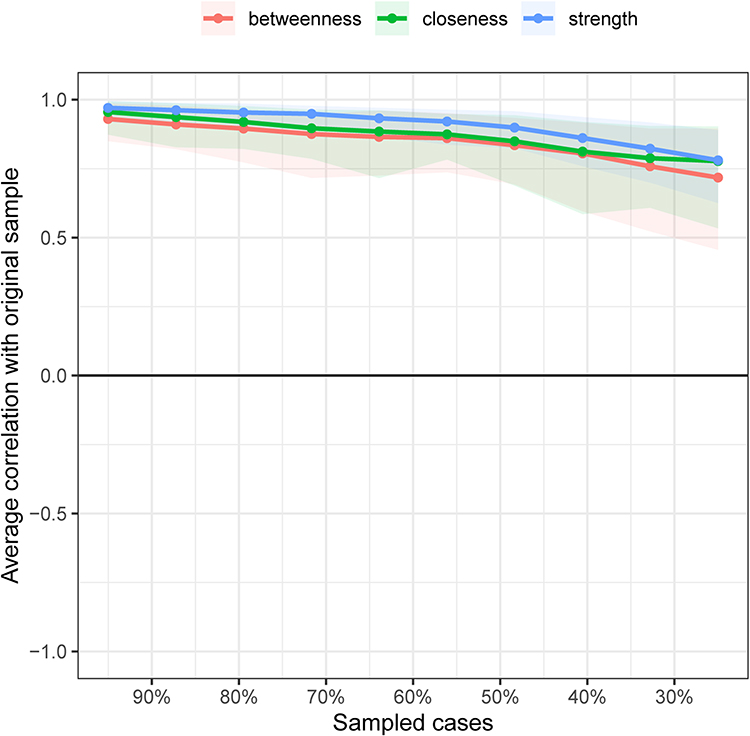 |
Figure 2 Stability of centrality indices by case dropping subset bootstrap. The x-axis displays the percentage of cases removed at each step. The y-axis shows the average correlation between centrality indices from the original network and the re-estimated networks after dropping an increasing percentage of cases. The color-coded regions indicate the 95% CI. |
Estimating the Network
As per the network analysis research by Di Fabio et al, the range of skewness and kurtosis thresholds we adopted is also −1 to 1.62 The results show that the skewness and kurtosis of PsyCap 1, 11, and 15 deviated slightly from this range, and the skewness of PsyCap 12 deviated slightly from this range. However, all other items and two means were within the threshold range, indicating that the degree of departure from normality was within an acceptable range. The test results for skewness and kurtosis are presented in Appendix Tables 1a and b. Additionally, Q-Q plots have been helpful in this regard.63 Graphical inspection revealed that the data closely approximated a normal distribution. The plots are shown in Appendix Figure 3.
To investigate the interrelationship between TB symptoms and to explore the points of influence where PsyCap affects the network structure, we computed a regularization network using 10 TB items and 19 PsyCap items. The network generated 406 edges, which were calculated as 29*(29–1)/2. Network estimation revealed 190 non-zero edges present within the network itself. Table 1 shows each TB item and its symptom clusters. Using multidimensional scaling (MDS), highly-correlated nodes appear close together, whereas weakly correlated nodes are far apart.64 Appendix Figures 4 and 5 showed that burnout symptoms 1, 2, 5, 6, and 10 were closely clustered, indicating a strong relationship between these symptoms. This suggests that teachers experiencing burnout tend to feel suppressed and isolated, lack belief, and gradually become indifferent to their goals. Burnout symptoms 3, 4, 7, 8, and 9 were highly correlated, representing the typical manifestations of TB. PsyCap symptoms 2, 3, 5, 7, 9, and 10 clustered together, implying that teachers with lower PsyCap often struggle to cope with teaching challenges. They lack confidence in their work and are pessimistic about their futures as teachers.
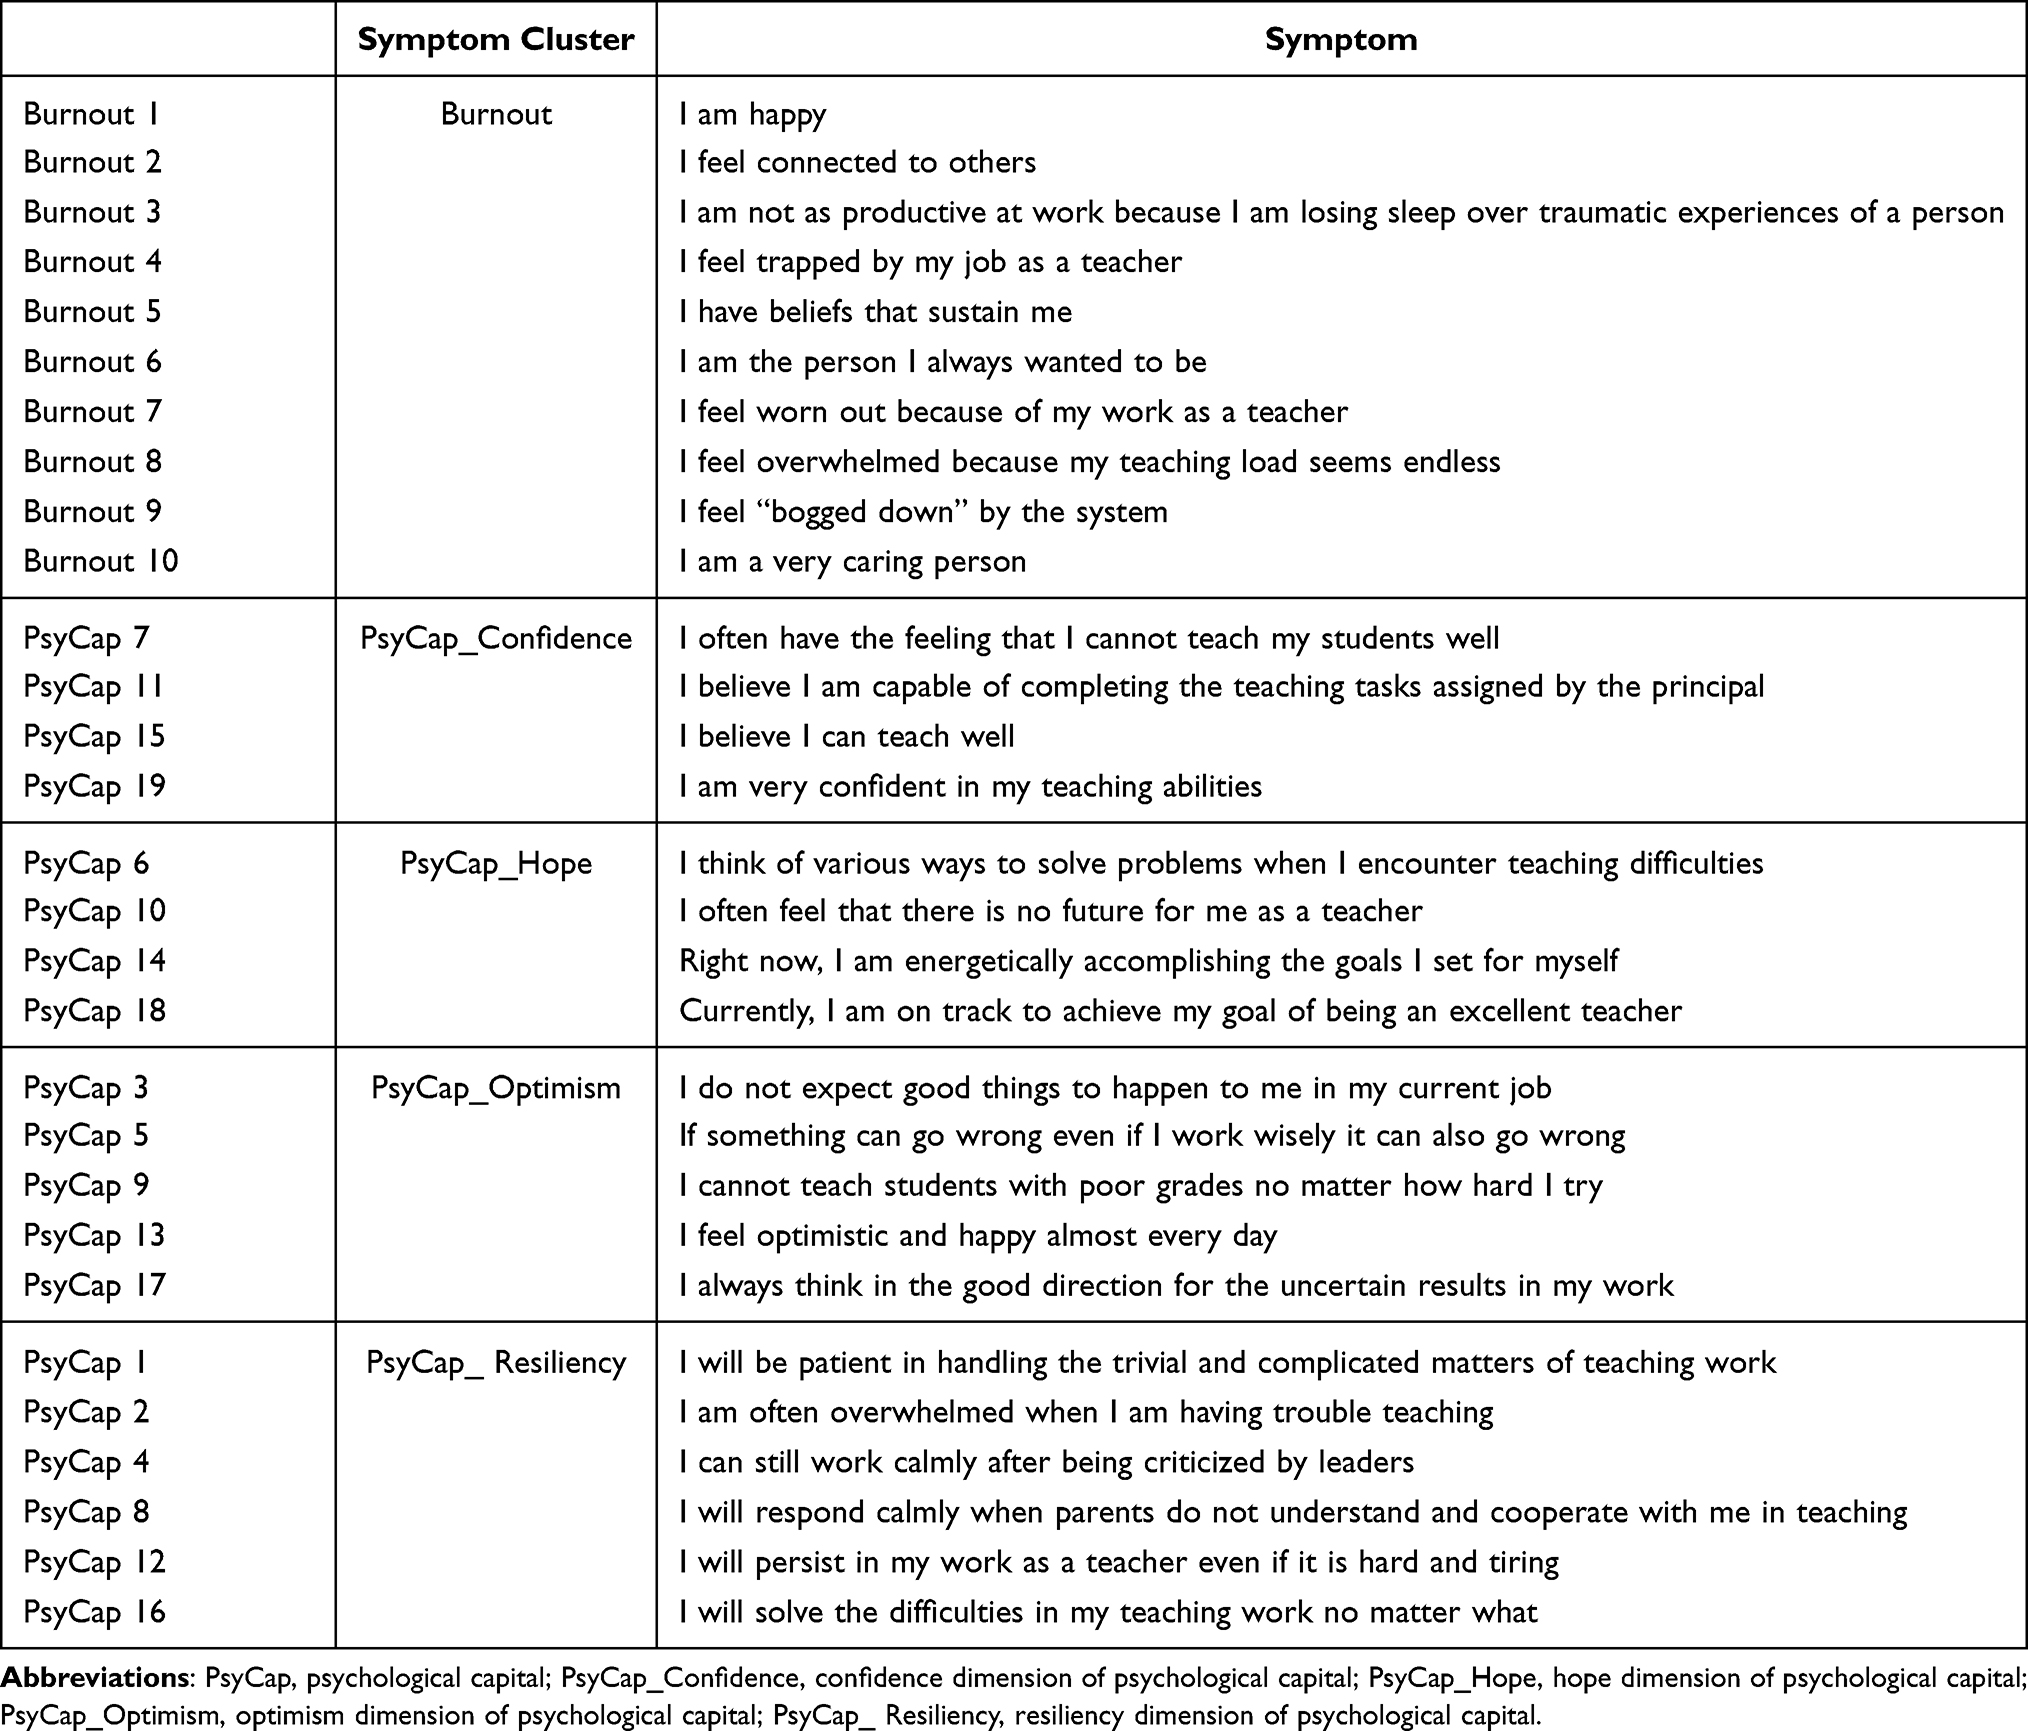 |
Table 1 Network Nodes of Burnout & PsyCap Symptoms |
As depicted in Figure 3, among the burnout symptoms, burnout 7, “I feel worn out because of my work as a teacher”, and burnout 8, “I feel overwhelmed because my teaching load seems endless”, had the highest strength connection. The next strongest connection was between burnout 1 (“I am happy”) and burnout 2 (“I feel connected to others”).
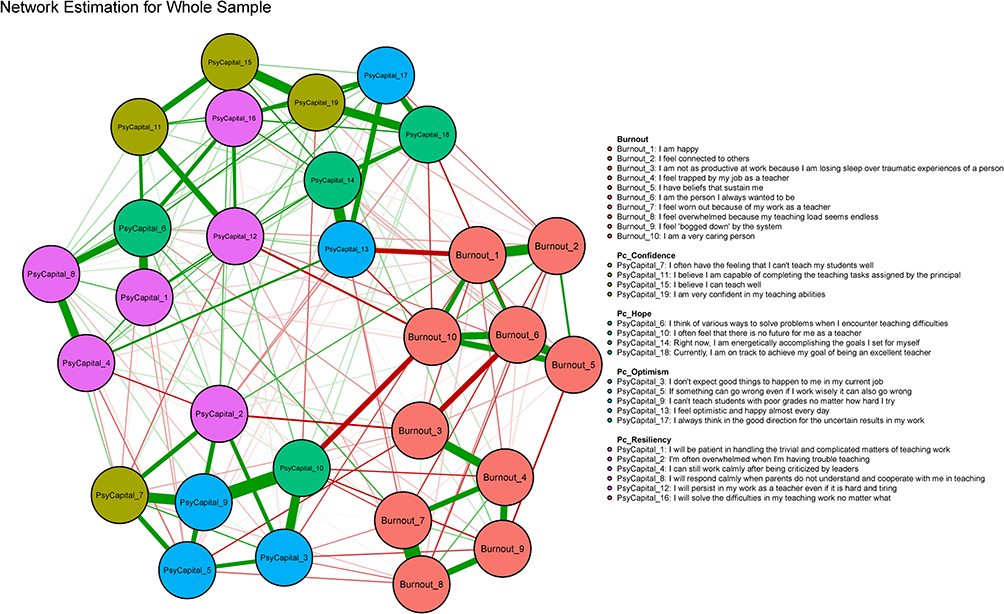 |
Figure 3 Network of burnout and PsyCap symptoms in the final sample (N = 1729). Nodes represent symptoms and edges represent partial correlations between symptoms. The thickness of the edges indicates the strength of partial correlation, and the color of the edges indicates the value of correlation (green = positive; red = negative). Symptoms belonging to the same symptom cluster are represented by the same color (red = burnout; earthy = PsyCap’s confidence dimension; green = PsyCap’s hope dimension; blue = PsyCap’s optimism dimension; rose = PsyCap’s resilience dimension). Detailed descriptions of the burnout and PsyCap items can be found in Table 1. |
As for the PsyCap symptoms, PsyCap 9, “I can’t teach students with poor grades no matter how hard I try”, and PsyCap 10, “I often feel that there is no future for me as a teacher”, were the most closely connected.
PsyCap symptoms were closely related to burnout symptoms and various other symptoms interacting with each other. In the PsyCap and burnout symptom cluster network, the strongest correlations were found between PsyCap 10, “I often feel that there is no future for me as a teacher”, and Burnout 10, “I am a very caring person”, followed by Burnout 1, “I am happy”, and PsyCap 13, “I feel optimistic and happy almost every day”, all of which were negative.
Centrality Indices
In the PNA, we performed a centrality estimation to produce centrality indices that characterized the general connection between individual symptoms. The estimates of the strength, closeness, betweenness, and expected influence of the centrality indices are presented in Figure 4. Taking strength into account, PsyCap 16, “I will solve the difficulties in my teaching work no matter what”, PsyCap 15, “I believe I can teach well”, and PsyCap 10, “I often feel that there is no future for me as a teacher”, had the highest strength centrality, which indicated that these three affected TB the most. Taking closeness into account, burnout 10, “I am a very caring person”, and burnout 6, “I am the person I always wanted to be”, had the highest closeness centrality, which indicated that other symptoms could swiftly be affected by them. Taking betweenness into account, burnout 10, “I am a very caring person”, had the highest betweenness centrality, which indicated that this served as a crucial link between the various symptoms and was considered a bridging symptom. Given the expected influence, PsyCap 16, “I will solve the difficulties in my teaching work no matter what”, and PsyCap 15, “I believe I can teach well”, were the nodes taking both the positive and the negative associations that had the highest sum of edge weights; this implied that PsyCap symptoms might enhance the risk of other TB symptoms potentially being triggered.
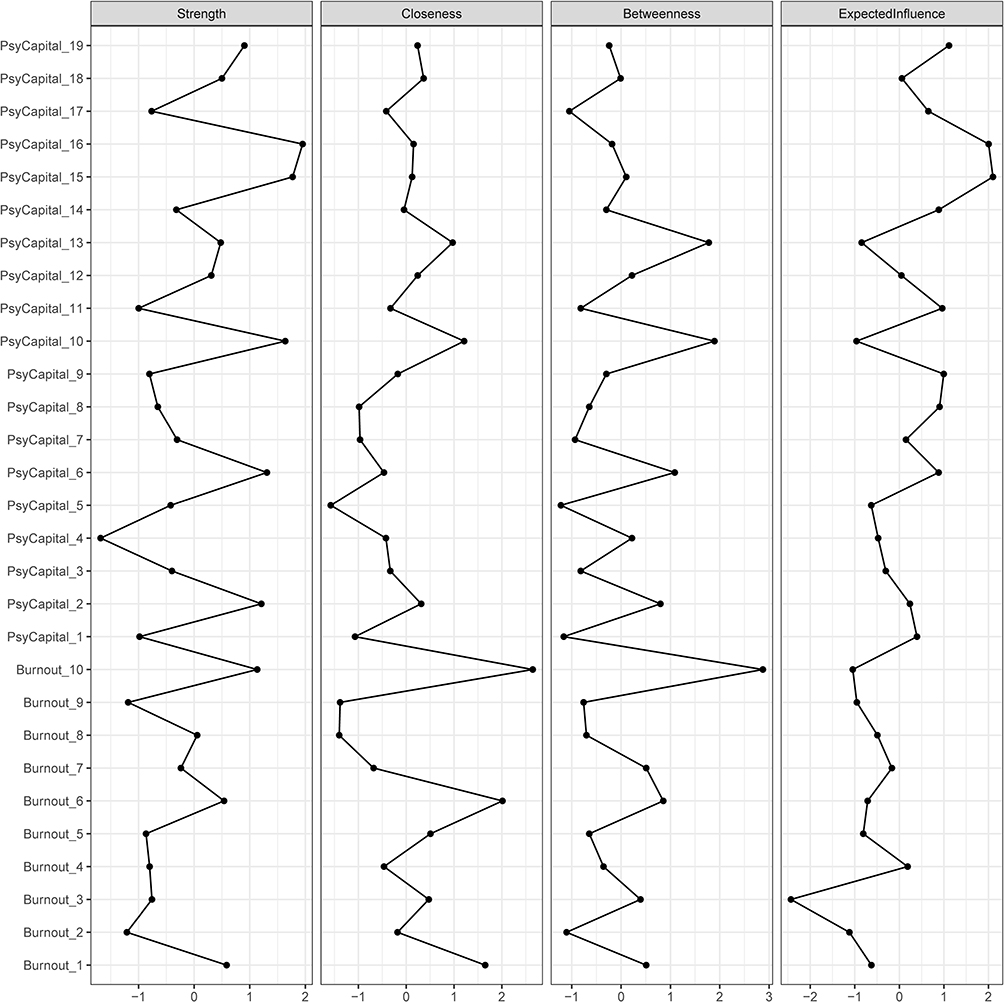 |
Figure 4 Standardized centrality estimation of burnout and PsyCap symptoms in the total sample (N = 1729). The corresponding burnout and PsyCap items for each node are shown in Table 1. |
Discussion
TB has garnered significant attention in recent years. This study is the first attempt to investigate the interrelationships between the core symptoms of TB and the relationship between PsyCap and TB using a PNA approach. Eventually, 1729 teachers suffering from burnout symptoms participated in the study, and the results revealed a close association between TB and PsyCap, with symptoms reciprocally influencing each other. The symptom cluster of PsyCap, characterized by items such as “I feel optimistic and happy almost every day” and “I often feel that there is no future as a teacher”, exerted a negative impact on the TB symptom cluster via “bridge symptoms”. These findings offer critical insights into the prevention of, and intervention in, TB, while also highlighting the need for interventions that address the interrelationships between TB symptoms and PsyCap.
Core Symptoms of TB
The PNA results indicated that “I am a very caring person” was a core symptom of TB. As the item was reverse-scored, one of the core symptoms of TB was that teachers started to become less caring, which is in line with previous research on caring in the teaching profession. For instance, a study conducted by Brown and Biddle discovered that, akin to other helping professions, teachers bear the burden of caring in their work.65 Society typically perceives teaching as a compassionate profession, and this societal expectation can profoundly impact teachers’ emotional management in the workplace.66 To fulfill their caring responsibilities as educators, they must engage in significant emotional labor while maintaining a balance with the professional demands of daily teaching.67 Alwi forwarded the belief that teachers must adapt to students’ needs and time-consuming resources.68 Burnout is the ultimate stage of resource depletion,69 where teachers’ resources become depleted but their inability to recover quickly may lead them to become depressed, progressively apathetic, and bored with their work.
The other two core symptoms of TB were “I am happy” and “I am the person I always wanted to be”. Notably, both items were reverse-scored, representing the core characteristics of TB as the teacher’s unhappiness and difficulty in becoming the person he or she wants to be. Our findings echo those of previous research on teachers’ well-being at work and self-efficacy. For example, De Stasio et al found that teachers’ happiness at school was inversely related to all dimensions of burnout; in other words, when employment became unpleasant, unfulfilling, and unrewarding, burnout progressively developed.70,71 Furthermore, Hussain et al suggested that the experience of failure strongly reduces self-efficacy.72 Low teacher self-efficacy may lead to burnout.73 Teachers with the same sense of professional identity as teachers had a higher sense of self-efficacy; they had more resources to cope with pressures from school, family, and society,74 meaning that when teachers were chronically depressed and unable to achieve what they wanted, self-efficacy was lower and they were likely to be at a high risk of burnout.
Bridge Symptoms of TB-PsyCap Network
The relative essentials of various PsyCap symptoms within larger psychological networks have been evaluated using centrality indices.56 According to the results of our PNA, the symptom with the highest strength centrality, namely “I will solve the difficulties in my teaching work no matter what”, belonged to the PsyCap resilience symptom cluster, and the “I believe I can teach well” symptom belonged to the PsyCap confidence symptom cluster. The two symptoms mentioned above had the highest strength centrality in the PsyCap symptom cluster, implying their most severe impact on teachers.
The findings across the TB-PsyCap symptom network suggest that the individual symptoms of TB and PsyCap are not equally important. The links between the symptoms of the same TB-PsyCap network were strong. Furthermore, the symptoms that connected TB and PsyCap were known as bridge symptoms, and in this study, the most important bridge symptom that connected TB-PsyCap symptoms was “I often feel that there is no future for me as a teacher” (PsyCap 10) – “I am a very caring person” (burnout 10). This was followed by “I feel optimistic and happy almost every day” (PsyCap 13) and “I am happy” (burnout 1). The results implied that nodes PsyCap 10, PsyCap 13, burnout 10, and burnout 1, which linked TB and PsyCap, were likely significant channels for the interaction between TB and PsyCap symptoms. Since items PsyCap 10 and burnout 10 were reverse-scored, a significant negative correlation between PsyCap 10 and burnout 10 meant that “I often feel that I have a future as a teacher” positively influenced the teacher group’s “I am a very caring person”. Conversely, item PsyCap 10 belonged to the “hope” dimension, when teachers believe that they have a bright future as a teacher; indeed, this is a sign that they have hope for the teaching profession. Hopeful people have more energy to achieve their goals and enjoy actively participating in their jobs.75 With this said, only caring and well-educated teachers can satisfactorily cope with the demands of developed societies in the education system.76 At present, however, there is little research on whether teachers’ perceptions that their profession has good prospects contribute to their care. Based on our findings, future research should explore the relationship between these two factors.
The findings also revealed that “I often feel that there is no future for me as a teacher” (PsyCap 10) and “I feel optimistic and happy almost every day” (PsyCap 13) were core symptoms of the PsyCap network. Both symptoms describe teachers who are positive about their profession and are optimistic about teaching as a lifelong career in the future. Previous studies have also indicated that teachers’ professional optimism plays an important role in their success and longevity.77 Our findings are consistent with those of previous work. For instance, hope and optimism may reduce the risk.78,79 Ferradás et al showed that teachers with lower PsyCap scores, especially those who scored low in areas such as hope and optimism, showed the most pronounced emotional burnout and depersonalization.80 Our study suggests that the hope and optimism dimensions of PsyCap primarily influenced TB. Strengthening teachers’ expectations of the future and joy in reality may help to reduce TB.
TB-PsyCap Network from JD-R Model Perspective
Our findings indicate that educational professionals with higher PsyCap scores (positively correlated with optimism and positivity) may be less prone to TB. As suggested by the JD-R model theory,81 individuals facing high job demands can utilize work and personal resources as protective factors against TB. Teachers with high PsyCap may demonstrate greater adaptive abilities and employ positive coping strategies, enabling them to deal with job-related challenges and stress effectively. This further reinforces the importance of personal resources in JD-R theory. Therefore, abundant personal resources can significantly alleviate burnout.82 Furthermore, using a more flexible network analysis approach, our study also revealed the unique role of PsyCap in JD-R theory. Compared to traditional latent variable models, PNA allows researchers to explore diverse relationships between variables, including non-linear relationships and interdependencies. We found that PsyCap serves not only as a personal resource for alleviating work stress, but also assists teachers in actively addressing difficulties at work, providing a new perspective on the JD-R theory. Conversely, a lack of psychological resources (eg, lower PsyCap) increases the likelihood of burnout.
In addition, network analysis allows for an in-depth examination of specific relationships rather than attributing all relationships to a few latent factors. This helps identify and explain the relationships between individual variables more accurately, rather than categorizing them into broader latent categories. Our results highlighted the importance of focusing on the optimism and hope aspects of PsyCap. Teachers with optimistic attitudes often adopt proactive approaches to cope with the pressures and challenges encountered at work. They do not succumb to negative emotions, but actively seek solutions to problems. They also demonstrated good self-restraint and self-control, which contributed to achieving a better balance between job demands and personal needs, thereby reducing the risk of developing TB. Our work emphasizes a future research direction that can be further explored by investigating ways to enhance teachers’ PsyCap so that they can better cope with job demands. This provides a new avenue for future research on JD-R theory.
Implications
This study not only investigates the symptoms of TB from the perspective of PNA, but also reveals how PsyCap affects TB, with broad implications for clinical interventions aimed at TB. The network visually presents symptom-to-symptom interactions, and interventions targeting the central symptoms may be more effective because they play a primary role.83 Strength centrality receives more attention because it was the most stable in both this study and earlier network analyses.84 Different interventions can be used to treat different core symptoms of TB. For example, in response to teachers gradually ceasing to be “a very caring person”, numerous pieces of evidence, including those given by Troman, demonstrated the importance of commitment to “care”.85 Noddings forwarded the belief that an environment in which caring relationships could flourish should be the goal of all teachers and education policymakers, referring to dialogue as the basis for building caring and trusting relationships.86 Enabling teachers and students to communicate with each other and understand each other’s needs and problems promptly may help promote teachers’ concern for their students.
Teachers might well experience a sense of professional failure when their idealistic dreams do not align with their expectations of perfect professional performance, leading to TB.87 For teachers to feel that “I am the person I always wanted to be”, they must first identify with their profession. Fisherman suggests that a sense of professional identity could help reduce TB.88 Therefore, supporting teachers in achieving their professional goals and enhancing their professional identity may help alleviate TB. Additionally, based on our research findings and those of previous studies,89,90 enhancing PsyCap, especially by increasing dimensions such as optimism, hope, and teacher resilience, can be used as an intervention measure for TB. This may be because teachers who exhibit high levels of optimism and resilience are more flexible and adaptable to changing circumstances.91 Consequently, in the actual teaching process, teachers can be encouraged more if they are provided with appropriate feedback and rewards, making them hopeful and prompting them to develop a belief in their teaching abilities, which will enable them to overcome the obstacles they may encounter in the teaching process.
Limitations and Future Research
Our investigation provides new insights for understanding the causes of TB and interventions from a PsyCap perspective. Network analysis of a large sample of teachers identified several important symptoms of the interaction between TB and PsyCap. However, this study has certain limitations. The present findings must be interpreted in light of certain limitations. First, although our sample is representative of teachers in Eastern China, it may not be generalizable to other national or regional teacher groups. Future research should recruit more teachers from other countries and regions to improve the representativeness of the sample. Second, although the results indicate that “I often feel that there is no future for me as a teacher” has a negative impact on “I am a very caring person”, there exists little research on the relationship between the two; future studies will need to shed more light on this. Third, because this study used cross-sectional data, it was not possible to assume a causal relationship. However, correlation is a step in the correct direction to prove causality. Further research should address this issue through longitudinal data collection.
Conclusions
This study represents a pioneering effort to investigate the core symptoms of TB and the intricate relationship between teachers’ PsyCap and burnout using a network analysis approach. Our findings underscore the critical importance of considering the holistic framework of burnout and recognizing the “contact points” within the TB-PsyCap networks. The interconnected nature of these factors highlights the fact that burnout is a complex phenomenon influenced by various psychological resources represented by PsyCap. Therefore, any intervention aimed at addressing burnout among teachers must consider the multifaceted relationship between their psychological resources and the manifestation of burnout symptoms. Using PNA, we uncovered the systemic characteristics of burnout and identified the interplay between teachers’ PsyCap and burnout symptoms. This novel approach sheds light on the specific dimensions of PsyCap that significantly influence distinct TB symptoms, and offers valuable insights for designing precise interventions to support educators facing burnout.
First, educational institutions can use our findings to develop targeted strategies for bolstering teachers’ PsyCap in specific areas, ultimately mitigating burnout. Cultivating a supportive educational environment that promotes resilience and positive coping strategies could enhance teachers’ overall psychological well-being and job satisfaction. Second, our study provides valuable insights into the dynamic nature of burnout and potential interventions to prevent its escalation. Understanding the network structure of burnout enables identification of influential nodes, allowing for more efficient and effective intervention approaches.
Data Statement
Participants were assured that their questionnaire responses would be kept anonymous and used solely for academic research. Due to the sensitive nature of the questions, the collected data, which is confidential, will not be shared. Therefore, no specific data sets have been provided.
Acknowledgments
Danni Xue and Binghai Sun are co-first authors for this study. Thanks to the participants who participated in this study. We are very grateful to the editor and reviewers for their work and their suggestions for this paper. We would like to thank our colleagues at ZJNU and KU Leuven.
Author Contributions
All authors made a significant contribution to the work reported, whether that is in the conception, study design, execution, acquisition of data, analysis, and interpretation, or in all these areas; took part in drafting or critically reviewing the article; gave final approval of the version to be published; have agreed on the journal to which the article has been submitted; and agree to be accountable for all aspects of the work.
Funding
This work was supported by China Postdoctoral Science Foundation (Batch 71, No. 2022M712832).
Disclosure
The authors declare no competing interests in this work.
References
1. Thomson S, Hillman K. The Teaching And Learning International Survey 2018. Australian Report Volume 2: teachers and school leaders as valued professionals. OECD Teaching and Learning International Survey (TALIS); 2020.
2. García-Carmona M, Marín MD, Aguayo R. Burnout syndrome in secondary school teachers: a systematic review and meta-analysis. Soc Psychol Educ. 2019;22:189–208. doi:10.1007/s11218-018-9471-9
3. Beames JR, Spanos S, Roberts A, et al. Intervention programs targeting the mental health, professional burnout, and/or wellbeing of school teachers. Syst Rev Meta Anal Educ Psychol Rev. 2023;35(1):1–27.
4. Jordan DG, Winer ES, Salem T. The current status of temporal network analysis for clinical science: considerations as the paradigm shifts? J Clin Psychol. 2020;76(9):1591–1612. doi:10.1002/jclp.22957
5. Liu Y, Aungsuroch Y, Gunawan J, Zeng D. Job stress, psychological capital, perceived social support, and occupational burnout among hospital nurses. J Nurs Scholarsh. 2021;53(4):511–518. doi:10.1111/jnu.12642
6. Zhao X, Wu K, Sun B, Li W. Teacher career calling reduces burnout: the mediation effects of work engagement and psychological capital. Front Psychol. 2022;13:988467. doi:10.3389/fpsyg.2022.988467
7. Khawda G, Nimnuan C. How are psychological capital and emotion regulation associated with schoolteachers’ burnout? A systematic review. J Posit Psychol Wellbeing. 2023;7(2):1182–1194.
8. Zhang Y, Zhang S, Hua W. The impact of psychological capital and occupational stress on teacher burnout: mediating role of coping styles. Asia Pacific Educ Res. 2019;28:339–349. doi:10.1007/s40299-019-00446-4
9. Hazan-Liran B, Karni-Vizer N. Psychological capital as a mediator of job satisfaction and burnout among teachers in special and standard education. Eur J Spec Needs Educ. 2023;1–15. doi:10.1080/08856257.2023.2215009
10. Iancu AE, Rusu A, Măroiu C, Păcurar R, Maricuțoiu LP. The effectiveness of interventions aimed at reducing teacher burnout: a meta-analysis. Educ Psychol Rev. 2018;30:373–396. doi:10.1007/s10648-017-9420-8
11. Bottiani JH, Duran CAK, Pas ET, Bradshaw CP. Teacher stress and burnout in urban middle schools: associations with job demands, resources, and effective classroom practices. J Sch Psychol. 2019;77:36–51. doi:10.1016/j.jsp.2019.10.002
12. Liu XM, Zhou YG, Cao G, Zhang YJ. Jin shi nian wo guo jiao shi zhi ye zhuang kuang de heng duan li shi yan jiu [A historical study of teacher’s job burnout in recent ten years in China]. J Educ Dev. 2014;5:28–31. Chinese.
13. Rajendran N, Watt HMG, Richardson PW. Teacher burnout and turnover intent. Austr Educ Res. 2020;47(3):477–500. doi:10.1007/s13384-019-00371-x
14. Li R, Yao M. What promotes teachers’ turnover intention? Evidence from a meta-analysis. Educ Res Rev. 2022;37:100477. doi:10.1016/j.edurev.2022.100477
15. Roeser RW, Schonert-Reichl KA, Jha A, et al. Mindfulness training and reductions in teacher stress and burnout: results from two randomized, waitlist-control field trials. J Educ Psychol. 2013;105(3):787. doi:10.1037/a0032093
16. Capone V, Joshanloo M, Park MSA. Burnout, depression, efficacy beliefs, and work-related variables among school teachers. Int J Educ Res. 2019;95:97–108. doi:10.1016/j.ijer.2019.02.001
17. Lazarides R, Fauth B, Gaspard H, Göllner R. Teacher self-efficacy and enthusiasm: relations to changes in student-perceived teaching quality at the beginning of secondary education. Learn Instruct. 2021;73:101435. doi:10.1016/j.learninstruc.2020.101435
18. Estrada A. Teacher Cognitive Fatigue from State of Texas Assessment of Academic Readiness Standardized Testing Practices [Doctoral dissertation]. Grand Canyon University; 2022.
19. Li X. A theoretical analysis of the preventive role of English as a foreign language teachers’ occupational adjustment and psychological hardiness in their job burnout. Front Psychol. 2022;13:939617. doi:10.3389/fpsyg.2022.939617
20. Benner GJ, Strycker LA, Berry LA, Logan AJ, Lee EO. Associations between childhood trauma, perceived resilience, and teacher burnout. Teach Teach. 2023;29(3):291–309. doi:10.1080/13540602.2023.2173167
21. Chen M, Zhou C, Wang Y, Li Y. The role of school ICT construction and teacher information literacy in reducing teacher burnout: based on SEM and fsQCA. Educ Informat Technol. 2022;27(6):8751–8770. doi:10.1007/s10639-022-10989-7
22. Bardach L, Klassen RM, Perry NE. Teachers’ psychological characteristics: do they matter for teacher effectiveness, teachers’ well-being, retention, and interpersonal relations? An integrative review. Educ Psychol Rev. 2022;34(1):259–300. doi:10.1007/s10648-021-09614-9
23. Lei W, Li J, Li Y, Castaño G, Yang M, Zou B. The boundary conditions under which teaching–research conflict leads to university teachers’ job burnout. Stud Higher Educ. 2021;46(2):406–422. doi:10.1080/03075079.2020.1811218
24. Luthans F, Avolio BJ, Avey JB, Norman SM. Positive psychological capital: measurement and relationship with performance and satisfaction. Pers Psychol. 2007;60(3):541–572. doi:10.1111/j.1744-6570.2007.00083.x
25. Nolzen N. The concept of psychological capital: a comprehensive review. Manag Rev Q. 2018;68(3):237–277. doi:10.1007/s11301-018-0138-6
26. Luthans F, Youssef-Morgan CM, Avolio BJ. Psychological Capital and Beyond. Oxford University Press; 2015.
27. Jung HS, Yoon HH. The impact of employees’ positive psychological capital on job satisfaction and organizational citizenship behaviors in the hotel. Int J Contemp Hos Manag. 2015;27(6):1135–1156. doi:10.1108/IJCHM-01-2014-0019
28. Kim M, Kim ACH, Newman JI, Ferris GR, Perrewé PL. The antecedents and consequences of positive organizational behavior: the role of psychological capital for promoting employee well-being in sport organizations. Sport Manag Rev. 2019;22(1):108–125. doi:10.1016/j.smr.2018.04.003
29. Ho HC, Chan YC. The impact of psychological capital on well-being of social workers: a mixed-methods investigation. Soc Work. 2022;67(3):228–238. doi:10.1093/sw/swac020
30. Sarwar U, Aamir M, Bichao Y, Chen Z. Authentic leadership, perceived organizational support, and psychological capital: implications for job performance in the education sector. Front Psychol. 2022;13:1084963. doi:10.3389/fpsyg.2022.1084963
31. Kotzé M. The relationship between public service employees’ personal resources and psychological well-being. Int Rev Administr Sci. 2022;88(3):774–792. doi:10.1177/0020852320985926
32. Thanacoody PR, Newman A, Fuchs S. Affective commitment and turnover intentions among healthcare professionals: the role of emotional exhaustion and disengagement. Int J Hum Resour Manag. 2014;25(13):1841–1857. doi:10.1080/09585192.2013.860389
33. Bakker AB, Demerouti E, Euwema MC. Job resources buffer the impact of job demands on burnout. J Occup Health Psychol. 2005;10(2):170. doi:10.1037/1076-8998.10.2.170
34. Grover SL, Teo ST, Pick D, Roche M, Newton CJ. Psychological capital as a personal resource in the JD-R model. Person Rev. 2018;47(4):968–984. doi:10.1108/PR-08-2016-0213
35. Makhdoom IF, Malik NI, Atta M, et al. When workaholism is negatively associated with burnout: a moderated mediation. Front Public Health. 2023;10:1–13.
36. Loghman S, Quinn M, Dawkins S, Woods M, Om Sharma S, Scott J. A comprehensive meta-analyses of the nomological network of Psychological Capital (PsyCap). J Leader Organ Stud. 2023;30(1):108–128. doi:10.1177/15480518221107998
37. Sun C, Feng X, Sun B, Li W, Zhong C. Teachers’ professional identity and burnout among Chinese female school teachers: mediating roles of work engagement and psychological capital. Int J Environ Res Public Health. 2022;19(20):13477. doi:10.3390/ijerph192013477
38. Chen C, Li F, Liu C, Li K, Yang Q, Ren L. The relations between mental well-being and burnout in medical staff during the COVID-19 pandemic: a network analysis. Front Public Health. 2022;10:919692. doi:10.3389/fpubh.2022.919692
39. Fried EI, Borkulo CD, Cramer AO, Boschloo L, Schoevers RA, Borsboom D. Mental disorders as networks of problems: a review of recent insights. Soc Psychiatry Psychiatr Epidemiol. 2017;52:1–10. doi:10.1007/s00127-016-1319-z
40. Taylor S, Landry CA, Paluszek MM, Rachor GS, Asmundson GJ. Worry, avoidance, and coping during the COVID-19 pandemic: a comprehensive network analysis. J Anxiety Disord. 2020;76:102327. doi:10.1016/j.janxdis.2020.102327
41. Epskamp S, Fried EI. A tutorial on regularized partial correlation networks. Psychol Methods. 2018;23(4):617–634. doi:10.1037/met0000167
42. Kim J, Youngs P, Frank K. Burnout contagion: is it due to early career teachers’ social networks or organizational exposure? Teach Teach Educ. 2017;66:250–260. doi:10.1016/j.tate.2017.04.017
43. Stamm BH. The Concise ProQOL Manual: The Concise Manual for the Professional Quality of Life Scale.
44. Chen H, Wang W. Reliability and validity of the Chinese version of the Compassion Fatigue Scale. Chin Nurs Manag. 2013;13(4):39–41.
45. Yu X, Sun C, Sun B, Yuan X, Ding F, Zhang M. The cost of caring: compassion fatigue is a special form of teacher burnout. Sustainability. 2022;14(10):6071. doi:10.3390/su14106071
46. Zhang W. Development and Characteristic Analysis of Psychological Capital Questionnaire for Primary and Secondary School Teachers. Southwest University; 2010.
47. Gou C, Yang S, Li J. Relationship between psychological capital and occupational stress in elementary and secondary school principals: a potential profile study. China J Health Psychol. 2022;8:1202–1207.
48. Sun B, Guo H, Xu L, Ding F. How does teachers’ psychological capital influence workplace well-being? A moderated mediation model of ego-resiliency and work-meaning cognition. Int J Environ Res Public Health. 2022;19(22):14730. doi:10.3390/ijerph192214730
49. Epskamp S, Borsboom D, Fried EI. Estimating psychological networks and their accuracy: a tutorial paper. Behav Res Methods. 2018;50(1):195–212. doi:10.3758/s13428-017-0862-1
50. Epskamp S, Cramer AOJ, Waldorp LJ, Schmittmann VD, Borsboom D. Network visualizations of relationships in psychometric data. J Stat Softw. 2012;48:1–18. doi:10.18637/jss.v048.i04
51. Tibshirani R. Regression shrinkage and selection via the lasso. J Royal Statist Soc B. 1996;58:267–288.
52. Chen J, Chen Z. Extended Bayesian information criteria for model selection with large model spaces. Biometrika. 2008;95(3):759–771. doi:10.1093/biomet/asn034
53. Foygel R, Drton M. Extended Bayesian information criteria for Gaussian graphical models. Adv Neural Inf Process Syst. 2010;23:2020–2028.
54. Sánchez-Hernández MO, Holgado-Tello FP, Carrasco MÁ. Network analysis of internalizing and externalizing symptoms in children and adolescents. Psicothema. 2023;35(1):66–76. doi:10.7334/psicothema2022.17
55. Zhou M, Jin H, Wu Q, Xie H, Han Q. Betweenness centrality-based community adaptive network representation for link prediction. Appl Intell. 2022;52(4):3545–3558. doi:10.1007/s10489-021-02633-7
56. Hevey D. Network analysis: a brief overview and tutorial. Health Psychol Behav Med. 2018;6(1):301–328. doi:10.1080/21642850.2018.1521283
57. Robinaugh DJ, Millner AJ, McNally RJ. Identifying highly influential nodes in the complicated grief network. J Abnorm Psychol. 2016;125(6):747–757. doi:10.1037/abn0000181
58. Rodrigues FA. Network centrality: an introduction. In: A Mathematical Modeling Approach from Nonlinear Dynamics to Complex Systems. Springer; 2019:177–196.
59. Li L, Niu Z, Mei S, Griffiths MD. A network analysis approach to the relationship between fear of missing out (FoMO), smartphone addiction, and social networking site use among a sample of Chinese university students. Comput Human Behav. 2022;128:107086. doi:10.1016/j.chb.2021.107086
60. Zarate D, Ball M, Montag C, Prokofieva M, Stavropoulos V. Unravelling the web of addictions: a network analysis approach. Addict Behav Rep. 2022;15:100406. doi:10.1016/j.abrep.2022.100406
61. Luo X, Li W, Chen Y, et al. Fear of recurrence in Chinese cancer patients: prevalence, correlates, and network analysis. Front Psychiatry. 2022;13:803543. doi:10.3389/fpsyt.2022.803543
62. Di Fabio A, Saklofske DH, Gori A, Svicher A. Perfectionism: a network analysis of relationships between the Big Three Perfectionism dimensions and the Big Five Personality traits. Pers Individ Dif. 2022;199:111839. doi:10.1016/j.paid.2022.111839
63. Razali NM, Wah YB. Power comparisons of Shapiro-Wilk, Kolmogorov-Smirnov, Lilliefors and Anderson-Darling tests. J Statist Model Analyt. 2011;2(1):21–33.
64. Jones PJ, Mair P, McNally RJ. Visualizing psychological networks: a tutorial in R. Front Psychol. 2018;9:1742. doi:10.3389/fpsyg.2018.01742
65. Brown SP, Biddle C. Testing a teacher costs to caring resilience model to identify burnout mediators. Teach Teach Educ. 2023;127:104078. doi:10.1016/j.tate.2023.104078
66. Chang ML. Emotion display rules, emotion regulation, and teacher burnout. Front Educ. 2020;5:00090. doi:10.3389/feduc.2020.00090
67. Bodenheimer G, Shuster SM. Emotional labour, teaching and burnout: investigating complex relationships. Educ Res. 2020;62(1):63–76. doi:10.1080/00131881.2019.1705868
68. Alwi S. Problematika guru dalam pengembangan media pembelajaran. ITQAN. 2017;8(2):145–167.
69. Schonfeld IS, Bianchi R. Burnout and Depression: two entities or one? J Clin Psychol. 2016;72(1):22–37. doi:10.1002/jclp.22229
70. De Stasio S, Fiorilli C, Benevene P, Uusitalo-Malmivaara L, Chiacchio CD. Burnout in special needs teachers at kindergarten and primary school: investigating the role of personal resources and work wellbeing. Psychol Sch. 2017;54(5):472–486. doi:10.1002/pits.22013
71. Cece V, Guillet-Descas E, Lentillon-Kaestner V. The longitudinal trajectories of teacher burnout and vigour across the scholar year: the predictive role of emotional intelligence. Psychol Sch. 2022;59(3):589–606. doi:10.1002/pits.22633
72. Hussain MS, Khan SA, Bidar MC. Self-Efficacy of Teachers: a review of the literature. Multi Discipl Res J. 2022;50:2320–2750.
73. Skaalvik EM, Skaalvik S. Dimensions of teacher self-efficacy and relations with strain factors, perceived collective teacher efficacy, and teacher burnout. J Educ Psychol. 2007;99(3):611–625. doi:10.1037/0022-0663.99.3.611
74. Li X, Xiao W, Sun C, Li W, Sun B. Does burnout decrease with teacher professional identity among teachers in China? J Career Dev. 2022;089484532211389. doi:10.1177/08948453221138937
75. Sweetman D, Luthans F. The power of positive psychology: psychological capital and work engagement. Work Engage. 2010;54:68.
76. Coolahan J. Teacher education and the teaching career in an era of lifelong learning. OECD Education Working Papers, No. 2; 2002:39.
77. Taylor M, McLean L, Bryce CI, Abry T, Granger KL. The influence of multiple life stressors during Teacher Training on Burnout and Career Optimism in the first year of teaching. Teach Teach Educ. 2019;86:102910. doi:10.1016/j.tate.2019.102910
78. Marcionetti J, Castelli L. The job and life satisfaction of teachers: a social cognitive model integrating teachers’ burnout, self-efficacy, dispositional optimism, and social support. Int J Educ Vocat Guid. 2023;23(2):441–463. doi:10.1007/s10775-021-09516-w
79. Shi J, Rucktum V. Enhancing psychological capital and organizational commitment to reduce teachers’ job burnout through organizational development intervention. ABAC ODI J Vision Action Outcome. 2023;10(2):33–54.
80. Ferradás MDM, Freire C, García-Bértoa A, Núñez JC, Rodríguez S. Teacher profiles of psychological capital and their relationship with burnout. Sustainability. 2019;11(18):5096. doi:10.3390/su11185096
81. Schaufeli WB, Taris TW. A critical review of the job demands-resources model: implications for improving work and health. In: Bauer GF, Hämmig O, editors. Bridging Occupational, Organizational and Public Health: A Transdisciplinary Approach. Springer Netherlands; 2014:43–68.
82. Rothmann S, Joubert JHM. Job demands, job resources, burnout and work engagement of managers at a platinum mine in the North West Province. South Afr J Bus Manag. 2007;38(3):49–61. doi:10.4102/sajbm.v38i3.588
83. Tao Y, Hou W, Niu H, et al. Comparing the centrality symptoms of major depressive disorder samples across junior high school students, senior high school students, college students and elderly adults during city lockdown of COVID-19 pandemic—A network analysis. J Affect Disord. 2023;324:190–198. doi:10.1016/j.jad.2022.12.120
84. Kim ST, Seo JH, Lee S, et al. Dysfunctional coronavirus anxiety in nonpsychotic psychiatric outpatients during the COVID‐19 pandemic: a network analysis. Depress Anxiety. 2022;39(7):556–563. doi:10.1002/da.23256
85. Troman G. Primary teacher identity, commitment and career in performative school cultures. Br Educ Res J. 2008;34(5):619–633. doi:10.1080/01411920802223925
86. Noddings N. The caring relation in teaching. Oxford Rev Educ. 2012;38(6):771–781. doi:10.1080/03054985.2012.745047
87. Friedman IA. Classroom management and teacher stress and burnout. In: Evertson CM, Weinstein CS, editors. Handbook of Classroom Management: Research, Practice, and Contemporary Issues. Lawrence Erlbaum Associates Publishers; 2006:925–944.
88. Fisherman S. Professional identity and burnout among pre-school, elementary, and post-elementary school teachers in Israel. J Curric Teach. 2015;4(1):1–13.
89. Chen X, Zeng G, Chang EC, Cheung HY. What are the potential predictors of psychological capital for Chinese primary school teachers? Front Educ. 2019;4:50. doi:10.3389/feduc.2019.00050
90. MacIntyre P, Mercer S, Gregersen T, Hay A. The role of hope in language teachers’ changing stress, coping, and well-being. System. 2022;109:102881. doi:10.1016/j.system.2022.102881
91. Sabouripour F, Roslan SB. Resilience, optimism and social support among international students. Asian Soc Sci. 2015;11(15):159–170. doi:10.5539/ass.v11n15p159
 © 2023 The Author(s). This work is published and licensed by Dove Medical Press Limited. The
full terms of this license are available at https://www.dovepress.com/terms
and incorporate the Creative Commons Attribution
- Non Commercial (unported, 3.0) License.
By accessing the work you hereby accept the Terms. Non-commercial uses of the work are permitted
without any further permission from Dove Medical Press Limited, provided the work is properly
attributed. For permission for commercial use of this work, please see paragraphs 4.2 and 5 of our Terms.
© 2023 The Author(s). This work is published and licensed by Dove Medical Press Limited. The
full terms of this license are available at https://www.dovepress.com/terms
and incorporate the Creative Commons Attribution
- Non Commercial (unported, 3.0) License.
By accessing the work you hereby accept the Terms. Non-commercial uses of the work are permitted
without any further permission from Dove Medical Press Limited, provided the work is properly
attributed. For permission for commercial use of this work, please see paragraphs 4.2 and 5 of our Terms.