")
Back to Journals » Journal of Inflammation Research » Volume 15
The Specific Changes of Urine Raman Spectra Can Serve as Novel Diagnostic Tools for Disease Characteristics in Patients with Crohn’s Disease
Authors Wu Y , Wang Z, Xing M, Li B, Liu Z, Du P, Yang H, Wang X
Received 5 October 2021
Accepted for publication 15 January 2022
Published 9 February 2022 Volume 2022:15 Pages 897—910
DOI https://doi.org/10.2147/JIR.S341871
Checked for plagiarism Yes
Review by Single anonymous peer review
Peer reviewer comments 2
Editor who approved publication: Professor Ning Quan
Yaling Wu,1 Zijie Wang,2 Mengmeng Xing,2 Bingyan Li,2 Zhiyuan Liu,2 Peng Du,3 Huinan Yang,2 Xiaolei Wang1
1Department of Gastroenterology, Shanghai Tenth People’s Hospital, Tongji University School of Medicine, Shanghai, 200072, People’s Republic of China; 2School of Energy and Power Engineering, University of Shanghai for Science and Technology, Shanghai, 200093, People’s Republic of China; 3Department of Colorectal Surgery, Xinhua Hospital, Shanghai Jiaotong University School of Medicine, Shanghai, 200092, People’s Republic of China
Correspondence: Xiaolei Wang
Department of Gastroenterology, Shanghai Tenth People’s Hospital, Tongji University School of Medicine, Shanghai, 200072, People’s Republic of China
, Tel +86-21-66313573
, Email [email protected]; Huinan Yang
School of Energy and Power Engineering, University of Shanghai for Science and Technology, Shanghai, 200093, People’s Republic of China
, Tel +86-21-55272638
, Email [email protected]
Purpose: Crohn’s disease (CD) is a chronic recurrent intestinal inflammatory disease that requires repeated invasive examinations. Convenient and noninvasive diagnostic tools for CD are lacking. Surface-enhanced Raman spectroscopy (SERS) can rapidly provide specific metabolite information in various samples. Our previous study has showed urine Raman spectrum can distinguish CD patients from healthy controls noninvasively. In this study, we further investigated the value of urine Raman spectra on identifying the disease characterizations in patients with CD.
Patients and Methods: Urine samples were analyzed by SERS to acquire specific changes of the spectra from 100 active CD (aCD) patients and 88 inactive CD (iCD) patients. The accuracy of classifier models yielded by SERS was assessed by principal component analysis and support vector machine (PCA-SVM) to investigate spectral differences and disease characterizations.
Results: Given a panel of 16 specific Raman spectra, the classifier model was established to predict disease activity between patients with aCD and iCD and achieved higher efficacy than fecal calprotectin (AUC value, 0.864 vs 0.596, P=0.02). After leave-one-patient-out cross-validation, the classifier model still obtained 75.5% of accuracy. The correlation analysis showed it had negative correlation with endoscopic results (r=− 0.616, P< 0.0001). We further established the classifier model in identifying disease location to discriminate colonic-type from ileal-type CD with 63.6% of accuracy with the significantly increased intensity of 1643 cm− 1 band, and the model to predict the spectra changes of before and after treatment in tumor necrosis factor inhibitor responders with 91.2% of accuracy with a panel of 11 specific spectra. The metabolic changes of amino acids, proteins, lipids, and other compounds in urine levels were noted by SERS in patients with CD.
Conclusion: The specific changes of urine Raman spectra can reflect changes in urine metabolism. It has the potential value on being the promising diagnostic tool for disease characterizations in CD patients by a convenient and noninvasive way.
Keywords: Crohn’s disease, urine, Raman spectra, disease characterization
Introduction
Crohn’s disease (CD), an inflammatory bowel disease (IBD), is characterized by chronic inflammation of any part of the gastrointestinal tract and has a progressive and destructive course resulting in complications of stricture, fistula and abscess formation.1 Some patients often have no symptoms at the beginning of the disease, leading to diagnostic delay and worse outcomes. More aggressive treatments with biologics or small molecule inhibitors have been used to improve the current difficult situations. However, an inadequate response to medications such as tumor necrosis factor inhibitor (TNFi) is an intractable problem.2
Endoscopy examination can provide an objective evidence for the evaluation and identification of disease activity, location and efficacy in CD. However, some limitations cause poor compliance, for example, expensive, invasive, and bowel preparation is needed.3 In recent years, many studies have been devoted to investigating simple, noninvasive, accurate and economical biomarkers in serum, stool and urine.4 C-reactive protein (CRP) is the most commonly used serum marker to reflect systemic inflammation. However, it lacks bowel specificity and often does not consist with endoscopic findings.5,6 Other serum biomarkers, such as perinuclear antineutrophil cytoplasmic (pANCA), anti-Saccharomyces cerevisiae antibodies (ASCA) and anti-glycoprotein 2 (antiGP2), have limitations of poor sensitivity, low specificity, complexity and high cost. These disadvantages make them difficult to widely implement in clinical practice.7,8 The value of novel biomarkers, including miRNAs and exosomes, is still under investigation.9,10 Fecal calprotectin (FCP) has been widely used for evaluation and monitoring intestinal disease activity.11 However, except for complex sample preparation, the accuracy of FCP is also affected by many interference factors, including sample collection time, detection method, and disease location of the small bowel.12 Recently, urine inflammatory markers have been studied to detect disease activity and drug efficacy in patients with IBD by liquid chromatography tandem mass spectrometry or ELISA.13,14 However, complex detection methods make them hard to apply to clinical practice.
There are few studies about applying physical methods to evaluate the disease state of CD in a noninvasive way. Raman spectroscopy (RS) is based on the unique and fingerprint-like spectra generated by different molecules, including nucleic acids, proteins and lipids. The RS technique can provide useful diagnostic information to reflect conformational changes in human tissue and cells. In the past years, this technique has been used to diagnose colorectal cancer by detecting characteristic spectral changes in the postoperative biopsy of tumor tissue from 20 patients.15 D’Acunto et al found RS imaging can not only be used to detect the characteristic spectral changes of tumor tissue in vitro to diagnose malignancy, but also might grade the chondrogenic tumors according to the histopathological results.16 Furthermore, RS has been applied to measure cancers in hollow organs (such as lung cancer and gastrointestinal cancer) in vivo with the development of fiber-optic Raman probes in hollow organs.17
Based on detection of plasma, stool samples and biopsy tissues, RS technique also has been performed in patients with CD and ulcerative colitis (UC). In a study conducted on 77 CD patients and 45 healthy controls (HC), Morasso et al found that RS revealed biochemical differences in plasma of CD patients through analyzing spectra differences.18 RS was also used to detect proteic extract from fecal samples in pediatric patients with IBD (15 CD and 9 UC) and 19 HC. This technique could probe the changes in the secondary structures of proteic extract and distinguish IBD from HC subjects and CD from UC patients.19 Another research group measured colon tissue biopsies in vitro from 9 CD and 12 UC patients using Raman fiber-optic probes, and detected characteristic Raman features potentially to distinguish CD from UC.20 However, these studies usually had small sample sizes, and sample collection was invasive and obtained in an uneasy way. Urine sample has obvious advantages in being easy to acquire, noninvasive and economical. To date, few studies have investigated the value of the urine RS technique in IBD patients. Moreover, as a spectral fingerprint with high sensitivity, surface-enhanced Raman spectroscopy (SERS) drastically enhances the Raman signals by 1013- to 1014-fold with low laser Power and causes little damage to the molecules attached to the nanotextured metallic surface. Our previous work indicated the SERS can well distinguish CD patients from HC, whether in active or inactive CD patients.21
In this study, we aimed to investigate the further application of Raman spectrum in patients with CD through SERS technique in order to explore the noninvasive method on diagnosis of disease characteristics. Our results successfully established the classified models with high accuracy based on principal component analysis and a support vector machine (PCA-SVM) procedure. The CD patients with different disease activity, location of colonic and small bowel types, as well as before and after treatment in TNFi responders, can be well distinguished by the predicted models given the significant changes of Raman spectra. These findings indicated that a group of changed urine Raman spectra may be as useful diagnostic tools for prediction of various disease characteristics in a noninvasive, convenient and economical way.
Materials and Methods
Patients
One hundred eighty-eight consecutive CD patients at the Department of Gastroenterology of the Shanghai Tenth People’s Hospital affiliated with Tongji University (Shanghai, China) were recruited from June 2020 to March 2021. The inclusion criteria were as follows: (a) 16–80 years of age; (b) a confirmed diagnosis of CD based on evaluation of clinical, endoscopic, radiological and histological features according to the European Crohn’s and Colitis Organization guidelines;22 and (c) complete clinical data. Patients with active CD (aCD) were defined as having a Crohn’s Disease Activity Index (CDAI) score ≥150 and the presence of definite ulcers endoscopically. Patients with inactive CD (iCD) were identified as having CDAI <150 and the absence of ulcers under endoscopy, which was mucosal healing (MH). Exclusion criteria included the patients who had a few intestinal ulcers, although the CDAI was less than 150; indeterminate enteritidis; other infectious diseases (sepsis and intestinal tuberculosis); autoimmune diseases (Bechet’s disease) and malignancies; and serious cardiac, pulmonary, hepatic, renal or hematological diseases. All patients signed informed consent to participate in the study. The study complied with the Helsinki Declaration, and the study protocol was approved by the Institutional Ethics Committee of the Tenth People’s Hospital of Tongji University, Shanghai, China (SHSY- IEC-4.1/21–3/01).
Urine Collection
Two milliliters of the first morning urine was collected from each subject and placed in a 5 mL sterile centrifuge tube at 4°C. One milliliter of urine was mixed with 2 mL of commercial silver colloid nanoparticles (Nanjing Xianfeng Nanomaterial Technology Co., Ltd., Nanjing, China) for two hours, and the mixture was added to a cuvette for further detection. The ultraviolet-visible light absorption spectrum of silver colloid nanoparticles is shown in Figure 1A. The maximum absorption wavelength was 425 nm. Figure 1B shows a micrograph of silver colloid nanoparticles discriminated by transmission electron microscopy (TEM), which showed that the mean nanoparticle size was approximately 50 nm.
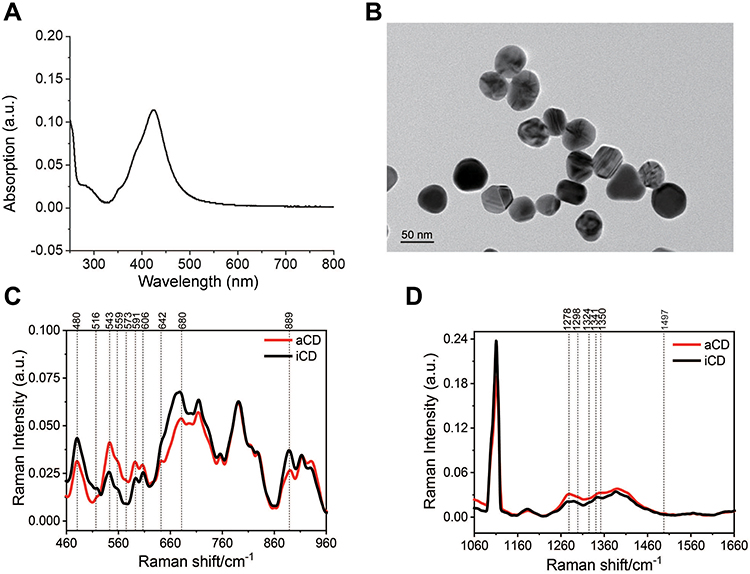 |
Figure 1 (A) Ultraviolet–visible light absorption spectrum of silver colloid nanoparticles. (B) TEM micrograph of silver colloid nanoparticles. Average normalized Raman spectra of urinary samples from patients with aCD and iCD in 460–960 cm−1 region (C) and 1060–1660 cm−1 region (D). Abbreviations: TEM, transmission electron microscopy; aCD, active Crohn’s disease; iCD, inactive Crohn’s disease. |
Surface-Enhanced Raman Spectra Acquisition and Analysis
A surface-enhanced Raman spectrometer developed by the School of Energy and Power Engineering at the University of Shanghai for Science and Technology was employed to detect urine samples. The laser light source came from a diode laser (Tech) at 785 nm with 50 mw power. The incident light went through the collimator (Thorlabs) and bandpass filter (Edmund) in front of the diode laser sequentially and then focused on the cuvette. The scattered light in the direction of 90° with the incident light was filtered by the lens set and edge filter (Edmund) to eliminate Rayleigh scattering, transmitted through the spectrometer (IHR 320) and then received by a CCD detector (Horiba-Syncerity). The spectral regions of 460 cm−1 to 960 cm−1 and 1060 cm−1 to 1660 cm−1 were acquired with 1200 grooves/mm grating, a 20-second collecting time, two-time accumulation and a spectral resolution of 0.8 cm−1. Anhydrous ethanol was tested for calibration with the Raman spectrometer twice a day. Each sample was tested five times, the acquired spectra for each sample were vector normalized by using OriginPro, Version 2019 (OriginLab Corporation, Northampton, MA, USA), and the average data of the five spectra were regarded as the final representative spectrum of each sample. To minimize measurement error, urine samples of CD patients were detected alternatively on the same day. A 4th-order polynomial fit was applied to eliminate fluorescence background and noise.
Clinical Data Collection
Clinical data were collected from the recruited CD patients, including sex, age, smoking status, disease duration, CDAI, the Montreal Classification, enteral nutrition, concomitant medications, TNFi treatment, CRP and FCP. To detect FCP levels (FCP Assay Kit, Guangzhou Forreal Biotechnology Co., Ltd., Guangzhou, China), a 5–10 g morning fecal sample was collected within 3 days before endoscopy from each patient (18 aCD and 20 iCD) and stored at −20°C. Patients with FCP ≥250 µg/g or CRP ≥8.20 mg/L were considered to have active disease. Infliximab (IFX) was regularly administered intravenously at a dose of 5 mg/kg body weight at 0, 2, and 6 weeks and then every 8 weeks. Adalimumab was injected at doses of 160 mg loading dose, followed by 80 mg and then 40 mg subcutaneously every other week. After treatment with IFX or adalimumab for at least 30 weeks, the responder was defined as a ≥ 50% decrease in the SES-CD score compared with that before treatment.1 Perianal disease (PD) in our study referred to perianal abscess and perianal fistula.
Statistical Data Analysis
Data analysis was performed using SPSS (IBM SPSS 23.0, SPSS Inc.) and R software (v. 3.5.1, R Foundation, Vienna). Continuous variables are presented as the mean ± standard deviation (mean ± SD) or median and interquartile range (IQR) in variables without a normal distribution, and statistical comparisons between groups were carried out by nonparametric tests. Categorical variables were expressed as numbers with percentages, and comparisons between groups were performed by the chi-square test. For the variable of every peak intensity, we first employed the Shapiro Wilk and Kolmogorov–Smirnov tests in urine samples to verify the normal distribution of data; we considered data as normal only if both tests accepted the null hypothesis of normal distribution. Then, parametric (t-test) or nonparametric (Wilcoxon test) tests were used to compare mean values between groups. Major peaks with different means or medians between groups were identified on this basis, with a P value <0.05 considered statistically significant.
Principal component analysis (PCA)-support vector machine (SVM) was applied to analyze the multivariate data for the automatic classification of the spectra using OriginPro, Version 2019. Through PCA, the complexity of the dataset was reduced to 34–188 principal components (PCs). We used the first 15 PCs as training data to establish classification models based on PCA-SVM to discriminate aCD from iCD patients. From the receiver operating characteristic (ROC) curve, we obtained the optimal threshold (cut-off point) to classify aCD with iCD, and aCD patients with different characteristics (isolated colonic and ileal-type; with and without PD and spectral changes before and after treatment in TNFi responders). The cut-off values were determined by the greatest Youden index (Youden index=sensitivity+specificity-1). Leave-one-patient-out cross-validation was used to validate the prediction model. In determining the sample size, a marginal error (d = 0.1) was considered at the 95% level of confidence, and the minimum of the area under the curve (AUC) was 0.88.23 The minimal number of subjects in each category was 37. The AUC were compared by Delong’s method (MedCalc16.8.4) between the PCA-SVM models and CRP or FCP to identify the predictive power, and the sensitivity, specificity, positive predictive value (PPV), negative predictive value (NPV), positive likelihood ratio (LR+) and negative likelihood ratio (LR-) were calculated for the model and biomarkers. Correlations between the SERS classified model and endoscopic disease activity were determined by Spearman analysis.
Results
Patients Data and Disease Classifications
The urine samples of 188 patients with CD, including 100 aCD patients and 88 iCD patients received Raman spectroscopy analysis to obtain the Raman fingerprints. The clinical characteristics of the two groups of CD patients are shown in Table 1. Among all included patients, 71.8% of the patients (135/188) were male, with an average age of 33 (24–43) years. One hundred and twelve patients (59.6%) were ileocolonic type, 45 were ileal-type, and 31 were colonic-type. The CD patients with B1 behavior had 81 (43.1%), followed by those with the structuring type (80/188, 42.6%). The CRP level was higher in patients with aCD than in iCD patients (20.2±25.6 vs 2.8±4.5 mg/L, P<0.001). The percentages of active smoking (16% vs 3.4%, P= 0.001) and PD (27% vs 2.3%, P<0.001) were also higher in the aCD patients than that in the iCD patients.
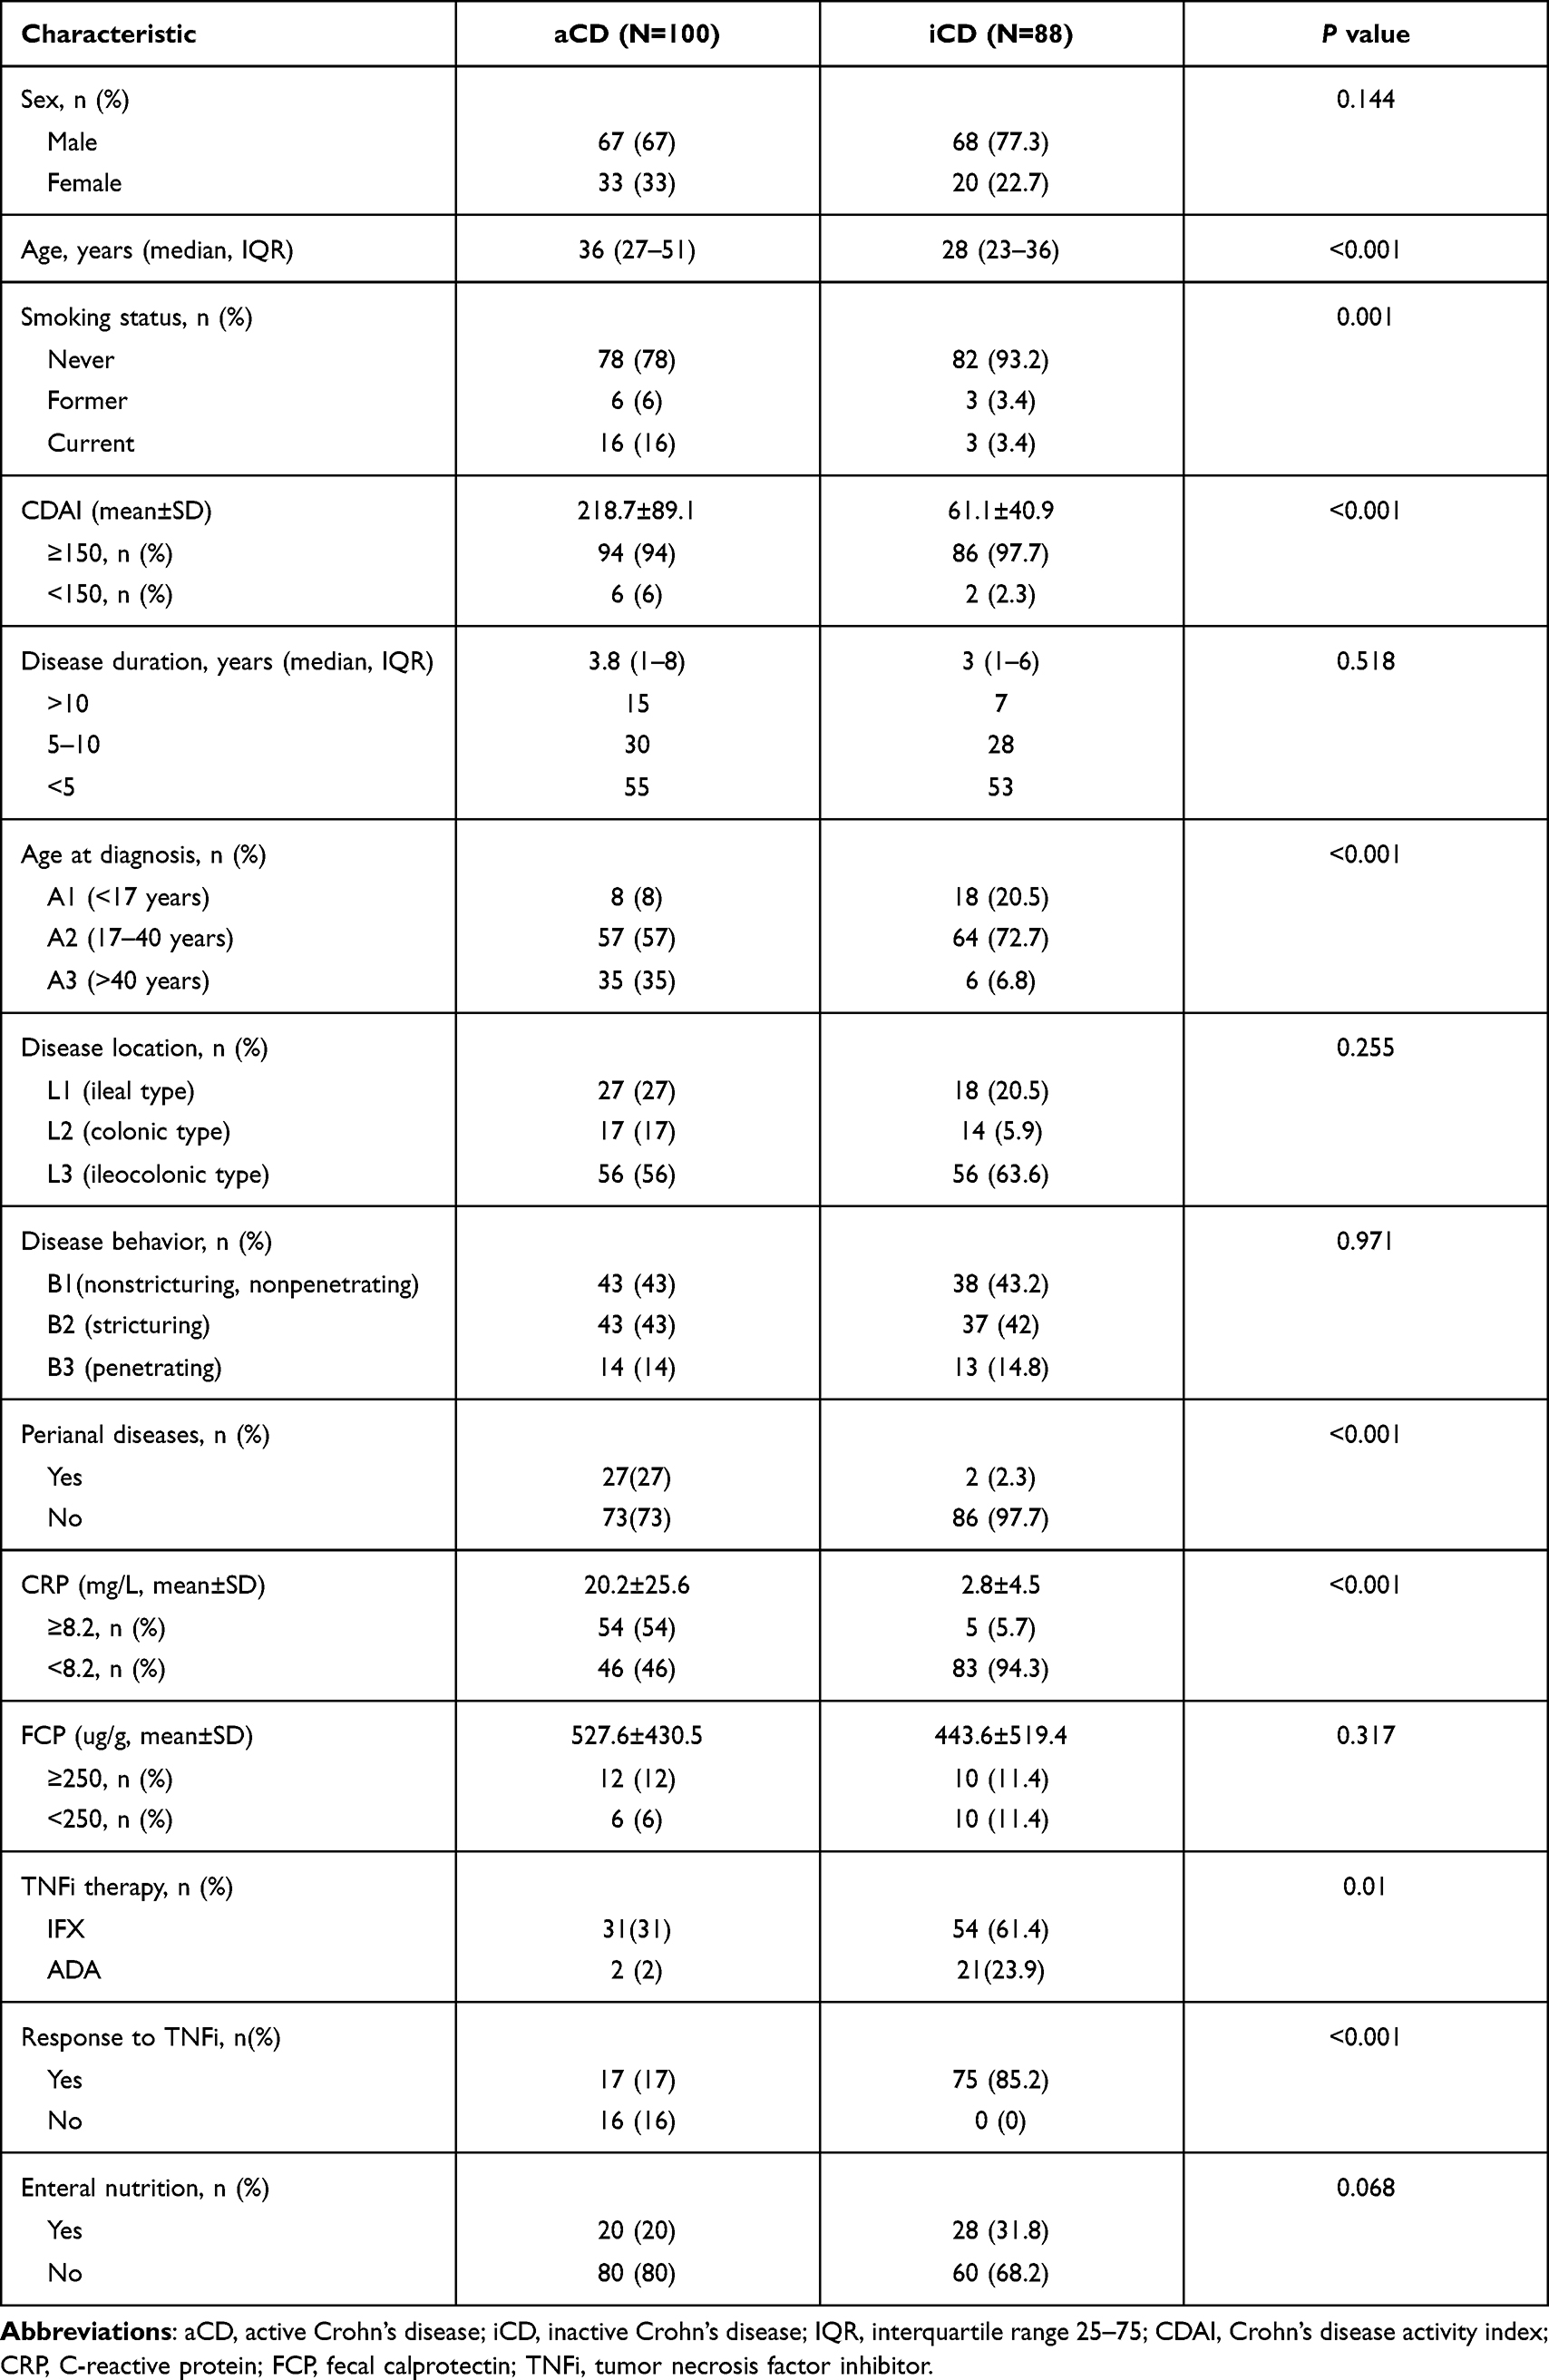 |
Table 1 Baseline Characteristics of the Patients with Active and Inactive Crohn’s Disease |
Changes of Urine Raman Spectra to Predict Disease Activity
To identify spectral differences in active and inactive patients, urine Raman spectra of CD patients were acquired from the 460–960 cm−1 (Figure 1C) and 1060–1660 cm−1 regions (Figure 1D). The intensity changes of the spectra between 100 aCD and 88 iCD patients were compared (Supplementary Table S1). There were a panel of 16 peaks with significantly different intensities between aCD and iCD patients, including 11 bands with the stronger intensities (543, 559, 1350, 591, 1278, 1341, 606, 1298, 1324, 573 and 1497 cm−1) and 5 with the weaker intensities (680, 642, 480, 889 and 516 cm−1) after SERS detection (P<0.05, Figure 2). According to the metabolites corresponding to these bands, cholesterol palmitate (543 cm−1) increased remarkably in patients with aCD, while the level of the S-S disulfide stretch in proteins (516 cm−1) decreased most significantly (Supplementary Tables S2 and S3).24–31
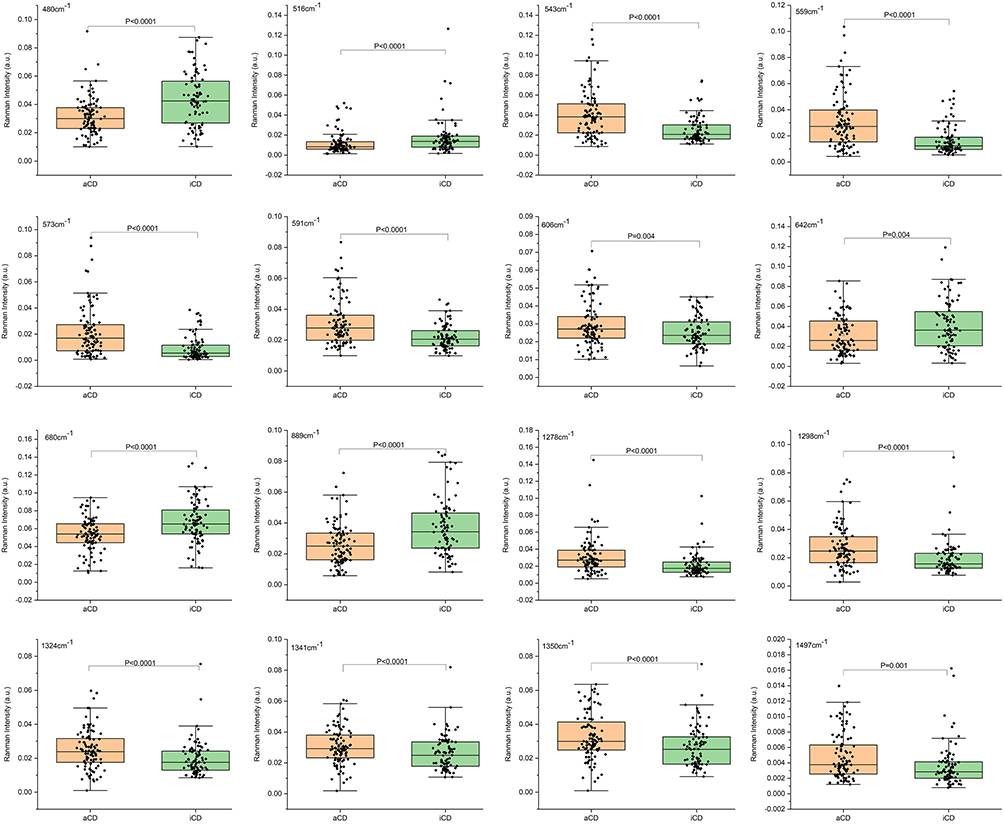 |
Figure 2 The significant changes of 16 spectra intensities between aCD and iCD patients. Data are shown as box and whisker plots. Each data point represents an individual subject analyzed. Each box represents the median and upper and lower quartiles. Abbreviations: aCD, active Crohn’s disease; iCD, inactive Crohn’s disease. |
Given the 16 specific Raman peaks, the SERS classifier to discriminate aCD from iCD patients acquired an accuracy of 79.8% with 0.856 of AUC value, 83% of sensitivity, 76.1% of specificity, and an F1-score of 81.4% by the PCA-SVM procedure (Figure 3A and 3B, Supplementary Table S4). The predictive value of the SERS classified model after leave-one-out cross-validation was 81% of sensitivity, 69.3% of specificity, 77.9% of F1-score, and 75.5% of accuracy (Supplementary Table S5). The Spearman rank correlation analysis suggested it had negative correlation with endoscopic disease activity (r=−0.616, P<0.0001). Lower Raman canonical variable determined by the SERS classifier model indicated greater disease severity endoscopically, and higher Raman canonical variable suggested less severity in the intestines.
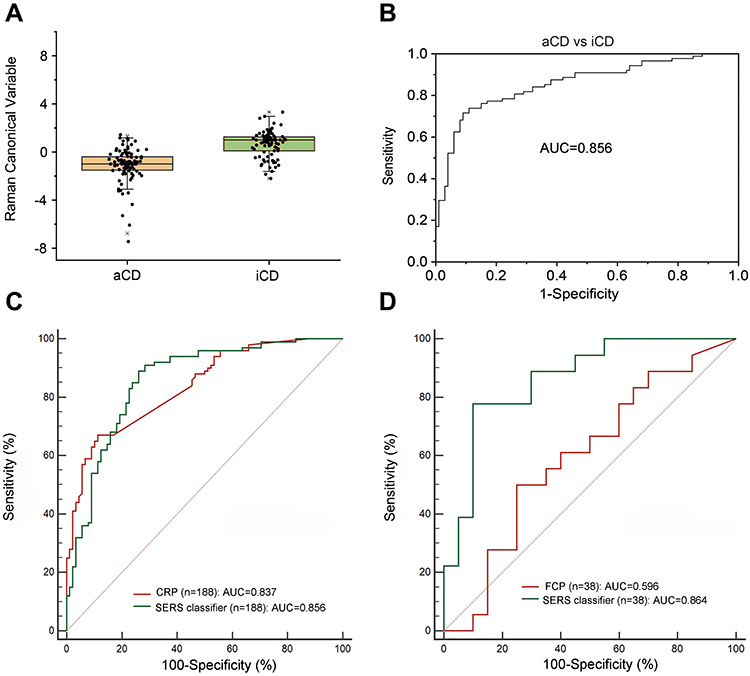 |
Figure 3 (A) The Raman canonical variable score obtained for aCD and iCD patients. Data are shown as box and whisker plots. Each data point represents an individual subject analysed. Each box represents the median and upper and lower quartiles. (B) Receiver operating characteristic curves of the SERS classifier by PCA-SVM to discriminate aCD from iCD patients. (C and D) Diagnostic efficiency of the classifier model and clinical biomarkers for disease activity measured by receiver operating characteristic curves. (C) SERS classifier model [green curve] vs CRP [red curve]; (D) SERS classifier model [green curve] vs FCP [red curve]. Abbreviations: aCD, active Crohn’s disease; iCD, inactive Crohn’s disease; PCA, principal component analysis; SVM, support vector machine; SERS, surface-enhanced Raman spectroscopy; CRP, C-reactive protein; FCP, fecal calprotectin. |
To compare the diagnostic efficacy of SERS classifier with the common inflammatory biomarkers (CRP and PCP), we calculated the corresponding AUC value, sensitivity, specificity, predictive values and likelihood ratios of each marker (Table 2). The similar value in diagnostic efficiency was found between the SERS classifier (AUC 0.856, 95% CI 0.798–0.903) and CRP (AUC 0.837, 95% CI 0.776–0.887) (P=0.63, Figure 3C, Table 2). However, the sensitivity of SERS classifier (83%) was higher than CRP (67%), although its specificity (76.1%) was lower than CRP (88.6%). The classifier model obtained a significantly higher diagnostic efficiency under ROC curves of discrimination than FCP detected in 18 aCD patients (AUC 0.864 vs 0.596, P=0.02, Figure 3D). The predictive values and likelihood ratios for the SERS classifier also were better than those for FCP (Table 2). The PPV of SERS classifier (79.8%) was higher than that of FCP (64.3%), but lower than CRP (87.0%). However, the NPV of the classifier model (79.8%) was higher than both of CRP (70.3%) and FCP (62.5%). Therefore, the higher sensitivity and NPV of SERS classifier model indicate that it could be a useful diagnostic tool to evaluate disease activity.
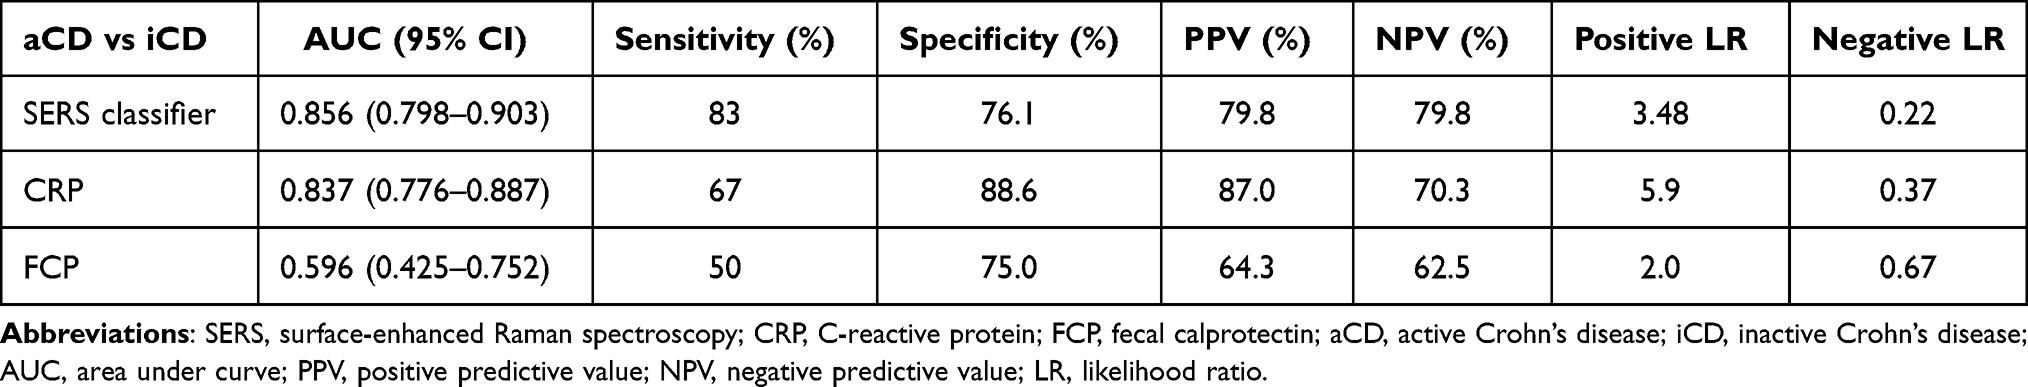 |
Table 2 Comparison of the Diagnostic Efficacy Among SERS Classifier, CRP and FCP for Identification of Disease Activity in CD Patients |
SERS Classifiers to Identify Disease Characteristics Based on Spectral Differences
Given the changes of Raman spectra, we further investigated the value of the SERS classifiers in distinguishing other disease characteristics (Table 3 and Supplementary Table S6). Surprisingly, the SERS models also obtained the good accuracy in distinguishing disease features. A specific band of 1643 cm−1 in colonic-type CD patients has significantly stronger intensity than in ileal-type CD patients (P=0.011). After leave-one-patient-out cross-validation, the SERS classifier could successfully discriminate these two locations of CD patients with a sensitivity of 64.7%, specificity of 63%, an accuracy of 63.6%, and AUC of 0.92 (Table 3, Figure 4A and 4B). The 1643 cm−1 band related to the strong C-C stretch of lipids and the C-O stretch of the protein amide I band (P=0.011, Supplementary Table S2 and Supplementary Figure S1).
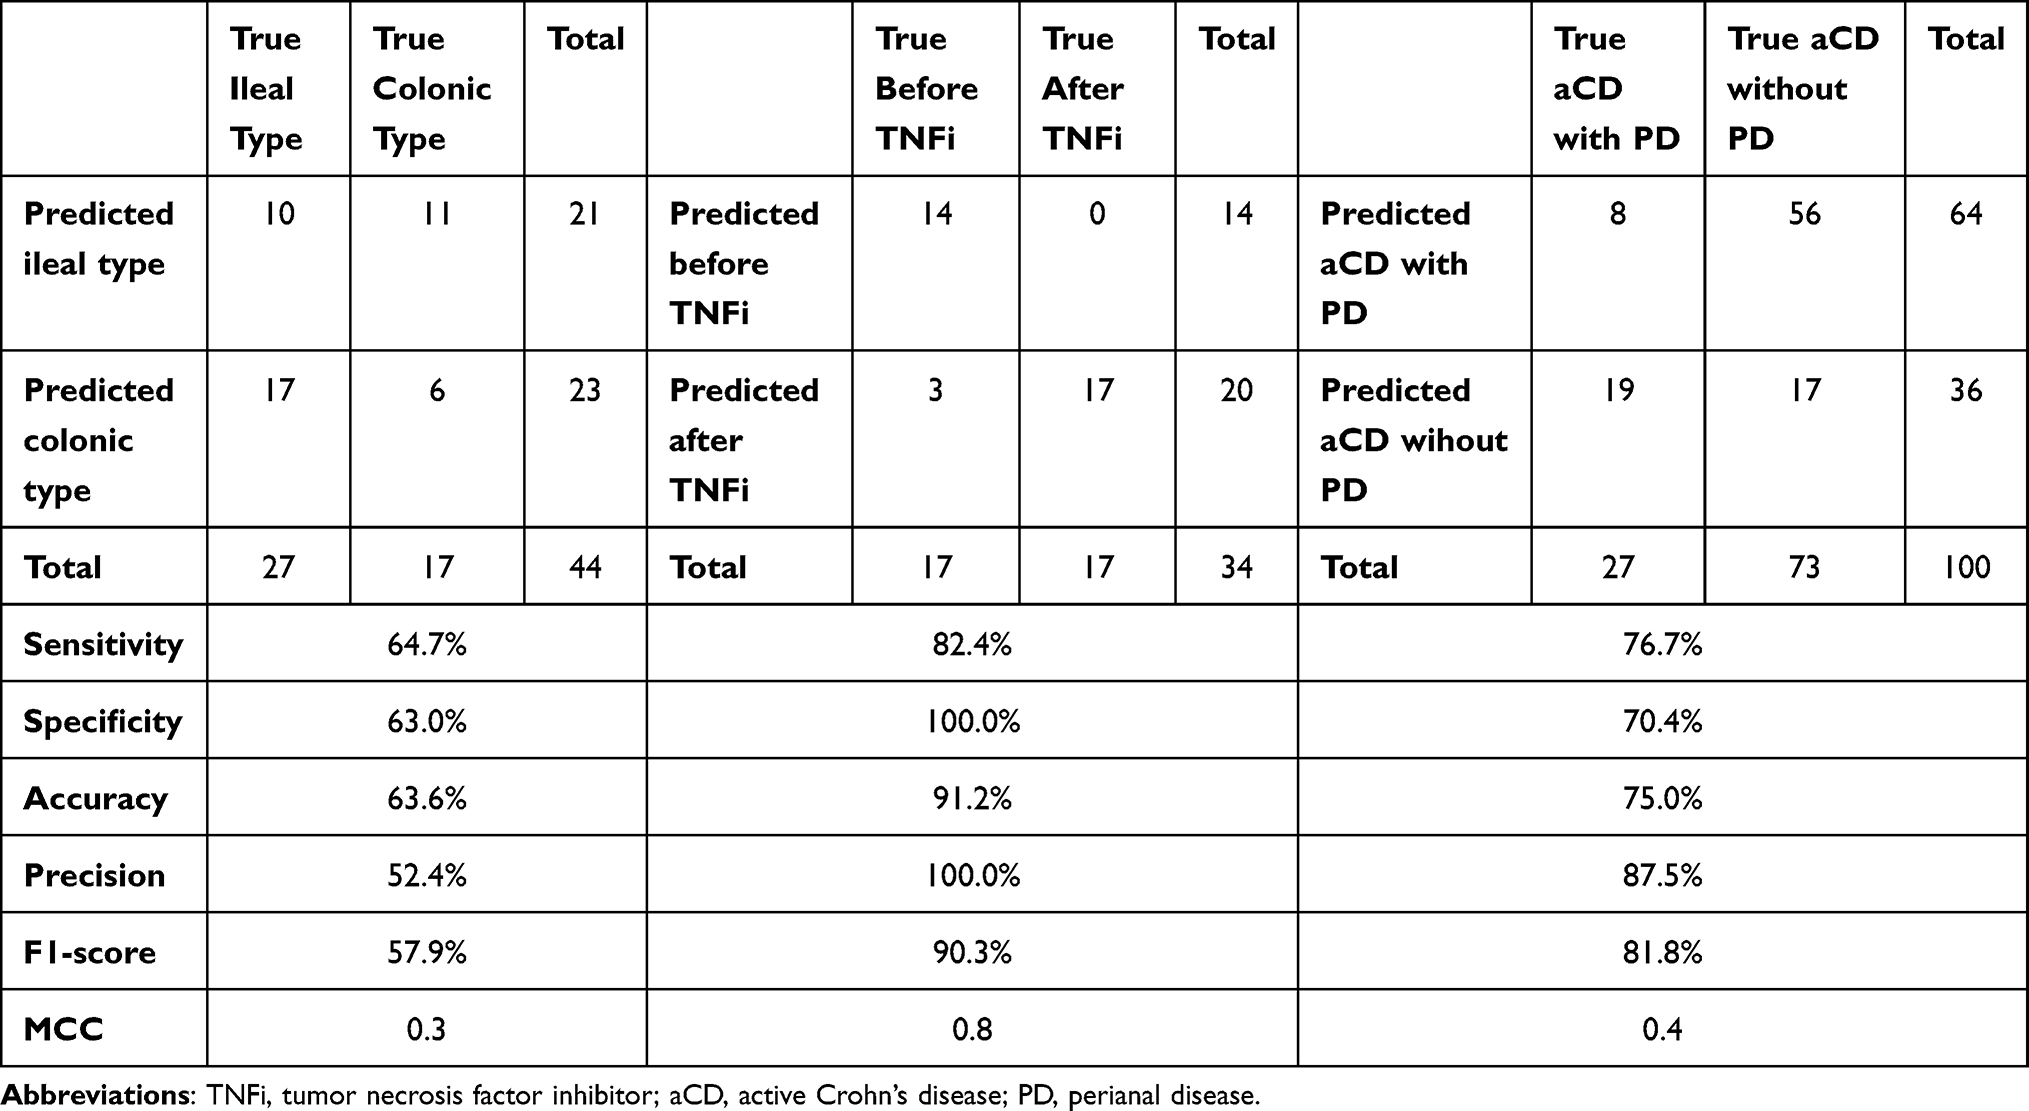 |
Table 3 Confusion Matrix of the Discriminant Models (PCA-SVM) After Leave One Out Cross Validation in aCD with Different Characteristics |
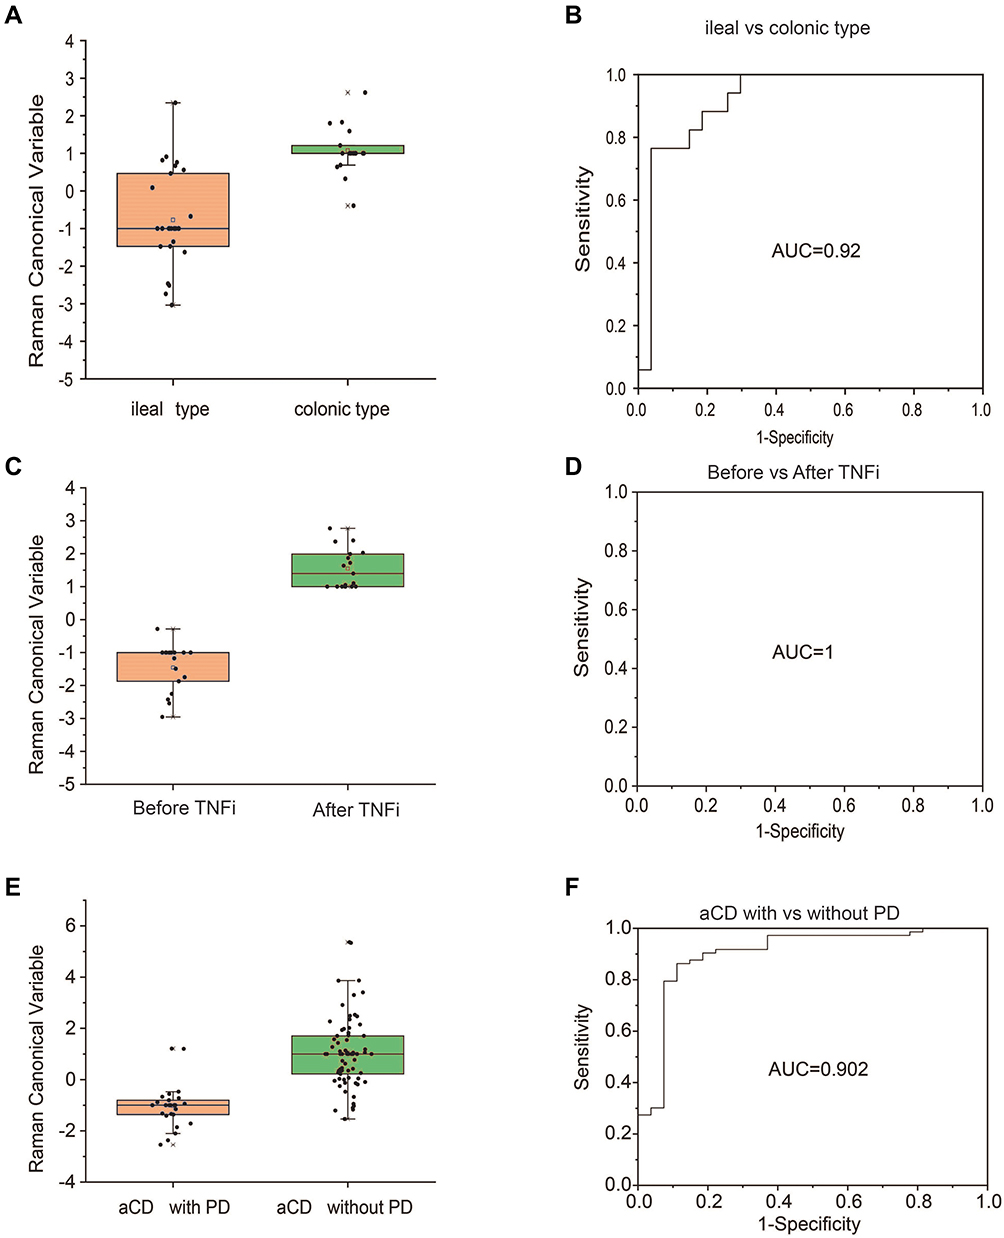 |
Figure 4 The Raman canonical variable score obtained for aCD patients with different characteristics. Data are shown as box and whisker plots. Each data point represents an individual subject analyzed. Each box represents the median and upper and lower quartiles. Receiver operating characteristic curves of the PCA-SVM classifier to discriminate clinical characteristics. (A and B) ileal type vs colonic type; (C and D) aCD before vs after TNFi; (E and F) aCD with vs without PD. Abbreviations: TNFi, tumor necrosis factor inhibitor; aCD, active Crohn’s disease; PCA, principal component analysis; SVM, support vector machine; PD, perianal disease. |
In 17 responders to TNFi, the SERS detected 11 spectra having the significant changes of intensities in urine samples of before and after treatment of TNFi. The different changes of spectra included 5 bands with significant stronger intensity (541, 594, 560, 1346 and 1275 cm−1) and 6 with lower intensity (715, 673, 699, 641, 480 and 888 cm−1) (P<0.05, Supplementary Figure S1). The higher intensity at the 541 cm−1 band assigning to cholesterol palmitate and the lower intensity of 888 cm−1 band belonging to carbohydrates were found in CD patients before TNFi treatment (Supplementary Table S3). In view of this panel of 11 spectra, the SERS classifier to predict before or after treatment obtained an accuracy of 91.2%, with a sensitivity of 82.4%, a specificity of 100%, and AUC of 1 after internal validation (Table 3, Figure 4C and 4D).
To consider the patients with and without perianal disease, SERS analysis revealed 14 characteristic peaks with markedly weaker intensity in aCD patients with PD compared with those without PD (P<0.05, Supplementary Figure S2). By means of an ROC curve (AUC 0.902), the accuracy of the classifier with lower intensity obtained 75% with a sensitivity of 76.7% and specificity of 70.4% after leave-one-patient-out cross-validation (Table 3, Figure 4E and 4F). The corresponding components of these 11 peaks mainly resigned cholesterol, nucleic acids, amino acids and carbohydrates (Supplementary Table S2). In addition, a panel of 11 spectral peaks with significant changes of intensity also were found among patients with different disease behaviors with structuring (B2), inflammatory (B1) or penetrating (B3) behavior (Supplementary Figure S3). These peaks were mainly attributed to amino acids, nucleic acids, cholesterol and lipids (Supplementary Table S2).
Discussion
In this study, we first applied urine SERS as a novel noninvasive method to identify disease characterizations based on a machine-learning method. Given one or a panel of specific changes of spectra intensity, our results showed that the diagnostic models based on Raman spectra could achieve the high accuracy in determining disease characterizations, including disease activity, location (colonic- and ileal-type), before and after TNFi treatment and perianal disease.We indicate that the panel of urine Raman spectral changes can serve as noninvasive diagnostic tools for prediction of different disease characteristics in a rapid, convenient and economic way.
Some serological antibodies have been reported to be helpful in the diagnosis of CD. The combination of ASCA positivity and pANCA negativity showed good specificity for differentiating CD from ulcerative colitis (92.6%); however, the sensitivity was only 62.6%.32 In addition, its relatively high cost also makes it difficult to widely use it in clinical practice. Other serum biomarkers as diagnostic tools, such as anti-OmpC, anti-CBir1 and anti-chitobioside carbohydrate IgA antibodies (ACCAs), are also limited in use due to their high specificity but low sensitivity.33
In recent years, RS as a cell and tissue diagnostic approach has been investigated to distinguish different IBD subtypes based on intestinal biopsies or plasma analysis. Bielecki et al proposed a machine learning-based procedure and found that RS was capable of distinguishing colon tissue morphology among 14 CD, 13 UC patients, and 11 healthy subjects with an accuracy of 98.9%.34 Another study of plasma RS developed a classified model to distinguish 77 CD patients from 45 HC patients with 83.6% accuracy, 80.0% sensitivity, and 85.7% specificity based on the PCA method followed by linear discrimination analysis (LDA).18 Similarly, using the SERS technique to differentiate 28 UC plasma samples from 35 healthy subjects, a study achieved an accuracy of 89%, a sensitivity of 86% and a specificity of 92%.35 Although these results were based on small samples, they have already shown the potential value of RS in the diagnosis of IBD. In our previous study, urine samples collected from 95 CD patients (including 58 aCD patients and 37 iCD patients) and 48 HC were measured by SERS, and the acquired specific spectra successfully differentiated CD patients from HC with an AUC value of 0.93, accuracy of 89.5%, sensitivity of 89.5% and specificity of 89.6% based on PCA-SVM analysis.21 The study indicated the value of urine Raman spectra combined with machine-learning analysis for identification of CD patients from healthy populations. Even if the different disease periods, Raman spectral fingerprints also have an excellent ability to distinguish CD and HC. Its accuracy for discrimination of active CD patients from healthy controls is 90.6% with an AUC value of 0.95, and its efficacy in discriminating inactive CD patients from healthy subjects achieves 83.5% of accuracy, 83.8% of sensitivity and 83.3% of specificity with an AUC of 0.89.21
Based on the results of the previous work by our technical team, we further investigated the value of SERS in identifying various disease characteristics in patients with CD. The Inflammatory biomarkers have also been widely used to evaluate the disease activity of CD patients, but their accuracy is not satisfactory. A pooled analysis showed that CRP had 92% specificity for predicting endoscopically active CD; however, it only achieved 49% of sensitivity,12 which was similar to our result on CRP with 67% of sensitivity and 88.6% of specificity. FCP has been widely used to evaluate disease activity in CD with sensitivity ranging from 81% to 87% and specificity from 67% to 81%.12 In this study, the limited size of CD patients detected FCP. The result contributed to partially inconsistent results to distinguish aCD patients from iCD patients with 50% of sensitivity and 75% of specificity. By our classified model based on the panel of significant changes of spectra intensity, we compared its efficacy with FCP, and achieved the higher discriminant validity with an AUC value of 86.4% than that of FCP with an AUC of 59.6%. Colonoscopy-coupled fiber optic probe-based Raman spectroscopy of the colon identified active IBD from inactive patients with a sensitivity of 67.1% and specificity of 74.5%.24 Our study indicated that the Raman spectral panel could distinguish aCD from iCD patients successfully (sensitivity of 83%, specificity of 76.1%, and an accuracy of 79.8%). The strong correlation between the SERS classifier and endoscopy was observed as well. These data indicated our SERS classifier has a good performance to distinguish disease activity similar to CRP, even higher than FCP and closely related with endoscopic findings. Moreover, cholesterol palmitate (543 cm−1) was obviously increased in aCD patients compared with iCD, which being consistent with the results of obesity promoting bowel inflammation in mice.36 This indicated the diagnostic model based on Raman spectra changes could be the novel and noninvasive diagnostic tool for predicting disease activity.
The disease location is usually detected by endoscopy and imaging. Few biomarkers have been studied in this field. The pANCA is regarded as a characteristic of colonic-type CD, and ASCA is associated with the ileal type with low sensitivity and specificity.37 FCP usually has more accuracy in reflecting colonic active inflammation than in the ileum, which limits its value in identifying small bowel inflammation.38 In this study, we found that a specific Raman peak at 1643 cm-1, which corresponds to the strong C-C stretch of lipids and the C-O stretch of the protein amide I band, has a stronger intensity in predicting colonic-type active CD patients than the ileal-type, with 64.7% sensitivity and 63.6% specificity. We speculate that the 1643 cm-1 band may become a specific spectrum biomarker for the colonic type of CD.
There are few reliable biomarkers to predict treatment efficacy. IFX has been used for IBD treatment for more than 20 years worldwide. Many biomarkers have been performed to predict its efficacy on predicting efficacy, such as albumin, serum cytokines, proteomic markers and mucosal markers.39 However, no ideal marks are widely used in clinical applications due to low accuracy and complicated processes. In this study, we were surprised to find that the responders to TNFi treatment had special spectral changes before and after therapy. The SERS classifier model obtained a high accuracy of 91.2% with a sensitivity of 82.4% and specificity of 100%.
SERS reflects the vibrational fingerprint information of nucleic acids, proteins, lipids and other substances as a cell and tissue diagnostic approach. Cholesterol palmitate (541 cm−1) was also significantly increased in aCD patients before TNFi treatment compared with posttreatment, which being consistent with the higher cholesterol palmitate (543 cm−1) in patients with aCD compared with iCD patients. This further indicated that a high-fat diet might be related to intestinal inflammation.40 We further explored the role of SERS in recognizing CD patients with perianal disease. Interestingly, the results showed that active CD patients with PD had a distinctly weaker intensity of 14 special peaks than those without PD. The predictive model achieved an accuracy of 75% with a sensitivity of 76.7% and specificity of 70.4%. Until now, no biomarkers have been investigated in distinguishing PD in CD patients. The SERS classifier may provide a promising method to diagnose PD more simply and conveniently than ultrasound.
This is the first study to explore the value of specific changes of Raman spectra in identification of characterization of CD patients with the largest sample sizes until now. At the same time, our results confirmed the diagnostic power of the SERS classified model in differentiating disease activity after PCA-SVM procedure. The other disease characteristics including location, before and after treatment and combination of perianal disease also were evaluated by SERS classifiers. The limitations of this study were lack of other benign bowel diseases as controls, and the large-scale prospective cohort validation study is needed, although we did the internal validation.
Conclusion
In conclusion, the specific changes of urine Raman spectra could be a novel easy, rapid and noninvasive diagnostic tool for identifying the disease characterizations based on the urine metabolic changes. Our SERS classifier achieved the similar efficacy to CRP in assessment of disease activity. Furthermore, it gets the higher discriminant validity than FCP and closely related with endoscopic findings. Although some disease characterizations, such as disease location and changes related to treatment could be discriminated noninvasively by SERS classifiers, the larger sample size of the researches are needed to evaluate its value in the future.
Abbreviations
CD, Crohn’s disease; IBD, inflammatory bowel disease; TNFi, tumor necrosis factor inhibitor; CRP, C-reactive protein; pANCA, perinuclear antineutrophil cytoplasmic; ASCA, anti-Saccharomyces cerevisiae antibodies; antiGP2, anti-glycoprotein 2; FCP, fecal calprotectin; RS, Raman spectroscopy; UC, ulcerative colitis; HC, healthy controls; SERS, surface-enhanced Raman spectroscopy; PCA-SVM, principal component analysis and support vector machine; aCD, active CD; CDAI, Crohn’s Disease Activity Index; iCD, inactive CD; MH, mucosal healing; TEM, transmission electron microscopy; IFX, infliximab; PD, perianal disease; IQR, interquartile range; PCs, principal components; ROC, receiver operating characteristic; AUC, area under the curve; PPV, positive predictive value; NPV, negative predictive value; LR+, positive likelihood ratio; LR-, negative likelihood ratio; ACCAs, anti-chitobioside carbohydrate IgA antibodies; LDA, linear discrimination analysis.
Data Sharing Statement
The datasets generated during and/or analyzed during the current study are available from the corresponding authors on reasonable request.
Acknowledgments
The authors would like to thank the Department staff for their generous assistance.
Author Contributions
XL-W, YL-W and HN-Y conceived and designed the research. All authors contributed to data analysis, drafting or revising the manuscript, have agreed on the journal to which the manuscript will be submitted, gave final approval of the version to be published, and agree to be accountable for all aspects of the work.
Funding
This study was supported by the National Natural Science Foundation of China (No.81970449).
Disclosure
The authors declare that there are no conflicts of interest.
References
1. Danese S, Sandborn WJ, Colombel JF, et al. Endoscopic, radiologic, and histologic healing with vedolizumab in patients with active Crohn’s disease. Gastroenterology. 2019;157(4):1007–1018.
2. Sands BE, Sandborn WJ, Van Assche G, et al. Vedolizumab as induction and maintenance therapy for Crohn’s disease in patients naïve to or who have failed tumor necrosis factor antagonist therapy. Inflamm Bowel Dis. 2017;23(1):97–106. doi:10.1097/MIB.0000000000000979
3. Wright EK, De Cruz P, Gearry R, et al. Fecal biomarkers in the diagnosis and monitoring of Crohn’s disease. Inflamm Bowel Dis. 2014;20(9):1668–1677. doi:10.1097/MIB.0000000000000087
4. Sands BE. Biomarkers of inflammation in inflammatory bowel disease. Gastroenterology. 2015;149(5):1275–1285. doi:10.1053/j.gastro.2015.07.003
5. Peyrin-Biroulet L, Reinisch W, Colombel JF, et al. Clinical disease activity, C-reactive protein normalisation and mucosal healing in Crohn’s disease in the SONIC trial. Gut. 2014;63(1):88–95. doi:10.1136/gutjnl-2013-304984
6. Florin TH, Paterson EW, Fowler EV, et al. Clinically active Crohn’s disease in the presence of a low C-reactive protein. Scand J Gastroenterol. 2006;41(3):306–311. doi:10.1080/00365520500217118
7. Peeters M, Joossens S, Vermeire S, et al. Diagnostic value of anti-Saccharomyces cerevisiae and antineutrophil cytoplasmic autoantibodies in inflammatory bowel disease. Am J Gastroenterol. 2001;96(3):730–734. doi:10.1111/j.1572-0241.2001.03613.x
8. Bonneau J, Dumestre-Perard C, Rinaudo-Gaujous M, et al. Systematic review: new serological markers (anti-glycan, anti-GP2, anti-GM-CSF Ab) in the prediction of IBD patient outcomes. Autoimmun Rev. 2015;14(3):231–245. doi:10.1016/j.autrev.2014.11.004
9. Schaefer JS, Attumi T, Opekun AR, et al. MicroRNA signatures differentiate Crohn’s disease from ulcerative colitis. BMC Immunol. 2015;16:5. doi:10.1186/s12865-015-0069-0
10. Larabi A, Barnich N, Nguyen HTT. Emerging role of exosomes in diagnosis and treatment of infectious and inflammatory bowel diseases. Cells. 2020;9(5):1111. doi:10.3390/cells9051111
11. Ayling RM, Kok K. Fecal calprotectin. Adv Clin Chem. 2018;87:161–190.
12. Ma C, Battat R, Parker CE, et al. Update on C-reactive protein and fecal calprotectin: are they accurate measures of disease activity in Crohn’s disease? Expert Rev Gastroenterol Hepatol. 2019;13(4):319–330. doi:10.1080/17474124.2019.1563481
13. Stanke-Labesque F, Pofelski J, Moreau-Gaudry A, et al. Urinary leukotriene E-4 excretion: a biomarker of inflammatory bowel disease activity. Inflamm Bowel Dis. 2008;14(6):769–774. doi:10.1002/ibd.20403
14. Bolignano D, Della Torre A, Lacquaniti A, et al. Neutrophil gelatinase-associated lipocalin levels in patients with Crohn disease undergoing treatment with infliximab. J Investig Med. 2010;58(3):569–571. doi:10.2310/JIM.0b013e3181ccc20c
15. Sato S, Sekine R, Kagoshima H, et al. All-in-one Raman spectroscopy approach to diagnosis of colorectal cancer: analysis of spectra in the fingerprint regions. J Anus Rectum Colon. 2019;3(2):84–90. doi:10.23922/jarc.2018-039
16. D’Acunto M, Gaeta R, Capanna R, et al. Contribution of raman spectroscopy to diagnosis and grading of chondrogenic tumors. Sci Rep. 2020;10(1):2155. doi:10.1038/s41598-020-58848-0
17. Ramírez-Elías MG, González FJ. Raman spectroscopy for in vivo medical diagnosis. In: Morari Do Nascimento G, editor. Raman Spectroscopy. IntechOpen; 2018:293.
18. Morasso C, Truffi M, Vanna R, et al. Raman analysis reveals biochemical differences in plasma of Crohn’s disease patients. J Crohns Colitis. 2020;14(11):1572–1580. doi:10.1093/ecco-jcc/jjaa080
19. Acri G, Venuti V, Costa S, et al. Raman spectroscopy as noninvasive method of diagnosis of pediatric onset inflammatory bowel disease. Appl Sci. 2020;10(19):6974. doi:10.3390/app10196974
20. Bi X, Walsh A, Mahadevan-Jansen A, et al. Development of spectral markers for the discrimination of ulcerative colitis and Crohn’s disease using Raman spectroscopy. Dis Colon Rectum. 2011;54(1):48–53. doi:10.1007/DCR.0b013e3181fcf68d
21. Li B, Wu Y, Wang Z, et al. Non-invasive diagnosis of Crohn’s disease based on SERS combined with PCA-SVM. Anal Methods. 2021;13(44):5264–5273. doi:10.1039/D1AY01377G
22. Gomollón F, Dignass A, Annese V, et al. 3rd European evidence-based consensus on the diagnosis and management of Crohn’s disease 2016: part 1: diagnosis and medical management. J Crohns Colitis. 2017;11(1):3–25. doi:10.1093/ecco-jcc/jjw168
23. Pastore M, Rotondo P, Erba V, et al. Statistical learning theory of structured data. Phys Rev E. 2020;102(3–1):032119. doi:10.1103/PhysRevE.102.032119
24. Pence IJ, Beaulieu DB, Horst SN, et al. In vivo clinical characterization of inflammatory bowel disease with Raman spectroscopy. Biomed Opt Express. 2017;8(2):524–535. doi:10.1364/BOE.8.000524
25. Notingher I, Green C, Dyer C, et al. Discrimination between ricin and sulphur mustard toxicity in vitro using Raman spectroscopy. J R Soc Interface. 2004;1(1):79. doi:10.1098/rsif.2004.0008
26. Czamara K, Majzner K, Pacia MZ, et al. Raman spectroscopy of lipids: a review. J Raman Spectrosc. 2015;46(1):4–20. doi:10.1002/jrs.4607
27. Stone N, Kendall C, Smith J, et al. Raman spectroscopy for identification of epithelial cancers. Faraday Discuss. 2004;126:141–157. doi:10.1039/b304992b
28. Talari ACS, Movasaghi Z, Rehman S, et al. Raman spectroscopy of biological tissues. Appl Spectr Rev. 2015;50:46–111. doi:10.1080/05704928.2014.923902
29. Mahadevan-Jansen A, Richards-Kortum R. Raman spectroscopy for the detection of cancers and precancers. J Biomed Opt. 1996;1(1):31–70. doi:10.1117/12.227815
30. De Gelder J, De Gussem K, Vandenabeele P, et al. Reference database of Raman spectra of biological molecules. J Raman Spectrosc. 2007;38:1133–1147. doi:10.1002/jrs.1734
31. Vanna R, Ronchi P, Lenferink ATM, et al. Label-free imaging and identification of typical cells of acute myeloid leukaemia and myelodysplastic syndrome by Raman microspectroscopy. Analyst. 2015;140(4):1054–1064. doi:10.1039/C4AN02127D
32. Reese GE, Constantinides VA, Simillis C, et al. Diagnostic precision of anti-Saccharomyces cerevisiae antibodies and perinuclear antineutrophil cytoplasmic antibodies in inflammatory bowel disease. Am J Gastroenterol. 2006;101(10):2410–2422. doi:10.1111/j.1572-0241.2006.00840.x
33. Prideaux L, De Cruz P, Ng SC, et al. Serological antibodies in inflammatory bowel disease: a systematic review. Inflamm Bowel Dis. 2012;18(7):1340–1355. doi:10.1002/ibd.21903
34. Bielecki C, Bocklitz TW, Schmitt M, et al. Classification of inflammatory bowel diseases by means of Raman spectroscopic imaging of epithelium cells. J Biomed Opt. 2012;17(7):076030. doi:10.1117/1.JBO.17.7.076030
35. Tefas C, Mărginean R, Toma V, et al. Surface-enhanced Raman scattering for the diagnosis of ulcerative colitis: will it change the rules of the game? Anal Bioanal Chem. 2021;413(3):827–838. doi:10.1007/s00216-020-03036-2
36. Li X, Li X. Obesity promotes experimental colitis by increasing oxidative stress and mitochondrial dysfunction in the colon. Inflammation. 2020;43(5):1884–1892. doi:10.1007/s10753-020-01261-6
37. Atreya R, Siegmund B. Location is important: differentiation between ileal and colonic Crohn’s disease. Nat Rev Gastroenterol Hepatol. 2021;18(8):544–558. doi:10.1038/s41575-021-00424-6
38. D’Haens G, Ferrante M, Vermeire S, et al. Fecal calprotectin is a surrogate marker for endoscopic lesions in inflammatory bowel disease. Inflamm Bowel Dis. 2012;18(12):2218–2224. doi:10.1002/ibd.22917
39. Gisbert JP, Chaparro M. Predictors of primary response to biologic treatment [anti-TNF, vedolizumab, and ustekinumab] in patients with inflammatory bowel disease: from basic science to clinical practice. J Crohns Colitis. 2020;14(5):694–709. doi:10.1093/ecco-jcc/jjz195
40. Ruemmele FM. Role of diet in inflammatory bowel disease. Ann Nutr Metab. 2016;68(Suppl 1):S33–S41. doi:10.1159/000445392
 © 2022 The Author(s). This work is published and licensed by Dove Medical Press Limited. The full terms of this license are available at https://www.dovepress.com/terms.php and incorporate the Creative Commons Attribution - Non Commercial (unported, v3.0) License.
By accessing the work you hereby accept the Terms. Non-commercial uses of the work are permitted without any further permission from Dove Medical Press Limited, provided the work is properly attributed. For permission for commercial use of this work, please see paragraphs 4.2 and 5 of our Terms.
© 2022 The Author(s). This work is published and licensed by Dove Medical Press Limited. The full terms of this license are available at https://www.dovepress.com/terms.php and incorporate the Creative Commons Attribution - Non Commercial (unported, v3.0) License.
By accessing the work you hereby accept the Terms. Non-commercial uses of the work are permitted without any further permission from Dove Medical Press Limited, provided the work is properly attributed. For permission for commercial use of this work, please see paragraphs 4.2 and 5 of our Terms.