")
Back to Journals » International Journal of General Medicine » Volume 16
The Role of RNA Methylation Modification Related Genes in Prognosis and Immunotherapy of Colorectal Cancer
Authors Lin R , Chen R, Ye L, Huang Z, Lin X, Chen T
Received 4 February 2023
Accepted for publication 16 May 2023
Published 31 May 2023 Volume 2023:16 Pages 2133—2147
DOI https://doi.org/10.2147/IJGM.S405419
Checked for plagiarism Yes
Review by Single anonymous peer review
Peer reviewer comments 2
Editor who approved publication: Dr Scott Fraser
Ruoyang Lin,1 Renpin Chen,1 Lechi Ye,2 Zhiming Huang,1 Xianfan Lin,1 Tanzhou Chen1
1Department of Gastroenterology and Hepatology, the First Affiliated Hospital of Wenzhou, Medical University, Wenzhou, People’s Republic of China; 2Department of Colorectal and Anal Surgery, the First Affiliated Hospital of Wenzhou, Medical University, Wenzhou, People’s Republic of China
Correspondence: Tanzhou Chen, Tel +8613706661269, Email [email protected]
Background: Researches showed RNA methylation genes can affect the prognosis of tumors. Thus, the study aimed to comprehensively analyze the effects of RNA methylation regulatory genes in prognosis and treatment of colorectal cancer (CRC).
Methods: Prognostic signature associated with CRCs were constructed by differential expression analysis, Cox and Least Absolute Shrinkage and Selection Operator (LASSO) analyses. Receiver operating characteristic (ROC) and Kaplan–Meier survival analyses were used to validate the reliability of the developed model. Gene Ontology (GO), Gene set variation analysis (GSVA), and the Kyoto Encyclopedia of Genes and Genomes (KEGG) pathway analysis were performed for functional annotation. Finally, normal and cancerous tissue were collected to validate gene by quantitative real-time PCR (qRT-PCR).
Results: A prognostic risk model based on leucine rich pentatricopeptide repeat containing (LRPPRC) and ubiquitin-like with PHD and ring finger domains 2 (UHRF2) was constructed and relevant to the overall survival (OS) of CRC. Functional enrichment analysis revealed that collagen fibrous tissue, ion channel complex and other pathways were significantly enriched, which might help explain the underlying molecular mechanisms. There were significant differences in ImmuneScore, StromalScore, ESTIMATEScore between high- and low-risk groups (p < 0.05). Ultimately, qRT-PCR validation showed that a significant upregulation in the expression of LRPPRC and UHRF2 in cancerous tissue, which verified the effectiveness of our signature.
Conclusion: In conclusion, 2 prognostic genes (LRPPRC and UHRF2) related to RNA methylation were identified by bioinformatics analysis, which might supply a new insight into the treatment and evaluation of CRC.
Keywords: colorectal cancer, prognosis, RNA methylation regulatory genes, tumor microenvironment, immunotherapy
Introduction
CRC is a one of the leading causes of death, which has high lethality rate worldwide. Despite the rapid development of diagnosis and treatment techniques for CRC in recent years, each therapeutic method, such as chemotherapy drugs, targeted drugs, immunotherapy, still has its own limitations, and the prognosis of CRC cases is poor, with only 60% a 5-year survival rate.1 In addition, there are still few prognostic markers for CRC. Therefore, investigating the diagnosis, prognostic evaluation, and molecular markers related to clinical features of CRC are very meaningful.2
Epigenetic modification includes DNA methylation, histone modification, and RNA methylation.3 These modifications greatly enrich the diversity of RNA functions and genetic information.4 At present, RNA methylation is a research hotspot, which is a post-transcriptional level regulation mode. RNA methylation modification includes a variety of modification modes, including N6-methyladenosine (m6A), N5-methylcytosine (m5C), N1-methyladenosine (m1A) and N7-Methylguanosine (m7G), which is important in RNA metabolism, cell differentiation and protein production. Studies have shown that RNA methylation participated in the regulation of the development, invasion, and metastasis of tumors.5,6 The dysregulation and mutation of RNA modification genes are relevant to the occurrence of many cancers and can impact the prognosis of tumors.7,8 For example, methyltransferase-like 3 (METTL3) is an important m6A regulatory enzyme in the development of CRC. METTL3 contributed to the initiation and advancement of CRC by inducing the M6A- glucose transporter 1 (GLUT1) - mechanistic target of rapamycin complex 1 (mTORC1) axis.9 In addition, the highly expressed NOP2/Sun RNA methyltransferase 5 (NSUN5) promoted tumor cells proliferation by controlling the cell cycle in CRC.10 However, a comprehensive analysis of the effect of methylation regulatory enzymes on the prognosis of CRC has not been reported.
Tumor immunotherapy has received increasing attention in recent years. Immune checkpoint inhibitor is a treatment for many advanced malignancies, offering a new paradigm of cancer treatment through the immune system of the patient. RNA methylation regulates RNA splicing, translocation and translation efficiency and has a critical effect in immune cell proliferation, differentiation and immune function. Therefore, studying RNA modification regulatory genes can better understand the process of tumor development and better guide tumor treatment.11 In this study, we downloaded CNV, single nucleotide variation (SNV), and mRNA data of CRC, and then analyzed the mutations of m1A, m5C, m6A and m7G regulatory genes and CNV in CRC cases. Then, a survival risk model was constructed based on m1A, m5C, m6A and m7G, which was verified by clinical specimens. This study was the first comprehensive analysis of the effects of m1A, m5C, m6A, and m7G-related methylated genes in the prognosis of CNV, SNV, and transcriptome data, and to explore the correlation with immunotherapy and tumor microenvironment.
Materials and Methods
Data Sources
RNA sequencing, CNV, and somatic mutation data of the Cancer Genome Atlas-Colorectal Cancer (TCGA-CRC) dataset were acquired from TCGA database (https://portal.gdc.cancer.gov/). 365 CRC cases were collected from TCGA database construction after removing samples with no survival status, survival time and survival time of 0 (or negative). Moreover, transcriptome data of 365 cases, CNV data of 362 cases, and somatic mutation data of 343 cases were available. Similarly, the RNA-seq data and clinical information of 556 CRC cases in the GSE39582 dataset (external validation cohort) were acquired from the Gene Expression Omnibus (GEO) database (https://www.ncbi.nlm.nih.gov/geo/).
RNA Methylation Regulatory Genes
By searching the published literature, 54 RNA methylation regulatory genes were identified. In accordance with previous reports, genes TRMT10C, TRMT61B, TRMT6, TRMT61A, ALKBH3, ALKBH1, YTHDC1, YTHDF1, YTHDF2 and YTHDF3 were acquired as regulators of m1A.7,12 Some m5C regulatory genes were collected, including DNMT1, DNMT3A, DNMT3B, MBD1, MBD2, MBD3, MBD4, MECP2, NEIL1, NTHL1, SMUG1, TDG, UHRF1, UHRF2, UNG, ZBTB33, ZBTB38, ZBTB4, TET1, TET2 and TET3.13,14 21 m6A regulators were acquired, comprising METTL3, METTL14, RBM15, RBM15B, WTAP, KIAA1429, CBLL1, ZC3H13, ALKBH5, FTO, YTHDC1, YTHDC2, YTHDF1, YTHDF2, YTHDF3, IGF2BP1, HNRNPA2B1, HNRNPC, FMR1, LRPPRC and ELAVL1.15 METTL1, WDR4, WBSCR22, TRMT112, NCBP2 and NCBP1 were used as m7G-related regulators.
Building and Proving of the Prognostic Gene Signature
To expound the prognostic correlation between RNA methylation genes and CRC cases, the samples from TCGA-CRC database were classified into a training cohort (n = 256) and an internal validation cohort (n = 109) with:3 at random. The GEO dataset GSE39582 (CRC samples n = 556) was used as external validation cohort to verify the prognostic signature. In TCGA-CRC training cohort, the prognostic of methylation regulatory genes was gotten by a univariate Cox regression analysis (R package “survival”, version 3.2–3). The LASSO was used to get gene signature. The risk score of each case was computed in TCGA-CRC training, internal, and GEO validation cohorts by following formula. Cox regression analysis was used to determine independent prognostic factors, such as age, gender, stage, T, N, M stages and risk score.
Nomogram
To study the prognostic value of the model, the nomogram was constructed to predict the survival of CRC patients by R package “rms” (version 6.2–0), and the risk model factors were scored separately. The scores were added to obtain an overall score, which used to predict survival probability. And the higher scores associated with lower survival probability. Then we constructed the correction curve of the nomogram and observed its prediction accuracy.
Functional Enrichment Analysis
To explore the function of genes, functional enrichment analysis was implemented. DEGs between high and low risk cohort were gotten by differential expression analysis. The “clusterProfiler” (Version 3.18.0) R package was used for enrichment analysis based on KEGG and GO databases to find the common functions and related pathways of differentially expressed genes (DEGs). We used GSVA package (Version 1.38.2) to obtain the enrichment score of the samples in each pathway. Then, the differences in pathways between the high- and low-risk groups were gotten by t-test.
Estimation of Immune Cell Infiltration and Immune Therapy Response
The immune infiltration levels were analyzed via ESTIMATE and CIBERSORT. Rank sum test was used to compare the expression of 9 kinds of immune checkpoint in high- and low-risk groups. The immunotherapy response between high- and low-risk groups was contrasted by Submap (https://cloud.genepattern.org/gp).
Validation of the Gene Expression
Then we collected 10 CRC tissues and 10 normal tissues from the First Affiliated Hospital of Wenzhou Medical University to perform qRT-PCR, and this study was consented to by all participants. This study was approved by the Ethics committee at the First Affiliated Hospital of Wenzhou Medical University. Total RNA was extracted using TRIzol Reagent (Ambion, USA). Total RNA was reversed into cDNA using sweScript RT I First strand cDNA SynthesisAll-in-OneTM First-Strand cDNA Synthesis Kit (Servicebio, China), and qRT-PCR was conducted using 2xUniversal Blue SYBR Green qPCR Master Mix (Servicebio, China). We used GAPDH as an internal control. The forward primer of LRPPRC was “ATCCACCAACATAAGTTTCCC”. The reverse primer of LRPPRC was “CAGTCTCGCCTTTCTCTACCA”. The forward primer of UHRF2 was “CCTGCTCCTTGGACCTCTG”. The reverse primer of UHRF2 was “TGGGCTGCTTCTTTGACTG”. The forward primer of GAPDH was “CCCATCACCATCTTCCAGG”. The reverse primer of GAPDH was “CATCACGCCACAGTTTCCC”.
Results
The Landscape of Genetic Variations of RNA Methylation Genes in CRC
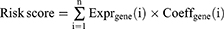
We analyzed and visualized the mutation frequency of 53 RNA methylation regulatory genes (TRMT10C without data). For the SNV, we found that the most frequent mutation of 53 genes was missense mutation. Mutation frequencies of the top 5 genes were ZC3H13, TET1, TET3, KIAA1429 and YTHDC2 (Figure 1A and B). Moreover, as shown in Figure 1C, the amplification frequencies of YTHDF1, DNMT3B, ZC3H13, HNRNPA2B1 and KIAA1429 were the highest. The genes MBD2, MBD1, ZBTB4, ALKBH5 and NEIL1 showed higher frequency copy number deletion.
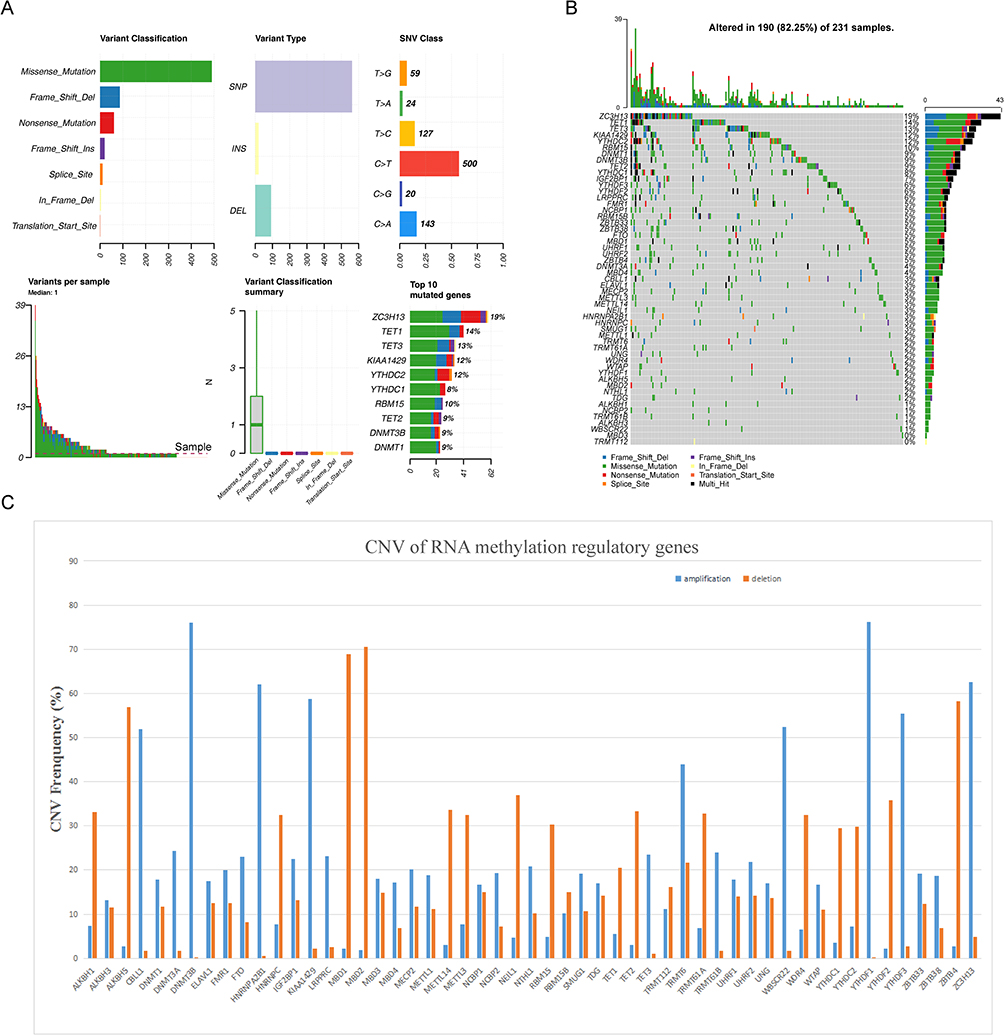 |
Figure 1 The landscape of genetic variations of RNA methylation regulatory genes in colorectal cancer. (A) Mutation analysis of 53 RNA methylation regulatory genes. (B) The frequency of mutations in genes showed by waterfall plot, the five genes with the highest mutation frequency were ZC3H13, TET1, TET3, KIAA1429 and YTHDC2. (C) Bar chart shows amplification and deletion frequency of RNA methylation regulating genes. |
Correlation Analysis of Gene Expression and Somatic Mutation & CNV Patterns
In order to obtain genes significantly associated with somatic mutations, we analyzed the relationship between somatic mutations and the expression levels of RNA methylation regulatory genes. As shown in Figure S1A, the expressions of DNMT1, METL1, METL14, NCBP1, RBM15, TET12, ZBTB38, ZC3H13 were significantly correlated with their mutations. The differences of gene expression in the different CNV groups were shown in Figure S1B. The abundance of some genes (such as ALBKH1, CBLL1, DNMT1, ALBKH5 and ELAVL1, Etc.) were significantly correlated with the occurrence of CNV.
Relationship Between RNA Methylation Genes and Clinical Stages
The expression of genes at different T, N, M stages were compared by rank-sum test. It can be seen that expression of CBLL1, HNRNPC, ZBTB38 and YTHDC2 were significantly correlated with T stages in Figure S2A. The differences in gene expression between N0 and N+ (N+ vs N0, N+ is the staging of N1, N2, and N3,) were analyzed and compared, we found that the expressions of DNMT3A, FTO, IGF2BP1, KIAA1429, LRPPRC, MBD2, MECP2, METTL14, NCBP2, TET1, TET3, TRMT61B, UHRF1, UNG, YTHDC2, YTHDF2, and ZC3H13 were significantly correlated with N stages (Figure S2B). And the expressions of TET3, UHRF1 and YTHDF2 were significantly correlated with M stages (Figure S2C).
Prognostic Value of Clinical Stages
The above analysis showed that RNA methylation regulatory genes were related to TNM stages. Then, we analyzed the relationship between stages and prognosis via K-M curve analysis. Figure 2A showed that T, N, M stages had significant prognostic significance. In this study, we revealed that 23 genes were associated with at least one stage in T, N, M stage, and the list of genes was in the Table S1. The expression of these genes was shown in Figure 2B.
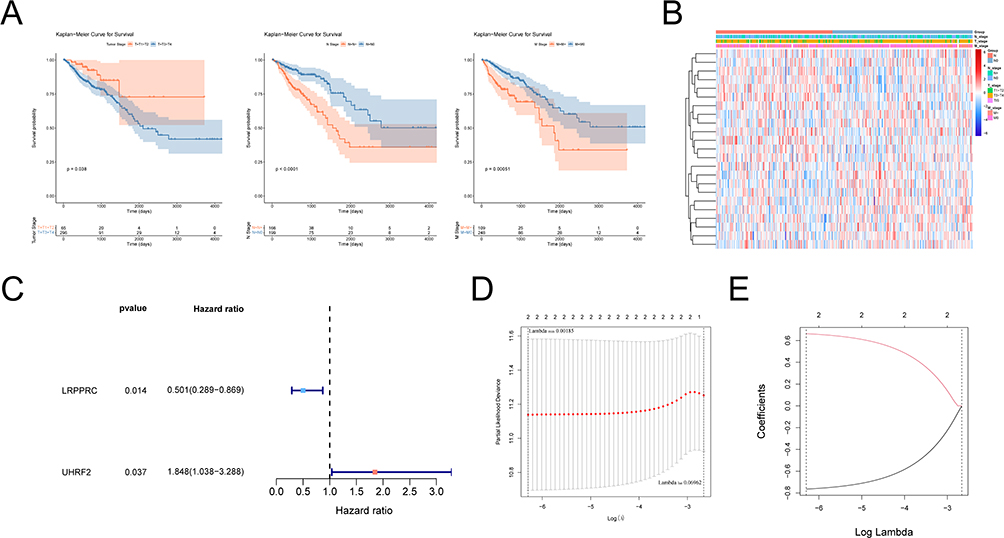 |
Figure 2 Correlation analysis of RNA methylation regulatory genes and prognosis. (A) Kaplan-Meier survival curve analysis showed the correlation between T, N, M stage and prognosis. (B) Heat map showing the correlation between RNA methylation genes and T, N, M staging. (C) Forest map of RNA methylation regulation genes by univariate Cox analysis. Red dots represent risk factors and blue dots represent protective factors. (D) The cross-verification results of tuning parameter (lambda) selection in the LASSO model. (E) LASSO coefficient profiles of two model genes. Each curve represents the changing trajectory of each independent variable coefficient. The ordinate is the value of the coefficient, the lower abscissa is log (lambda), and the upper abscissa is the number of non-zero coefficients in the LASSO model. |
Identification and Confirmation of RNA Methylation Regulators Signature
Firstly, two RNA methylation regulatory genes (LRPPRC and UHRF2) were gotten by univariate Cox analysis, and the univariate Cox analysis results were shown in Table S2. As shown in Figure 2C, LRPPRC was a protective factor for survival of CRC patients, and UHRF2 was a risk factor. Then we set parameter family as Cox to achieve LASSO logistic regression to reduce feature dimensions. There were two corresponding model genes when lambdamin was 0.002 (Figure 2D and E). Therefore, LASSO analysis was used to build a prognostic signature with LRPPRC, UHRF2, and the risk coefficients of each gene were shown in Table 1.
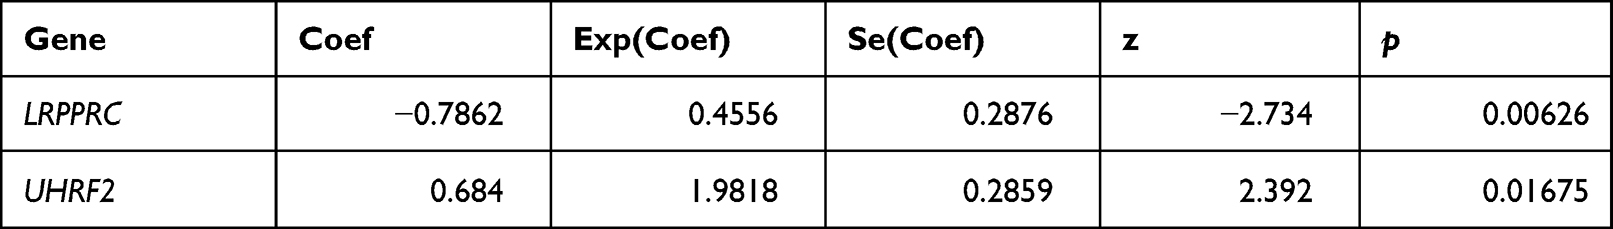 |
Table 1 The Risk Coefficients of Each Gene by LASSO Regression Analysis |
To assess the prognostic of risk model, cases in TCGA training were classified into high and low-risk group according to the medium value of risk score. The risk curve was composed of upper, middle, and lower parts, and the dotted line was Median Riskscore (0.963) (Figure 3A). By survival analysis, the OS of cases in the low-risk group were longer than that in the high-risk group in the TCGA-CRC training cohort (Figure 3B). ROC curves were shown in Figure 3C. The AUC values of ROC curves in the training cohort were all greater than 0.6, indicating that the risk model had good prognostic value.
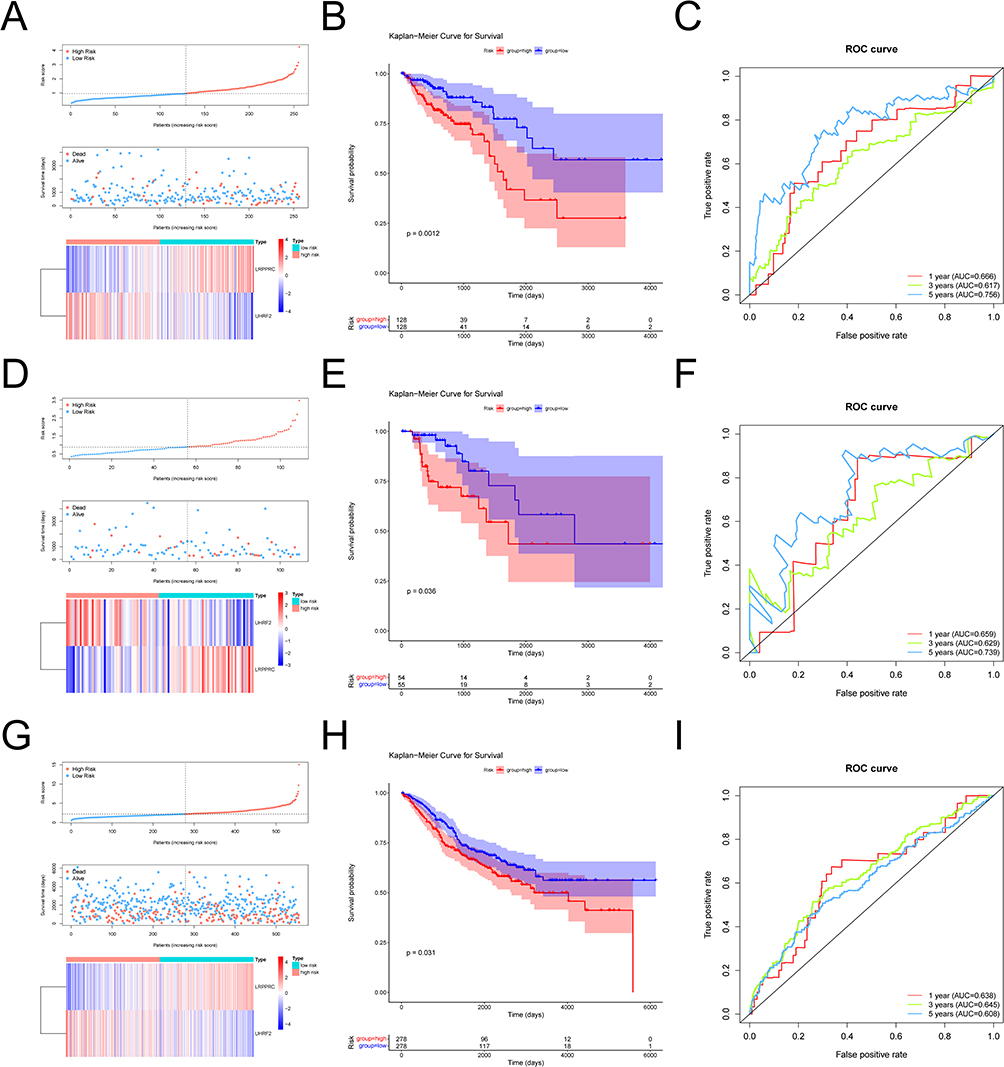 |
Figure 3 Evaluation and validation of prognostic models. (A) Risk curve, scatter plot and model gene expression heat map of high and low risk groups in training cohort. (B) Kaplan-Meier survival curves for high and low risk groups in training cohort. Red represents the high risk group and blue represents the low risk group. (C) ROC curves for high and low risk groups at 1 year, 3 years, 5 years in training cohort. (D) Risk curve, scatter plot and model gene expression heat map of high and low risk groups in internal validation cohort. (E) Kaplan-Meier survival curves for high and low risk groups in internal validation cohort. Red represents the high risk group and blue represents the low risk group. (F) ROC curves for high and low risk groups at 1 year, 3 years, 5 years in internal validation cohort. (G) Risk curve, scatter plot and model gene expression heat map of high and low risk groups in external validation cohort. (H) Kaplan-Meier survival curves for high and low risk groups in external validation cohort. Red represents the high risk group and blue represents the low risk group. (I) ROC curves for high and low risk groups at 1 year, 3 years, 5 years in external validation cohort. |
Then we also separated the TCGA internal validation cases into the high and low risk group. After analyzing the risk curve, scatter plot (Figure 3D), survival curves (Figure 3E) and ROC curve (Figure 3F), it was also found that high-risk group had lower survival time (p = 0.036). And in the ROC curve, AUC of nodes at 1, 3 and 5 years were all greater than 0.6. Finally, the risk model was externally validated using GSE48075. Corresponding to the results of the training cohort and the internal validation cohort, the same low-risk group had a better survival prognosis (p = 0.031) (Figure 3G-I).
The Relevance of Risk Scores to Clinical Characteristics in CRC
Correlation analysis was conducted between age, Stage, T, N, M stages and risk score of CRC samples from TCGA database (n = 365). And the differences of the risk score under different clinical information were gotten by the X2 test. Results showed that risk score was correlated with T Stages (Figure 4).
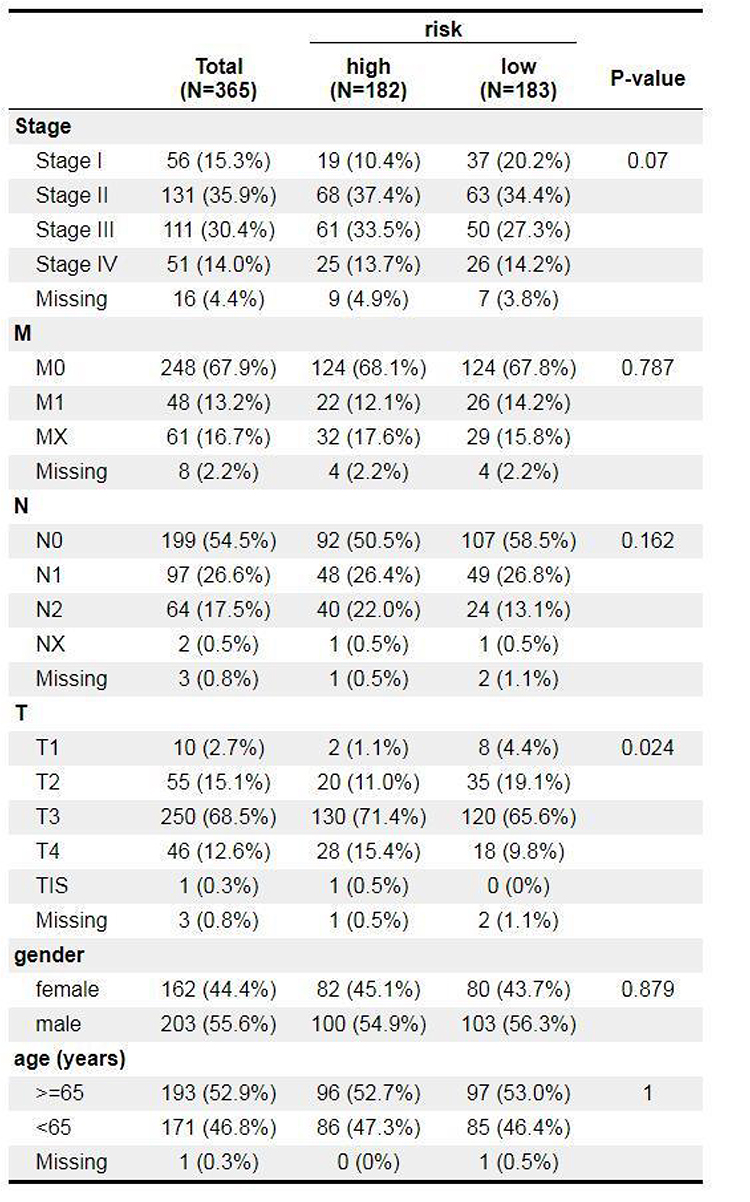 |
Figure 4 Comparison of risk scores among different clinical subgroups. |
The Risk Score Was Independent
Uni-Cox independent prognostic analysis based on the overall survival time and status of patients was performed on 365 TCGA CRC samples with 6 clinical factors including age, gender, Stage, TNM stages, and risk score (Figure 5A). The P values of riskScore, age, Stage and TNM stages were less than 0.05. Ultimately, the risk score was an independent prognostic indicator for OS in CRC patients after multi-Cox independent prognostic analysis (Figure 5B). In this study, relevant clinical information and risk score of CRC samples from TCGA-CRC database (n = 365) were used to construct a nomogram (Figure 5C), and the C index of the nomogram was 0.762, indicating that the nomogram model had a nice prediction value. The correction curve of the nomogram (Figure 5D) was built, and it was found that the prediction accuracy of the model for the survival probability of patients was relatively high, indicating that the nomogram could be used as an effective model.
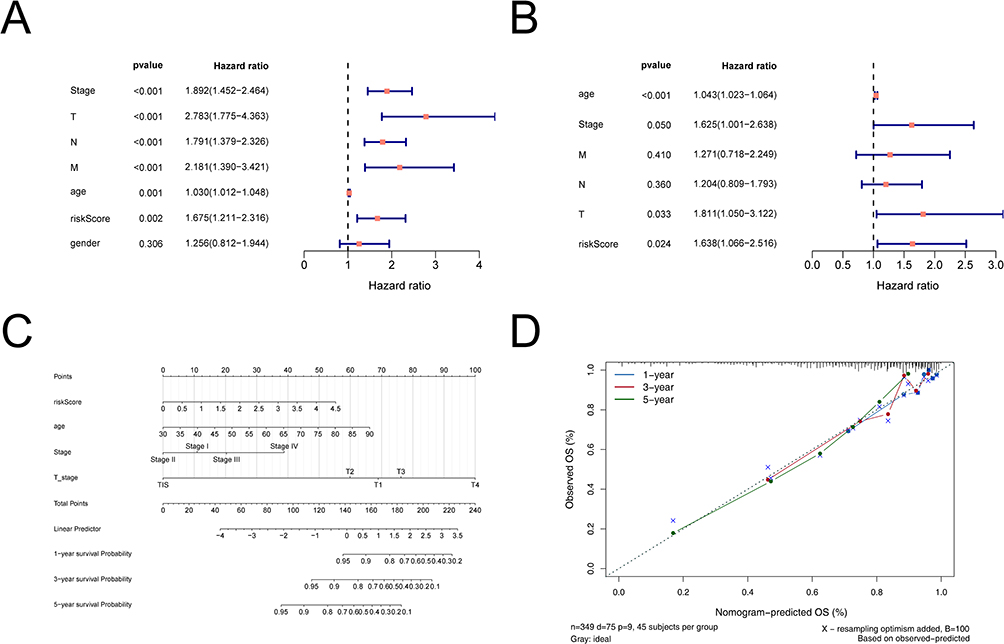 |
Figure 5 The nomogram model construction and validation. (A) Uni-Cox independent prognostic analysis. (B) Multi-Cox independent prognostic analysis. (C) A nomogram as shown, the C index of the nomogram was 0.761719. (D) The correction curve of the line graph. Blue, red, and green circles represent calibration curves for 1, 3 and 5 years, respectively; blue crosses represent points where the observed and predicted incidence deviated from the calibration curve. |
Functional Enrichment Analysis
In this study, 2018 genes were treated as the DEGs, which were annotated for GO analysis, and the biological significance of each gene was explored. We could see that, the most biological process (BP) terms were collagen fibrous tissue, chondrogenesis, ossification and other processes, including ion channel complex, complex of collagen trimers, cation channel complex, external side of plasma membrane, postsynaptic membrane, endoplasmic reticulum lumen, synaptic membrane, and collagen trimer etc. The DEGs were mainly involved in BP, including Ion channel complex, lateral plasma membrane, and postsynaptic membrane. In molecular function (MF) terms, the most enriched terms were growth factor activity, receptor-ligand activity, integrin and heparin binding, including receptor ligand activity, growth factor binding, sulfur compound binding, collagen binding, extracellular matrix structural constituent conferring tensile strength, heparin binding, and glycosaminoglycan binding (Figure 6A). Functional enrichment analysis showed that 67 related pathways were obtained, and these DEGs were significantly correlated with phagocytosis, cell adhesion molecules, PI3K-Akt signaling pathway, calcium signaling and other pathways (Figure 6B).
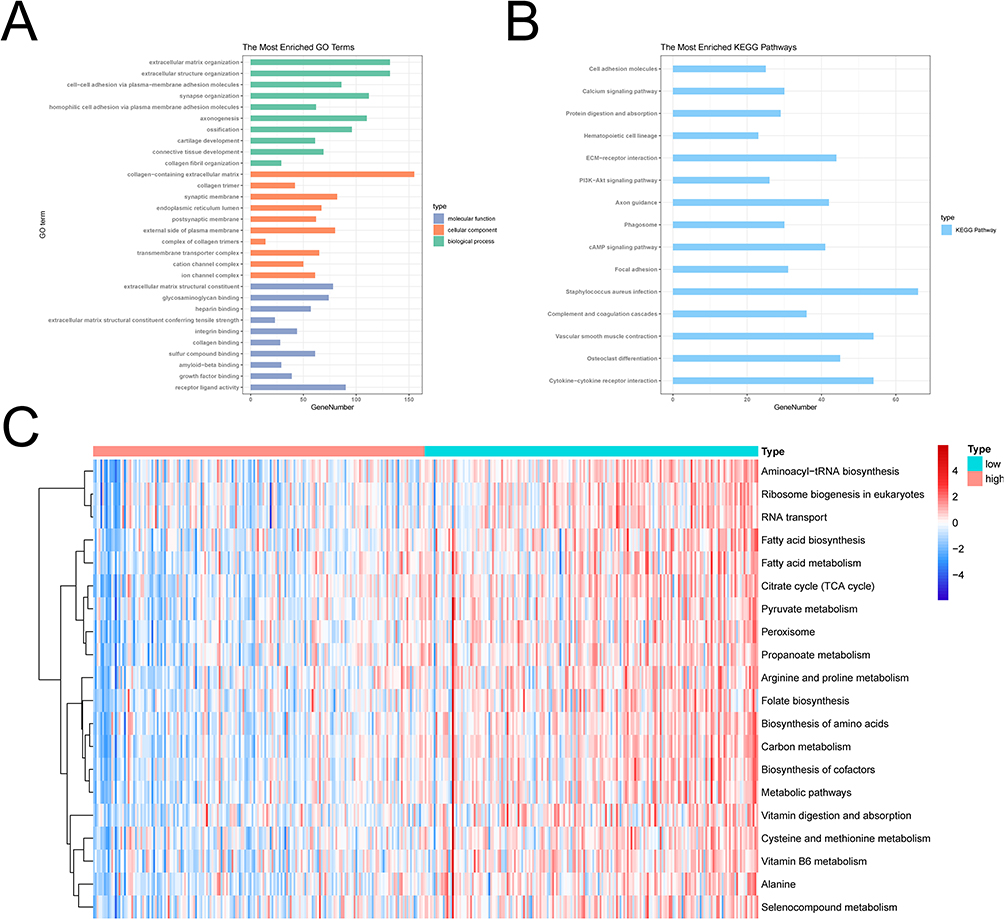 |
Figure 6 Results of functional enrichment analysis. (A) The GO function enrichment bar chart of differentially expressed genes. The ordinate represents the enriched GO Term, the bar length represents the number of differentially expressed genes enriched in the GO Term. (B) Bars of KEGG pathway enrichment of differentially expressed genes. The ordinate indicates the enrichment of KEGG Pathway, the bar length indicates the number of Pathway genes. (C) Heat map of enrichment of TOP20 differential pathways in high and low risk groups. Each small square represents the ssGSEA score of each sample, and the color represents the size of ssGSEA score. The larger the square, the darker the color. Red indicates a high ssGSEA score and blue indicates a low ssGSEA score. |
The enrichment scores and differences in each pathway were analyzed for samples from the high-risk groups by GSVA. A total of 108 pathways were different between high and low risk cohort. The enrichment score of top 20 pathways was visualized by heat map (Figure 6C). We found that glucose metabolism, fat metabolism, amino acid metabolism and other pathways were different between high and low risk cohorts.
Analysis of Immune Infiltration and Immunotherapy Responses in High and Low Risk Groups
First, we analyzed differences in immune microenvironment of CRC. The ImmuneScore, StromalScore, and ESTIMATEScore of CRC samples (n = 365) were obtained according to the ESTIMATE algorithm (Figure 7A and C). It can be seen that there were significant differences in this scores of high- and low-risk groups (p < 0.05). Then we further analyzed the scores for each immune cell by ssGSEA. The 19 immune cells were different, including NK cells, CD8 T cells, Tem, etc. The aDC, NK CD56dim cells, NK CD56bright cells, T helper cells, and TReg had no different between high- and low-risk groups (Figure 7D). Lastly, the abundance of each immune cell in CRC sample was counted, and the corresponding statistical value was calculated. We remained 112 samples (p < 0.05), and the abundance of immune cells was shown in Figure 7E. We observed only M2 Macrophages and resting memory CD4 T cells were different between high- and low-risk groups (Figure 7F). To further validate the model, we explored the discrepancies in immunotherapy between high- and low-risk groups. Primarily, we compared the abundance of immune checkpoint genes. The expression of CD27, CD274, HAVCR2, ICOS, LAG3, PDCD1, PDCD1LG2, and TIGIT were significantly different between the high- and low-risk groups, and showed up-regulated expression in the high-risk group (Figure 8A). Then, the abundance profiles of CRC and melanoma were compared. According to the comparison results, immunotherapy with CTAL4 showed differences between high- and low-risk patients (Figure 8B).
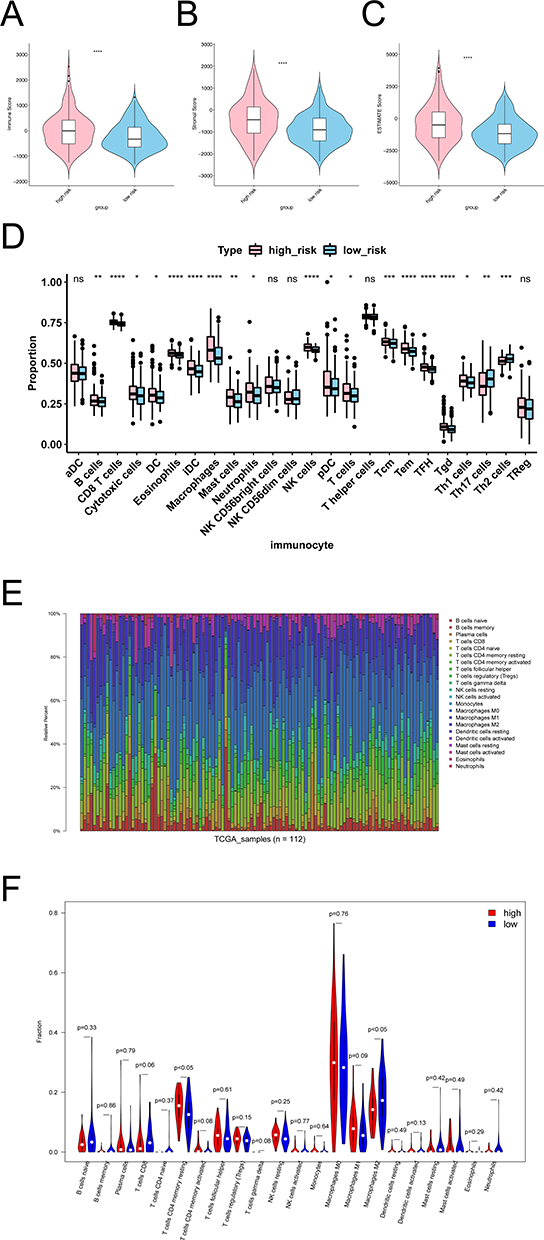 |
Figure 7 Results of immune infiltration analysis in high and low risk groups. (A) Violins of Immune Score in the high and low risk groups. (B) Violins of Stromal Score in the high and low risk groups. (C) Violins of ESTIMATE Score in the high and low risk groups. The abscissa represents groups, the ordinate represents scores, the blue represents low risk group, and the pink represents high risk group. (D) Analyze the differences of immune cells in high and low risk groups by ssGSEA. (E) The bar chart of proportion of immune cells in high and low risk groups by CIBERSORT. (F) Violin diagram of immune cells in the high and low risk groups by CIBERSORT. *p < 0.05, **p < 0.01, ***p < 0.001, ****p < 0.0001. Abbreviation: NS, not significant. |
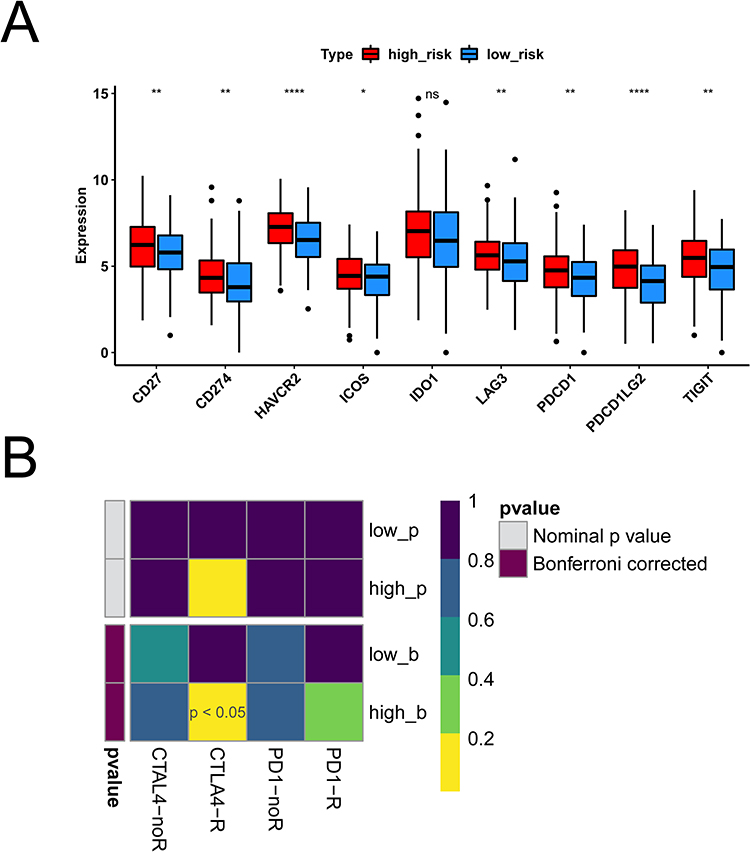 |
Figure 8 Results of immunotherapy differences between high and low risk groups. (A) Boxplot of immune checkpoint gene expression differences in high and low risk groups. Red is the high risk group, blue is the low risk group. (B) Heat maps of immunotherapy differences between high and low risk groups. *p < 0.05, **p < 0.01, ****p < 0.0001. Abbreviation: NS, not significant. |
Analysis and Validation of the Expression of LRPPRC and UHRF2
In TCGA-CRC dataset, LRPPRC and UHRF2 were notably up-regulated in CRC samples compared to normal samples (Figure 9A). In addition, we used qRT-PCR to compare gene expression levels of LRPPRC and UHRF2 in normal and cancerous tissue. The qRT-PCR showed an up-regulation in the abundance of LRPPRC and UHRF2 in cancerous tissue (Figure 9B).
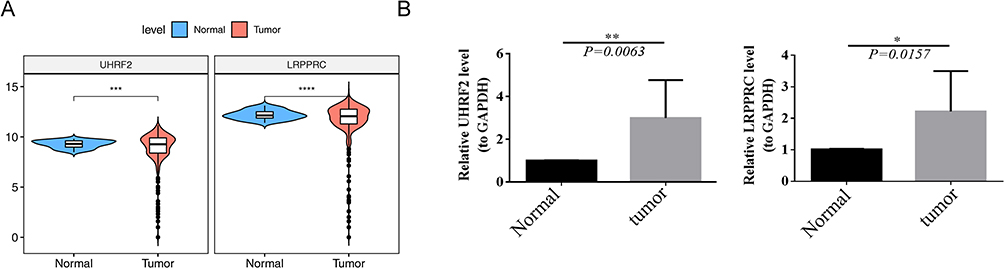 |
Figure 9 Results of Gene expression levels in normal and cancerous tissue. (A) Expression of LRPPRC and UHRF2 in normal and tumor samples in the TCGA dataset. (B) The expression of LRPPRC and UHRF2 using qRT-PCR. *p < 0.05, **p < 0.01, ***p < 0.001, ****p < 0.0001. Abbreviation: NS, not significant. |
Discussion
Early CRC has no obvious symptoms, and most cases are diagnosed in the middle to late stages, which miss the best treatment time and result in poorer outcomes. Although immunotherapy has made great progress, current studies have suggested that only patients with MSI-H/dMMR and high tumor mutational Burden (TMB) can have a better effect on immunotherapy (IT),16 most CRC patients still can not benefit from it. Improving the effectiveness of IT treatment and the prognosis of CRC patients is the focus of current research. So far, more than 170 post-transcriptional modifications of RNA have been discovered,17 and M6A was discovered first and studied most among them.18 Our study showed that LRPPRC and UHRF2 were overexpressed in CRC tissues. The prognostic risk model based on these two genes suggested that there was a difference in patient survival between the high- and low-risk group. Additionally, the higher the risk score, the worse the patient survival. The proteins produced by LRPPRC are mitochondria-associated proteins that belonged to the family of pentatricopeptide repeat (PPR)-containing proteins that bound to RNA and regulate transcription, splicing, stability, editing, and translation-related.19,20 LRPPRC located in mitochondria is identified as a mitochondria related protein. It was first discovered in HepG2 cells in 1994, and the gene encoding this protein is 4.8 kb in length.21 Current studies have shown that LRPPRC is increased in cancer tissues and cell lines, including prostate cancer,22 gastric cancer,23 esophageal squamous cell carcinoma,24 colon cancer,25 etc. High LRPPRC combined with low microtubule-associated protein 1 family (MAP1S) is significantly associated with poor prognosis. MAP1S connects mitochondria and microtubules for transport, affecting the biogenesis and degradation of autophagy, thus increasing autophagy and inhibiting the occurrence of tumors.26 RPPRC also interacts with Beclin 1 and Bcl2 to form ternary complexes to maintain stability of Bcl2 and inhibit autophagy.27 Liu et al found that LncRNA SnoRNA Host Gene 17 (SNHG17) might inhibit c-Myc ubiquitination through interaction with LRPPRC, thus improving c-Myc and promoting the proliferation of tumor cells.28 UHRF2 was another RNA methylation regulatory gene associated with CRC prognosis identified in this study. UHRF2 is a multi-domain E3 ubiquitin ligase, which is involved in the development of many cancers, but in cancer it is controversial. For example, in the study of human esophageal squamous cell carcinoma, low abundance of UHRF2 was found to be associated with vascular invasion of squamous cell carcinoma and was an independent prognostic factor for poor prognosis.29 The abundance of UHRF2 in lung cancer was lower, and UHRF2 knockout in A549 and 95-D cell lines enhanced the proliferation, invasion and migration of NSCLC cells, while overexpression of UHRF2 inhibited the proliferation, invasion and migration of NSCLC cells.30 Our results showed that this gene acted as an oncogene in colon cancer, which was consistent with other studies.31,32 UHRF2 was upregulated at both transcription and translation levels in CRC tumor tissue. Increased UHRF2 cytoplasmic expression was significantly correlated with clinical stage, invasion depth, lymph node metastasis, tumor histological grade, and metastasis.31 The Wnt signaling pathway is important in the initiation and development of CRC. It is reported that UHRF2 can enhance Wnt signaling pathway transduction and promote the occurrence of CRC.32
Prediction models for CRC patients have been widely reported.33–35 But previous literature tended to be based on a single aspect of CRC development, such as N6 methylation alone, and some were relatively limited with either no internal tests or no external validation. In this study, the effects of methylation regulatory enzymes m1A, m5C, m6A and m7G on the prognosis of CRC were comprehensively analyzed for internal verification and external verification, and also combined with TNM staging analysis. T, N, M staging is currently the most classic and commonly used method for CRC prognosis analysis, which can indicate the prognosis of patients.36 However, it cannot predict the immunotherapy effect of patients. Our prognostic model showed that there were statistical differences in the abundance of immune microenvironment, immune cells, immune checkpoint molecules and response to immunotherapy in the high-low risk groups.
Tumor immune microenvironment (TME) affects tumor genesis, development and prognosis, and also plays a crucial role in immunotherapy. The tumor immune microenvironment is a complex and dynamic system37,38 involving the action of multiple cells and cytokines. NK cells are effector cells of the immune system. However, the level of NK cells in CRC tissues was lower, suggesting that less infiltration of NK cells may be one of the mechanisms of TME immune escape. Phenotypic changes of NK cells in peripheral blood of CRC cases promote tumor progression.39,40 TME is rich in macrophages (TAMs), which are considered to be the most abundant population of immune cells in solid tumor tissue.41 In CRC, TAMs participates in angiogenesis and promoted the growth and invasion of CRC cells through epithelial-mesenchymal transformation (EMT) remodeling.42 Studies have showed that in up to 80% of cases, elevated TAM levels predict a worse outcome. Current literature suggested that the M2-like phenotype of macrophages was more predictive of poor prognosis of CRC.38,43 In this study, ssGSEA and CIBERSORT algorithms were used to get the differences of immune cells. There were some differences between the two conclusions, which may be related to the race, gender, age and sample quality of the samples.44 But overall, the tumor immune microenvironment was different. Immune checkpoint blocking (ICB) therapies such as anti-PD-1 /PD-L1 and anti-CTLA-4 have been clinically proven to be effective in CRC patients with MSI-H tumors.45,46 Our study showed that CTAL4 immunotherapy was more effective in the high-risk group.
Conclusion
In conclusion, 2 prognostic genes (LRPPRC and UHRF2) related to RNA methylation were identified by bioinformatics analysis, and corresponding prognostic models were constructed. In addition, the discrepancies of clinical factors, immune infiltration, and immunotherapy response between high- and low-risk groups might provide important implications for the diagnosis and treatment of CRC However, there were still some defects in this study. Firstly, our analyses were implemented based on public databases, and the results need to be supported and validated by more clinical samples and data. Secondly, the prognostic genes obtained by bioinformatics methods and their mechanisms of action need to be further investigated and validated. In conclusion, a RNA methylation-related risk model was established and validated, which provided a theoretical foundation for RNA methylation-related fields in the study and treatment of CRC in this study.
Abbreviations
CRC, colorectal cancer; CNV, copy number variation; TCGA, The Cancer Genome Atlas; OS, overall survival; K-M, Kaplan–Meier; LASSO, Least Absolute Shrinkage and Selection Operator; ROC, Receiver operating characteristic; GO, Gene Ontology; GSVA, Gene set variation analysis; KEGG, Kyoto Encyclopedia of Genes and Genomes; qRT-PCR, quantitative real-time PCR; LRPPRC, leucine rich pentatricopeptide repeat containing; UHRF2, ubiquitin-like with PHD and ring finger domains 2; m6A, N6-methyladenosine; m5C, N5-methylcytosine; m1A, N1-methyladenosine; m7G, N7-methylguanosine; METTL3, methyltransferase-like 3; GLUT1, glucose transporter 1; mTORC1, mechanistic target of rapamycin complex 1; BP, biological process; NSUN5, NOP2/Sun RNA methyltransferase 5; SNV, single nucleotide variation; GEO, Gene Expression Omnibus; DEGs, differentially expressed genes; BP, biological process; MF, molecular function; TMB, tumor mutational Burden; PPR, pentatricopeptide repeat; MAP1S, microtubule-associated protein 1 family; SNHG17, SnoRNA Host Gene 17; TME, Tumor immune microenvironment; TAMs, macrophages; EMT, epithelial-mesenchymal transformation; ICB, Immune checkpoint blocking.
Ethics Statement
This study was approved by Ethics Committee in Clinical Research of the First Affiliated Hospital of Wenzhou Medical University. All methods were carried out in accordance with relevant guidelines and regulations or declaration of Helsinki. Informed consent was obtained from all subjects and/or their legal guardian.
Disclosure
The authors report no conflicts of interest in this work.
References
1. La Vecchia S, Sebastián C. Metabolic pathways regulating colorectal cancer initiation and progression. Semi Cell Dev Biol. 2020;98:63–70.
2. Miller KD, Nogueira L, Mariotto AB, et al. Cancer treatment and survivorship statistics. CA Cancer J Clin. 2019;69(5):363–385.
3. Sigalotti L, Covre A, Fratta E, et al. Epigenetics of human cutaneous melanoma: setting the stage for new therapeutic strategies. J Transl Med. 2010;11(8):56.
4. Wang X, Lu Z, Gomez A, et al. N6-methyladenosine-dependent regulation of messenger RNA stability. Nature. 2014;505(7481):117–120.
5. Sigrid N, Chuan H. The emerging biology of RNA post-transcriptional modifications. RNA Biol. 2017;14(2):156–163.
6. Lui L, Lowe T. Small nucleolar RNAs and RNA-guided post-transcriptional modification. Essays Biochem. 2013;54:53–77.
7. Shi Q, Xue C, Yuan X, He Y, Yu Z. Gene signatures and prognostic values of m1A-related regulatory genes in hepatocellular carcinoma. Sci Rep. 2020;10(1):15083.
8. Wang P, Wu M, Tu Z, et al. Identification of RNA: 5-Methylcytosine Methyltransferases-Related Signature for Predicting Prognosis in Glioma. Front Oncol. 2020;10:1119.
9. Zheng R, Zhang K, Tan S, et al. Exosomal circLPAR1 functions in colorectal cancer diagnosis and tumorigenesis through suppressing BRD4 via METTL3-eIF3h interaction. Mol Cancer. 2022;21(1):49.
10. Jiang Z, Li S, Han MJ, Hu GM, C P. High expression of NSUN5 promotes cell proliferation via cell cycle regulation in colorectal cancer. Am J Transl Res. 2020;12(7):3858–3870.
11. Zhou M, Liu W, Zhang J, Sun N. RNA m(6)A Modification in Immunocytes and DNA Repair: the Biological Functions and Prospects in Clinical Application. Front Cell Dev Biol. 2021;9:794754.
12. Chen Z, Qi M, Shen B, et al. Transfer RNA demethylase ALKBH3 promotes cancer progression via induction of tRNA-derived small RNAs. Nucleic Acids Res. 2019;47(5):2533–2545.
13. He Y, Yu X, Li J, Zhang Q, Zheng Q, G W. Role of m5C-related regulatory genes in the diagnosis and prognosis of hepatocellular carcinoma. Am J Transl Res. 2020;12(3):912–922.
14. Pan J, Huang Z, Xu Y. m5C-Related lncRNAs Predict Overall Survival of Patients and Regulate the Tumor Immune Microenvironment in Lung Adenocarcinoma. Front Cell Dev Biol. 2021;9:671821.
15. Li W, Gao Y, Jin X, et al. Comprehensive analysis of N6-methyladenosine regulators and m6A-related RNAs as prognosis factors in colorectal cancer. Mol Ther Nucleic Acids. 2022;27:598–610.
16. Gorzo A, Galos D, Volovat SR, Lungulescu CV, Burz C, Sur D. Landscape of Immunotherapy Options for Colorectal Cancer: current Knowledge and Future Perspectives beyond Immune Checkpoint Blockade. Life. 2022;12(2):229.
17. Boccaletto P, Machnicka MA, Purta E, et al. MODOMICS: a database of RNA modification pathways. 2017 update. Nucleic Acids Res. 2018;46(D1):D303–D307.
18. Zheng S, Han H, Lin S. N(6)-methyladenosine (m(6)A) RNA modification in tumor immunity. Cancer Biol Med. 2022;8:534.
19. Manna S. An overview of pentatricopeptide repeat proteins and their applications. Biochimie. 2015;113:93–99.
20. Cui J, Wang L, Ren X, Zhang Y, Zhang H. LRPPRC: a Multifunctional Protein Involved in Energy Metabolism and Human Disease. Front Physiol. 2019;10:595.
21. Hou J, Wang F, M WL. Molecular cloning and expression of the gene for a major leucine-rich protein from human hepatoblastoma cells (HepG2). Vitro Cell Dev Biol Anim. 1994;30A(2):111–114.
22. Zhang HY, Ma YD, Zhang Y, Cui J, Wang ZM. Elevated levels of autophagy-related marker ULK1 and mitochondrion-associated autophagy inhibitor LRPPRC are associated with biochemical progression and overall survival after androgen deprivation therapy in patients with metastatic prostate cancer. J Clin Pathol. 2017;70(5):383–389.
23. Gao W, Xua J, Wang F, et al. Mitochondrial Proteomics Approach Reveals Voltage-Dependent Anion Channel 1 (VDAC1) as a Potential Biomarker of Gastric Cancer. Cell Physiol Biochem. 2015;37(6):2339–2354.
24. Tian T, Ikeda J, Wang Y, et al. Role of leucine-rich pentatricopeptide repeat motif-containing protein (LRPPRC) for anti-apoptosis and tumourigenesis in cancers. Eur J Cancer. 2012;48(15):2462–2473.
25. Nishio T, Kurabe N, Goto-Inoue N, et al. Immunohistochemical expression analysis of leucine-rich PPR-motif-containing protein (LRPPRC), a candidate colorectal cancer biomarker identified by shotgun proteomics using iTRAQ. Clin Chim Acta. 2017;471:276–282.
26. Jiang X, Zhong W, Huang H, et al. Autophagy defects suggested by low levels of autophagy activator MAP1S and high levels of autophagy inhibitor LRPPRC predict poor prognosis of prostate cancer patients. Mol Carcinog. 2015;54(10):1194–1204.
27. Zou J, Yue F, Jiang X, Li W, Yi J, Liu L. Mitochondrion-associated protein LRPPRC suppresses the initiation of basal levels of autophagy via enhancing Bcl-2 stability. Biochem J. 2013;454(3):447–457.
28. Liu JY, Chen YJ, Feng HH, et al. LncRNA SNHG17 interacts with LRPPRC to stabilize c-Myc protein and promote G1/S transition and cell proliferation. Cell Death Dis. 2021;12(11):970.
29. Iguchi T, Ueda M, Masuda T, et al. Identification of UHRF2 as a Negative Regulator of Epithelial-Mesenchymal Transition and Its Clinical Significance in Esophageal Squamous Cell Carcinoma. Oncology. 2018;95(3):179–187.
30. Jin C, Xiong D, Li HR, Jiang JH, Qi JC, Ding JY. Loss of UHRF2 Is Associated With Non-small Cell Lung Carcinoma Progression. J Cancer. 2018;9(17):2994–3005.
31. Lu S, Yan D, Wu Z, et al. Ubiquitin-like with PHD and ring finger domains 2 is a predictor of survival and a potential therapeutic target in colon cancer. Oncol Rep. 2014;31(4):1802–1810.
32. Li L, Duan Q, Zeng Z, et al. UHRF2 promotes intestinal tumorigenesis through stabilization of TCF4 mediated Wnt/beta-catenin signaling. Int J Cancer. 2020;147(8):2239–2252.
33. Feng Z, Liu Z, Peng K, Wu W. A Prognostic Model Based on Nine DNA Methylation-Driven Genes Predicts Overall Survival for Colorectal Cancer. Front Genet. 2021;12:779383.
34. Shan L, Li T, Gu W, et al. Application of Prognostic Models Based on Psoas Muscle Index, Stage, Pathological Grade, and Preoperative Carcinoembryonic Antigen Level in Stage II-III Colorectal Cancer Patients Undergoing Adjuvant Chemotherapy. J Oncol. 2022;2022:6851900.
35. Chen Y, Li H. Prognostic and Predictive Models for Left- and Right- Colorectal Cancer Patients: a Bioinformatics Analysis Based on Ferroptosis-Related Genes. Front Oncol. 2022;12:833834.
36. Koi M, Carethers J. The colorectal cancer immune microenvironment and approach to immunotherapies. Future Oncology. 2017;13(18):1633–1647.
37. Pham T, Spaulding C, Munshi H. Controlling TIME: how MNK Kinases Function to Shape Tumor Immunity. Cancers. 2020;12(8):2096.
38. Chen Y, Zheng X, Wu C. The Role of the Tumor Microenvironment and Treatment Strategies in Colorectal Cancer. Front Immunol. 2021;12:792691.
39. Halama N, Braun M, Kahlert C, et al. Natural killer cells are scarce in colorectal carcinoma tissue despite high levels of chemokines and cytokines. Clin Cancer Res. 2011;17(4):678–689.
40. Rocca Y, Roberti M, Arriaga J, et al. Altered phenotype in peripheral blood and tumor-associated NK cells from colorectal cancer patients. Innate Immun. 2013;19(1):76–85.
41. Cassetta L, P JW. Tumor-associated macrophages. Curr Biol. 2020;30(6):R246–R248.
42. Fu XT, Dai Z, Song K, et al. Macrophage-secreted IL-8 induces epithelial-mesenchymal transition in hepatocellular carcinoma cells by activating the JAK2/STAT3/Snail pathway. Int J Oncol. 2015;46(2):587–596.
43. Carlsen L, Huntington KE, El-Deiry WS. Immunotherapy for Colorectal Cancer: mechanisms and Predictive Biomarkers. Cancers. 2022;14(4):54.
44. Ye L, Zhang T, Kang Z, et al. Tumor-Infiltrating Immune Cells Act as a Marker for Prognosis in Colorectal Cancer. Front Immunol. 2019;10:2368.
45. Marcus L, Lemery SJ, Keegan P. FDA Approval Summary: pembrolizumab for the Treatment of Microsatellite Instability-High Solid Tumors. Clin Cancer Res. 2019;25(13):3753–3758.
46. Overman MJ, McDermott R, Leach JL, et al. Nivolumab in patients with metastatic DNA mismatch repair-deficient or microsatellite instability-high colorectal cancer (CheckMate 142): an open-label, multicentre, Phase 2 study. Lancet Oncol. 2017;18(9):1182–1191.
 © 2023 The Author(s). This work is published and licensed by Dove Medical Press Limited. The full terms of this license are available at https://www.dovepress.com/terms.php and incorporate the Creative Commons Attribution - Non Commercial (unported, v3.0) License.
By accessing the work you hereby accept the Terms. Non-commercial uses of the work are permitted without any further permission from Dove Medical Press Limited, provided the work is properly attributed. For permission for commercial use of this work, please see paragraphs 4.2 and 5 of our Terms.
© 2023 The Author(s). This work is published and licensed by Dove Medical Press Limited. The full terms of this license are available at https://www.dovepress.com/terms.php and incorporate the Creative Commons Attribution - Non Commercial (unported, v3.0) License.
By accessing the work you hereby accept the Terms. Non-commercial uses of the work are permitted without any further permission from Dove Medical Press Limited, provided the work is properly attributed. For permission for commercial use of this work, please see paragraphs 4.2 and 5 of our Terms.