")
Back to Journals » Cancer Management and Research » Volume 13
The Role of Dynamic Contrast-Enhanced Magnetic Resonance Imaging in Predicting Treatment Response for Cervical Cancer Treated with Concurrent Chemoradiotherapy
Authors Lu H, Wu Y, Liu X , Huang H, Jiang H, Zhu C , Man Y, Liu P, Li X, Chen Z, Long X, Pang Q , Deng S, Gu J
Received 7 April 2021
Accepted for publication 26 July 2021
Published 4 August 2021 Volume 2021:13 Pages 6065—6078
DOI https://doi.org/10.2147/CMAR.S314289
Checked for plagiarism Yes
Review by Single anonymous peer review
Peer reviewer comments 3
Editor who approved publication: Professor Bilikere Dwarakanath
Heming Lu,1,* Yuying Wu,2,* Xu Liu,1 Huixian Huang,1 Hailan Jiang,1 Chaohua Zhu,1 Yuping Man,3 Pei Liu,4 Xianglong Li,1 Zhaohong Chen,1 Xianfeng Long,1 Qiang Pang,1 Shan Deng,1 Junzhao Gu1
1Department of Radiation Oncology, People’s Hospital of Guangxi Zhuang Autonomous Region, Nanning, 530021, People’s Republic of China; 2Department of Gynecology, People’s Hospital of Guangxi Zhuang Autonomous Region, Nanning, 530021, People’s Republic of China; 3Department of Radiology, People’s Hospital of Guangxi Zhuang Autonomous Region, Nanning, 530021, People’s Republic of China; 4Department of Oncology, Youjiang Medical University for Nationalities, Baise, 533000, People’s Republic of China
*These authors contributed equally to this work
Correspondence: Heming Lu
Department of Radiation Oncology, People’s Hospital of Guangxi Zhuang Autonomous Region, No. 6 Taoyuan Road, Nanning, 530021, People’s Republic of China
Tel +86-771-218-6806
Email [email protected]
Purpose: To evaluate the role of dynamic contrast-enhanced magnetic resonance imaging (DCE-MRI) in predicting early treatment response.
Materials and Methods: Patients with locally advanced cervical cancer (LACC) treated with concurrent chemoradiotherapy (CCRT) were enrolled. Pelvic DCE-MRI scans were performed before RT (pre-RT), in the middle of RT (mid-RT), and at the end of RT (post-RT), separately. Parameters (ie, Ktrans, Kep, and Ve) were measured. Pre-, mid-, and post-RT Ktrans were denoted as Ktrans-preTx, Ktrans-midTx, and Ktrans-postTx, respectively. And the same denoting rule also went for Kep and Ve. Difference for the same parameter such as Ktrans measured between two consecutive time points was calculated as second Ktrans value minus first Ktrans value. The differences in Ktrans between pre-RT and post-RT, between pre-RT and mid-RT, and between mid-RT and post-RT were denoted as ΔKtrans-post-preTx, ΔKtrans-mid-preTx, and ΔKtrans-post-midTx, respectively, and the same denoting rule was also applied to Kep and Ve.
Results: A total of 57 patients were enrolled. After the treatment, 31 patients had complete response (CR group). The remaining 26 patients had partial response (NCR group). Significant differences were found in Ktrans-postTx, Kep-postTx, Ve-midTx, ΔKtrans-post-preTx, ΔKtrans-post-midTx, ΔKep-post-preTx, ΔKep-mid-preTx and ΔKep-post-midTx between the two groups. Receiver operating characteristic (ROC) analysis for their performances in predicting treatment response showed an area under curve (AUC) of 0.656– 0.849, sensitivity of 61.3– 93.5%, specificity of 46.1– 73.1%, and maximal Youden Index of 36.5– 66.6. Among those parameters, Kep-postTx was the best, and its AUC, sensitivity, specificity, maximal Youden Index, and cutoff value were 0.849, 87.1%, 73.1%, 60.2, and 0.341, respectively. These combined parameters showed an AUC of 0.952, with sensitivity of 87.1%, specificity of 96.1%, and maximal Youden Index of 83.2.
Conclusion: DCE-MRI parameters can predict early treatment outcome. Among those parameters, Kep-postTx is the best predictor. The combination of multi-parameters can increase the predictive potency.
Keywords: cervical cancer, locally advanced disease, dynamic contrast-enhanced magnetic resonance imaging, concurrent chemoradiotherapy, prognosis prediction
Introduction
Cervical cancer is one of the most common malignancies for females. Worldwide, the incidence of cervical cancer is ranked as the fourth disease among female malignancies, with new cases of about 530,000 and 270,000 deaths annually. Approximately, 85% of cervical cancer patients are found in less developed and developing countries, and countries with low-income and moderate-income, the mortality rate is 18 times higher than that in rich countries.1,2
In the management of cervical cancer, early assessment and prediction of treatment response may facilitate the modification of treatment strategy in order to improve treatment outcome and minimize side effects. A retrospective study conducted by Li and colleagues found that in cervical cancer patients treated with neoadjuvant chemotherapy, responders had a significantly higher disease-free survival than non-responders, and both univariable and multivariable analyses revealed that treatment response was an independent factor to predict long-term survival. A following prospective study by the same research team confirmed the findings.3 However, traditional imaging techniques like computed tomography (CT) and magnetic resonance imaging (MRI) assess the treatment response or disease progression largely based on changes in morphology and dimension. It is a commonly held belief that changes in morphology often lag behind the changes in biology and molecule, thus they are unlikely to reflect the real anti-tumor effects. In addition, different portion within a tumor may respond to a certain treatment differently due to the heterogeneity present in the tumor. Therefore, there is an urgent need to find out more reliable imaging biomarkers capable of assessing early treatment response.4–6
The vasculature system in tumor presents with apparent abnormality comparing with the normal tissues. In addition, anti-tumor treatment can also change the tumor vasculature system. Therefore, growing attentions have been paid to imaging biomarkers capable of evaluating the function of tumor vasculature system. In comparison with traditional imaging methods, imaging biomarkers are considered non-invasive to evaluate the tumor vasculature system. They can be performed in both vivo and longitudinal settings. Currently, functional imaging to evaluate angiogenesis includes dynamic contrast-enhanced magnetic resonance imaging (DCE-MRI), positron emission tomography (PET), and diffusion-weighted imaging (DWI). Each technique has its own advantages and disadvantages regarding sensitivity, accessibility, reproducibility, and measuring range.
At present, DCE-MRI, as one of most important imaging tools, has been used in cancer diagnosis and differentiation, staging, outcome assessment, and prediction of recurrence and metastasis for various cancer types, including head-and-neck cancer, breast cancer, and esophagus cancer.7–9 However, few studies are specifically focused on cervical cancer, and the sample sizes are often too small. This prospective study was conducted to evaluate the role of DCE-MRI parameters in assessing and predicting early treatment response, and to provide evidence for individualized approach for cervical cancer patients treated with concurrent chemoradiotherapy (CCRT).
Materials and Methods
Inclusion Criteria
Ages between 18 and 75 years old; histologically proven and newly diagnosed cervical squamous carcinoma or adenocarcinoma; stages between IB2-IVA according to the FIGO Staging System (version 2014); performance status (PS) 0–2; measurable lesion according to the RECIST criteria; no distant metastases confirmed by abdominal ultrasound, chest CT, and bone emission computed tomography (ECT); white blood cell count ≥4.0x10⁹ /L, platelet count ≥100x109 /L; normal prothrombin time; measuring values of liver and renal functions ≤1.25 x upper normal limits. The study was approved by the Institutional Review Board of the People’s Hospital of Guangxi Zhuang Autonomous Region and complied with the Declaration of Helsinki. All patients were required to sign a written informed consent prior to the initiation of the study.
Exclusion Criteria
Distant metastases upon diagnosis; coexistence of other malignance; preceding treatment with anti-tumor therapies; contraindication to RT or chemotherapy, including severe infection, myocardial infarct, severe arrhythmia, severe cerebrovascular disease, mental disorder, and uncontrolled diabetes; lactating or pregnant women.
External Beam Radiotherapy
Ninety minutes before CT simulation and each subsequent treatment, patients were asked to empty their rectum and bladder, and then drink 500 mL of water and hold urine. During the simulation, patients were required to lie down on a wide-bore CT simulator couch (Somatom Sensation Open, Siemens Medical Solutions, Erlangen, Germany) in a prone position with two arms crossed upward and holding contralateral elbow. Tailored thorocoabdominal thermoplastic masks were designed to cover the scanning area (from upper abdomen to upper third of thigh). Radiopaque markers were placed on the edge of anus and vaginal orifice. Intravenous contrast-enhanced CT using 4 mm slice from the upper border of the L1 vertebral to 2 cm below the ischial tuberosity was performed for planning. Scanning range was extended to 4 cm below the vulva if the whole length of vagina or inguinal lymph node was involved.
Gross tumor volume (GTV) was defined as any primary disease and involved lymphadenopathy, determined by imaging and clinical findings. There were 3 clinical target volumes (CTV1, CTV2, and CTV3): CTV1 included GTV, uterus, and cervix; CTV2 included parametrial and paravaginal tissues, ovaries, and vagina according to the involvement (ie, upper half if no vagina involvement or only slight involvement; upper two-thirds if upper vagina involvement; or entire vagina if more vagina involvement); CTV3 included common iliac, internal iliac, external iliac and presacral lymph nodes. Planning target volumes (ie, PTV1, PTV2, and PTV3, respectively) were formed by adding 5–10 mm margins to CTV1, CTV2, and CTV3 in three-dimensions. The plans were designed and optimized using the Pinnacle inverse planning system. The prescribed radiation dose delivered to PTV1, PTV2, and PTV3 was 50–54 Gy, 45–48.6 Gy, and 45–48.6 Gy, respectively, in 25–27 fractions. A boost dose was added to the positive pelvic lymph node to ensure the total dose reached 60 Gy. IMRT was delivered via 5 or 7 fixed-gantry angles with an Elekta Synergy Linear Accelerator (Elekta Ltd., Stockholm, Sweden). Verification based on cone beam computed tomography (CBCT) or electronic portal imaging device (EPID) was required before treatment was initiated. This was done prior to the first treatment and every week thereafter. If CBCT was used, consecutive verifications were performed for the first five fractions, and if the setup error was not significant, weekly verification was considered appropriate.
Intracavitary Brachytherapy
High-risk CTV (HR-CTV) included any macroscopic tumor found in imaging studies and examination. Intermediate risk CTV (IR-CTV) included significant microscopic disease and initial tumor extension before external beam RT. Doses to HR-CTV and IR-CTV were assessed by D90 and D100 (minimal doses received by 90% and 100% of volumes, respectively). High-dose volume was assessed by V150 and V200 (volumes receiving 150% and 200% of prescribed doses, respectively). The doses to organs at risk (OARs) were assessed by D0.1, D1 cc, D2 cc, D5 cc, and D10 cc (maximal doses received by 0.1, 1, 2, 5, and 10 cc volumes, respectively). The fractionation for the high-dose rate brachytherapy was 24 Gy in 4 fractions.
Chemotherapy
Weekly cisplatin (40 mg/m2) or nedaplatin (30 mg/m2) was injected intravenously for 5 weeks. Antiemetic and acid-inhibitor were administered prior to the use of cisplatin.
Pelvic DCE-MRI
Imaging Acquisition of DCE-MRI
Pelvic DCE-MRI scans were performed before RT, in the middle of RT (at third week of RT), and at the end of RT, separately. Conventional high-resolution MRI images were acquired by using 3T superconducting magnetic resonance imager (Tim Trio Siemens 3.0 T) equipped with an eight-channel phased array coil, including sagittal T2WI, axial T2WI, and axial T1WI. Multi-flip angle approach is utilized for a T1 map. DCE-MRI scans were performed after the injection of the contrast. Three-dimensional volumetric interpolated breath-hold sequence was used for quantitative DCE-MRI examination. Scan parameters were as the following: TR, 3.5 ms; TE, 1.06 ms; array, 256×256; FOV, 24 cm×24 cm; slice thickness, 3.0 mm; slice interval, 0 mm; NEX, 1; parallel acquisition, 2 times. Initially, three unenhanced sequences at 5°, 10°, and 15° flip angles were obtained. After the scan was taken to the fifth phase in quantitative DCE-MRI, Gd-DTPA-BMA (Omniscan, Shanghai GE Health, Shanghai, China) was injected at a dosage of 0.1 mmol/kg by a high-pressure spring and retention needle at a speed of 2 mL/s through a previously inserted catheter placed into the antecubital vein and followed by saline flush at a dosage of 0.2 mL/kg at the same speed. Then, 30 phases of consecutive scans were taken, with 22 images and 7.2 seconds each phase. There were 770 images in 35 phases in total.
Image Analysis
The acquired images were measured by using a commercial post-processing software (Siemens Syngo MMWP, Siemens Healthcare, Berlin, Germany). The first step was to align the images in order to minimize the artifacts caused by respiratory motion. Then, the three flip angle images and the aligned images were imported. The third step was to measure arterial input function (AIF) at the internal iliac artery by using Extended Tofts two-compartment model. Finally, regions of interest (ROI) were drawn by hand by a senior radiologist. T1 map was used to calculate the T1 value for ROI. Parameters in this study included volume transfer constant (Ktrans), flux rate constant (Kep), and extravascular extracellular space volume fraction (Ve).
ROI Drawing
A maximum section of lesions was selected as the central slice. ROI included the central slice and its nearest upper one and lower one slice. Care was taken to avoid large vessels, cystic or necrotic regions, and regions with bleeding.
Assessment of Treatment Response
Calculations of tumor volume were as the following:10 The maximum left–right diameter measured on the largest slice in axial T2-weighted MR images was denoted as d1, and the maximum caudo-cranial and anterior-posterior diameters measured on the largest slice in sagittal T2-weighted MR images were denoted as d2 and d3, respectively. Tumor volume was calculated according to the formula: V= d1×d2×d3×π/6. The change rate of tumor volume at a certain time point was calculated as the following equation: [(volume prior to treatment-volume at this time point)/volume prior to treatment] ×100%.
Short-term treatment response was evaluated according to Response Evaluation Criteria in Solid Tumors (RECIST), Version 1.1. Complete response (CR) is defined as disappearance of all target lesions; partial response (PR) is defined as at least a 30% decrease in the sum of diameters of target lesions taking as reference the baseline sum diameters; progressive disease (PD) is defined as at least a 20% increase in the sum of diameters of target lesions or presence of new lesions; and stable disease (SD) is defined as neither sufficient shrinkage to qualify for PR nor sufficient increase to qualify for PD.
Observational Variants
The observational variants were as the following: Ktrans, Kep, and Ve prior to RT (pre-RT), in the middle of RT (mid-RT), and at the end of RT (post-RT); dynamic changes of the above three parameters; pre-, mid-, and post-RT Ktrans were denoted as Ktrans-preTx, Ktrans-midTx, and Ktrans-postTx, respectively. Likewise, Kep and Ve were denoted as Kep-preTx, Kep-midTx, Kep-postTx, Ve-preTx, Ve-midTx, and Ve-postTx, respectively. Difference for the same parameter such as Ktrans measured between two consecutive time points was calculated as second Ktrans value-first Ktrans value. The differences in Ktrans between pre-RT and post-RT, between pre-RT and mid-RT, and between mid-RT and post-RT were denoted as ΔKtrans-post-preTx, ΔKtrans-mid-preTx, and ΔKtrans-post-midTx, respectively. Likewise, the differences in Kep were denoted as ΔKep-post-preTx, ΔKep-mid-preTx, and ΔKep-post-midTx, respectively, and the differences in Ve were denoted as ΔVe-post-preTx, ΔVe-mid-preTx, and ΔVe-post-midTx, respectively.
Statistical Analysis
SPSS 22 software was used for statistical analysis and a probability value less than 0.05 was considered significant. A paired sample t test or Wilcoxon rank sum test was chosen based on the data types. Comparisons of the DCE-MRI parameters at different time points were performed through paired sample t test. One-Way ANOVA was used for the comparison of baseline characteristics and the DCE-MRI parameters for patients in the same group. Potential predictors for early treatment response were screened by the binary logistic regression model and their discriminatory power was calculated by Receiver Operating Characteristic Curve (ROC).
Results
Patient Characteristics
Between January 2017 and September 2019, a total of 57 patients were enrolled in the study. The median age was 56 years old, ranging from 36 to 75 years old. After the treatment, 31 patients had CR and those patients were included in the CR group. The remaining 26 patients had PR and those patients were included in the NCR group. The detailed information about patient characteristics is shown in Table 1.
 |
Table 1 Baseline Characteristics of Patients |
Tumor Volume and Volume Change
The pre-RT tumor volume for all patients was 43.2±7.5 cm3. As the treatment proceeded, dramatical volume changes were observed. The mid-RT and post-RT tumor volumes were 23.5±5.8 cm3 and 5.7±4.8 cm3, respectively. The mid-RT volume was remarkably smaller than the pre-RT volume (19.7±6.3 cm3, 95% CI: 18.0–21.4, t=23.5, p=0.000). Compared with the pre-RT volume, the post-RT volume shrank significantly (38.3±8.9 cm3, 95% CI: 35.9–40.7, t=32.3, p=0.000). Similarly, the post-RT volume was significantly smaller than the mid-RT volume (18.6±6.3 cm3, 95% CI: 16.8–20.4, t=20.7, p=0.000). Significant differences were also found in the change rate of volume between the two groups. Change rate in mid-RT in the CR group was significantly larger than that in the NCR group (48.7±13.7% vs 41.4±7.4%; p=0.019; inter-group difference=7.2±3.0%, 95% CI: 1.2–13.3%). Patients in the CR group had significantly higher change rate of tumor volume after RT than those in the NCR group (100.0±0.0% vs 75.4±5.1%; p=0.000; inter-group difference=24.6±1.0%, 95% CI: 22.6–26.7%) Figure 1 illustrates the tumor volume changes at different time points.
 |
Figure 1 Pre-, mid-, and post-RT tumor volume changes. |
Before RT, patients in both the CR and NCR groups had a similar tumor volume, with values of 43.2±8.9 cm3 and 43.2±5.7 cm3, respectively (p=0.975, 95% CI: −3.99–4.12). In mid-RT, a significantly smaller tumor volume was found in patients in the CR group, compared with the NCR group (22.1±6.9 cm3 vs 25.2±3.7 cm3; p=0.046, 95% CI: −6.11–0.58). The difference in tumor volume between the two groups became more evident after RT (0.0 vs 10.7±2.7 cm3; p=0.000, 95% CI: −11.82–9.58).
Changes in DCE-MRI Parameters
The overall changing tendency for Ktrans and Kep was an increase at first and then a decline to a level that was lower than that before RT. The maximum values were found in mid-RT, but Kep had a larger reduction range than Ktrans. As for Ve, the overall change pattern was a consistently escalating trend, with a peak occurring in post-RT (Figure 2).
 |
Figure 2 Changes in Ktrans, Kep, and Ve at different time points. |
For patients in the CR group, Ktrans-preTX, Ktrans-midTx, and Ktrans-postTx were 0.203±0.105 min−1, 0.348±0.282 min−1, and 0.177±0.166 min−1, respectively. Significant differences were found between pre-RT and mid-RT, and between mid-RT and post-RT; Kep-preTX, Kep-midTx, and Kep-postTx were 0.549±0.256 min−1, 0.706±0.370 min−1 and 0.232±0.114 min−1, respectively. Ve-preTX, Ve-midTx, and Ve-postTx were 0.378±0.149, 0.524±0.214 and 0.695±0.134, respectively. For both Kep and Ve, significant differences were observed between each time point. Figure 3 represents the dynamic changes of these parameters through time in a responder.
 |
Figure 3 Dynamic changes of DCE-MRI parameters in a responder. Images in each row are representative images from three different timepoints (A=pre-RT; B=mid-RT; C=post-RT) from a 68-year old patient with IIB disease. The images of the primary tumor from T2WI are presented to show volume changes in mid- and post-RT in comparison with the baseline. Corresponding kinetic parameters (Ktrans, Kep, and Ve maps) of the primary tumor are presented to show permeability changes from the three given timepoints (Pre-, mid-, and post-RT). Ktrans in pre-, mid-, and post-RT were 1.157 min−1, 1.978 min−1, and 0.367 min−1, respectively; Kep in pre-, mid-, and post-RT were 3.302 min−1, 3.713 min−1, and 0.482 min−1, respectively; Ve in pre-, mid-, and post-RT were 0.411, 0.577, and 0.763, respectively. This patient achieved a complete response after the treatment. |
For patients in the NCR group, Ktrans-preTX, Ktrans-midTx, and Ktrans-postTx were 0.244±0.168 min−1, 0.365±0.234 min−1 and 0.340±0.173 min−1, respectively. Significant differences were found between pre-RT and mid-RT, and between mid-RT and post-RT; Kep-preTX, Kep-midTx, and Kep-postTx were 0.603±0.393 min−1, 0.622±0.410 min−1 and 0.462±0.205 min−1, respectively. Significant difference was found between mid-RT and post-RT; Ve-preTX, Ve-midTx, and Ve-postTx were 0.409±0.182, 0.645±0.184 and 0.740±0.169, respectively. Significant differences were observed between each time point (Table 2). Figure 4 represents the dynamic changes of these parameters through time in a non-responder.
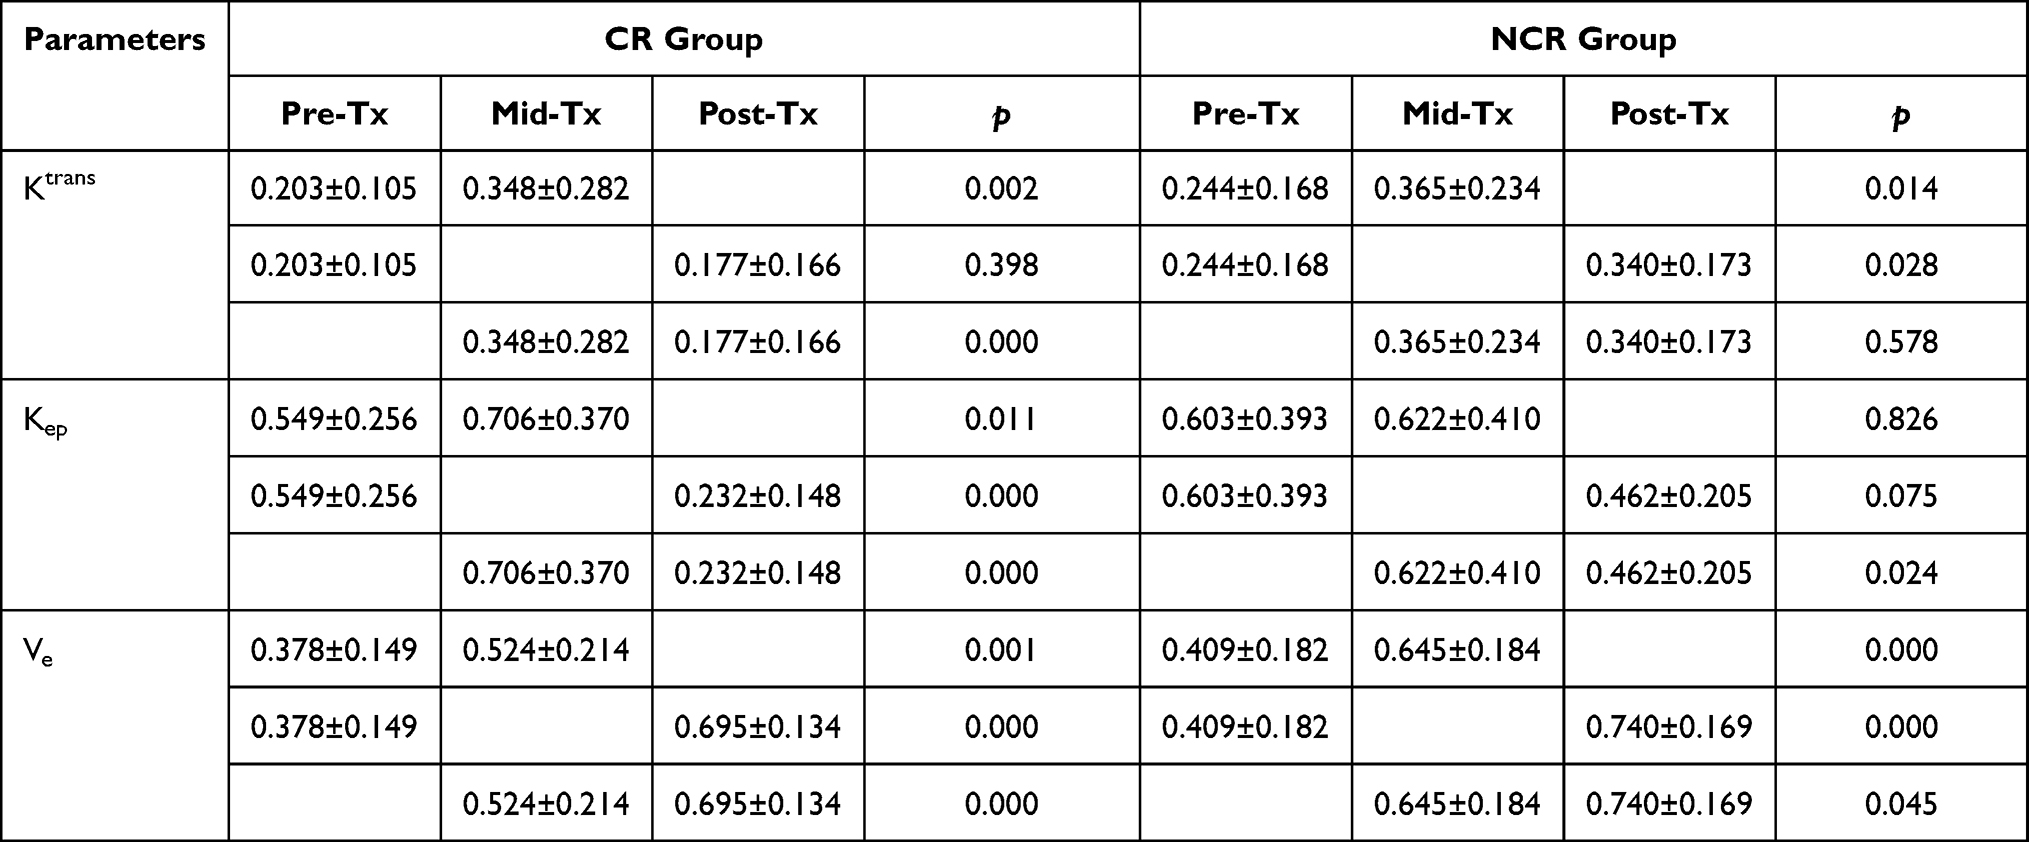 |
Table 2 Comparison of DCE-MRI Parameters Within Each Group at Different Time Points |
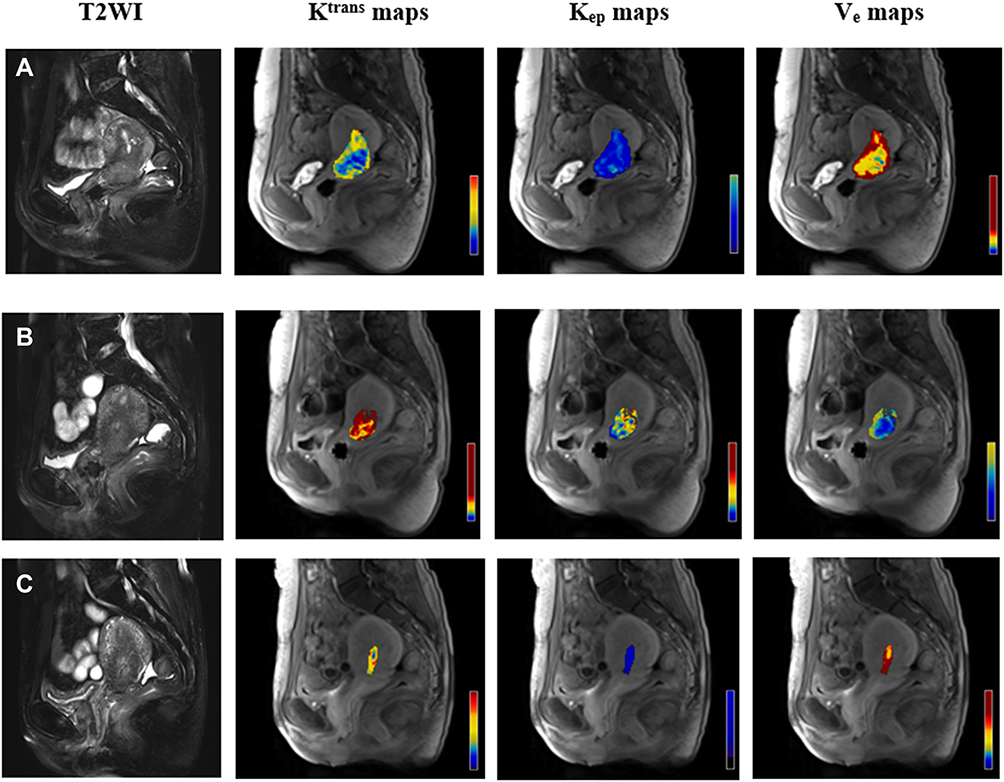 |
Figure 4 Dynamic changes of DCE-MRI parameters in a non-responder. Images in each row are representative images from three different timepoints (A=pre-RT; B=mid-RT; C=post-RT) from a 46-year old patient with IIB disease. The images of the primary tumor from T2WI are presented to show volume changes in mid- and post-RT in comparison with the baseline. Corresponding kinetic parameters (Ktrans, Kep, and Ve maps) of the primary tumor are presented to show permeability changes from the three given timepoints (Pre-, mid-, and post-RT). Ktrans in pre-, mid-, and post-RT were 0.097 min−1, 1.601 min−1, and 0.306 min−1, respectively; Kep in pre-, mid-, and post-RT were 0.422 min−1, 4.958 min−1, and 0.544 min−1, respectively; Ve in pre-, mid-, and post-RT were 0.263, 0.335, and 0.565, respectively. This patient achieved a partial response after the treatment. |
There were significant differences in Ktrans-postTx, Kep-postTx, Ve-midTx, ΔKtrans-mid-preTx, ΔKtrans-post-midTx, ΔKep-post-preTx, ΔKep-mid-preTx and ΔKep-post-midTx between the two groups. However, no significant differences were found in Ktrans-preTx, Ktrans-midTx, Kep-preTx, Kep-midTx, Ve-preTx, Ve-postTx, ΔKtrans-post –preTx, ΔVe-post-preTx, ΔVe-mid-preTx and ΔVe-post-midTx between the two groups (Table 3).
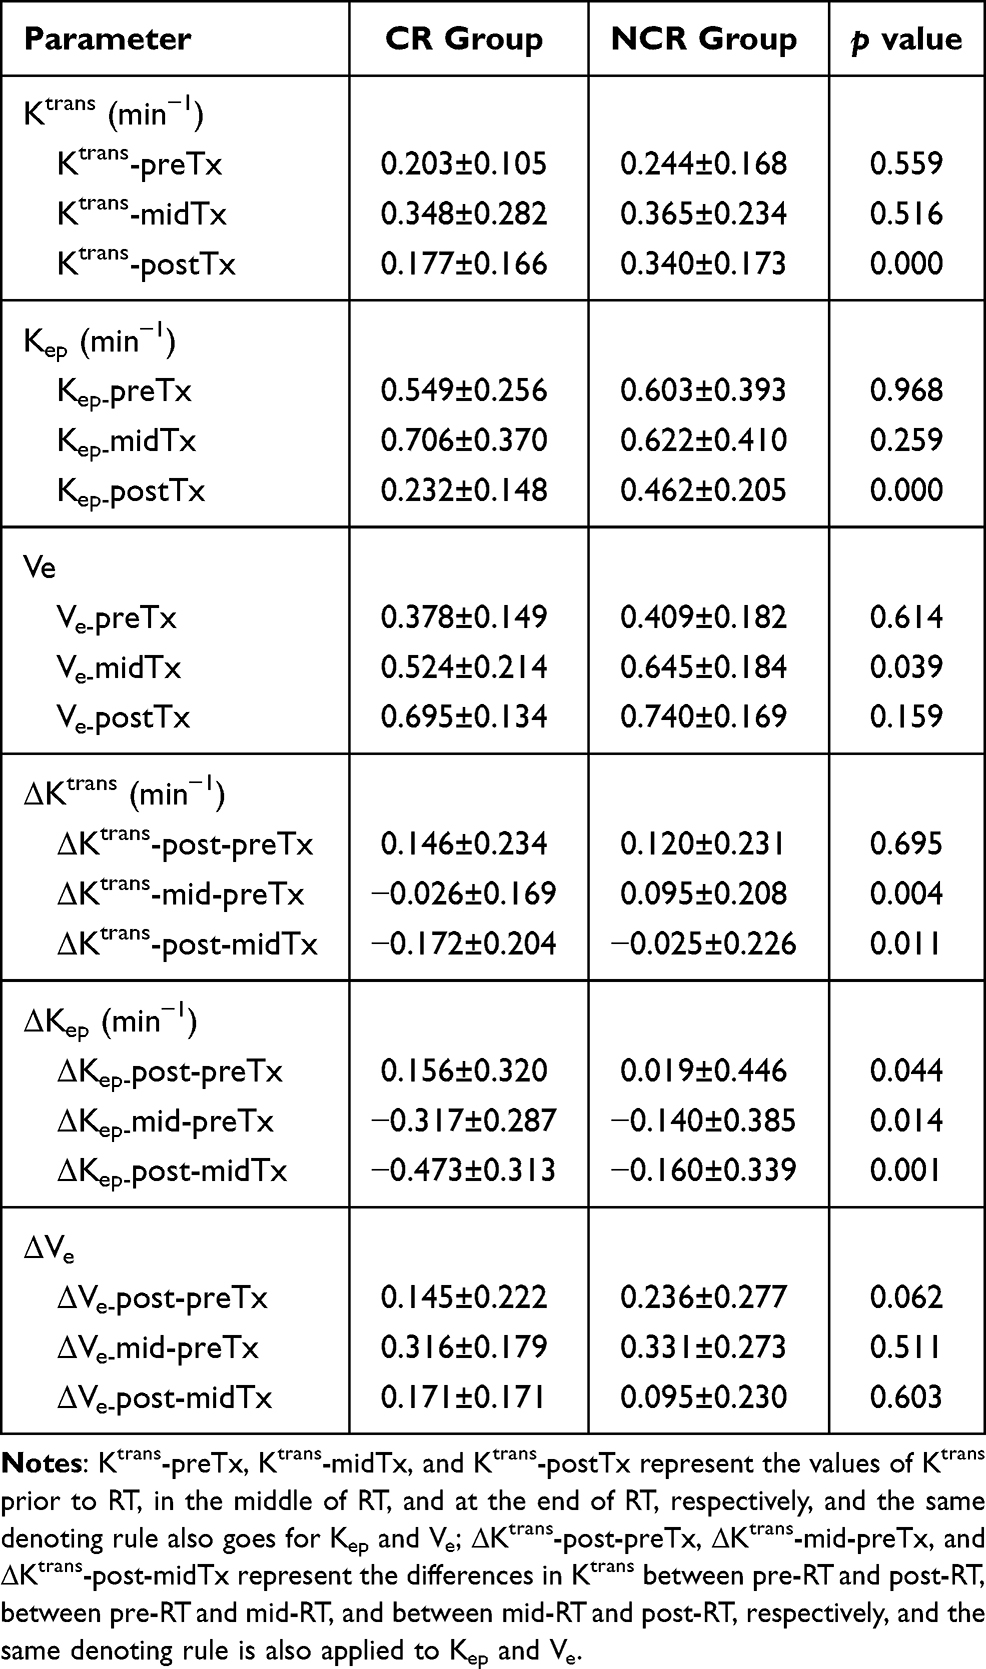 |
Table 3 Comparison of Each DCE-MRI Parameter Between the CR and NCR Group |
Correlation Between DCE-MRI Parameters and Tumor Volume/Change in Tumor Volume
For all patients, no correlations were found between the pre-RT tumor volume and any DCE-MRI parameter. There was a significant correlation between Ktrans-preTx and the mid-RT tumor volume (r=0.277, p<0.05). The post-RT tumor volume was significantly related to Ktrans-postTx, Kep-postTx, Ve-midTx, ΔKtrans-post-preTx, ΔKtrans-post-midTx, ΔKep-post-preTx, and ΔKep-post-midTx (r=0.425, 0.525, 0.272, 0.276, 0.343, 0.329, and 0.412, respectively; all p values <0.05). The change rates of tumor volumes in the middle of RT (compared with pre-RT tumor volume) were significantly correlated with Ktrans-preTx, Ktrans-postTx, Kep-postTx, and Ve-preTx (r=−0.265, −0.346, and −0.267, respectively; all p values <0.05). The change rates of tumor volumes after RT (compared with pre-RT tumor volume) were significantly correlated with Ktrans-preTx, Ktrans-postTx, Kep-postTx, Ve-midTx, ΔKtrans-post-preTx, ΔKtrans-post-midTx, ΔKep-post-preTx, and ΔKep-post-midTx (r=1.000, −0.443, −0.540, −0.301, −0.322, −0.373, −0.359, and −0.475; all p values <0.05) (Table 4).
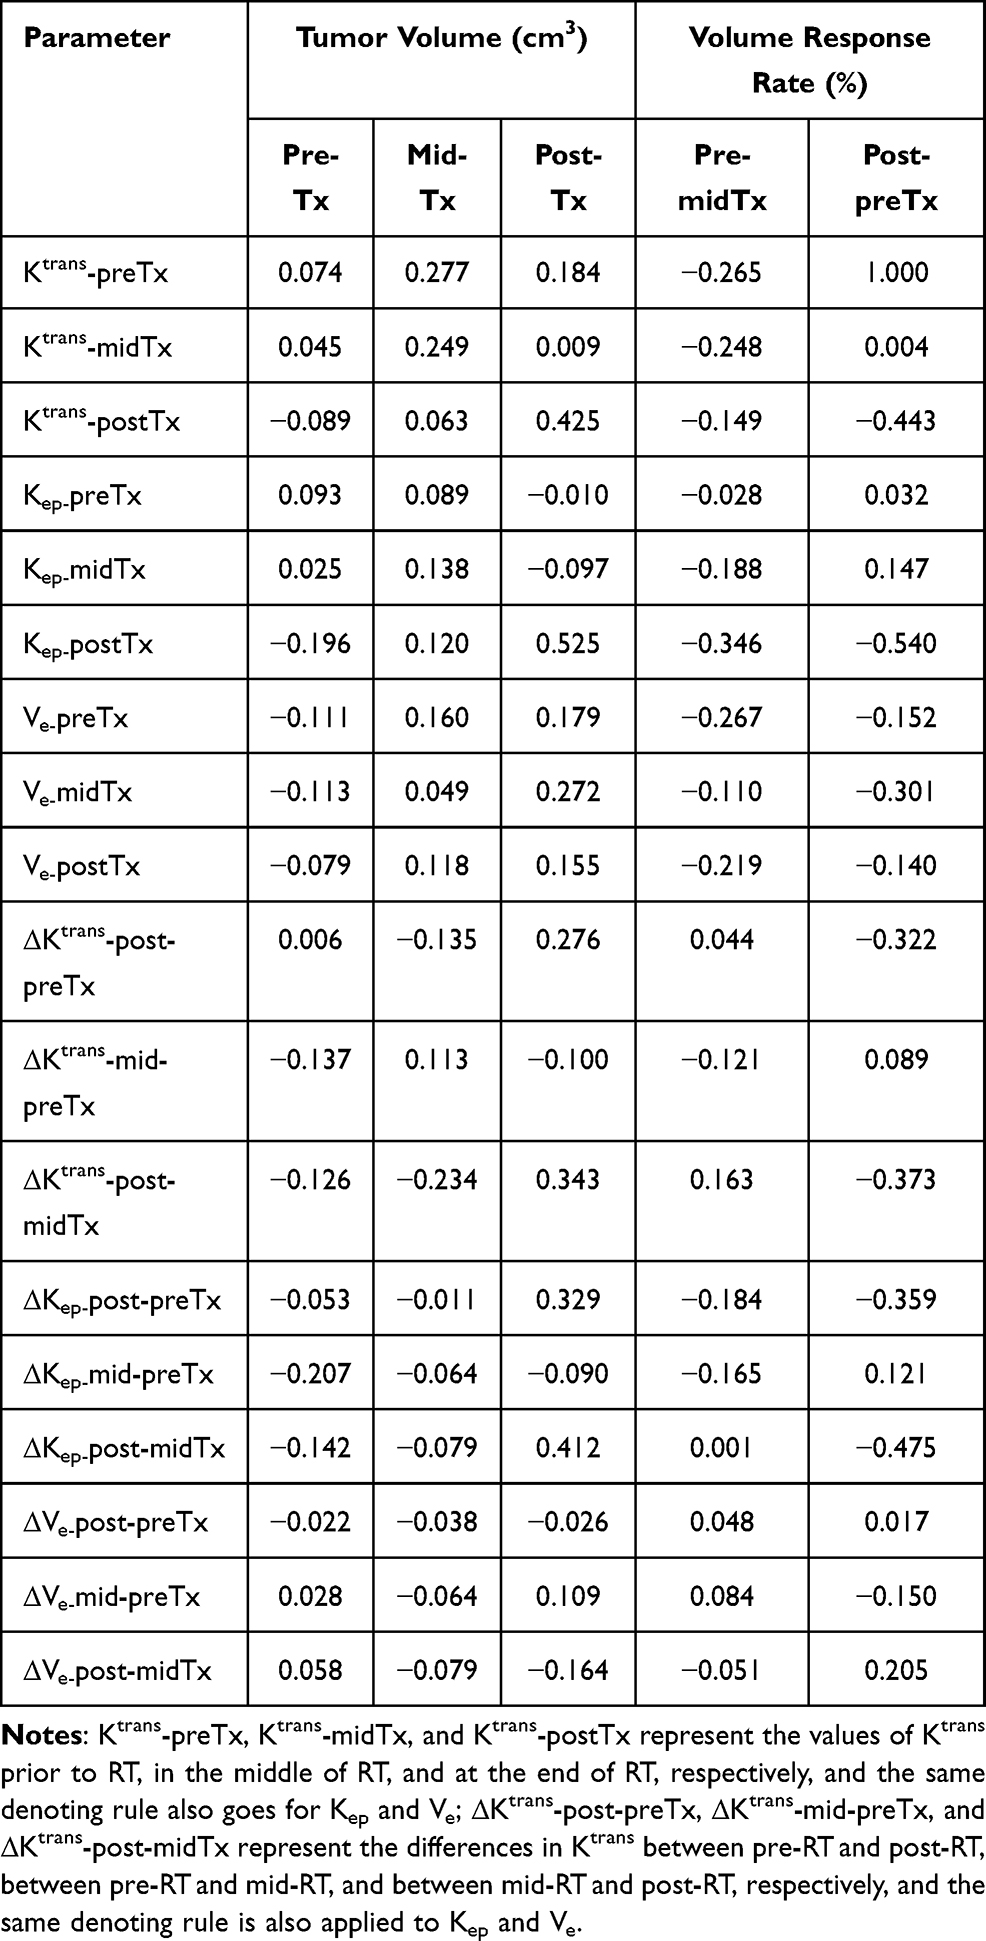 |
Table 4 Correlation Between DCE-MRI Parameters and Tumor Volume/Volume Change (n=57, r Value) |
Predictive Role of DCE-MRI Parameters and Their Changes in Early Treatment Response
Mann–Whitney test was performed for DCE-MRI parameters at different time points. There were significant differences in Ktrans-postTx, Kep-postTx, and Ve-midTx between the two groups (p=0.000, 0.000, and 0.039, respectively), suggesting that the abovementioned parameters may have a predictive role in early treatment response. Whereas no significant differences were observed in other parameters, including Ktrans-preTx, Ktrans-midTx, Kep-preTx, Kep-midTx, Ve-preTx, and Ve-postTx, between the two groups (Table 3). The performances of Ktrans-postTx, Kep-postTx, and Ve-midTx in predicting treatment response were assessed by ROC analysis. Ktrans-postTx showed an area under curve (AUC) of 0.839 (95% CI: 0.718–0.823), with a cutoff value of 0.256, sensitivity of 93.5% (95% CI: 78.6–99.2%), specificity of 73.1% (95% CI: 52.2–88.4%), and maximal Youden Index of 66.6; Kep-postTx showed an AUC of 0.849 (95% CI: 0.729–0.930), with a cutoff value of 0.341, sensitivity of 87.1% (95% CI: 70.2–96.4%), specificity of 73.1% (95% CI: 52.2–88.4%), and maximal Youden Index of 60.2; Ve-midTx showed an AUC of 0.660 (95% CI: 0.523–0.780), with a cutoff value of 0.557, sensitivity of 61.3% (95% CI: 42.2–78.2%), specificity of 76.9% (95% CI: 56.4–91.0%), and maximal Youden Index of 38.2 (Figure 5, Table 5).
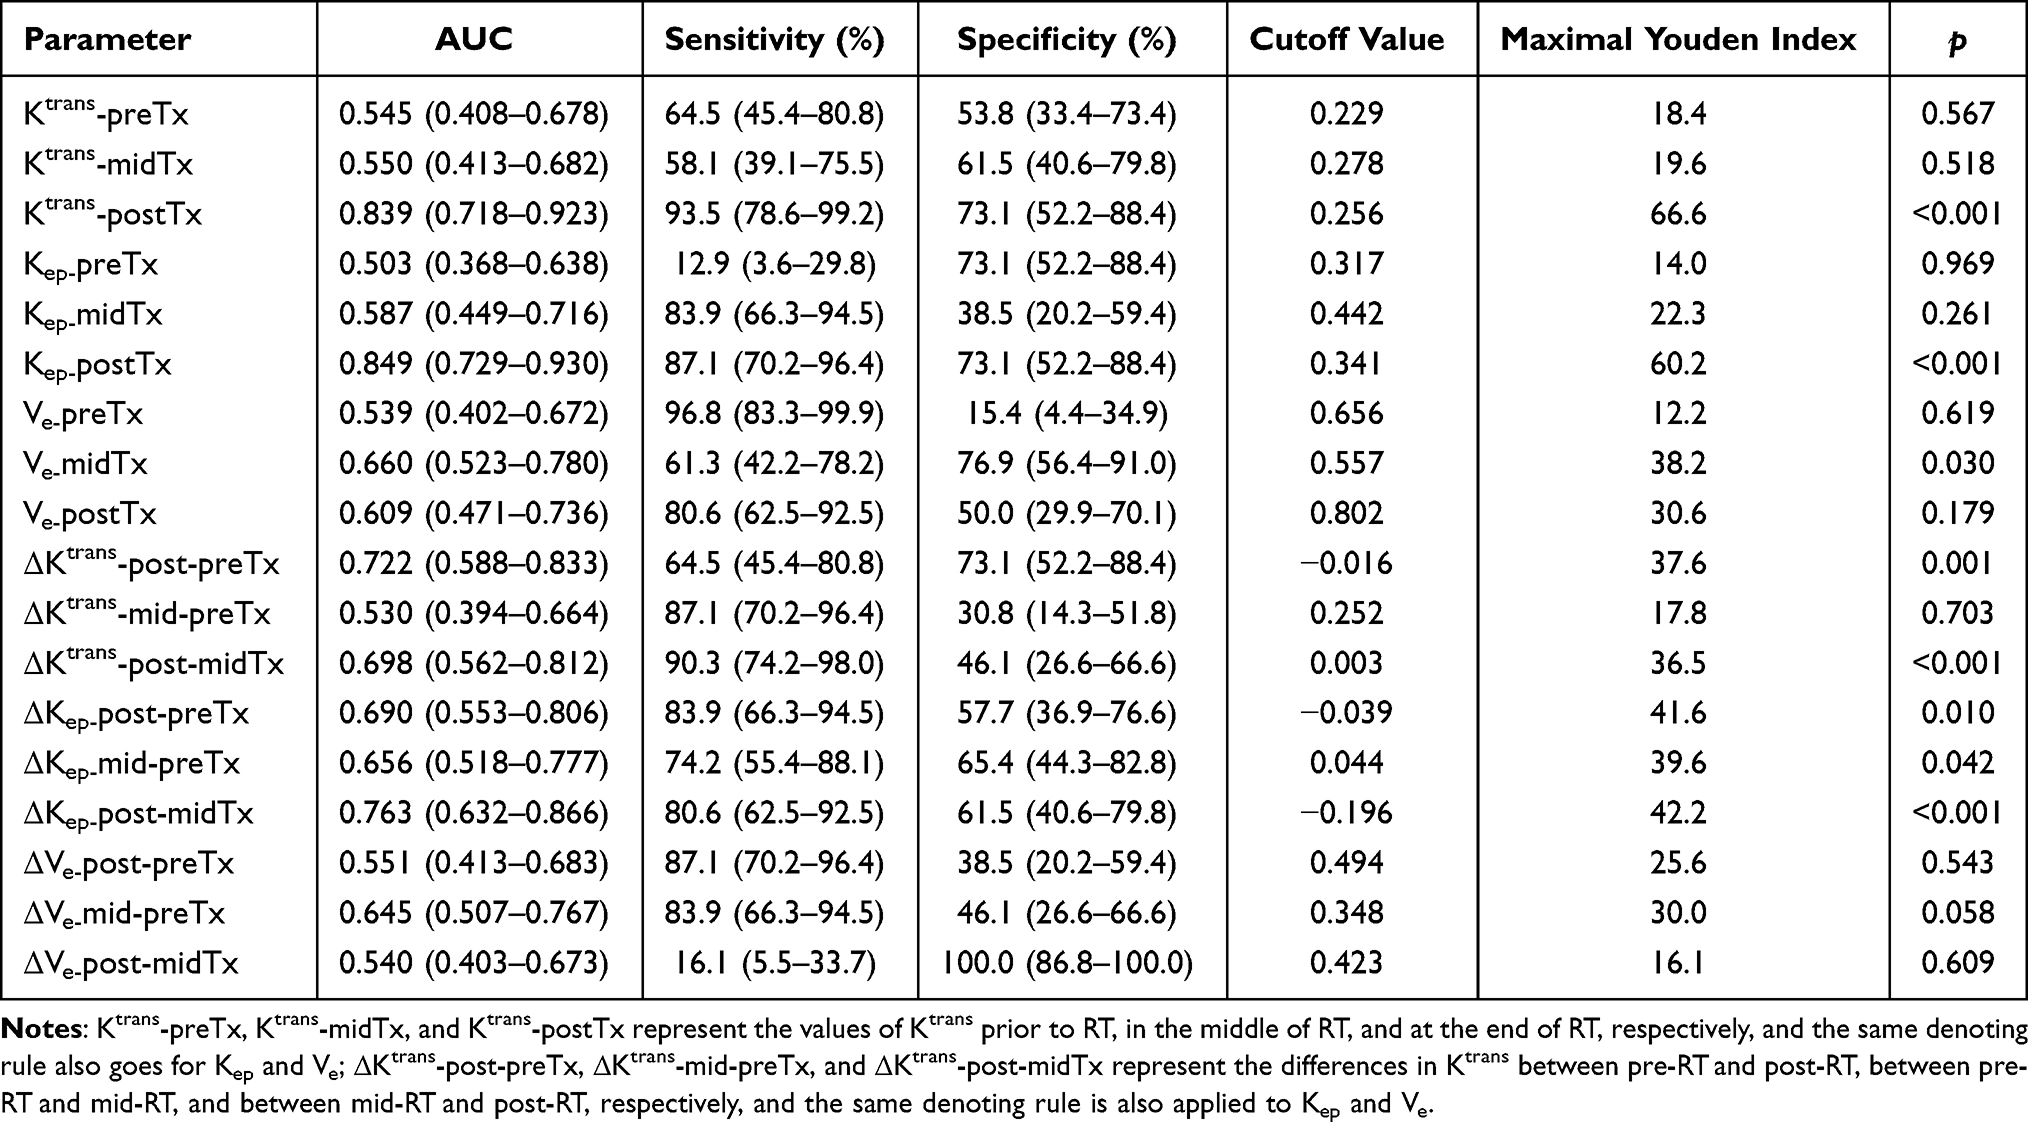 |
Table 5 Diagnostic Efficiency of Kinetic Parameters in Differentiating Responders from Non-Responders |
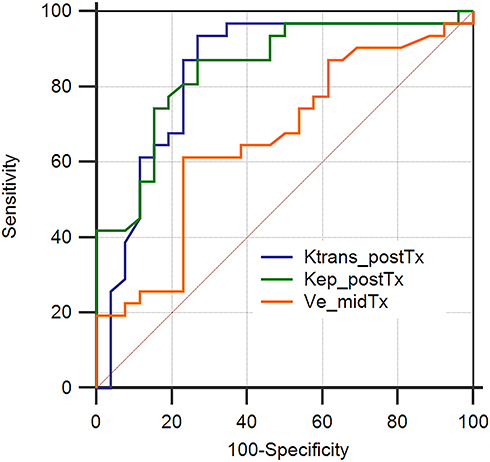 |
Figure 5 ROC for Ktrans-postTx, Kep-postTx, and Ve-midTx. |
There were significant differences in ΔKtrans-post-preTx, ΔKtrans-post-midTx, ΔKep-post-preTx, ΔKep-mid-preTx, and ΔKep-post-midTx between the two groups (p=0.004, 0.011, 0.044, 0.014, and 0.001, respectively), suggesting that the abovementioned parameters may have a predictive role in early treatment response, whereas no significant differences were observed in other parameters, including ΔKtrans-mid-preTx, ΔVe-post-preTx, ΔVe-mid-preTx, and ΔVe-post-midTx, between the two groups (Table 3). The performances of ΔKtrans-post-preTx, ΔKtrans-post-midTx, ΔKep-post-preTx, ΔKep-mid-preTx, and ΔKep-post-midTx in predicting treatment response were assessed by ROC analysis. ΔKtrans-post-preTx showed an AUC of 0.722 (95% CI: 0.588–0.833), with a cutoff value of −0.016, sensitivity of 64.5% (95% CI: 45.4–80.8%), specificity of 73.1% (95% CI: 52.2–88.4%), and maximal Youden Index of 37.6; ΔKtrans-post-midTx showed an AUC of 0.698 (95% CI: 0.562–0.812), with a cutoff value of 0.003, sensitivity of 90.3% (95% CI: 74.2–98.0%), specificity of 46.1% (95% CI: 26.6–66.6%), and maximal Youden Index of 36.5; ΔKep-post-preTx showed an AUC of 0.690 (95% CI: 0.553–0.806), with a cutoff value of −0.039, sensitivity of 83.9% (95% CI: 66.3–94.5%), specificity of 57.7% (95% CI: 36.9–76.6%), and maximal Youden Index of 41.6; ΔKep-mid-preTx showed an AUC of 0.656 (95% CI: 0.518–0.777), with a cutoff value of 0.044, sensitivity of 74.2% (95% CI: 55.4–88.1%), specificity of 65.4% (95% CI: 44.3–82.8%), and maximal Youden Index of 39.6; ΔKep-post-midTx showed an AUC of 0.763 (95% CI: 0.632–0.866), with a cutoff value of −0.196, sensitivity of 80.6% (95% CI: 62.5–92.5%), specificity of 61.5% (95% CI: 40.6–79.8%), and maximal Youden Index of 42.2 (Figure 6, Table 5). Logistic regression model was performed to analyze the predictive role of the combined parameters including Ktrans-postTx, Kep-postTx, Ve-midTx, ΔKtrans-post-preTx, ΔKtrans-post-midTx, ΔKep-post-preTx, ΔKep-mid-preTx, and ΔKep-post-midTx. It showed an AUC of 0.952 (95% CI: 0.860–0.991), with sensitivity of 87.1% (95% CI: 70.2–96.4%), specificity of 96.1% (95% CI: 80.4–99.9%), and maximal Youden Index of 83.3 (Table 5, Figure 7).
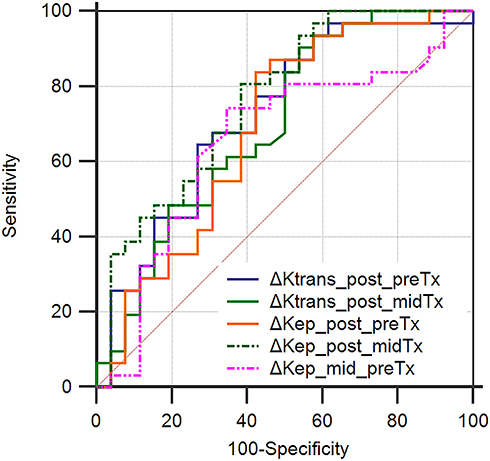 |
Figure 6 ROC for ΔKtrans-mid-preTx, ΔKtrans-post-midTx, ΔKep-post-preTx, ΔKep-mid-preTx, and ΔKep-post-midTx. |
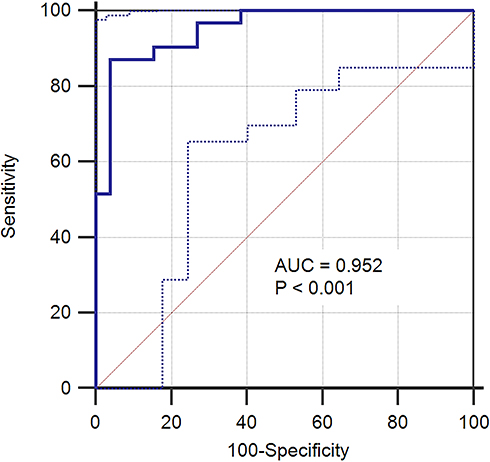 |
Figure 7 ROC for the combined DCE-MRI parameters. |
Discussion
CCRT is an effective treatment combination for locally advanced cervical cancer. In the present study, the tumor volume continuously shrank as the treatment proceeded. The volume after RT was significantly smaller than that in mid-RT or pre-RT. Even in mid-RT, the tumor volume remained quite smaller than that in pre-RT. However, for patients who obtained different treatment response, the absolute tumor volumes and their change rates may vary significantly. Both the CR and NCR groups had similar tumor volume in pre-RT. In mid-RT, however, the CR group had a significantly smaller volume, compared with the NCR group, and this difference in tumor volume became even more apparent in post-RT. The regression rate of the tumor volume in the CR group was notably higher than that in the NCR group. These findings suggest that patients with CR are more sensitive to chemoradiotherapy. Therefore, they are more likely to achieve a better short-term local/regional tumor control or even a long-term survival benefit. In fact, studies on cervical cancer,11,12 small-cell lung cancer,13 and gastric cancer14 have found that patients’ prognosis are closely related to the size of residual tumor and the tumor regression rate. Those with less tumor residuals or higher tumor regression rate benefit most in the short-term or long-term outcomes.
The tumor volume and its change were associated with DCE-MRI parameters. Ktrans-preTx was closely correlated with the tumor regression rates in pre-, mid-, and post-RT; Kep-postTx was closely correlated with the tumor volume in mid-RT, and regression rates in mid- and post-RT; Ve-preTx was closely correlated with the tumor regression rate in mid-RT; Ve-midTx, Ktrans-postTx, ΔKtrans-post-preTx, ΔKtrans-post-midTx, ΔKep-post-preTx, and ΔKep-post-midTx were closely correlated with the tumor volume in post-RT and the tumor regression rate in post-RT.
So far, numerous studies on DCE-MRI have suggested that its quantitative parameters could be served as potential markers to predict treatment response and long-term survival.15,16 Ktrans is an indicator for tumor blood flow and permeability of the microvasculature and is often used to monitor anti-tumor treatment response. Other pharmacokinetic parameters such as Kep, and Ve are sometimes used to describe the absorption of low molecular weight gadolinium. Ve is defined as the volume of extravascular extracellular space (EES) per unit volume of tissue, and EES consists of interstitial fluid and connective tissues.17 It is commonly believed that a higher Ktrans value is an indicator for increased vascular leakage, whereas an increased vascular leakage represents active angiogenesis. As these parameters can provide different physiological information, when they are combined with other quantified or qualified parameters, they may play a complementary role in assessing treatment response. Since the effectiveness of anti-tumor treatment is often closely related to local blood flow perfusion and angiogenesis, and tumors with higher perfusion and active angiogenesis are more sensitive to chemoradiotherapy. Theoretically, tumors with higher Ktrans and Kep may have a better prognosis. Several studies on rectal cancer,18,19 head-and-neck cancer,15,16,20–22 breast cancer,23 and esophagus cancer24 have found that patients with higher Ktrans prior to chemoradiotherapy have a favorable prognosis, including pathological response rate, clinical response rate, a long-term survival. However, other studies drew inconsistent or even opposite conclusions.25
Studies specifically focused on the application of DCE-MRI to cervical cancer is rare and often with small sample size. Semple et al26 performed DCE-MRI scans for 20 cervical cancer patients with locally advanced disease undergoing chemoradiotherapy before treatment, 2 weeks after the initiation of treatment, and at the end of treatment. They found that pretreatment imaging parameters and Ktrans were closely correlated with anti-tumor response. Another study with a small subject demonstrated that tumor regression rate was positively related to Ktrans and Kep.27 However, their predictive role in cervical cancer treated with chemoradiotherapy is still controversial. Pretreatment Kep was not correlated with treatment outcome, shown by a study of pharmacokinetic model.28 In the present study, changes in the CR and NCR groups were not totally the same. In the CR group, Ktrans in mid-RT was significantly higher than that in pre-RT, and Ktrans in post-RT was significantly higher than that in mid-RT. However, when comparing pre- and post-RT, no significant difference was found in Ktrans. While in the NCR group, Ktrans in mid-RT was significantly higher than that in pre-RT. Significant difference was found in Ktrans between pre- and post-RT, but the changing direction was opposite to the CR group. Compared with Ktrans in mid-RT, no substantial change in Ktrans was found in post-RT, but it was higher than that in pre-RT. As for Kep, significant differences were observed in the CR group between every two time points, but in the NCR group, significant differences existed only between pre- and post-RT. With respect to Ve, the CR and NCR groups had the same changing pattern. Significant differences were observed between every two time points. This may be explained by the following: After anti-tumor therapy, patients in the CR group had a larger area containing fibrillation and a significantly lower vascular permeability, comparing with those in the PR group who had substantial tumor residuals. This phenomenon took place not only in chemoradiotherapy, but also in anti-angiogenesis agents.29,30 In fact, it might be more meaningful to compare the magnitudes of decrease for every parameter in both groups. Several studies indicated that tumors with higher Ktrans and Kep before treatment but lower Ktrans and Kep after treatment, or a higher reduction range in Ktrans and Kep after treatment were more responsive to treatment.19,24,31 Consistent with the findings mentioned above, significant differences were observed in Ktrans-postTx, Kep-postTx, Ve-midTx, ΔKtrans-post-preTx, ΔKtrans-post-midTx, ΔKep-post-preTx, ΔKep-mid-preTx, and ΔKep-post-midTx between the two groups.
There are a number of studies that were focused on the role of DCE-MRI parameters in predicting treatment outcome. For example, findings from a study of esophagus cancer patients who underwent CCRT showed that a number of parameters, including pre-treatment Ktrans, post-treatment Ktrans and change rate of Ktrans, difference in Ktrans between pre- and post-treatment and change rate of Ktrans, post-treatment Kep, and difference in Kep between pre- and post-treatment and change rate of Kep, were all predictive of early treatment response. Among these parameters, change rate of Ktrans was most potent predictor, with an AUC of 0.840, sensitivity of 89.5%, and specificity of 61.9%.24 In our study, significant differences were found in Ktrans-postTx, Kep-postTx, Ve-midTx, ΔKtrans-post-preTx, ΔKtrans-post-midTx, ΔKep-post-preTx, ΔKep-mid-preTx, and ΔKep-post-midTx between the two groups. A ROC analysis showed an AUC of 0.656–0.849, sensitivity of 61.3–93.5%, specificity of 46.1–73.1%, and maximal Youden Index of 36.5–66.6. Among those parameters, Kep-postTx was the best, and its AUC, sensitivity, specificity, maximal Youden Index, and cutoff value were 0.849, 87.1%, 73.1%, 60.2, and 0.341, respectively. The combination of these parameters showed an AUC of 0.952, with sensitivity of 87.1%, specificity of 96.1%, and maximal Youden Index of 83.2.
There are several limitations in the present study. First, only early treatment response was predicted through DCE-MRI parameters, and the assessment of early treatment response was clinically based. An ideal tool to assess the early response should be post-treatment pathological findings. However, for patients in this study, it is almost impossible to obtain tissue samples after definitive chemoradiotherapy unless patients were initially treated with surgery. In order to assess whether the early response determined at the end of RT would be reliably representative of the status of tumor control, we compared the images obtained at the end of RT with those obtained 6 months after RT and found the two findings were consistent. An ideal predictor should be the one capable of predicting long-term outcome, survival in particular. However, in the present study, the follow-up time was relatively short, and only a few endpoint events took place. Therefore, it was difficult to assess and predict the long-term outcomes.
In a word, the potentials of DCE-MRI in assessing and predicting treatment outcome have been shown in a variety of tumor types and anti-tumor therapies. The combination of anatomic and functional images could overcome the drawback of mono-imaging technique. However, a lot of difficulties need to be solved, including appropriate selection of pharmacokinetic model, reproducibility of research findings, and selection of optimal parameter. Meanwhile, prospective studies with large sample size are warranted to confirm those findings.
Conclusion
For LACC patients who undergo definitive CCRT, DCE-MRI parameters can predict the early treatment response. Among those parameters, Kep-postTx is the best predictor for early treatment response. The combination of multi-parameters can increase the predictive potency.
Acknowledgments
This work was supported by the Wu Jieping Medical Foundation (No 2013-428-2081) and Research and Development of Appropriate Medical Technology in Guangxi (S2017082).
Disclosure
The authors report no conflicts of interest in this work.
References
1. Centers for Disease Control and Prevention. Global cancer statistics. Available from: http://www.cdc.gov/cancer/international/statistics.htm.
2. World Health Organization. Human papillomavirus (HPV) and cervical cancer. Available from: http://www.who.int/mediacentre/factsheets/fs380/en/.
3. Li X, Huang K, Zhang Q, et al. Early response to neoadjuvant chemotherapy can help predict long-term survival in patients with cervical cancer. Oncotargets. 2016;7:87485–87495. doi:10.18632/oncotarget.11460
4. Britten RA, Evans AJ, Allalunis-Turner MJ, et al. Intratumoral heterogeneity as a confounding factor in clonogenic assays for tumour radioresponsiveness. Radiother Oncol. 1996;39:145–153. doi:10.1016/0167-8140(96)01719-7
5. Pickles MD, Gibbs P, Lowry M, et al. Diffusion changes precede size reduction in neoadjuvant treatment of breast cancer. Magn Reson Imaging. 2006;24:843–847. doi:10.1016/j.mri.2005.11.005
6. Eisenhauer EA, Therasse P, Bogaerts J, et al. New response evaluation criteria in solid tumours: revised RECIST guideline (version 1.1). Eur J Cancer. 2009;45:228–247. doi:10.1016/j.ejca.2008.10.026
7. Hoskin PJ, Saunders MI, Goodchild K, et al. Dynamic contrast enhanced magnetic resonance scanning as a predictor of response to accelerated radiotherapy for advanced head and neck cancer. Br J Radiol. 1999;72:1093–1098. doi:10.1259/bjr.72.863.10700827
8. Hyulton NM, Blume JD, Bernreuter WK, et al. Locally advanced breast cancer: MR imaging for prediction of response to neoadjuvant chemotherapy-results from ACRIN 6657/I-SPY TRIAL. Radiology. 2012;263:663–672. doi:10.1148/radiol.12110748
9. Heethuis SE, van Rossum PSN, Lips IM, et al. Dynamic contrast-enhanced MRI for treatment response assessment in patients with oesophageal cancer receiving neoadjuvant chemoradiation. Radiother Oncol. 2016;120:128–135. doi:10.1016/j.radonc.2016.05.009
10. Mayr NA, Yuh WTC, Zheng J, et al. Tumor size evaluated by pelvic examination compared with 3-D quantitative analysis in the prediction of outcome for cervical cancer. Int J Radiat Oncol Biol Phys. 1997;39:395–404. doi:10.1016/S0360-3016(97)00318-0
11. Noh JM, Park W, Huh SJ, et al. Prognostic implications of tumor volume response and COX-2 expression change during radiotherapy in cervical cancer patients. Radiat Oncol J. 2012;30:218–225. doi:10.3857/roj.2012.30.4.218
12. Lee KC, Kim HJ, Sung K, et al. The predictive value of tumor size, volume, and markers during radiation therapy in patients with cervical cancer. Int J Gynecol Cancer. 2017;27:123–130. doi:10.1097/IGC.0000000000000837
13. Lee J, Lee J, Choi J, et al. Early treatment volume reduction rate as a prognostic factor in patients treated with chemoradiotherapy for limited stage small cell lung cancer. Radiat Oncol J. 2015;33:117–125. doi:10.3857/roj.2015.33.2.117
14. Osumi H, Takahari D, Shinozaki E, et al. Association between early tumor shrinkage and depth of response and clinical outcomes in patients treated with 1st-line chemotherapy for advanced gastric cancer. Gastric Cancer. 2018;21:267–275. doi:10.1007/s10120-017-0729-2
15. Kim S, Loevener LA, Quon H, et al. Prediction of response to chemoradiation therapy in squamous cell carcinomas of the head and neck using dynamic contrast-enhanced MR imaging. AJNR Am J Neuroradiol. 2010;31:262–268. doi:10.3174/ajnr.A1817
16. Chawla S, Kim S, Loevner LA, et al. Prediction of disease-free survival in patients with squamous cell carcinomas of the head and neck using dynamic contrast-enhanced MR imaging. AJNR Am J Neuroradiol. 2011;32:778–784. doi:10.3174/ajnr.A2376
17. McLaughlin R, Hylton N. MRI in breast cancer therapy monitoring. NMR Biomed. 2011;24:
18. Tong T, Sun Y Y, Gollub MJ, et al. Dynamic contrast enhanced MRI: use in predicting pathological complete response to neoadjuvant chemoradiation in locally advanced rectal cancer. J Magn Reson Imaging. 2015;42:673–680. doi:10.1002/jmri.24835
19. Intven M, Reerink O, Philippens ME. Dynamic contrast enhanced MR imaging for rectal cancer response assessment after neo-adjuvant chemoradiation. J Magn Reson Imaging. 2015;41:1646–1653. doi:10.1002/jmri.24718
20. King AD, Thoeny HC. Functional MRI for the prediction of treatment response in head and neck squamous cell carcinoma: potential and limitations. Cancer Imaging. 2016;16:23. doi:10.1186/s40644-016-0080-6
21. Shukla-Dave A, Lee NY, Jansen JF, et al. Dynamic contrast-enhanced magnetic resonance imaging as a predictor of outcome in head-and-neck squamous cell carcinoma patients with nodal metastases. Int J Radiat Oncol Biol Phys. 2012;82:1837–1844. doi:10.1016/j.ijrobp.2011.03.006
22. Jansen JF, Scho¨der H, Lee NY, et al. Noninvasive assessment of tumor microenvironment using dynamic contrast-enhanced magnetic resonance imaging and 18F-fluoromisonidazole positron emission tomography imaging in neck nodal metastases. Int J Radiat Oncol Boil Phys. 2010;77:1403–1410. doi:10.1016/j.ijrobp.2009.07.009
23. Lee HY, Kim N, Goo JM, et al. Perfusion parameters as potential imaging biomarkers for the early prediction of radiotherapy response in a rat tumor model. Diagn Interv Radiol. 2016;22:231–240. doi:10.5152/dir.2015.15171
24. Sun NN, Liu C, Ge XL, et al. Dynamic contrast-enhanced MRI for advanced esopharyngeal cancer response assessment after concurrent chemoradiotherapy. Diagn Interv Radiol. 2018;24:195–202. doi:10.5152/dir.2018.17369
25. Gollub MJ, Gultekin DH, Akin O, et al. Dynamic contrast enhanced-MRI for the detection of pathological complete response to neoadjuvant chemotherapy for locally advanced rectal cancer. Eur Radiol. 2012;22:821–831. doi:10.1007/s00330-011-2321-1
26. Semple SIK, Harry VN, Parkin D, et al. A combined pharmacokinetic and radiologic assessment of dynamic contrast-enhanced magnetic resonance imaging predicts response to chemoradiation in locally advanced cervical cancer. Int J Radiat Oncol Biol Phys. 2009;75:611–617. doi:10.1016/j.ijrobp.2009.04.069
27. Zahra MA, Tan LT, Priest AN, et al. Semiquantitative and quantitative dynamic contrast-enhanced magnetic resonance imaging measurements predict radiation response in cervix cancer. Int J Radiat Oncol Biol Phys. 2009;74:766–773. doi:10.1016/j.ijrobp.2008.08.023
28. Loncaster JA, Carrington BM, Sykes JR, et al. Prediction of radiotherapy outcome using dynamic contrast enhanced MRI of carcinoma of the cervix. Int J Radiat Oncol Biol Phys. 2002;54:759–767. doi:10.1016/S0360-3016(02)02972-3
29. Hirashima Y, Yamada Y, Tateishi U, et al. Pharmacokinetic parameters from 3-Tesla DCE-MRI as surrogate biomarkers of antitumor effects of bevacizumab plus FOLFIRI in colorectal cancer with liver metastasis. Int J Cancer. 2012;30:2359–2365. doi:10.1002/ijc.26282
30. De Bruyne S, Van Damme N, Smeets P, et al. Value of DCE-MRI and FDG-PET/CT in the prediction of response to preoperative chemotherapy with bevacizumab for colorectal liver metastases. Br J Cancer. 2012;106:1926–1933. doi:10.1038/bjc.2012.184
31. Sahani DV, Kalva SP, Hamberg LM, et al. Assessing tumor perfusion and treatment response in rectal cancer with multisection CT: initial observations. Radiology. 2005;234:785–792. doi:10.1148/radiol.2343040286
 © 2021 The Author(s). This work is published and licensed by Dove Medical Press Limited. The full terms of this license are available at https://www.dovepress.com/terms.php and incorporate the Creative Commons Attribution - Non Commercial (unported, v3.0) License.
By accessing the work you hereby accept the Terms. Non-commercial uses of the work are permitted without any further permission from Dove Medical Press Limited, provided the work is properly attributed. For permission for commercial use of this work, please see paragraphs 4.2 and 5 of our Terms.
© 2021 The Author(s). This work is published and licensed by Dove Medical Press Limited. The full terms of this license are available at https://www.dovepress.com/terms.php and incorporate the Creative Commons Attribution - Non Commercial (unported, v3.0) License.
By accessing the work you hereby accept the Terms. Non-commercial uses of the work are permitted without any further permission from Dove Medical Press Limited, provided the work is properly attributed. For permission for commercial use of this work, please see paragraphs 4.2 and 5 of our Terms.