")
Back to Journals » Cancer Management and Research » Volume 14
The Role of COL22A1 in the Pathophysiology of Hepatocellular Carcinoma: Evidence from Bioinformatics Exploration
Authors Tian H, Chen Y, Zhang R, Liu J
Received 30 November 2021
Accepted for publication 29 January 2022
Published 22 February 2022 Volume 2022:14 Pages 739—750
DOI https://doi.org/10.2147/CMAR.S349991
Checked for plagiarism Yes
Review by Single anonymous peer review
Peer reviewer comments 2
Editor who approved publication: Professor Bilikere Dwarakanath
Hengyu Tian, Yuanyuan Chen, Renjie Zhang, Jialin Liu
Department of Hepatobiliary Surgery, Shenzhen Traditional Chinese Medicine Hospital/The fourth Clinical Medical College of Guangzhou University of Chinese Medicine, Shenzhen, Guangdong, 518033, People’s Republic of China
Correspondence: Jialin Liu, Tel +86-13714754393, Email [email protected]
Introduction: This work carried out comprehensive bioinformatics analysis and explored potential actions of COL22A1 in hepatocellular carcinoma (HCC) pathophysiology.
Methods: Microarray datasets including GSE159220, GSE104766, GSE104310 and GSE33294 were retrieved for bioinformatics analysis. Overlapped differentially expressed genes (DEGs) among GSE159220, GSE104766, GSE104310 and GSE33294 were first subjected to functional annotation analysis. Protein–protein interaction (PPI) network was constructed to reveal the hub genes in the network. The miRNAs-mRNA from hub genes were also constructed. Prognostic analysis of patients with HCC was undertaken to evaluate prognostic values of these hub genes. Functional assays were employed to determine actions of COL22A1 in the HCC cell progression.
Results: Ninety-one common up-regulated DEGs and 55 common down-regulated DEGs among GSE159220, GSE104766, GSE104310 and GSE33294 were identified. Functional annotation analysis revealed that these common DEGs may be correlated with the extracellular matrix. The protein–protein interaction analysis further revealed 20 hub genes. Among these hub genes, high expression levels of COL2A1, COL22A1, HAPLN1, PTHLH and SOX2 showed positive associatin with shorter overall survival (OS) of HCC patients, while low expression levels of COL17A1, REN and TRH exhibited correlation with shorter OS of HCC patients. Furthermore, the COL22A1 was overexpressed in HCC tissues when compared to normal ones, and the promoter methylation level of COL22A1 was significantly lower in the HCC tissues when compared to normal ones. Validation assays deciphered that COL22A1 silencing suppressed HCC cell invasion, migration and epithelial mesenchymal transition.
Conclusion: This study identified several hub genes closely correlated with HCC pathogenesis, and COL22A1 may be involved in the HCC metastasis, but this still requires further mechanistic studies.
Keywords: hepatocellular carcinoma, differentially expressed genes, hub genes, COL22A1, prognosis
Introduction
Hepatocellular carcinoma (HCC) represents a common type of solid tumor and affects more than 100,000 people worldwide.1 Due to the complicated underlying molecular mechanisms, the management of advanced HCC is still far from satisfying. Recently, sorafenib, a multi-tyrosine kinase inhibitor, is an only systemic targeted tumor therapy in use for late-stage HCC.2,3 However, sorafenib-resistance has been developed in patients with HCC. Therefore, there are urgent requirements to deepen the understanding into the mechanisms underlying HCC pathophysiology.
In recent years, rapid advancements in the field of biotechnology has enabled biologists to perform high throughput of gene expression profiles.4–6 Based on the gene expression profiles, advanced bioinformatics analysis can largely accelerate the data mining process and has identified various novel biomarkers in cancer biology including HCC. Comprehensive RNA profiling on T cells from 6 HCC patients was performed, and their results provided novel insights in deciphering the immune landscape of HCC.7 RNA sequencing in the HCC cells derived from patients revealed that liver tumorigenesis was associated with abberrant splicing.8 One study using the circRNA sequencing revealed CircASAP1 as an essential modulator in HCC metastasis.9 Due to the increasing amount of datasets generated by high throughput sequencing, the bioinformatics analysis of publicly available datasets from GEO database also revealed many key regulators in the HCC progression. Bioinformatics analysis for HCC-associated dataset GSE14323 identified several key genes and pathways associated with HCC pathophysiology.10 Another study used the same strategy to identify six differentially expressed circRNAs from GSE78520, GSE94508 and GSE97332, and their results provided novel understandings of circRNA-miRNA-mRNA interactions in HCC pathophysiology.11 In addition, the bioinformatics for microarray GSE69580 identified an essential miRNA-mRNA interactive network correlating with HCC pathogenesis .12 Based on the above strategies for data mining, further analysis of publicly available datasets may be of great scientific significance for deciphering the molecular mechanisms underlying HCC progression.
In this investigation, four datasets including GSE159220, GSE104766, GSE104310 and GSE33294 were retrieved for bioinformatics analysis. Differentially expressed genes (DEGs) among GSE159220, GSE104766, GSE104310 and GSE33294 were first subjected to functional annotation analysis. After that, our work established protein–protein interaction (PPI) network for common DEGs to reveal the hub genes in the network. Moreover, the miRNAs-mRNA from hub genes were also constructed. Prognostic analysis of HCC patients was also performed to evaluate prognostic values of these hub genes. The validation studies were undertaken to evaluate underlying actions of hub genes in the HCC cell progression.
Materials and Methods
Retrieval of Datasets Including GSE159220, GSE104766, GSE104310 and GSE33294
In the study, four GEO datasets including GSE159220, GSE104766, GSE104310 and GSE33294 were available from the online GEO database (http://www.ncbi.nlm.nih.gov/geo/. For GSE159220, GPL11154 (Illumina HiSeq 2000) platform is used, and the dataset contains 3 normal/3 HCC tissues. For GSE104766, GPL16791 (Illumina HiSeq 2500) is used, and the dataset contains 25 HCC tissues and matched normal liver tissues. For GSE104310, GPL16791 (Illumina HiSeq 2500) is used, and the dataset contains 10 HCC tissues and matched normal ones. For GSE33294, GPL10999 (Illumina Genome Analyzer IIx) platform is used, and the dataset contains 3 HCC tissues and corresponding matched normal ones.
Identification of DEGs
GREIN tool (http://www.ilincs.org/apps/grein/) was employed to screen the significant DEGs in HCC tissues compared to normal ones from GSE159220, GSE104766, GSE104310 and GSE33294 datasets. The criteria for selecting the significant DEGs was shown below: false discovery rate P < 0.05 and logfold change (FC) >1.5 or logFC < −1.5. The correlation plot for the datasets, the t-NSE analysis of the tissue phenotypes, and the heatmap for the top 500 DEGs were plotted by using the GREIN online tool. Volcano plots illustrating DEGs in GSE159220, GSE104766, GSE104310 and GSE33294 and Venn diagram showing the overlapped common DEGs among GSE159220, GSE104766, GSE104310 and GSE33294 were performed by using the R software.
Functional Annotation Analysis of DEGs
The GO annotation, KEGG pathway, and Reactome analysis of common DEGs were retrieved from the g:Profiler tool (a web tool for GO annotation analysis). GO annotation analysis is used to generate hypotheses for biological phenomena and to explain large sets of profiling data.13 KEGG is a database for illustrating functions and biological system. Reactome is 1 peer-reviewed knowledge-base of biomolecular pathways.
Network Construction
PPI network for the mRNA was constructed using STRINGtool, which is an open-source database for predicting interacted proteins. For the PPI network construction, confident score > 0.7 was used. For detection of hub genes, the Cytohubba plugin from Cytoscape software was employed to extract key modules. MmiRNAs that target the hub genes were predicted by miRDB (http://mirdb.org/, an open-source tool for miRNA-target prediction). PPI network and miRNAs-mRNA network were plotted with Cytoscape software.
Survival Analysis
Correlation between hub genes expression levels and overall survival (OS) of HCC patients was assessed with KM Plotter online tool. For survival analysis, the database included a total of 364 HCC patients. The OS curve was plotted using the Kaplan–Meier Survival analysis plot. The significance was considered when logrank P < 0.05.
The Expression and Prognosis Analysis of COL22A1 in Patients with HCC
COL22A1 expression and promoter methylation level of COL22A1 in HCC were analyzed in the TCGA samples using the UACLAN database. In the database, 50 normal liver tissues and 377 HCC primary tumor tissues and 50 normal ones were employed for analysis. In the survival analysis, the database included a total of 365 patients with HCC. The OS curve was plotted with Kaplan–Meier Survival analysis plot. The significance was considered when logrank P < 0.05.
Cell Lines and Cell Culture
HepG2 and Huh7 cells were from Chinese Academy of Sciences (Shanghai, China). Cells were cultured in the DMEM medium (Thermo Fisher Scientific, Waltham, USA) supplemented with 10% fetal bovine serum (FBS, Thermo Fisher Scientific) and were maintained in a humidified atmosphere with 5% CO2 at 37°C. For detecting mycoplasma, the cell lines were cultured in the absence of antibiotics for more than 2 weeks after thawing. Samples were taken without medium refreshment at least 2 or 7 days post culture. 14
Design and Synthesis of COL22A1 siRNA and siRNA Transfection into Cells
The siRNA targeting COL22A1 was designed and synthesized by Ribobio (Guangzhou, China). The scrambled sequence of COL22A1 siRNA was also synthesized to serve for negative control (NC) siRNA. For siRNA transfections, HepG2 and Huh7 cells were transfected with corresponding siRNAs, ie NC siRNA or COL22A1 siRNA using the Lipofectamine 2000 reagent (Thermo Fisher Scientific). At 24 h after HepG2 and Huh7 cells were transfected with these siRNAs, transfected cells were collected for downstream assays.
Quantitative Real-Time PCR (qRT-PCR)
RNA from HepG2 and Huh7 cells was extracted with TRIzol reagent (Invitrogen, Carlsbad, USA). For reverse transcription, the RNA was transcribed into cDNA using Superscript IV Reverse Transcriptase kit (Thermo Fisher Scientific). qRT-PCR was performed using the Platinum™ SYBR™ Green qPCR SuperMix (Thermo Fisher Scientific) on an ABI7900 Biosystems (Applied Biosystems, Foster City, USA). The relative mRNA expression levels of COL22A1, E-cadherin, N-cadherin and vimentin were normalized to the housekeeper gene, GAPDH. The mRNA expression levels were calculated with the 2−ΔΔCt method.
Transwell Invasion Assay
HCC cell invasion capacity was assessed with Transwell invasion assay. In brief, at 24 h after HepG2 and Huh7 cells were treated for scrambled NC or COL22A1 siRNA, these cells were seeded in the 12-well inserts coated with Matrigel (Sigma-Aldrich, St. Louis, USA). The 12-well inserts were placed in the upper chamber filled with DMEM, while lower chamber was filled with 10% FBS-DMEM. After 24 h culture, cells invaded into lower surface of Matrigel membrane were stained with 0.3% crystal violet for 5 min. Stained cells were evaluated by counting the cell number in five random fields using light microscopy.
Wound Healing Assay
HCC cell migration capacity was evaluated by wound healing assay. In brief, at 24 h after HepG2 and Huh7 cells were treated for scrambled NC or COL22A1 siRNA, these cells were, respectively, seeded onto a 6-well plate. After the confluence of ~90% was reached in these cells, a sterile wool cotton was used to scratch the monolayer so as to create the wound. Cells were allowed to grow in the 6-well plates for further 48 h. Wound width was measured at 0 h and 48 h after the wound was created. Wound healing capacity of the cells were shown as (0 h wound width – 48 h wound width)/0 h wound width × 100%.
Statistical Analysis
For data analysis, validating results were presented as mean ± standard deviation of 3 determinations. Statistical analysis and plotting graphs were performed using the GraphPad Prism Version 8 (GraphPad software, La Jolla, USA). The Student’s unpaired t-test was used to determine the statistical significance between the two treatment groups. P < 0.05 was defined as statistical significance.
Results
Analysis of DEGs from Different DEGs
The correlation analysis of the collected datasets is illustrated in Figure 1A–D. The t-NSE analysis for the collected datasets are shown in Figure 1E–H, and the t-NSE results showed that the data were well clustered according to the phenotype of the tissues, ie HCC tissues and normal ones (Figure 1E–H). In addition, the top 500 DEGs between HCC tissues and normal ones from GSE159220, GSE104766, GSE104310 and GSE33294 were illustrated as heatmap (Supplemental Figure S1A–S1D).
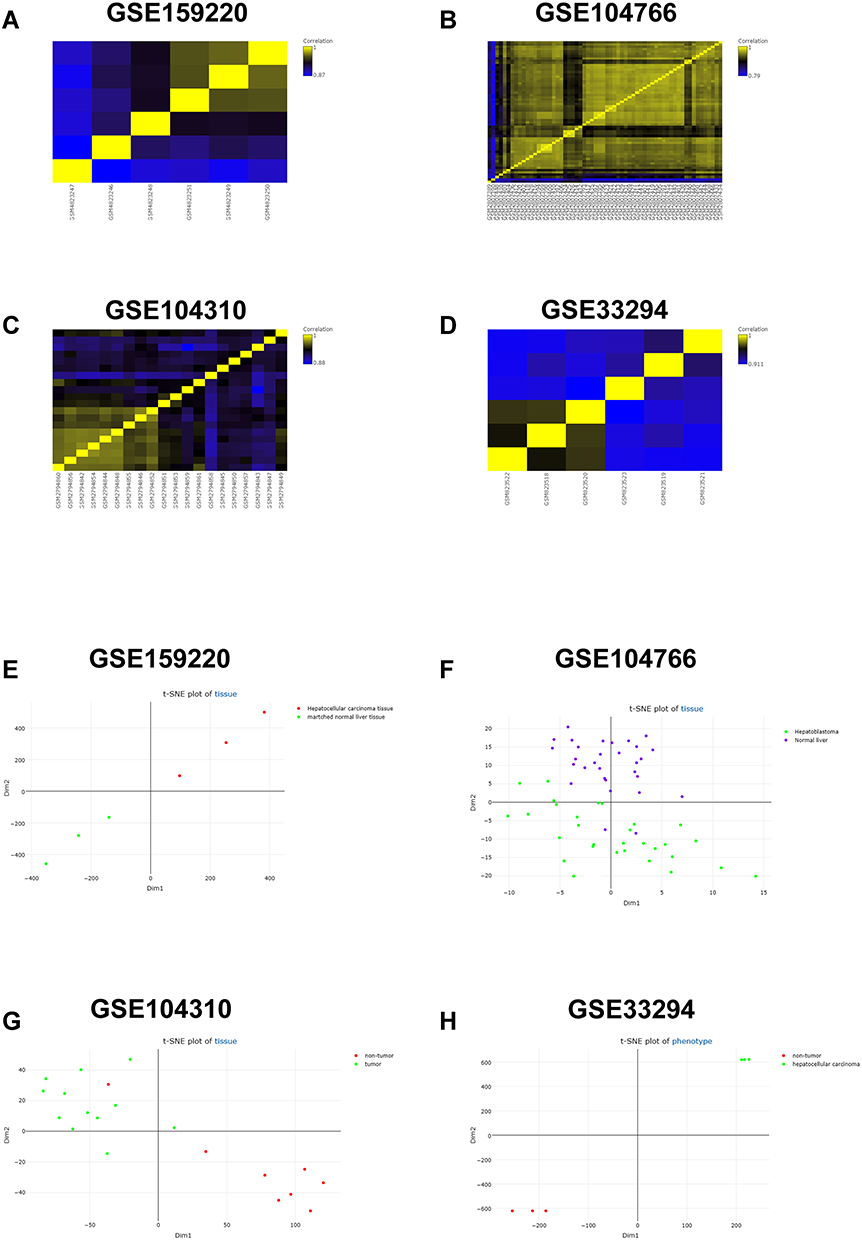 |
Figure 1 Correlation analysis and t-SNE analysis of the GEO datasets. (A–D) The correlation analysis of (A) GSE159220, (B) GSE104766, (C) GSE104310 and (D) GSE33294 was demonstrated as heatmap. (E–H) The t-SNE plot of tissue from (E) GSE159220, (F) GSE104766, (G) GSE104310 and (H) GSE33294 is shown. |
DEGs in GSE159220, GSE104766, GSE104310 and GSE33294 are shown in Figure 2A–D, respectively. For GSE159220, 534 up-regulated and 497 down-regulated genes were exracted. For GSE104766, 1756 up-regulated and 949 down-regulated genes were extracted. For GSE104310, 885 up-regulated and 563 down-regulated genes were extracted. For GSE33294, 1076 up-regulated and 1195 down-regulated genes were extracted (Figure 2A–D). Based on Venn diagram plot, 91 common up-regulated and 55 common down-regulated DEGs were identified among GSE159220, GSE104766, GSE104310 and GSE33294 (Figure 2E and F).
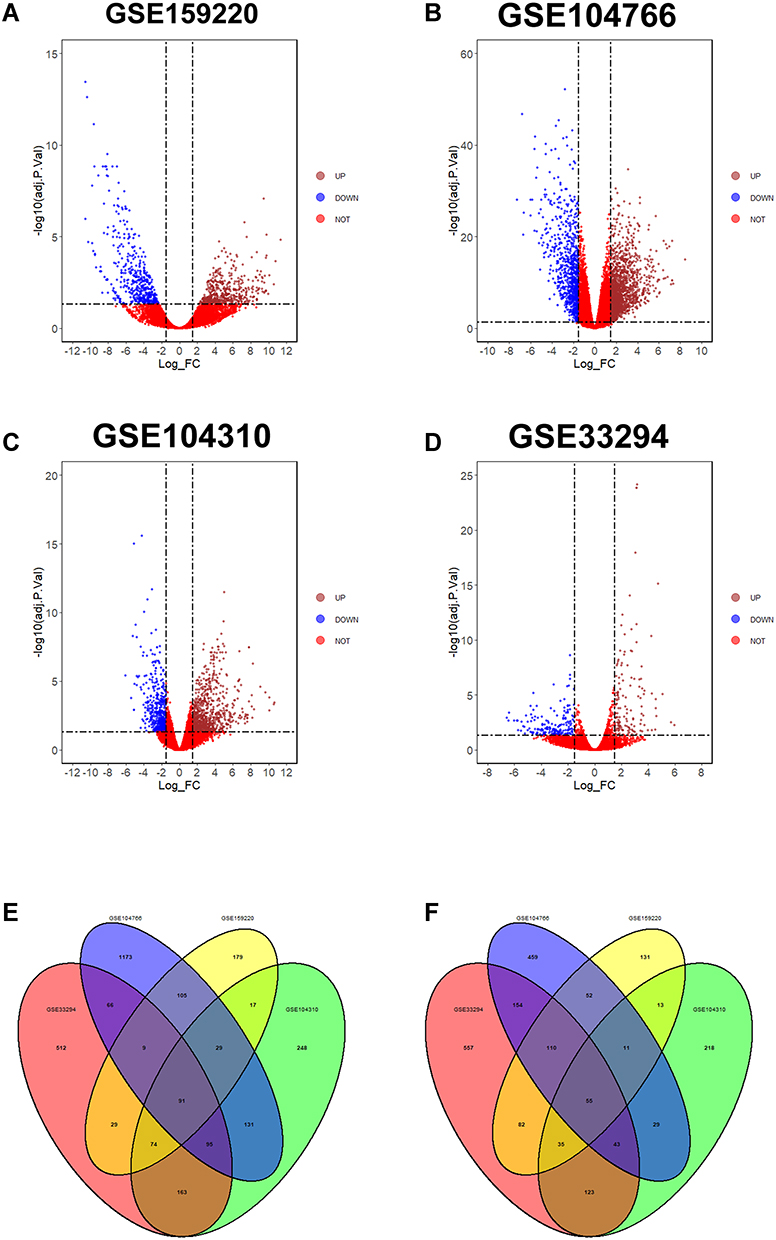 |
Figure 2 Volcano plot of DEGs and venn diagram plot of common DEGs. (A–D) The DEGs in GSE159220 (A), GSE104766 (B), GSE104310 (C) and GSE33294 (D) are presented as volcano plot. (E) Venn diagram of common up-regulated DEGs among GSE159220, GSE104766, GSE104310 and GSE33294. (F) Venn diagram of common down-regulated DEGs among GSE159220, GSE104766, GSE104310 and GSE33294. |
Functional Enrichment Analysis
In BP, common up-regulated DEGs were annotated in “collagen fibril organization”, “ear development”, “skeletal system development”, “extracellular matrix organization”, “extracellular structure organization”, “external encapsulating structure organization”, “inner ear development”, “sensory organ development”, “anatomical structure development”, “tissue development” and “system development” (Figure 3A); in CC, common up-regulated DEGs were annotated in “integral component of postsynaptic membrane”, “intrinsic component of postsynaptic membrane”, “extracellular matrix”, “external encapsulating structure”, “integral component of synaptic membrane”, “postsynaptic membrane”, “intrinsic component of synaptic membrane”, “collagen trimer”, “synaptic membrane”, “cell periphery”, etc (Figure 3B); in MF, common up-regulated DEGs were annotated in “extracellular matrix structural constituent”, “structural molecule activity” and “tensile strength” (Figure 3C). For KEGG pathway, common up-regulated DEGs were annotated in “protein digestion” and “ECM–receptor interaction” (Figure 3D). In Reactome, common up-regulated DEGs were annotated in “extracellular matrix organization”, “ECM proteoglycans”, “degradation of the extracellular matrix”, “collagen formation”, “collagen degradation”, “collagen chain trimerization”, “collagen biosynthesis”, “modifying enzymes” and “assembly collagen fibrils and other multimeric structures” (Figure 3E). In CC, common down-regulated DEGs were annotated in “integral component of plasma membrane” and “intrinsic component of plasma membrane” (Figure 3F). In MF, common down-regulated DEGs were annotated in “sulfur amino acid transmembrane transporter activity” (Figure 3G).
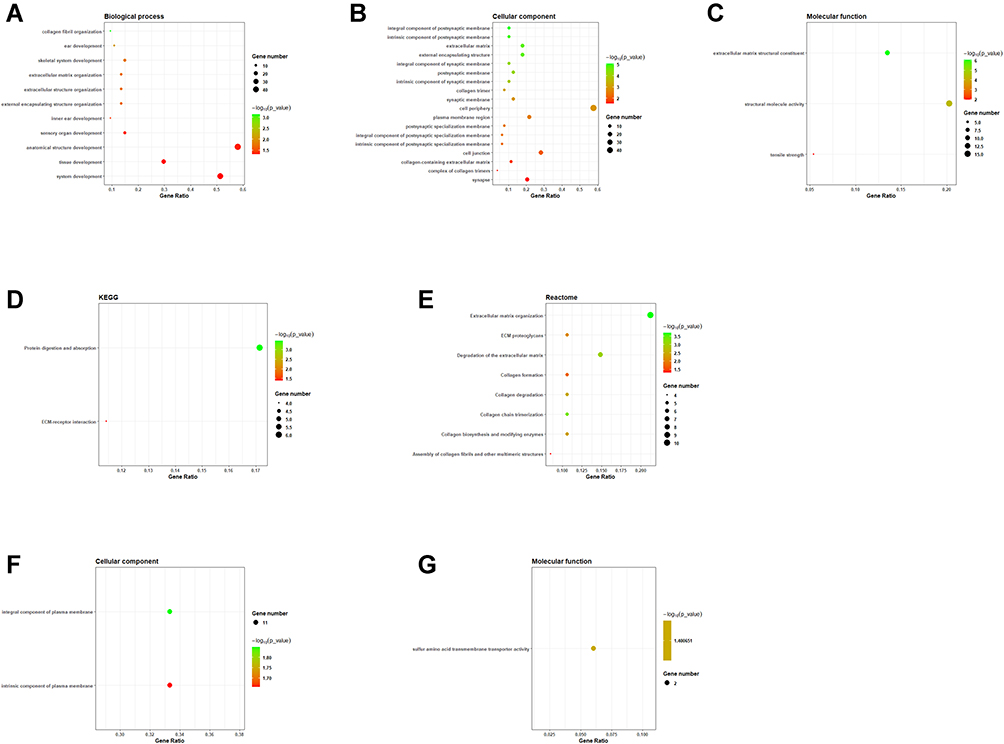 |
Figure 3 Functional annotation analysis of common DEGs. (A) The GO annotation of common up-regulated DEGs in biological process. (B) The GO annotation of common up-regulated DEGs in cellular component. (C) The GO annotation of common up-regulated DEGs in molecular function. (D) The KEGG pathway analysis of common up-regulated DEGs. (E) The reactome enrichment analysis of common up-regulated DEGs. (F) The GO annotation of common down-regulated DEGs in cellular component. (G) The GO annotation of common down-regulated DEGs in molecular function. |
Network Analysis of Common DEGs
Common DEGs were processed for PPI network analysis, and the results showed that 119 nodes and 66 edges (average node degree = 1.11) were detected in the constructed network (Supplemental Figure S2A). Further analysis using the Cytohubba mode identified 20 hub genes and detected 20 nodes and 24 edges in the network (Supplemental Figure S2B).
For the miRNA network analysis, a total of 92 miRNAs were found to be interacted with the common DEGs, and the analysis also revealed 214 nodes and 282 edges (Supplemental Figure S3).
Survival Analysis of Hub Genes
Based on the network extracted using Cytohubba, 20 hub genes were processed for survival analysis. High expression levels of COL2A1, COL22A1, HAPLN1, PTHLH and SOX2 showed positive correlation with shorter OS of HCC patients, while low expression levels of COL17A1, REN and TRH exhibited correlation with shorter OS of HCC patients. While, expression of other hub genes was not significantly correlated with OS of HCC patients (Figure 4).
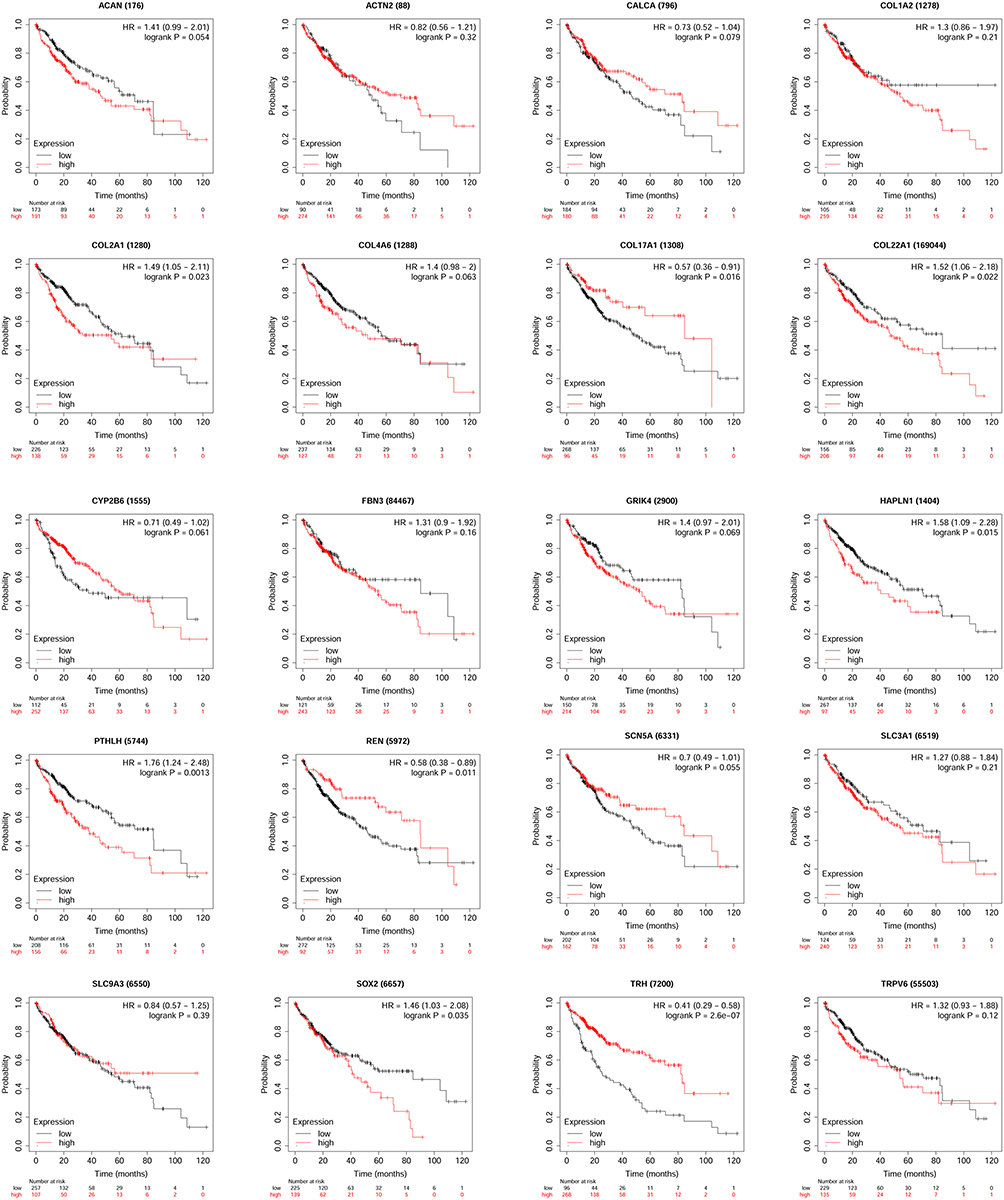 |
Figure 4 Correlatin between hub genes expression and overall survival of HCC patients was analyzed using the KM-plotter tool. |
To validate if COL22A1 is biomarker in HCC, we further performed an online bioinformatics analysis. Using the UALCAN database, we found that the expression of COL22A1 was up-regulated in HCC tissues compared to normal ones (Figure 5A), and the promoter methylation level of COL22A1 was significantly lower in the HCC tissues when compared to that in the normal liver tissues (Figure 5B). Consistently, COL22A1 overexpression showed positive correlation with shorter OS of HCC patients (Figure 5C).
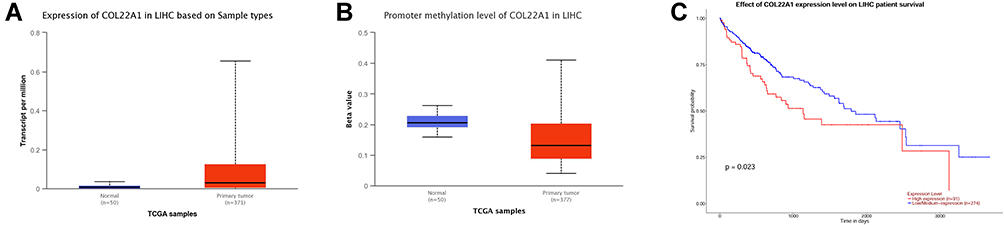 |
Figure 5 COL22A1 expression and the prognosis of COL22A1 was analyzed using the UALCAN tool. (A) COL22A1 expression in HCC tissues and normal ones from TCGA samples is shown. (B) The promoter methylation level of COL22A1 in HCC tissues and normal ones from TCGA samples is shown. (C) Correlation between COL22A1 expression and OS of HCC patients is analyzed based on TCGA database. |
MiRNA-COL22A1 network analysis revealed that COL22A1 can be targeted 7 miRNAs including miR-26b-5p, miR-29c-3p, miR-29a-3p, miR-29b-3p, miR-1297, miR-26a-5p and miR-1270 (Table 1).
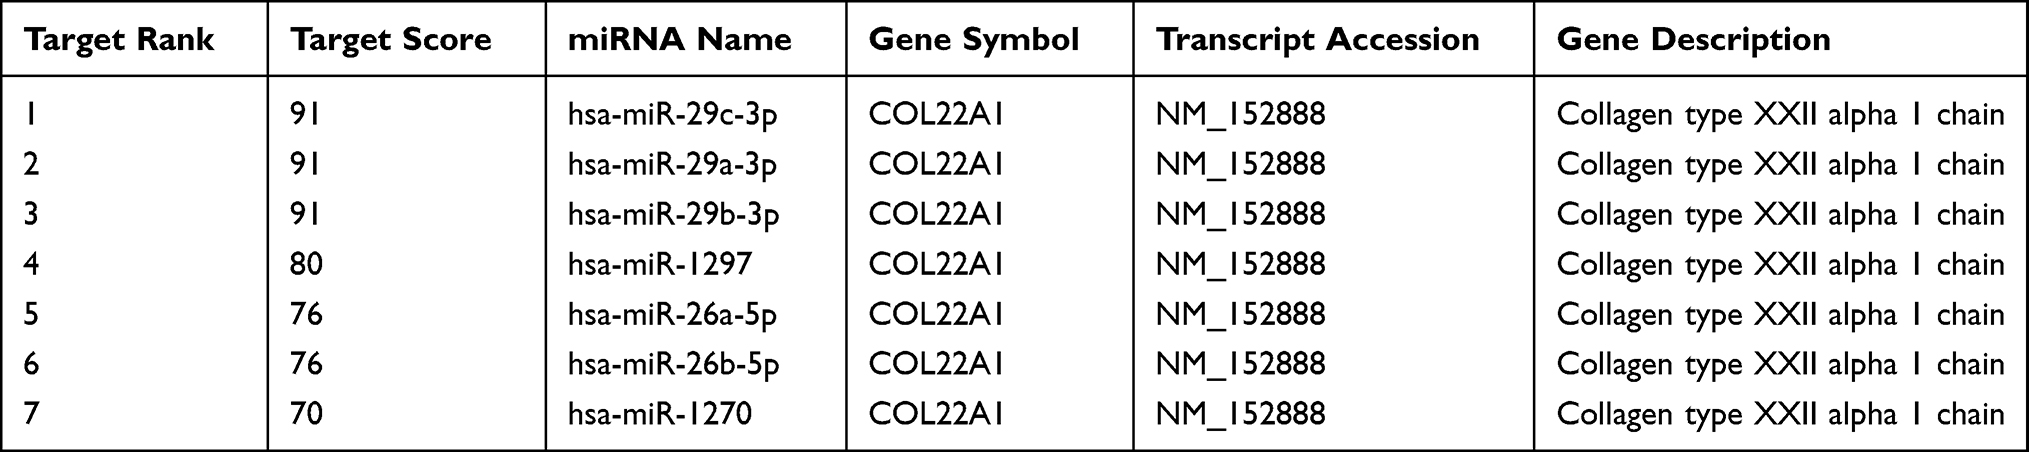 |
Table 1 The miRNAs That Target COL22A1 as Predicted by miRDB |
Actions of COL22A1 Silencing on the HCC Cell Invasion, Migration and EMT
In the functional studies, we firstly transfected the HCC cells (HepG and Huh7) with COL22A1 siRNA or the corresponding scrambled siRNA for COL22A1 (NC siRNA), and validation assays were performed to determine actionsof COL22A1 knockdown on the HCC cell invasion, migration and EMT. The qRT-PCR showed that COL22A1 siRNA transfection down-regulated COL22A1 expression in HepG2 and Huh7 cells when compared to that transfected with NC siRNA (Figure 6A and B). Transwell invasion results showed that COL22A1 siRNA transfection decreased invaded cell number of HepG2 and Huh7 cells comparing to that transfected with NC siRNA (Figure 6C and D). The wound healing assay was employed to evaluate the migratory potential of HCC cells, and COL22A1 knockdown significantly decreased the wound healing capacity of HepG2 and Huh7 cells comparing to NC siRNA group (Figure 6E and F). EMT-related mediators expression was assessed with qRT-PCR. COL22A1 silence up-regulated E-cadherin expression and down-regulated the expression of N-cadherin and vimentin in both HepG2 and Huh7 cells when compared to NC siRNA group (Figure 6G and H).
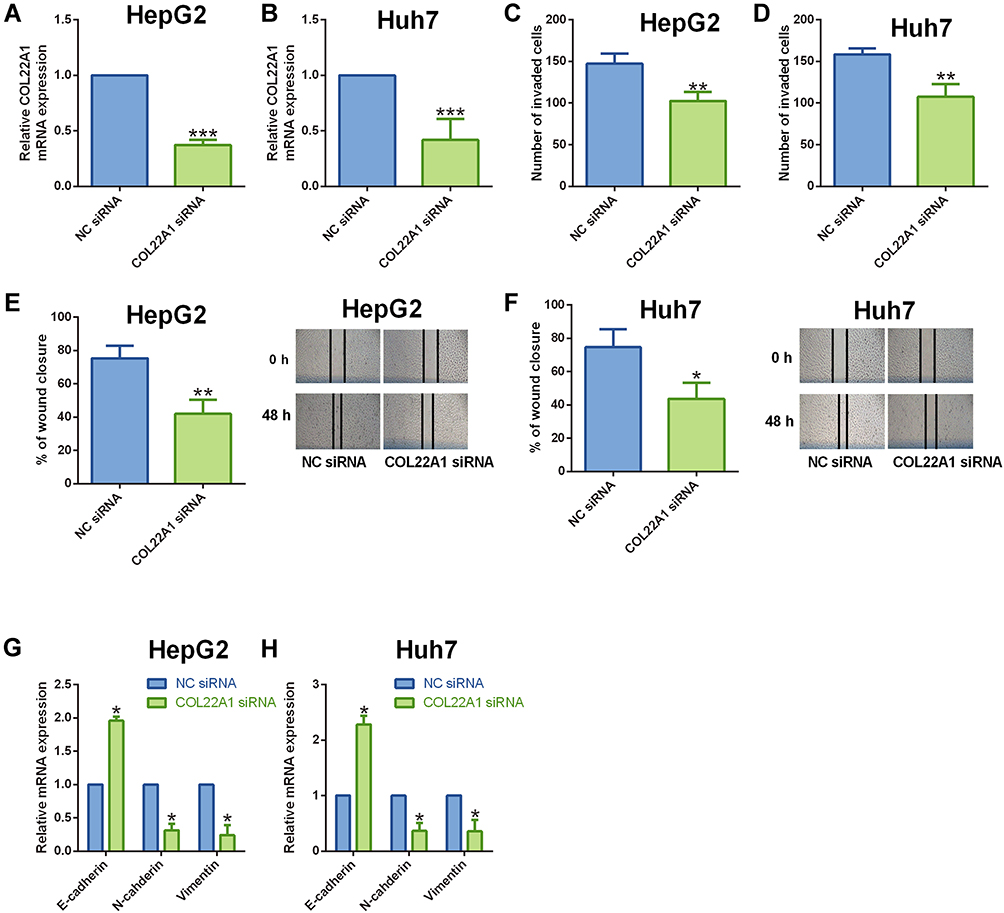 |
Figure 6 Knockdown of COL22A1 suppressed HCC cell invasion, migration and EMT. (A and B) COL22A1 expression in (A) HepG2 and (B) Huh7 cells after being transfected with NC siRNA or COL22A1 siRNA were determined by qRT-PCR. (C and D) The invasive capacity of (C) HepG2 and (D) Huh7 cells after being transfected with NC siRNA or COL22A1 siRNA was determined by cell invasion assay. (E and F) The migratory capacity of (E) HepG2 and (F) Huh7 cells after being transfected with NC siRNA or COL22A1 siRNA was shown. (G and H) E-cadherin, N-cadherin and vimentin expression in (G) HepG2 and (H) Huh7 cells after being transfected with NC siRNA or COL22A1 siRNA were shown. N = 3. *P<0.05, **P<0.01 and ***P<0.001. |
Discussion
HCC represents a type of malignant solid tumor, while the molecular mechanisms underlying HCC pathophysiology remain unclear.15 With great progress in high throughput biotechnology and bioinformatics analysis, more and more novel biomarkers in HCC have been screened. In this work, we carried out bioinformatics analysis on the GEO datasets including GSE159220, GSE104766, GSE104310 and GSE33294 and identified 91 common up-regulated and 55 common down-regulated DEGs. In addition, functional annotation analysis revealed that these common DEGs may be correlated with the extracellular matrix. The PPI analysis further revealed 20 hub genes. Among these hub genes, high expression levels of COL2A1, COL22A1, HAPLN1, PTHLH and SOX2 showed positive correlation with shorter OS of HCC patients, while low expression levels of COL17A1, REN and TRH exhibited correlation with shorter OS of HCC patients. While other hub genes was not significantly correlated with OS of HCC patients. Furthermore, the COL22A1 was up-regulated in the HCC tissues comparing to normal ones, and the promoter methylation level of COL22A1 was significantly lower in the HCC tissues when compared to that in the normal liver tissues. The validation assays indicated that COL22A1 silencing suppressed HCC cell invasion, migration and EMT. Collectively, this work identified several hub genes closely correlated with HCC pathogenesis, and COL22A1 may be involved in the HCC metastasis, but this still requires further mechanistic studies.
The RNA-sequencing has been a powerful tool for screening potential biomarkers associated with HCC progression. In GSE159220, the researchers aimed to perform the analysis of circular RNA expression profiles of HCC tissues and normal ones. In GSE104766, RNA sequencing of 25 tumors and matched normal ones sheded new insights into mechanisms of liver cancer.16 In GSE104310, studies investigated biomarkers in the malignant process of HCC, and proposed taht miR-4644 may be used for miRNA normalization in HCC.17 In GSE33294, studies highlighted importance of differentially expressed ADARs in tumours.18 In our results, we combined these four datasets and revealed a total of 91 common up-regulated DEGs and 55 common down-regulated DEGs, which have been suggested to be associated with the extracellular matrix based on the functional annotation analysis.
We furtheranalyzed the association between hub genes expression and OS of HCC patients. High expression levels of COL2A1, COL22A1, HAPLN1, PTHLH and SOX2 exhibited positive correlation with shorter OS of HCC patients ; while low expression levels of COL17A1, REN and TRH showed correlation with shorter OS of HCC patients. COL22A1 has been identified as a key component in extracellular matrix, which is in agreement with functional annotation analysis showing that the DEGs are correlated with extracellular complex. Our study further showed that COL22A1 overexpression showed correlation with shorter OS of HCC patients. However, the role of COL22A1 has not yet been determined in HCC. COL22A1 overexpression showed correlation with a high risk of head and neck cancer recurrence.19 Studies also demonstrated that COL22A1 served as prognostic marker for survival prediction in patients with lung squamous cell carcinoma.20 The in vitro functional studies demonstrated that COL22A1 silence suppressed HCC cell invasion, migration and EMT. Collectively, these results suggest that COL22A1 may act as an oncogene in HCC development. Based on the miRNAs-COL22A1 network, we found that that several miRNAs including miR-26b-5p, miR-29c-3p, miR-29a-3p, miR-29b-3p, miR-1297, miR-26a-5p and miR-1270 could directly target COL22A1. Studies have found that these miRNAs exert tumor-suppressive actions in HCC.21–27 However, how these miRNAs affect the expression of COL22A1 in HCC still requires further examination.
Conclusions
Collectively, this work carried out comphrehensive bioinformatics analysis and extracted several hub genes that exhibited prognostic values with HCC patients. Functional analysis revealed a novel functional role of COL22A1 signaling in the pathophysiology of HCC.
Data Sharing Statement
All the data are available from the corresponding author.
Ethics Statement
The Ethics Committee of Shenzhen Hospital of Traditional Chinese Medicine has waived the Ethics approval, as this study only uses the human data from the public microarray datasets.
Funding
There is no funding to report.
Disclosure
None of the authors declared any conflict of interest.
References
1. Clark T, Maximin S, Meier J, Pokharel S, Bhargava P. Hepatocellular carcinoma: review of epidemiology, screening, imaging diagnosis, response assessment, and treatment. Curr Probl Diagn Radiol. 2015;44(6):479–486. doi:10.1067/j.cpradiol.2015.04.004
2. Llovet JM, Montal R, Sia D, Finn RS. Molecular therapies and precision medicine for hepatocellular carcinoma. Nat Rev Clin Oncol. 2018;15(10):599–616. doi:10.1038/s41571-018-0073-4
3. Xia S, Pan Y, Liang Y, Xu J, Cai X. The microenvironmental and metabolic aspects of sorafenib resistance in hepatocellular carcinoma. EBioMedicine. 2020;51:102610. doi:10.1016/j.ebiom.2019.102610
4. Huang X, Liu S, Wu L, Jiang M, Hou Y. High throughput single cell RNA sequencing, bioinformatics analysis and applications. Adv Exp Med Biol. 2018;1068:33–43.
5. Rego SM, Snyder MP. High throughput sequencing and assessing disease risk. Cold Spring Harb Perspect Med. 2019;9(1). doi:10.1101/cshperspect.a026849
6. Reuter JA, Spacek DV, Snyder MP. High-throughput sequencing technologies. Mol Cell. 2015;58(4):586–597. doi:10.1016/j.molcel.2015.05.004
7. Zheng C, Zheng L, Yoo JK, et al. Landscape of infiltrating T cells in liver cancer revealed by single-cell sequencing. Cell. 2017;169(7):1342–1356.e1316. doi:10.1016/j.cell.2017.05.035
8. Chen H, Gao F, He M, et al. Long-read RNA sequencing identifies alternative splice variants in hepatocellular carcinoma and tumor-specific isoforms. Hepatology. 2019;70(3):1011–1025. doi:10.1002/hep.30500
9. Hu ZQ, Zhou SL, Li J, et al. Circular RNA sequencing identifies CircASAP1 as a key regulator in hepatocellular carcinoma metastasis. Hepatology. 2020;72(3):906–922. doi:10.1002/hep.31068
10. Zhang C, Peng L, Zhang Y, et al. The identification of key genes and pathways in hepatocellular carcinoma by bioinformatics analysis of high-throughput data. Med Oncol. 2017;34(6):101. doi:10.1007/s12032-017-0963-9
11. Xiong DD, Dang YW, Lin P, et al. A circRNA-miRNA-mRNA network identification for exploring underlying pathogenesis and therapy strategy of hepatocellular carcinoma. J Transl Med. 2018;16(1):220. doi:10.1186/s12967-018-1593-5
12. Lou W, Liu J, Ding B, et al. Identification of potential miRNA-mRNA regulatory network contributing to pathogenesis of HBV-related HCC. J Transl Med. 2019;17(1):7. doi:10.1186/s12967-018-1761-7
13. Tomczak A, Mortensen JM, Winnenburg R, et al. Interpretation of biological experiments changes with evolution of the Gene Ontology and its annotations. Sci Rep. 2018;8(1):5115. doi:10.1038/s41598-018-23395-2
14. Uphoff CC, Drexler HG. Detection of mycoplasma in leukemia-lymphoma cell lines using polymerase chain reaction. Leukemia. 2002;16(2):289–293. doi:10.1038/sj.leu.2402365
15. Schlachterman A, Craft WW, Hilgenfeldt E, Mitra A, Cabrera R. Current and future treatments for hepatocellular carcinoma. World J Gastroenterol. 2015;21(28):8478–8491. doi:10.3748/wjg.v21.i28.8478
16. Hooks KB, Audoux J, Fazli H, et al. New insights into diagnosis and therapeutic options for proliferative hepatoblastoma. Hepatology. 2018;68(1):89–102. doi:10.1002/hep.29672
17. Zhao J, Zhu XC, Wu XS, et al. Identification of miR-4644 as a suitable endogenous normalizer for circulating miRNA quantification in hepatocellular carcinoma. J Cancer. 2020;11(23):7032–7044. doi:10.7150/jca.48903
18. Chan TH, Lin CH, Qi L, et al. A disrupted RNA editing balance mediated by ADARs (Adenosine DeAminases that act on RNA) in human hepatocellular carcinoma. Gut. 2014;63(5):832–843. doi:10.1136/gutjnl-2012-304037
19. Misawa K, Kanazawa T, Imai A, et al. Prognostic value of type XXII and XXIV collagen mRNA expression in head and neck cancer patients. Mol Clin Oncol. 2014;2(2):285–291. doi:10.3892/mco.2013.233
20. Ma H, Tong L, Zhang Q, Chang W, Li F. Identification of 5 gene signatures in survival prediction for patients with lung squamous cell carcinoma based on integrated multiomics data analysis. Biomed Res Int. 2020;2020:6427483. doi:10.1155/2020/6427483
21. Guo T, Wang H, Liu P, et al. SNHG6 acts as a genome-wide hypomethylation trigger via coupling of miR-1297-mediated S-adenosylmethionine-dependent positive feedback loops. Cancer Res. 2018;78(14):3849–3864. doi:10.1158/0008-5472.CAN-17-3833
22. Cao Y, Tao Q, Kao X, Zhu X. Hsa-circRNA-103809 promotes hepatocellular carcinoma development via microRNA-1270/PLAG1 like zinc finger 2 axis. Dig Dis Sci. 2021;66(5):1524–1532. doi:10.1007/s10620-020-06416-x
23. Yuan YL, Yu H, Mu SM, Dong YD, Li Y. MiR-26a-5p inhibits cell proliferation and enhances doxorubicin sensitivity in HCC cells via targeting AURKA. Technol Cancer Res Treat. 2019;18:1533033819851833. doi:10.1177/1533033819851833
24. Hu X, Wang R, Ren Z, et al. MiR-26b suppresses hepatocellular carcinoma development by negatively regulating ZNRD1 and Wnt/β-catenin signaling. Cancer Med. 2019;8(17):7359–7371. doi:10.1002/cam4.2613
25. Wu H, Zhang W, Wu Z, et al. miR-29c-3p regulates DNMT3B and LATS1 methylation to inhibit tumor progression in hepatocellular carcinoma. Cell Death Dis. 2019;10(2):48. doi:10.1038/s41419-018-1281-7
26. Fang JH, Zhou HC, Zeng C, et al. MicroRNA-29b suppresses tumor angiogenesis, invasion, and metastasis by regulating matrix metalloproteinase 2 expression. Hepatology. 2011;54(5):1729–1740. doi:10.1002/hep.24577
27. Mahati S, Xiao L, Yang Y, Mao R, Bao Y. miR-29a suppresses growth and migration of hepatocellular carcinoma by regulating CLDN1. Biochem Biophys Res Commun. 2017;486(3):732–737. doi:10.1016/j.bbrc.2017.03.110
 © 2022 The Author(s). This work is published and licensed by Dove Medical Press Limited. The full terms of this license are available at https://www.dovepress.com/terms.php and incorporate the Creative Commons Attribution - Non Commercial (unported, v3.0) License.
By accessing the work you hereby accept the Terms. Non-commercial uses of the work are permitted without any further permission from Dove Medical Press Limited, provided the work is properly attributed. For permission for commercial use of this work, please see paragraphs 4.2 and 5 of our Terms.
© 2022 The Author(s). This work is published and licensed by Dove Medical Press Limited. The full terms of this license are available at https://www.dovepress.com/terms.php and incorporate the Creative Commons Attribution - Non Commercial (unported, v3.0) License.
By accessing the work you hereby accept the Terms. Non-commercial uses of the work are permitted without any further permission from Dove Medical Press Limited, provided the work is properly attributed. For permission for commercial use of this work, please see paragraphs 4.2 and 5 of our Terms.