Back to Journals » Diabetes, Metabolic Syndrome and Obesity » Volume 13
The Relationship Between Vitamin D Deficiency and Glycated Hemoglobin Levels in Patients with Type 2 Diabetes Mellitus
Authors Zhao H, Zhen Y ![]() , Wang Z, Qi L
, Wang Z, Qi L ![]() , Li Y, Ren L, Chen S
, Li Y, Ren L, Chen S
Received 5 August 2020
Accepted for publication 11 September 2020
Published 21 October 2020 Volume 2020:13 Pages 3899—3907
DOI https://doi.org/10.2147/DMSO.S275673
Checked for plagiarism Yes
Review by Single anonymous peer review
Peer reviewer comments 2
Editor who approved publication: Dr Konstantinos Tziomalos
Hang Zhao,1 Yunfeng Zhen,1 Zijing Wang,1 Licui Qi,2 Yong Li,3 Luping Ren,1,* Shuchun Chen1,*
1Endocrinology Department, Hebei General Hospital, Shijiazhuang, Hebei 050051, People’s Republic of China; 2Graduate School of Hebei North University, Zhangjiakou, Hebei 07500, People’s Republic of China; 3Graduate School of North China University of Science and Technology, Caofeidian New Town, Tangshan, Hebei 063210, People’s Republic of China
*These authors contributed equally to this work
Correspondence: Shuchun Chen
Endocrinology Department, Hebei General Hospital, 348, Heping West Road, Shijiazhuang, Hebei 050051, People’s Republic of China
Email [email protected]
Luping Ren
Endocrinology Department, Hebei General Hospital, 348, Heping West Road, Shijiazhuang, Hebei 050051, People’s Republic of China
Email [email protected]
Purpose: The aims of this study were to determine the relationship between 25-hydroxyvitamin D [25(OH) D] and glycated hemoglobin (HbA1c) levels in male and female patients with type 2 diabetes mellitus (T2DM).
Patients and Methods: The participants were adults diagnosed with T2DM recruited from Hebei General Hospital. Patient information and information regarding blood indicators were collected. The subjects were divided into no vitamin D deficiency group [25(OH) D > 20 ng/mL] and vitamin D deficiency group [25(OH) D < 20 ng/mL], and these groups were then further subdivided into male-only or female-only subgroups. And then, the subjects were divided into male group and female group in different 25(OH) D levels.
Results: HbA1c levels in the vitamin D deficiency group were significantly higher than those in the no vitamin D deficiency group for all subjects. The same was true for female patients but not for male patients. There was no difference in HbA1c levels between male and female patients with T2DM, regardless of 25(OH) D deficiency. A negative correlation existed between 25(OH) D and HbA1c in all subjects, as well as in the male-only and female-only subgroups. Vitamin D deficiency was associated with high HbA1c levels before and after adjusting for confounding factors in all participants and in the female-only subgroup, but not in the male-only subgroup.
Conclusion: This study confirmed that vitamin D deficiency was related with high HbA1c levels in patients with T2DM, and this relationship differs between female and male patients.
Keywords: diabetes mellitus, type 2, 25-hydroxyvitamin D, glycated hemoglobin
Introduction
Vitamin D deficiency is common worldwide. Vitamin D has attracted increasing attention in recent decades. It not only regulates calcium homeostasis and bone health,1 but also relates to many chronic diseases such as metabolic syndrome (MetS),2 type 2 diabetes mellitus (T2DM),3 cardiovascular disease,4 cancer,5 and dementia.6 Vitamin D deficiency is generally defined as having a serum 25 hydroxyvitamin D [25(OH) D] level <20 ng/mL (50 nmol/L), and severe deficiency is defined as 25(OH) D <10 ng/mL (25 nmol/L).
The high incidence of diabetes mellitus (DM) has resulted in a substantial economic and social burden worldwide. Preventing and treating DM has become a top public health priority in many countries. Studies have shown that low levels of 25(OH) D are associated with an increased incidence of MetS7 and DM.8 A meta-analysis performed by Song9 indicated that the risk of developing T2DM decreases by 4% with each 10 nmol/L increase in 25(OH) D. Alvarez10 reported a negative correlation between 25(OH) D levels and homeostasis model assessment-insulin resistance index. Furthermore, the United States National Health and Nutrition Examination Survey reported an inverse relationship between 25(OH) D and glycated hemoglobin (HbA1c) levels in individuals aged 35–74 with no history of DM.11
However, it is unclear whether the relationship between 25(OH) D and HbA1c varies between male and female patients with T2DM, and whether 25(OH) D deficiency is an independent risk factor for high HbA1c levels. The aim of this study was to address these two questions.
Patients and Methods
Study Design
This was a cross-sectional study. The Clinical Trial Registry Number is ChiCTR2000029391 (http://www.chictr.org.cn/enIndex.aspx), and the study was conducted in accordance with the Declaration of Helsinki and approved by the Hebei General Hospital Ethics Committee.
Participants Recruitment
Patients hospitalized in Department of Endocrinology in Hebei General Hospital (Shijiazhuang, China) were recruited from June 2018 to December 2019. The researchers explained the study purpose and procedure to the recruited patients. Each patient signed an informed consent form. The recruitment was carried out by two researchers according to the inclusion and exclusion criteria.
Inclusion Criteria
I. Age ≥ 18 years old.
II. Diagnosis of T2DM according to World Health Organization criteria.
III. No acute diabetic complications (diabetic ketoacidosis, hyperglycemic hyperosmolar syndrome, or hypoglycemia) in the past 3 months.
Exclusion Criteria
I. Other types of diabetes (for example type 1 diabetes, gestational diabetes).
II. A history of myocardial infarction/cerebral hemorrhage in past 3 months.
III. Secondary OP such as hyperthyroidism, hyperparathyroidism, or kidney disease.
IV. Use of oral medications and supplements (vitamin D, bisphosphonates, or others) that may have affected bone metabolism in the past 6 months.
V. Pregnant women.
Information and Data Collection
We administrated a questionnaire to each participant to collect basic information including recorded sex, age, DM disease course, family history of DM (for three generations), tobacco use (defined as smoking regularly for ≥6 months with a cumulative total of ≥1 cigarette per day), alcohol use (defined as continuous drinking ≥6 months with a cumulative average daily consumption of ≥50 g [converted into liquor]), history of hypertension and history of gastrointestinal disease. Body mass index (BMI) was calculated by measuring height and weight twice and calculating the average values. All participants were fasted overnight, and the blood was drawn in the next morning. All patients’ blood indicators were tested in the same laboratory. Blood indicators included HbA1c, albumin, urea nitrogen (BUN), creatinine (Cr), total cholesterol (TC), triglycerides (TG), high-density lipoprotein-cholesterol (HDL-C), low-density lipoprotein-cholesterol (LDL-C), very-low-density lipoprotein-cholesterol (VLDL-C), apolipoprotein A1 (ApoA1), apolipoprotein B (ApoB), 25(OH) D, OC (osteocalcin), β-C-terminal cross-linked telopeptide of type I collagen (β-CTX), procollagen type 1 N-terminal propeptide (P1NP), and parathyroid hormone (PTH). The data were entered into an Excel spreadsheet and checked by two researchers.
Statistical Analysis
The statistical analysis will be performed using SPSS 22.0. Comparisons were performed between the following groups: (1) no vitamin D deficiency [25(OH) D >20 ng/mL] and vitamin D deficiency [25(OH) D <20ng/mL] for all participants; (2) no vitamin D deficiency and vitamin D deficiency male participants; (3) no vitamin D deficiency and vitamin D deficiency female participants; (4) male and female 25(OH) D-deficient patients with T2DM; (5) male and female patients with T2DM and no 25(OH) D deficiency. If the data for continuous variables conformed to a normal distribution, they were expressed as mean±SD, and independent t-tests were used to compare the groups; if the data did not conform normal distribution, they were expressed as median values (P25, P75) and non-parametric tests were used to compare the groups. For categorical variables, data were expressed as numbers (percentages), and Chi-square tests were performed to compare groups. A P-value <0.05 was considered significant. Linear correlation analysis was performed to determine the relationship between 25(OH) D and HbA1c. Based on the results from these three comparisons, variables with a P-value <0.1 were selected. The linear regression analysis was performed to determine whether 25(OH) D levels affect HbA1c levels based on three different models (model 1: crude model; model 2: adjusted for some variables; model 3: adjusted for all variables).
Results
The Cohort Characteristics in the Study
There were 238 participants aged 54.9±11.6 years old including 81 females (34.0%). The average HbA1c was 8.9% (7.4, 10.6) and BMI was (25.97±3.41) kg/m2. 31.9% had DM course >10 years. 37.4% had history of DM, 44.5% had hypertension, 11.3% had gastrointestinal disorders. The other indicators are shown in Table 1.
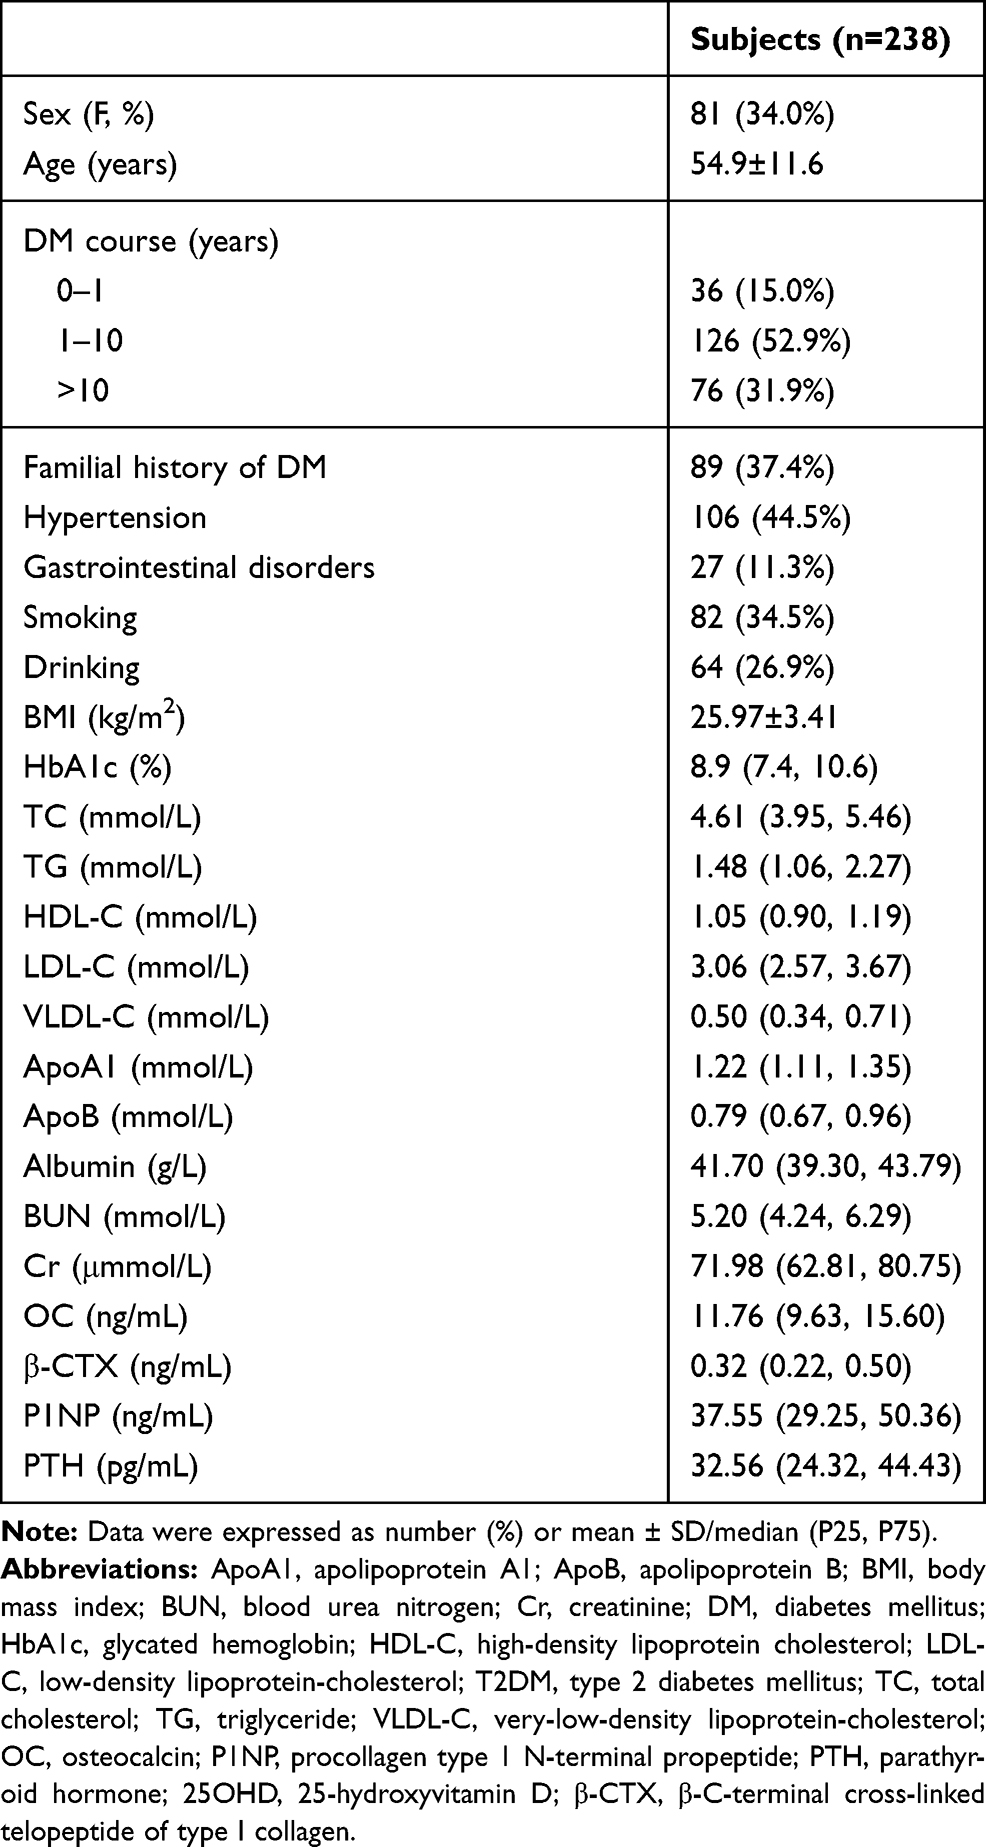 |
Table 1 The Cohort Characteristics in This Study |
Clinical Characteristics of Patients with T2DM with and without Vitamin D Deficiency
Compared with the no vitamin D deficiency group (22.5%), the proportion of women (40.9%) in the vitamin D deficiency group was higher, while the proportion of patients with hypertension was lower (39.6% vs 52.8%). The HbA1c [9.3 (7.8, 10.7)% vs 8.2 (6.8, 10.3)%] (Figure 1A) and TG [1.55 (1.06, 2.43) mmol/L vs 1.43 (0.94, 1.73) mmol/L] levels were significantly higher in the vitamin D deficiency group than those in the no vitamin D deficiency group. Compared with the no vitamin D deficiency group, levels of the bone metabolism markers OC [11.16 (9.38, 14.26) ng/mL vs 12.08 (9.80, 16.51) ng/mL] and P1NP [35.85 (28.26, 44.22) ng/mL vs 39.30 (29.53, 52.18) ng/mL] were significantly reduced in the vitamin D deficiency group. Cr levels showed the same trend (Table 2).
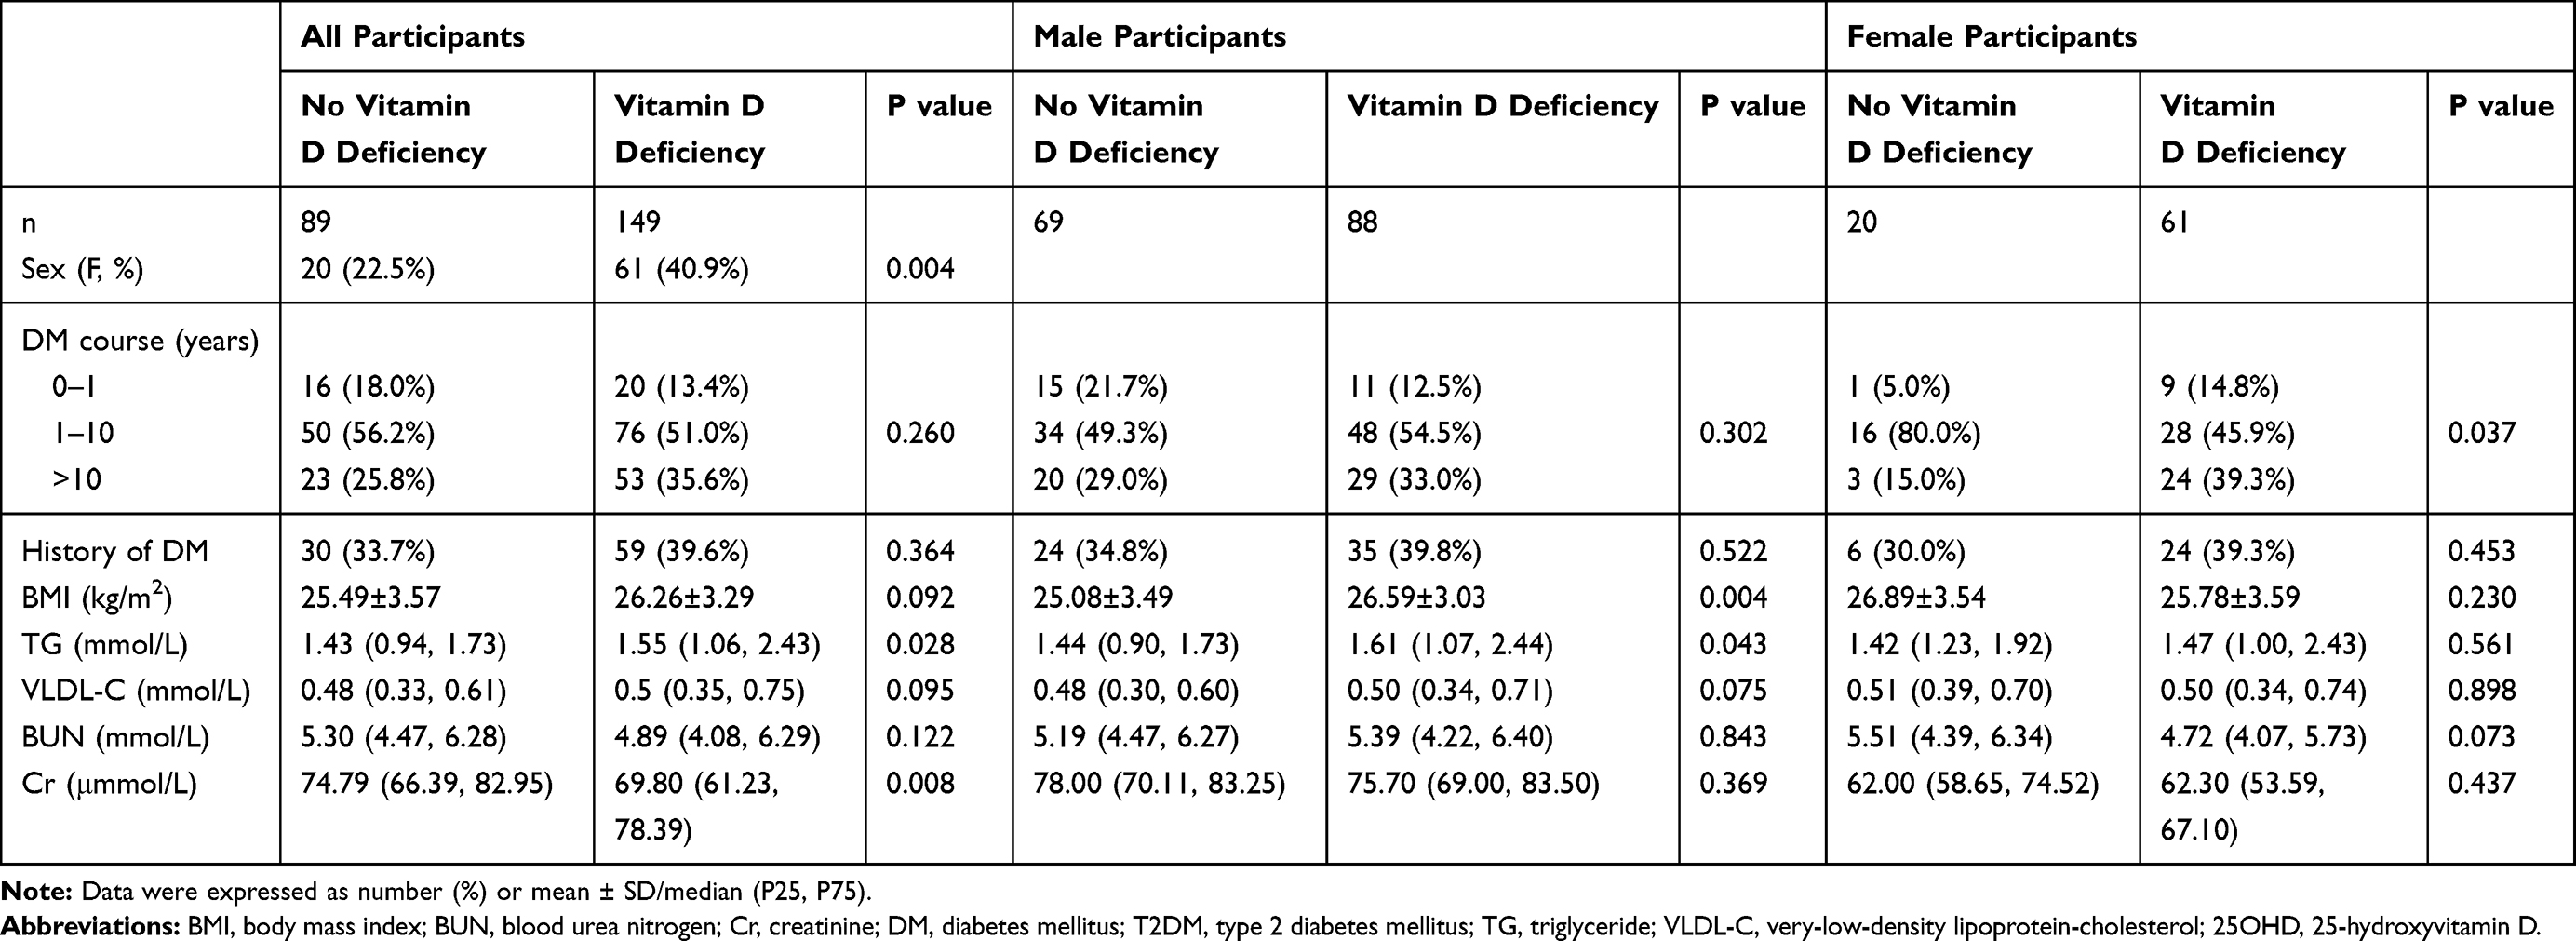 |
Table 2 Clinical Characteristics of Patients with T2DM by 25OHD Category |
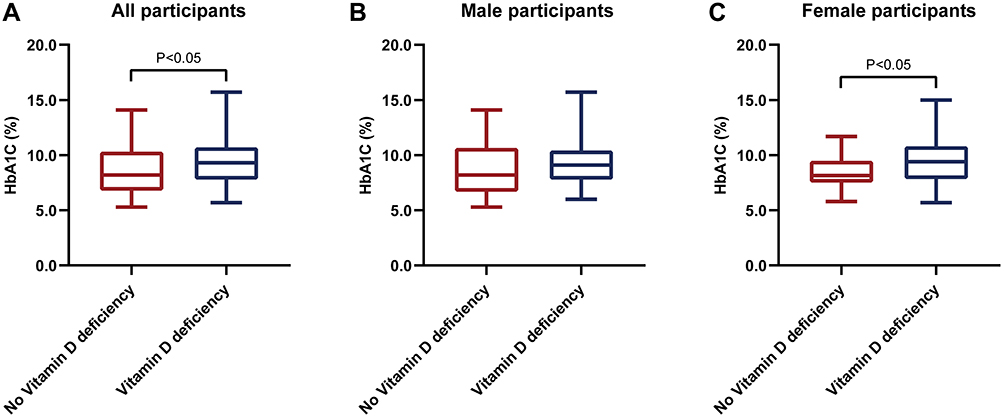 |
Figure 1 (A) Comparisons of glycated hemoglobin in No vitamin deficiency group and Vitamin D deficiency group in all participants with type 2 diabetes mellitus. (B) Comparisons of glycated hemoglobin in No vitamin deficiency group and Vitamin D deficiency group in male participants with type 2 diabetes mellitus. (C) Comparisons of glycated hemoglobin in No vitamin deficiency group and Vitamin D deficiency group in female participants with type 2 diabetes mellitus. |
Clinical Characteristics of Male and Female Patients with T2DM
The BMI of male patients in the vitamin D deficiency group was significantly higher than that of male patients in the no vitamin D deficiency group (26.59 ± 3.03 kg/m2 vs 25.08 ± 3.49 kg/m2). This was also true for TG levels [1.61 (1.07, 2.44) mmol/L vs 1.44 (0.90, 1.73) mmol/L], but there was no significant difference in HbA1c levels between the two groups of male patients (Table 2, Figure 1B).
In female patients, HbA1c levels were significantly decreased in the no vitamin D deficiency group compared with the vitamin D deficiency group (9.5 ± 2.0% vs 8.4 ± 1.6%). In addition, the DM disease course differed between groups (Table 2, Figure 1C).
Clinical Characteristics of Patients with T2DM and Different Vitamin D Levels
Compared with 25(OH) D-deficient female patients, 25(OH) D-deficient male patients exhibited significantly higher rates of smoking (52.3% vs 1.7%) and drinking (43.2% vs 1.6%), and were significantly younger (51.9 ± 11.8 years vs 58.1 ± 11.3 years). In addition, male patients in these groups exhibited significantly lower HDL-C [0.98 (0.88, 1.13) mmol/L vs 1.14 (1.02, 1.24) mmol/L] and ApoA1 [1.17 (1.07, 1.32) mmol/L vs 1.31 (1.21, 1.49) mmol/L] levels. As expected, BUN and Cr levels were significantly higher in 25(OH) D-deficient female patients compared with 25(OH) D-deficient male patients. There was no difference in HbA1c levels between these two groups (Table 3, Figure 2A).
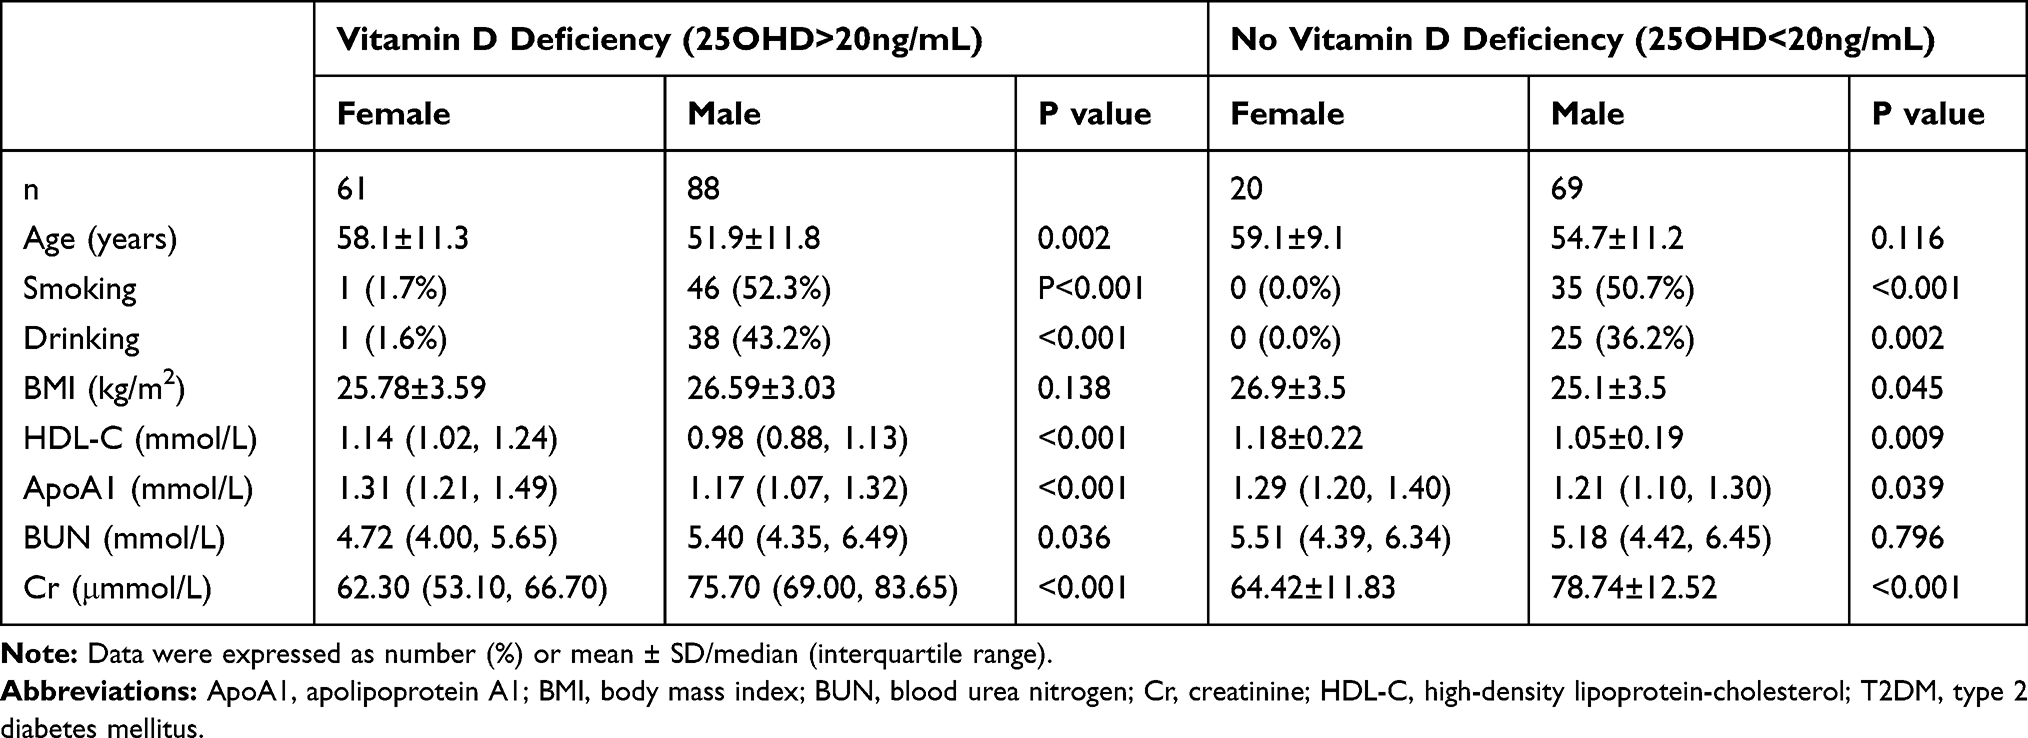 |
Table 3 Clinical Characteristics of Patients with T2DM by Sex Category |
 |
Figure 2 (A) Comparisons of glycated hemoglobin in female group and male group in participants with type 2 diabetes mellitus and vitamin D deficiency. (B) Comparisons of glycated hemoglobin in female group and male group in participants with type 2 diabetes mellitus and without vitamin D deficiency. |
Compared with female patients with no vitamin D deficiency, male patients with no vitamin D deficiency exhibited significantly higher rates of smoking and drinking and significantly greater BMI (25.1 ± 3.5 kg/m2 vs 26.9 ± 3.5 kg/m2). In addition, male patients in this group exhibited significantly lower HDL-C (1.05 ± 0.19mmol/L vs 1.18 ± 0.22 mmol/L) and ApoA1 [1.21 (1.10, 1.30) mmol/L vs 1.29 (1.20, 1.40) mmol/L] levels, but significantly higher Cr levels than female patients in this group. There was no significant difference in HbA1c levels between male and female patients with no vitamin D deficiency (Table 3, Figure 2B).
Correlation Between 25(OH) D and HbA1c Levels
The correlation analysis between 25(OH) D and HbA1c levels yielded values of r = −0.254 and P <0.001 for all subjects; r = −0.221 and P = 0.005 for male subjects; and r = −0.313 and P = 0.004 for female subjects (Figure 3A–C).
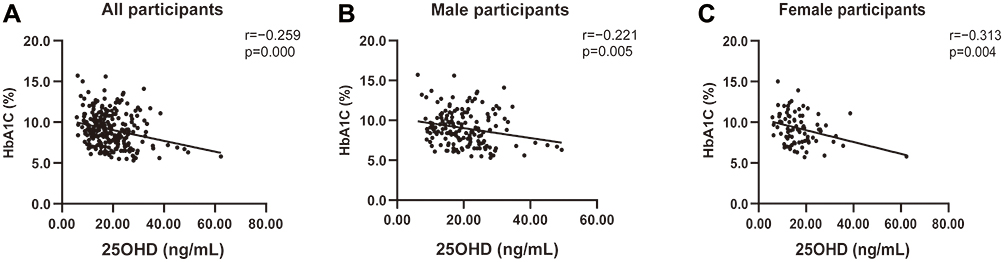 |
Figure 3 (A) Linear correlation of glycated hemoglobin and 25-hydroxyvitamin D in all participants with type 2 diabetes mellitus. (B) Linear correlation of glycated hemoglobin and 25-hydroxyvitamin D in male participants with type 2 diabetes mellitus. (C) Linear correlation of glycated hemoglobin and 25-hydroxyvitamin D in female participants with type 2 diabetes mellitus. |
Linear Regression Analysis of the Correlation Between Vitamin D Deficiency and HbA1c Levels in Patients with T2DM
For all participants, vitamin D deficiency was identified as associated with for high HbA1c levels by the crude model (P = 0.009), model 2 (adjusted for gender, family history, and BMI) (P = 0.018), and model 3 (additionally adjusted for TG, VLDL-C, and Cr) (P= 0.032) (Table 4).
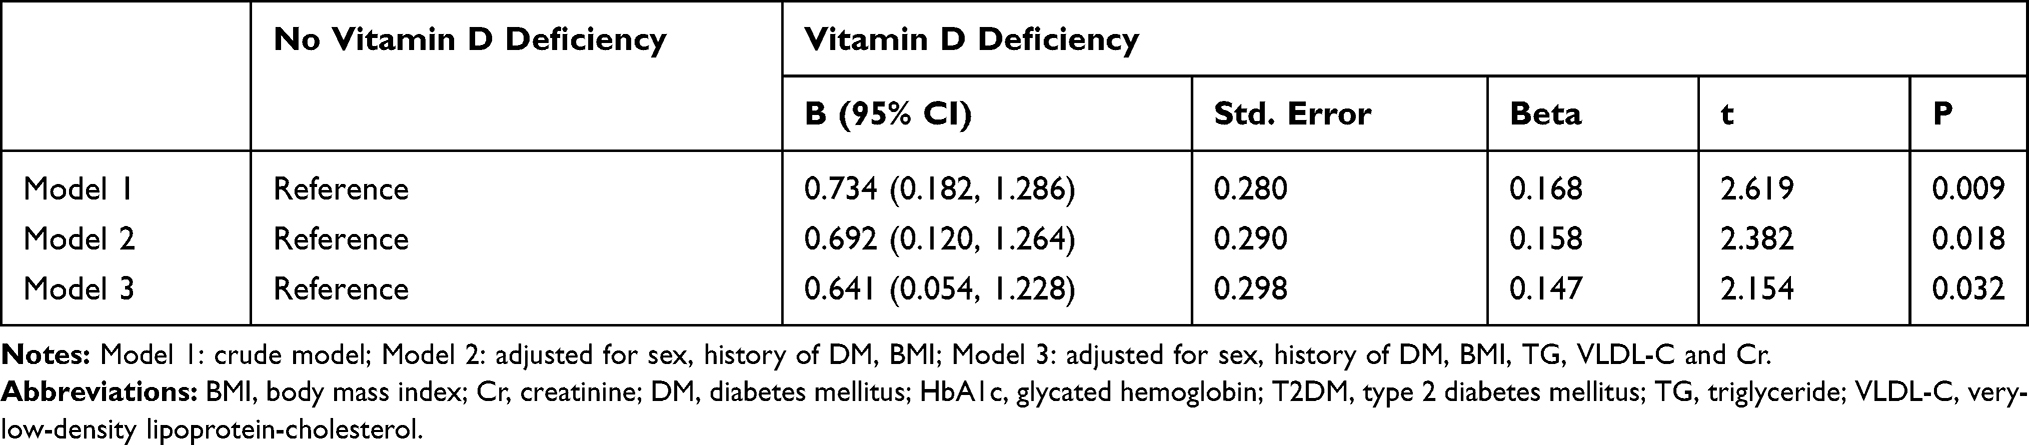 |
Table 4 Linear Regression Model of Vitamin D Deficiency for HbA1c in Patients with T2DM |
Vitamin D deficiency was not associated with high HbA1c levels in male patients with T2DM, regardless of whether an unadjusted or adjusted model was used (P = 0.101 for model 1, P = 0.060 for model 2, and P = 0.094 for model 3) (Table 5).
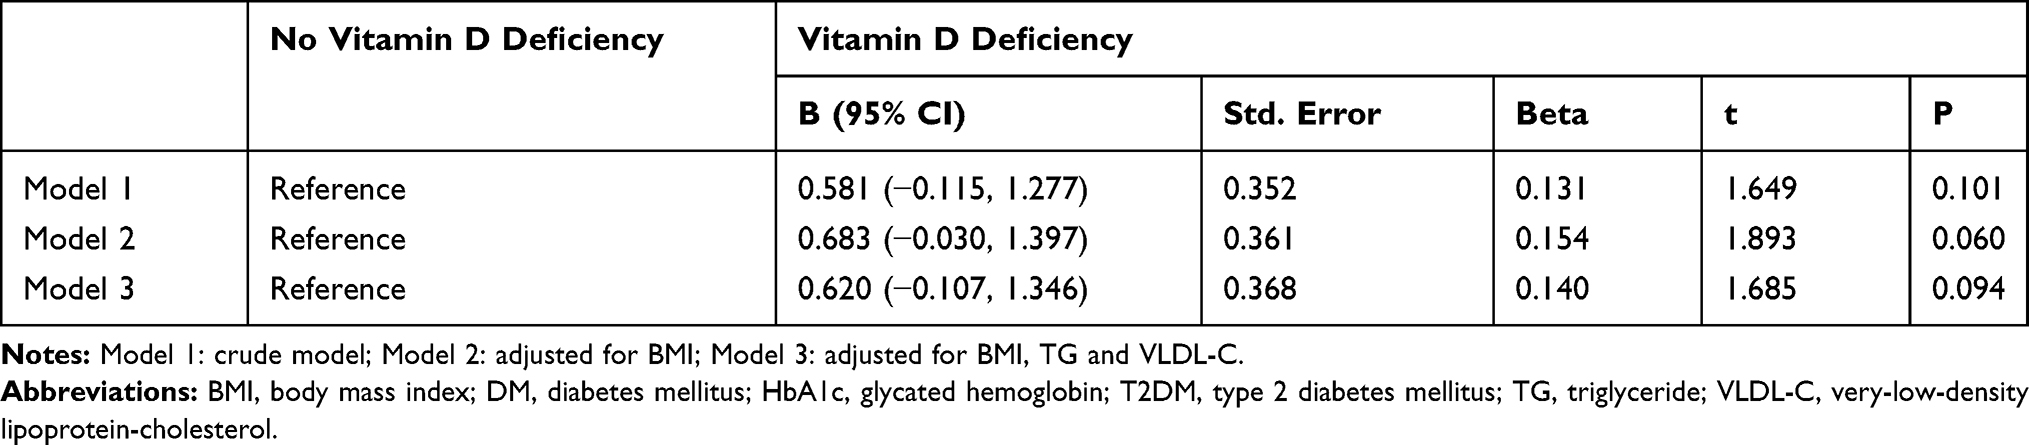 |
Table 5 Linear Regression Model of Vitamin D Deficiency for HbA1c in Male Patients with T2DM |
Vitamin D deficiency was associated with high HbA1c levels in female patients with T2DM, regardless of whether an unadjusted or adjusted model was used (P = 0.029 for model 1, P = 0.038 for model 2, and P = 0.016 for model 3) (Table 6).
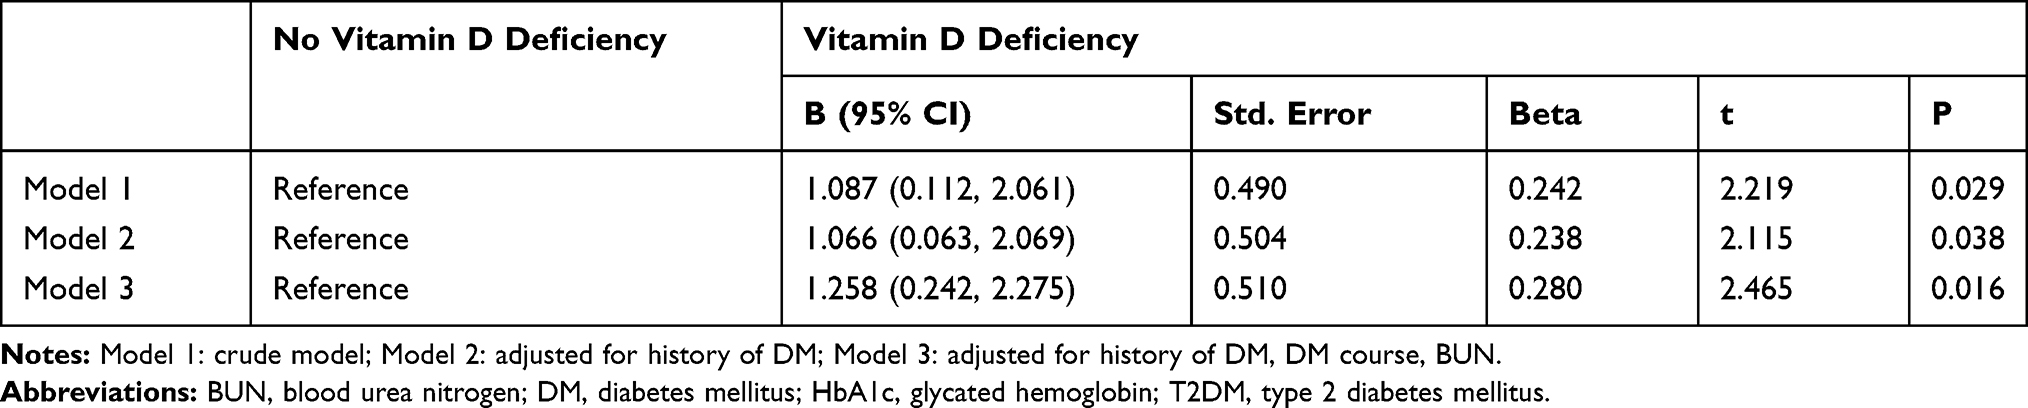 |
Table 6 Linear Regression Model of Vitamin D Deficiency for HbA1c in Female Patients with T2DM |
Discussion
Serum 25(OH) D levels are an indicator of vitamin D status and are related to a variety of diseases, such as DM, breast cancer and multiple sclerosis, which may be due to the universal expression of vitamin D receptor in a variety of tissues and cells, such as adipose tissue,12 breast13 and nerve cells.14 β-cells within pancreatic islets have receptors for active vitamin D,15 enabling vitamin D to regulate the insulin response to elevated blood glucose levels. In addition, these cells express 1α-hydroxylase, which can convert the biologically inert 25(OH) D to active vitamin D. Vitamin D can also promote insulin-mediated responses by suppressing inflammation.16
Vitamin D deficiency is involved in many complications of DM, such as diabetic retinopathy, diabetic nephropathy, and diabetic peripheral neuropathy.17 For example, a meta-analysis by Luo involving 15 observational studies (17,664 subjects) found that the rate of diabetic retinopathy was significantly (2.03-fold) higher in patients with T2DM and vitamin D deficiency than in patients with T2DM and no vitamin D deficiency.18 The renin-angiotensin-aldosterone system (RAAS) is the leading cause of progressive kidney damage. Vitamin D down-regulates the RAAS by inhibiting renin expression,19 thus protecting the kidneys.
Because of the role of vitamin D in metabolic diseases, some researchers have conducted interventional studies based on vitamin D supplementation. In one study, patients with T2DM received 4500 IU/day for 2 months, which resulted in a significant reduction in fasting blood glucose (from 133 mg/dl to 127 mg/dl) and HbA1c (from 7.7% to 7.2%) levels compared with baseline values.20 A double-blind, placebo-controlled study of 96 subjects conducted by Lemieux et al found that, in subjects at high risk of diabetes or with newly diagnosed T2DM who received 5000 IU vitamin D3 daily for 6 months, peripheral insulin sensitivity and β-cell function increased significantly, suggesting that supplementation with vitamin D3 may slow metabolic deterioration in this population.21
Previous studies have explored the relationship between vitamin D and blood glucose levels. One study performed in adolescents (aged 12–17 years) in the United States found that vitamin D levels were negatively correlated with fasting blood glucose levels, but were not related to HbA1c in male subjects.22 Munasinghe23 found that individuals with a 25(OH) D level ≥20ng/mL had a 0.74-fold less possibility of exhibiting elevated HbA1c levels compared with individuals with a 25(OH) D level <20ng/mL in a non-diabetic population. Another study showed that 25(OH) D levels are negatively correlated with HbA1c levels in patients with T2DM.24
In our study, we found that HbA1c levels were significantly higher in patients with vitamin D deficiency compared with the no vitamin D deficiency group for all subjects with T2DM. The same was true for female patients with T2DM, but there were no differences between the two groups for male patients. In addition, there was no difference in HbA1c levels between vitamin D-deficient male and female patients with T2DM.
For all participants, male participants, and female participants, there was a negative linear correlation between 25(OH) D and HbA1c levels. Whether all confounding factors were adjusted for or not, we found that 25(OH) D was an independent risk factor for high HbA1c levels in all patients with T2DM and in female patients with T2DM. In the male-only group, 25(OH) D was not a risk factor for high HbA1c levels, regardless of whether confounding factors were adjusted for. The differences that we observed between the male-only and female-only groups may be due to the effects of hormones, exercise, or other factors.
There were some limitations to this study. First, it was a single-center study, so the sample may not be representative of all patients with T2DM. Second, this was a cross-sectional study, and as such provides a lower level of evidence than a RCT, cohort study, or case–control study would have. Third, confounding factors such as exposure sunlight and sedentary lifestyle were not included in our study because these indicators were difficult to quantify. Fourth, patients hospitalized were recruited, which may lead to bias to some extent. Last, the sample size was small, especially female population, which led to unbalanced gender distribution. It is essential to expand the sample size in future studies and try to maintain gender balance.
In conclusion, the results from our study confirm that HbA1c is increased in patients with T2DM with 25(OH) D deficiency. Maybe 25(OH) D deficiency is a risk factor for high HbA1c levels in patients with T2DM, but it needs further investigation. Furthermore, we show that the relationship between 25(OH) D and HbA1c levels is different between female and male patients with T2DM.
Abbreviations
ApoA1, apolipoprotein A1; ApoB, apolipoprotein B; BMI, body mass index; BUN, blood urea nitrogen; Cr, creatinine; DM, diabetes mellitus; HbA1c; glycated hemoglobin; HDL-C, high-density lipoprotein cholesterol; LDL-C, low-density lipoprotein cholesterol; MetS, metabolic syndrome; T2DM, type 2 diabetes mellitus; TC, total cholesterol; TG, triglyceride; VLDL-C, very low-density lipoprotein cholesterol; OC, osteocalcin; P1NP, procollagen type 1 N-terminal propeptide; PTH, parathyroid hormone; 25OHD, 25-hydroxyvitamin D; β-CTX, β-C-terminal cross-linked telopeptide of type I collagen.
Data Sharing Statement
The original data can be available by email request at any time (Hang Zhao: [email protected]).
Ethics Approval
The experiment was approved by the Ethics Committee of Hebei General Hospital (No: 2020 Research Ethics 01).
Acknowledgment
We thank Emily Crow, PhD, from Liwen Bianji, Edanz Editing China (www.liwenbianji.cn/ac), for editing the English text of a draft of this manuscript.
Funding
This study is not being supported by a grant.
Disclosure
The authors report no conflicts of interest related to this work.
References
1. Gallagher JC, Sai AJ. Vitamin D insufficiency, deficiency, and bone health. J Clin Endocrinol Metab. 2010;95(6):2630–2633. doi:10.1210/jc.2010-0918
2. Wang CM, Chang CS, Chang YF, et al. Inverse relationship between metabolic syndrome and 25-hydroxyvitamin D concentration in elderly people without vitamin D deficiency. Sci Rep. 2018;8(1):17052. doi:10.1038/s41598-018-35229-2
3. Alcubierre N, Castelblanco E, Martínez-Alonso M, et al. Vitamin D deficiency is associated with poorer satisfaction with diabetes-related treatment and quality of life in patients with type 2 diabetes: a cross-sectional study. Health Qual Life Outcomes. 2018;16(1):44. doi:10.1186/s12955-018-0873-3
4. Wimalawansa SJ. Vitamin D and cardiovascular diseases: causality. J Steroid Biochem Mol Biol. 2018;175:29–44. doi:10.1016/j.jsbmb.2016.12.016
5. Zhao JY, Wang HP, Zhang ZW, et al. Vitamin D deficiency as a risk factor for thyroid cancer: a meta-analysis of case-control studies. Nutrition. 2019;57:5–11. doi:10.1016/j.nut.2018.04.015
6. Mayne PE, Burne THJ. Vitamin D in synaptic plasticity, cognitive function, and neuropsychiatric illness. Trends Neurosci. 2019;42(4):293–306. doi:10.1016/j.tins.2019.01.003
7. Kim YS, Hwang JH, Song MR. The association between vitamin D deficiency and metabolic syndrome in Korean adolescents. J Pediatr Nurs. 2018;38:e7–e11. doi:10.1016/j.pedn.2017.11.005
8. Pittas AG, Nelson J, Mitri J, Hillmann W, Dawson-Hughes B. Plasma 25-hydroxyvitamin D and progression to diabetes in patients at risk for diabetes. Diabetes Care. 2012;35(3):565–573. doi:10.2337/dc11-1795
9. Song YQ, Wang L, Pittas AG, et al. Blood 25-hydroxy vitamin D levels and incident type 2 diabetes: a meta-analysis of prospective studies. Diabetes Care. 2013;36(5):1422–1428. doi:10.2337/dc12-0962
10. Alvarez JA, Ashraf A. Role of vitamin D in insulin secretion and insulin sensitivity for glucose homeostasis. Int J Endocrinol. 2010;2010:351385. doi:10.1155/2010/351385
11. Kositsawat J, Freeman VL, Gerber BS, Geraci S. Association of A1C levels with vitamin D status in U. S. adults: data from the National Health and Nutrition Examination Survey. Diabetes Care. 2010;33(6):1236–1238. doi:10.2337/dc09-2150
12. Clemente-Postigo M, Muñoz-Garach A, Serrano M, et al. Serum 25-hydroxyvitamin D and adipose tissue vitamin D receptor gene expression: relationship with obesity and type 2 diabetes. J Clin Endocrinol Metab. 2015;100(4):E591–E595. doi:10.1210/jc.2014-3016
13. Acevedo F, Pérez V, Pérez-Sepúlveda A, et al. High prevalence of vitamin D deficiency in women with breast cancer: the first Chilean study. Breast. 2016;29:39–43. doi:10.1016/j.breast.2016.06.022
14. Berlanga-Taylor AJ, Disanto G, Ebers GC, et al. Vitamin D–gene interactions in multiple sclerosis. J Neurol Sci. 2011;311(1–2):32–36. doi:10.1016/j.jns.2011.08.041
15. Xuan Y, Zhao HY, Liu JM. Vitamin D and Type 2 diabetes mellitus. J Diabetes. 2013;5(3):261–267. doi:10.1111/1753-0407.12024
16. Chagas CE, Borges MC, Martini LA, Rogero MM. Focus on vitamin D, inflammation and type 2 diabetes. Nutrients. 2012;4(1):52–67. doi:10.3390/nu4010052
17. Sacerdote A, Dave P, Lokshin V, Bahtiyar G. Type 2 diabetes mellitus, insulin resistance, and vitamin D. Curr Diab Rep. 2019;19(10):101. doi:10.1007/s11892-019-1201-y
18. Luo BA, Gao F, Qin LL. The association between vitamin D deficiency and diabetic retinopathy in type 2 diabetes: a meta-analysis of observational studies. Nutrients. 2017;9(3):307. doi:10.3390/nu9030307
19. Shroff R, Wan M, Rees L. Can vitamin D slow down the progression of chronic kidney disease? Pediatr Nephrol. 2012;27(12):2167–2173. doi:10.1007/s00467-011-2071-y
20. Mohamad MI, Elsherbeny EE, Bekhet MM. The effect of vitamin D supplementation on glycemic control and lipid profile in patients with type 2 diabetes mellitus. J Am Coll Nutr. 2016;35:399–404.
21. Lemieux P, Weisnagel SJ, Caron AZ, et al. Effects of 6-month vitamin D supplementation on insulin sensitivity and secretion: a randomised, placebo-controlled trial. Eur J Endocrinol. 2019;181(3):287–299. doi:10.1530/EJE-19-0156
22. Ford ES, Zhao GX, Tsai J, Li CY. Associations between concentrations of vitamin D and concentrations of insulin, glucose, and HbA1c among adolescents in the United States. Diabetes Care. 2011;34(3):646–648. doi:10.2337/dc10-1754
23. Munasinghe LL, Mastroeni MF, Mastroeni SSBS, Loehr SA, Ekwaru JP, Veugelers PJ. The association of serum 25-hydroxyvitamin D concentrations and elevated glycated hemoglobin values: a longitudinal study of non-diabetic participants of a preventive health program. Nutrients. 2017;9(7):640. doi:10.3390/nu9070640
24. Kostoglou-Athanassiou I, Athanassiou P, Gkountouvas A, Kaldrymides P. Vitamin D and glycemic control in diabetes mellitus type 2. Ther Adv Endocrinol Metab. 2013;4(4):122–128. doi:10.1177/2042018813501189
 © 2020 The Author(s). This work is published and licensed by Dove Medical Press Limited. The
full terms of this license are available at https://www.dovepress.com/terms
and incorporate the Creative Commons Attribution
- Non Commercial (unported, 3.0) License.
By accessing the work you hereby accept the Terms. Non-commercial uses of the work are permitted
without any further permission from Dove Medical Press Limited, provided the work is properly
attributed. For permission for commercial use of this work, please see paragraphs 4.2 and 5 of our Terms.
© 2020 The Author(s). This work is published and licensed by Dove Medical Press Limited. The
full terms of this license are available at https://www.dovepress.com/terms
and incorporate the Creative Commons Attribution
- Non Commercial (unported, 3.0) License.
By accessing the work you hereby accept the Terms. Non-commercial uses of the work are permitted
without any further permission from Dove Medical Press Limited, provided the work is properly
attributed. For permission for commercial use of this work, please see paragraphs 4.2 and 5 of our Terms.