")
Back to Journals » Neuropsychiatric Disease and Treatment » Volume 19
The Relationship Between Theta Power, Theta Asymmetry and the Effect of Escitalopram in the Treatment of Depression
Authors Gao M, Sang W, Mi K, Liu J, Liu Y, Zhen W, An B
Received 19 July 2023
Accepted for publication 5 October 2023
Published 24 October 2023 Volume 2023:19 Pages 2241—2249
DOI https://doi.org/10.2147/NDT.S425506
Checked for plagiarism Yes
Review by Single anonymous peer review
Peer reviewer comments 2
Editor who approved publication: Dr Yuping Ning
Min Gao,1,2,* Wenhua Sang,1,3,4,* Kun Mi,1,3,4 Jiancong Liu,1,3,4 Yudong Liu,1,3,4 Wenge Zhen,1,3,4 Bang An2
1Department of Affective Disorders II, Hebei Provincial Mental Health Center, Baoding, People’s Republic of China; 2Xianyang Central Hospital, Xianyang Mental Health Center, Xianyang, People’s Republic of China; 3Hebei Key Laboratory of Major Mental and Behavioral Disorders, Baoding, People’s Republic of China; 4The Sixth Clinical Medical College of Hebei University, Baoding, People’s Republic of China
*These authors contributed equally to this work
Correspondence: Wenhua Sang, Department of Affective Disorders II, Hebei Provincial Mental Health Center, Hebei Key Laboratory of Major Mental and Behavioral Disorders, The Sixth Clinical Medical College of Hebei University, Baoding, People’s Republic of China, Email [email protected] Bang An, Xianyang Central Hospital, Xianyang Mental Health Center, Xianyang, People’s Republic of China, Email [email protected]
Objective: Only about one-third of depressed patients respond to initial antidepressant treatment. Therefore, it is crucial to find effective predictors of antidepressants. The purpose of our study was to learn the relationship between EEG theta power, theta asymmetry, and the efficacy of escitalopram.
Methods: The study included 34 patients with depression. Before and after each patient’s course of treatment, EEG data was gathered. Both the Hamilton Anxiety Scale (HAMA) and the 17-item Hamilton Depression Scale (HAMD-17) were evaluated simultaneously. The natural logarithm of right frontal theta power minus left frontal theta power was used to calculate inter-electrode theta asymmetry (AT).
Results: First, our study found no statistically significant difference between intra-electrode theta power and inter-electrode AT before and after treatment (P ≥ 0.05). When we later looked at the data regarding treatment effects, the findings revealed that patients (n = 9) who did not respond to treatment had lower baseline theta power at C4 [6.190 (2.000, 12.990) vs 15.800 (7.255, 22.330), z = − 2.166, P = 0.030]. The two groups had no difference in other electrodes (P ≥ 0.05). The AT of C3/C4 in non-responders (n = 9) was lower [0.012 (0.795) vs 0.733 (0.539), t = − 3.224, P = 0.005]. However, there was no difference in inter-electrode AT between the two groups in F3/F4 and F7/F8 (P ≥ 0.05). We finally show that the theta power at C4 was negatively correlated with HAMD scores before treatment (r = − 0.346, P = 0.045).
Conclusion: Our findings determined that increased theta power and positive asymmetry in the right frontal-central area correlate with favourable escitalopram treatment, providing a basis for finding predictive markers for antidepressants.
Keywords: depression, EEG, theta power, theta asymmetry, treatment effect
Introduction
It is of great clinical value to find indicators that predict the likelihood of antidepressant treatment response, which can be used to select treatment measures for patients in the early stage of treatment. Non-invasive neuroimaging techniques such as functional Magnetic Resonance Imaging (fMRI) and electroencephalography (EEG) have been widely used to study changes in resting-state brain function in patients with depression.1 There have been many studies on neural activity assessed by EEG. Chronic drug EEG response patterns reflect sedation and activation of region-specific regions implicated in the pathophysiology and drug treatment of depression.2 For example, Frontal alpha asymmetry (FAA) has been shown to be related to depression and mood disorders,3,4 Patients with increased left frontal cortex activity respond well to selective serotonin receptor uptake inhibitors (SSRIs), and FAA can be used as an indicator to predict the effect of SSRIs therapy.5–7 In addition, studies have shown that hemispheric activity asymmetry is neither limited to the alpha band nor to the frontal lobe.8 Pizzagalli et al9 found that the correlation between theta-band activity and anterior cingulate cortex (ACC) activity was disrupted in depressed patients compared with controls, suggesting a lack of functional connectivity in this region in depressed patients. But in contrast to this, current research on theta band in depression has focused on its relationship with treatment outcome;10 theta power is significant in depressive symptom relief and predicting antidepressant treatment outcome, and is not treated with antidepressant medication impact.11
The ACC is the hub in the default mode network (DMN),12 which is mainly through the activation of the ACC to achieve top-down inhibition of amygdala activity, further inhibiting negative information to deal with emotional conflict.13,14 Frontal midline theta power is inversely correlated with DMN activity.15 ACC activity is accompanied by activity in the dorsolateral prefrontal cortex (DLPFC), and theta activity recorded by scalp electrodes originates in the DLPFC and ACC activity. Individuals displaying elevated theta power tend to exhibit heightened ACC activation,9 increasing the likelihood of mitigating negative emotional conflicts through cognitive regulatory mechanisms and achieving improved therapeutic outcomes.15
Although frontal theta activity in depression is currently studied primarily at midline locations and by source-localization methods,10 simple scalp electrode analysis,11,16 as well as interhemispheric activity in the theta bands in affective disorders, is of considerable significance.17–19 At present, there are no studies on the relationship between inter-electrode theta asymmetry (AT) and the treatment effect of antidepressants. The purpose of this study was to comprehend the relationship between theta power, AT, and the antidepressant escitalopram’s therapeutic effect.
Methods
Participants
We selected inpatient depression patients in the Hebei Mental Health Center from June 2021 to June 2022. Inclusion criteria: All the subjects were diagnosed by two psychiatrists with intermediate titles or above in accordance with the 10th edition of the International Statistical Classification of Diseases and Related Health Problems (ICD-10) for the first attack or relapse. Patients with recurrent depression did not use psychiatric drugs within the two weeks before the study. With an age range of 18–60 years, the total score of the 17 items of the Hamilton Depression Scale (HAMD-17) is ≥ 17 points; right-handed. Exclusion criteria: patients with neurological disease; intellectual disability; abnormal thyroid function; brain trauma and other physical disorders affecting cognitive function; pregnant women; and lactating patients. A total of 43 patients with depression were included in this study, of whom three were lost to follow-up, two withdrew due to severe adverse reactions to antidepressants (headache, severe gastrointestinal reactions), and four were not included due to failure of EEG data conversion. Finally, a total of 34 patients were included in the statistics. Among them, there were 12 males and 22 females, with an age of 41.529 (13.482) years, an education level of 9.882 (3.707) years, and a disease duration of 0.790 (0.290, 3.000) years. All patients were treated with escitalopram for eight weeks. The dose of escitalopram was increased to a responder therapeutic dose of 10–20 mg/d within 2–3 weeks, with an average therapeutic amount of 13.676 (3.270) mg/d. Treatment with other antidepressants and antipsychotics was not allowed. In contrast, the patients with sleep disorders were allowed to be given low-dose benzodiazepines (but it was prohibited to use them before the EEG test within 24 hours). Participant recruitment and study flow are presented in Figure 1.
 |
Figure 1 Participant Flow in the relationship between theta power, theta asymmetry and the efficacy of escitalopram in the treatment of depression. |
We obtained written informed consent from patients or their legal guardians. This study was approved by the ethics committee of the Hebei Mental Health Center, China, and the experiments were conducted following the Declaration of Helsinki.
Psychological Measures
The HAMD-17 and Hamilton Anxiety Scale (HAMA) were evaluated before and after treatment. The responders were assessed according to the reduction of HAMD scales at the end of treatment. The HAMD scores reduction rate was less than 50% as non-responders, and the HAMD scores reduction rate ≥ 50% was considered responders.20
EEG Data Collection and Analysis
EEG data were collected before and after treatment using an electroencephalograph from Nicolette in the United States. EEG data were collected in a quiet, noise-free, softly lit room. An AgCl electrode was mounted on the electrode cap, and the electrodes were placed according to the International 10–20 system. This study recorded 16 electrodes (C3, C4, F3, F4, F7, F8, FP1, FP2, O1, O2, P3, P4, T3, T4, T5, T6) EEG data. A 0.1–100 Hz band-pass filter was used, the sampling frequency was 256 Hz, and EEG data were recorded for about 4 minutes in a calm state. The reference electrodes were placed on the two mastoids, the average value of the bilateral mastoids was taken as the reference, and the forehead was grounded. At the outset of data processing, a rigorous preprocessing protocol is meticulously implemented. In the context of this study, we systematically apply a precisely defined band-pass filter covering the frequency range of 0.1 Hz to 30 Hz to eliminate artifacts originating from both low and high frequencies. Following this crucial preprocessing phase, we devote meticulous attention to mitigating artifacts resulting from ocular movements and blinks. Independent Component Analysis (ICA), a sophisticated data decomposition technique, is effectively employed through the EEGLAB platform. After the preprocessing phase, a rigorous Fast Fourier Transform (FFT) analysis is meticulously conducted on the data acquired from the 16 strategically positioned electrodes. These electrode positions are meticulously categorized into four distinct frequency bands, namely δ (1 ~ 4 Hz), θ (4 ~ 8 Hz), α (8 ~ 13 Hz), and β (13 ~ 30 Hz). Consequent to this, the meticulous computation of the average power for each electrode is undertaken. Previous studies on theta bands have shown that scalp theta activity originates from the DLPFC and is mainly concentrated in the frontal-central region,9,21–23 so the related electrodes (F3, F4, F7, F8, C3, C4) in the frontal-central were selected as the points of interest in this study. Theta asymmetry is calculated as [ln (right power) – ln (left power)],8 expressed as AT. Higher AT indicates an increase in relative right hemisphere theta power, while lower AT indicates an increase in relative left hemisphere theta power.
Statistical Analysis
For statistical data analysis, the Statistical Product and Service Solutions 26 (SPSS 26) software is used (https://www.ibm.com/analytics/spss-statisticssoftware). For general data, descriptive statistics were used, and mean (standard deviation) values were expressed for age, education level, medication dosage, pre-treatment HAMD, HAMA scores, and AT, conforming to normal distribution. Independent samples t-test was used for theta asymmetry between responders and non-responders, and paired samples t-test was used to compare the differences between theta asymmetry groups before and after treatment. Because theta power and disease progression did not have a normal distribution, they were described as median (interquartile range) [M (QL, QU)]. The Mann–Whitney U-test was used to compare the differences in theta power and disease course between responders and non-responders. The Wilcoxon signed-rank test was used to compare the theta power before and after treatment. Fisher’s exact test was used to compare the differences in the number of responders and non-responders. Spearman correlation analysis was used to analyze the correlations between the intra-electrode theta power, inter-electrode AT, and the scores on the HAMD and HAMA scales before treatment—test level α=0.05, bilateral test.
Results
Descriptive Statistical Analysis of General Data
Our study finally included 34 patients with depression for statistics, of which 9 were responders and 25 were non-responders. There was no significant difference in age, education level, gender, course of the disease, medication dose, pre-treatment HAMD, and HAMA scores between the two groups (P ≥ 0.05) (Table 1).
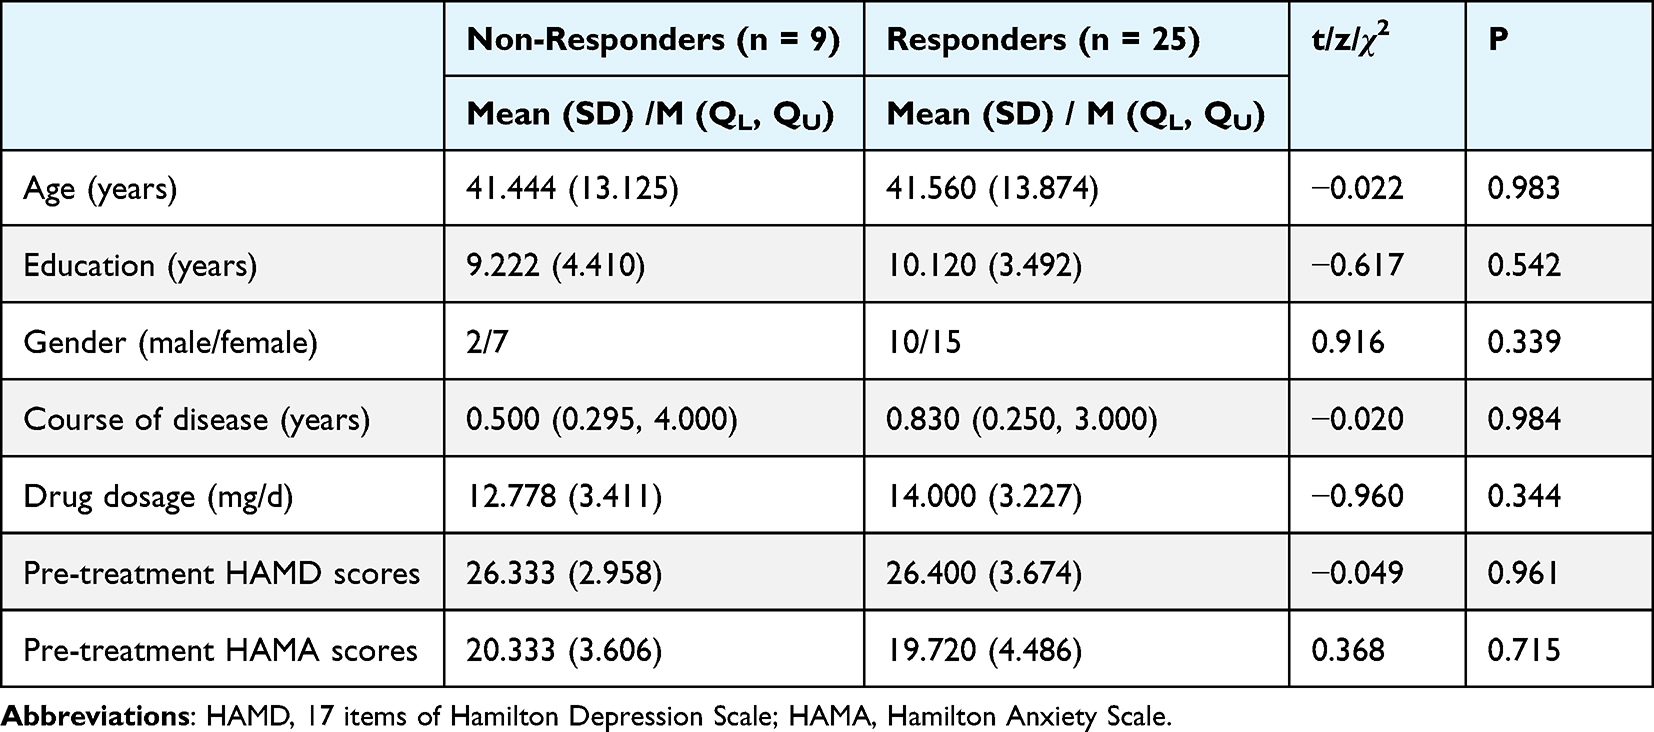 |
Table 1 General Information on Depression Patients with Responders and Non-Responders |
Before and After Treatment, Without Significant Difference in Intra-Electrode and Inter-Electrode Asymmetry. Table 2 and Table 3 Provide Explanations and are Referenced in the Text
Then, we compared the theta power in each electrode and the inter-electrode AT before and after treatment. There was no statistical difference in the intra-electrode theta power of C3, C4, F3, F4, F7, and F8 before and after treatment, and there was no statistical difference in inter-electrode AT of C3/C4, F3/F4, and F7/F8 (P ≥ 0.05) (Table 2 and Table 3).
 |
Table 2 Intra-Electrode Theta Power Before and After Treatment |
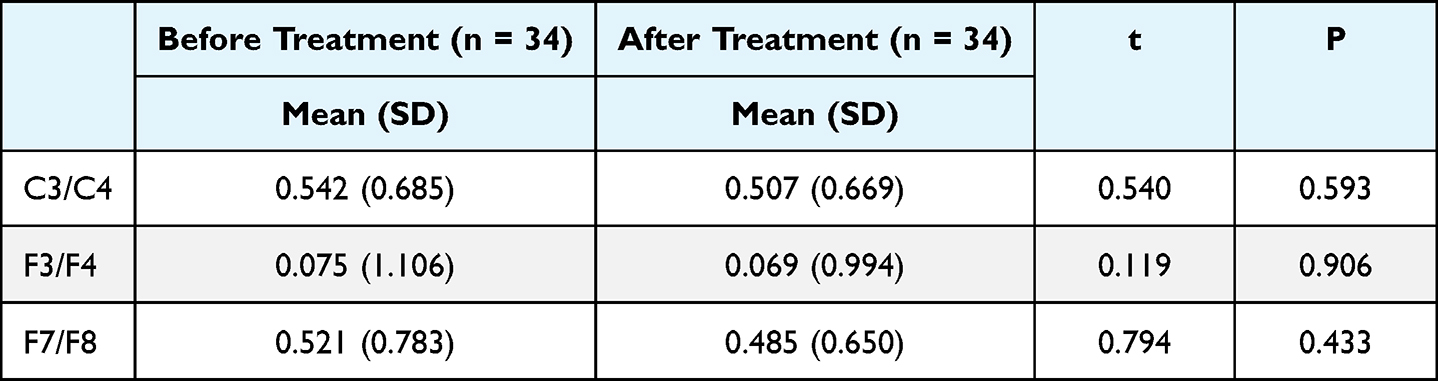 |
Table 3 Inter-Electrode at Before and After Treatment |
Division Now Between Non-Responders x Responders
Subsequently, we analyzed the data regarding treatment effects; the results showed that increased intra-electrode theta power and inter-electrode AT in the right frontal center were associated with better treatment outcomes. However, only at baseline C4 was a difference in intra-electrode theta power. Lower baseline theta power at C4 in patients (n = 9) whose treatment was non-responders [6.190 (2.000, 12.990) vs 15.800 (7.255, 22.330), z = −2.166, P = 0.030] (Figure 2A)]. There was no difference between the two groups in C3, F3, F4, F7, and F8 electrodes [4.100 (2.880, 13.270) vs 5.570 (4.075, 8.285), z = −1.308, P = 0.191; 6.070 (4.185, 17.640) vs 9.360 (6.225, 12.835), z = −0.956, P = 0.339; 7.050 (5.050, 25.035) vs 8.890 (5.925, 15.335), z = −0.547, P = 0.585; 5.120 (3.515, 10.830) vs 10.410 (5.410, 12.990), z = −1.776, P = 0.076; 12.650 (5.015, 27.730) vs 15.360 (9.430, 26.600), z = −0.683, P = 0.494] (Table 4).
 |
Table 4 Intra-Electrode Theta Power Before Treatment in the Responders and Non-Responders |
 |
Figure 2 Comparison of intra-electrode theta power at baseline C4 in patients with non-responders and responders (A). Comparison of inter-electrode AT at baseline C3/C4 between non-responders and responders (B). Note: *Indicated a significant difference of P ≤ 0.05. **Indicated a significant difference of P ≤ 0.01. |
Only C3/C4 had a difference in inter-electrode AT. The AT of C3/C4 in non-responders (n = 9) was lower [0.012 (0.795) vs 0.733 (0.539), t = −3.024, P = 0.005 (Figure 2B)]. There was no difference in inter-electrode AT between the two groups in F3/F4 and F7/F8 [0.213 (1.433) vs 0.026 (0.995), t = 0.431, P = 0.669; 0.740 (0.759) vs 0.442 (0.791), t = 0.980, P = 0.334] (Table 5).
 |
Table 5 Inter-Electrode at Before Treatment in the Responders and Non-Responders |
Correlation Analysis of Theta Power, Theta Asymmetry, and Psychological Scale Before Treatment
We finally performed a correlation analysis on theta power, AT, and pre-treatment HAMD and HAMA scale scores. The results show that the theta power at C4 was negatively correlated with HAMD scores before treatment (lower C4 Theta power, higher HAMD scores) [r = - 0.346, P = 0.045; Figure 3A (weak relationship)]. However, the theta power at C4 was not correlated with HAMA scores before treatment (Theta power at C4 is not related to anxiety) [(r = −0.228, P = 0.195); Figure 3B]. AT C3/C4: NOT correlated with pre-treatment HAMD and HAMA scores [r = −0.016, P = 0.927; r = −0.208, P = 0.238; Figure 3C and D].
 |
Figure 3 The results of correlation analysis showed that the intra-electrode power at C4 was negatively correlated with the HAMD scores before treatment (A), but not with the HAMA scores before treatment (B). Inter-electrode AT at C3/C4 did not correlate with pre-treatment HMAD and HAMA scores (C and D). |
Discussion
This study showed no significant difference in intra-electrode theta power or inter-electrode AT of electrodes before and after treatment. Intra-electrode theta power may not be affected by treatment. Studies have shown that short-term treatment with paroxetine does not change the EEG of patients. Still, long-term treatment is associated with significant changes, such as a diffuse decrease in alpha power and an increase in theta and beta wave power.2 However, this study only has a follow-up of up to 8 weeks, and whether theta power and AT will be affected by the extension of treatment time will require a more comprehensive study to explore.
This study showed that the intra-electrode theta power of the responders was significantly higher than that of the non-responders on the C4 electrode. However, no such findings were found on the C3, F3, F4, F7, and F8 electrodes. Previous studies have suggested that the activity of the ACC mainly generates the frontal-central theta power recorded by scalp electrodes,9,24 and the relationship between the ACC and the treatment effects of antidepressants may be validated by a relatively simple and widely used scalp EEG.11 A previous study showed that increased frontal-central theta power was associated with favourable treatment outcomes in depression.25 Another study found a strong positive correlation between ACC-generated theta activity in healthy people and activity in broad cortical regions, especially in the brain’s right hemisphere, but no significant correlation in depressed patients.9 However, unlike the findings of low ACC activity in patients with depression, increased pre-treatment ACC activity is a potential predictor of antidepressant efficacy.26 Furthermore, ACC is currently the most reliable marker of response to various treatment modalities for depression.26,27 These studies further support the idea that increased right frontal-central theta power is associated with favourable treatment outcomes in depression.
This study shows that responders have higher C3/C4 AT than non-responders. Ocklenburg et al8 found a significant positive asymmetry in the frontal-central electrode locations (C3/C4) in the theta band in experiments with healthy subjects; this is supported by studies by Pizzagalli et al9 with strong positive correlations between theta activity produced by the ACC in healthy humans, particularly across extensive cortical areas in the right hemisphere. These studies show that there is also an asymmetry of theta activity in the left and right cerebral hemispheres. Depressed patients who respond to treatment have similar activity patterns in the cerebral hemispheres of healthy people, and the right frontal-central theta activity is stronger in the depressed patients than in the left. Frontal-central theta power is negatively correlated with activity within the DMN,15 in which the ACC is a hub.12 Mainly through the activation of the ACC to achieve top-down inhibition of amygdala activity and further inhibit negative information to deal with emotional conflicts, these processes will reduce the rumination of depressed patients, such as negative self-reflection, difficulty in inhibiting negative emotions, and deficits in assigning attention to task demands.13,14 Therefore, patients with increased theta power have more ACC activation and are more likely to reduce harmful emotional conflicts through cognitive regulation to achieve better therapeutic effects.
This study demonstrated a negative correlation between theta power at the C4 electrode and pre-treatment HAMD scores in patients with depression. Specifically, patients with depression who exhibited reduced right frontal-central theta power tended to have more severe depressive symptoms. This finding aligns with the results of Gold et al’s study,18 which suggested that lower frontal-central theta power may be indicative of increased severity of depression and anxiety. However, our study did not identify a correlation between right frontal-central theta power and pre-treatment HAMA scores. This discrepancy could be attributed to the composition of our study subjects. Before treatment, the average scores on the HAMA scale for the depression patients included in this study were approximately 20 points, indicating mild to moderate anxiety symptoms. This may not be sufficient to establish a relationship with the severity of anxiety symptoms. Therefore, further research is warranted to explore the connection between anxiety symptoms and theta power.
Conclusion
When data were analyzed in terms of treatment effects, the results of this study indicated that in the central region of depression, increased intra-electrode theta power within the right frontal-central region and higher inter-electrode theta asymmetry were associated with better treatment outcomes. Depressed patients with reduced intra-electrode theta power within the right frontal-central region had more severe depressive symptoms, intra-electrode theta power within the right frontal-central region was not associated with anxiety severity in depressed patients, and the inter-electrode theta asymmetry between the frontal-central regions was associated with depression regardless of anxiety severity.
Our findings determined that increased theta power and positive asymmetry in the right frontal-central region correlate with favourable escitalopram treatment, providing a basis for finding predictive markers for antidepressants.
Data Sharing Statement
The datasets generated or analyzed during the current study are not publicly available due to confidentiality but are available from the corresponding author upon reasonable request.
Funding
This study was supported by the Hebei Provincial Government Grant for Outstanding Talents Project, entitled “Characteristics of Event-Related Potentials and Predictive Role of Treatment in Depressed Patients”. (No.361014).
Disclosure
The authors have no potential or actual conflicts of interest for this work.
References
1. Dell’Acqua C, Ghiasi S, Messerotti Benvenuti S, Greco A, Gentili C, Valenza G. Increased functional connectivity within alpha and theta frequency bands in dysphoria: a resting-state EEG study. J Affect Disord. 2021;281:199–207. doi:10.1016/j.jad.2020.12.015
2. Knott V, Mahoney C, Kennedy S, Evans K. EEG correlates of acute and chronic paroxetine treatment in depression. J Affect Disord. 2002;69(1–3):241–249. doi:10.1016/s0165-0327(01)00308-1
3. Allen J, Urry H, Hitt S, Coan J. The stability of resting frontal electroencephalographic asymmetry in depression. Psychophysiology. 2004;41(2):269–280. doi:10.1111/j.1469-8986.2003.00149.x
4. Allen JJ, Reznik SJ. Frontal EEG asymmetry as a promising marker of depression vulnerability: summary and methodological considerations. Curr Opin Psychol. 2015;4:93–97. doi:10.1016/j.copsyc.2014.12.017
5. Arns M, Bruder G, Hegerl U, et al. EEG alpha asymmetry as a gender-specific predictor of outcome to acute treatment with different antidepressant medications in the randomized iSPOT-D study. Clin Neurophysiol. 2016;127(1):509–519. doi:10.1016/j.clinph.2015.05.032
6. Lee HS, Baik SY, Kim YW, Kim JY, Lee SH. Prediction of antidepressant treatment outcome using event-related potential in patients with major depressive disorder. Diagnostics. 2020;10(5). doi:10.3390/diagnostics10050276
7. van der Vinne N, Vollebregt MA, van Putten M, Arns M. Stability of frontal alpha asymmetry in depressed patients during antidepressant treatment. Neuroimage Clin. 2019;24:102056. doi:10.1016/j.nicl.2019.102056
8. Ocklenburg S, Friedrich P, Schmitz J, et al. Beyond frontal alpha: investigating hemispheric asymmetries over the EEG frequency spectrum as a function of sex and handedness. Laterality. 2019;24(5):505–524. doi:10.1080/1357650X.2018.1543314
9. Pizzagalli DA, Oakes TR, Davidson RJ. Coupling of theta activity and glucose metabolism in the human rostral anterior cingulate cortex: an EEG/PET study of normal and depressed subjects. Psychophysiology. 2003;40(6):939–949. doi:10.1111/1469-8986.00112
10. Arns M, Etkin A, Hegerl U, et al. Frontal and rostral anterior cingulate (rACC) theta EEG in depression: implications for treatment outcome? Eur Neuropsychopharmacol. 2015;25(8):1190–1200. doi:10.1016/j.euroneuro.2015.03.007
11. Pizzagalli DA, Webb CA, Dillon DG, et al. Pretreatment rostral anterior cingulate cortex theta activity in relation to symptom improvement in depression: a randomized clinical trial. JAMA Psychiatry. 2018;75(6):547–554. doi:10.1001/jamapsychiatry.2018.0252
12. Buckner RL, Andrews-Hanna JR, Schacter DL. The brain’s default network: anatomy, function, and relevance to disease. Ann N Y Acad Sci. 2008;1124(1):1–38. doi:10.1196/annals.1440.011
13. Etkin A, Egner T, Peraza DM, Kandel ER, Hirsch J. Resolving emotional conflict: a role for the rostral anterior cingulate cortex in modulating activity in the amygdala. Neuron. 2006;51(6):871–882. doi:10.1016/j.neuron.2006.07.029
14. Eugene F, Joormann J, Cooney RE, Atlas LY, Gotlib IH. Neural correlates of inhibitory deficits in depression. Psychiatry Res. 2010;181(1):30–35. doi:10.1016/j.pscychresns.2009.07.010
15. White TP, Jansen M, Doege K, et al. Theta power during encoding predicts subsequent-memory performance and default mode network deactivation. Hum Brain Mapp. 2013;34(11):2929–2943. doi:10.1002/hbm.22114
16. Iosifescu DV, Greenwald S, Devlin P, et al. Frontal EEG predictors of treatment outcome in major depressive disorder. Eur Neuropsychopharmacol. 2009;19(11):772–777. doi:10.1016/j.euroneuro.2009.06.001
17. Ali-Sisto T, Tolmunen T, Viinamäki H, et al. Global arginine bioavailability ratio is decreased in patients with major depressive disorder. J Affect Disord. 2018;229:145–151. doi:10.1016/j.jad.2017.12.030
18. Gold C, Fachner J, Erkkila J. Validity and reliability of electroencephalographic frontal alpha asymmetry and frontal midline theta as biomarkers for depression. Scand J Psychol. 2013;54(2):118–126. doi:10.1111/sjop.12022
19. Quraan M, Protzner A, Daskalakis Z, et al. EEG power asymmetry and functional connectivity as a marker of treatment effectiveness in DBS surgery for depression. Neuropsychopharmacology. 2014;39(5):1270–1281. doi:10.1038/npp.2013.330
20. Reznik SJ, Allen JJB. Frontal asymmetry as a mediator and moderator of emotion: an updated review. Psychophysiology. 2017;55(1). doi:10.1111/psyp.12965
21. Bailey N, Hoy K, Rogasch N, et al. Responders to rTMS for depression show increased fronto-midline theta and theta connectivity compared to non-responders. Brain Stimul. 2018;11(1):190–203. doi:10.1016/j.brs.2017.10.015
22. Beldzik E, Ullsperger M, Domagalik A, Marek T. Conflict- and error-related theta activities are coupled to BOLD signals in different brain regions. Neuroimage. 2022;256:119264. doi:10.1016/j.neuroimage.2022.119264
23. Murphy OW, Hoy KE, Wong D, Bailey NW, Fitzgerald PB, Segrave RA. Individuals with depression display abnormal modulation of neural oscillatory activity during working memory encoding and maintenance. Biol Psychol. 2019;148:107766. doi:10.1016/j.biopsycho.2019.107766
24. Ekstrom AD, Caplan JB, Ho E, Shattuck K, Fried I, Kahana MJ. Human hippocampal theta activity during virtual navigation. Hippocampus. 2005;15(7):881–889. doi:10.1002/hipo.20109
25. Spronk D, Arns M, Barnett KJ, Cooper NJ, Gordon E. An investigation of EEG, genetic and cognitive markers of treatment response to antidepressant medication in patients with major depressive disorder: a pilot study. J Affect Disord. 2011;128(1–2):41–48. doi:10.1016/j.jad.2010.06.021
26. Pizzagalli D. Frontocingulate dysfunction in depression: toward biomarkers of treatment response. Neuropsychopharmacology. 2011;36(1):183–206. doi:10.1038/npp.2010.166
27. Fu CH, Steiner H, Costafreda SG. Predictive neural biomarkers of clinical response in depression: a meta-analysis of functional and structural neuroimaging studies of pharmacological and psychological therapies. Neurobiol Dis. 2013;52:75–83. doi:10.1016/j.nbd.2012.05.008
 © 2023 The Author(s). This work is published and licensed by Dove Medical Press Limited. The full terms of this license are available at https://www.dovepress.com/terms.php and incorporate the Creative Commons Attribution - Non Commercial (unported, v3.0) License.
By accessing the work you hereby accept the Terms. Non-commercial uses of the work are permitted without any further permission from Dove Medical Press Limited, provided the work is properly attributed. For permission for commercial use of this work, please see paragraphs 4.2 and 5 of our Terms.
© 2023 The Author(s). This work is published and licensed by Dove Medical Press Limited. The full terms of this license are available at https://www.dovepress.com/terms.php and incorporate the Creative Commons Attribution - Non Commercial (unported, v3.0) License.
By accessing the work you hereby accept the Terms. Non-commercial uses of the work are permitted without any further permission from Dove Medical Press Limited, provided the work is properly attributed. For permission for commercial use of this work, please see paragraphs 4.2 and 5 of our Terms.