Back to Journals » Diabetes, Metabolic Syndrome and Obesity » Volume 17
The Relationship Between Small Dense Low-Density Lipoprotein Cholesterol and Metabolic Syndrome
Authors Zhu X ![]() , Chen Y, Zhu M, Hu J
, Chen Y, Zhu M, Hu J
Received 30 November 2023
Accepted for publication 15 March 2024
Published 30 March 2024 Volume 2024:17 Pages 1523—1532
DOI https://doi.org/10.2147/DMSO.S450783
Checked for plagiarism Yes
Review by Single anonymous peer review
Peer reviewer comments 2
Editor who approved publication: Prof. Dr. Antonio Brunetti
Xiaoli Zhu,1 Yijun Chen,1 Mingan Zhu,2 Jinxi Hu3
1Department of Laboratory Medicine, Taizhou Hospital of Zhejiang Province Affiliated to Wenzhou Medical University, Taizhou, Zhejiang, People’s Republic of China; 2Department of Medical Laboratory, Renmin Hospital, Hubei University of Medicine, Shiyan, Hubei, People’s Republic of China; 3Department of Oncological Surgery, Taizhou Hospital of Zhejiang Province Affiliated to Wenzhou Medical University, Taizhou, Zhejiang, People’s Republic of China
Correspondence: Mingan Zhu, Department of Medical Laboratory, Renmin Hospital, Hubei University of Medicine, No. 39 Chaoyang Middle Road, Shiyan, Hubei Province, 442000, People’s Republic of China, Tel +86 13872767288, Email [email protected] Jinxi Hu, Department of Oncological Surgery, Taizhou Hospital of Zhejiang Province Affiliated to Wenzhou Medical University, No. 150 Ximen Road of Linhai, Taizhou, Zhejiang Province, 317000, People’s Republic of China, Tel +86 18257689350, Email [email protected]
Background: Prior research has established an association between small dense low-density lipoprotein cholesterol (sdLDL-C) and dyslipidemia, serving as a significant marker for predicting cardiovascular diseases. Nevertheless, the connection between sdLDL-C and metabolic syndrome (MetS) remains unclear.
Methods: This study retrospectively analyzed 23,187 individuals who underwent health checkups at Taizhou Hospital’s health management center. Here, we investigated the relationship between sdLDL-C and MetS, along with its components, utilizing Spearman correlation analysis, receiver operating characteristic (ROC) curve analysis, logistic regression, and mediation analysis.
Results: The MetS group exhibited significantly higher level of sdLDL-C compared to the non-MetS group (P< 0.001). We observed a strong correlation between sdLDL-C and several key factors: TG (r = 0.711), TC (r = 0.672), LDL-C (r = 0.781), GGT (r = 0.420), and HDL-C (r = − 0.417). After adjusting for age and gender, the odds ratio (OR) (95% confidence interval [CI]) for MetS incidence in the second, third, and fourth quartiles versus the first quartile of sdLDL-C concentration were 2.264 (95% CI: 1.851, 2.770), 4.053 (95% CI: 3.350, 4.903), and 9.034 (95% CI: 7.531, 10.837). The optimal cut-off value for diagnosing MetS using sdLDL-C was determined to be 0.98 mmol/L, with an area under the ROC curve (AUC) of 0.716 (95% CI: 0.705, 0.726). Additionally, mediation analysis revealed that sdLDL-C mediated a 12.8% correlation between GGT and TG concentration.
Conclusion: The sdLDL-C is correlated with MetS and it can successfully mediate the relationship between GGT and TG. Our data suggests that sdLDL-c and GGT are suitable parameters for preventing and monitoring MetS.
Keywords: metabolic syndrome, small dense low-density lipoprotein cholesterol, mediation analysis, GGT
Introduction
Metabolic syndrome (MetS) is a group of clinical syndromes characterized by central obesity, impaired glucose regulation, or diabetes, lipid metabolism disorder, and hypertension, with insulin resistance (IR) as the common pathophysiological basis.1 MetS not only increases the risk of cardiovascular disease (CVD) and diabetes but is also related to potential surging mortality rates of patients diagnosed with CVDs.2,3 Related research shows that MetS patients have a 5-fold higher risk of type 2 diabetes and a 3-fold higher risk of stroke and myocardial infarction than healthy subjects.4 According to currently available epidemiological data, in most countries around the world, 20% to 30% of adults suffer from MetS, and there is still a growing trend of affected individuals fighting against this condition.5
The pathogenesis of MetS remains unclear. IR is considered to be the core of MetS, and obesity, abnormal fat distribution, leptin, tumor necrosis factor, adiponectin, oxidative stress, and other inflammatory factors also play a certain role in the occurrence and development of the syndrome.6–8 In addition, these related mechanisms may vary depending on age.9,10 The components of MetS are not isolated; they interact with each other. In MetS, dyslipidemia is associated with IR and type 2 diabetes,11 and diagnosed obese patients are often accompanied by dyslipidemia.12 Abnormal blood lipids, including elevated levels of sdLDL-C, triglycerides (TG), very low-density lipoprotein (VLDL), and apolipoprotein-B, as well as decreased levels of high-density lipoprotein cholesterol (HDL-C)12 can also be considered diagnostic components of MetS, especially high TG and low-level HDL-C. SdLDL-C levels are often elevated in MetS patients, but their impact on MetS has not been clearly evaluated.
A small sample size study confirmed that the levels of sdLDL-C in patients with MetS were significantly higher than those in the healthy control group.13 Another similar study showed that high concentrations of sdLDL-C are a risk factor for MetS in the male population.14 Based on the previous outcomes confirmed within the medical community, this study aims to explore the diagnostic value and interrelationships of sdLDL-C in MetS by incorporating large sample size data from both male and female populations.
Method
Patient
The individuals who underwent routine physical examinations at the Health Management Center of Taizhou Hospital from January 1, 2022, to December 31, 2022 were analyzed retrospectively. The population undergoing physical examination are all permanent residents of Taizhou City, mainly from the working class. A set of specific criteria was used to determine the population to be included and excluded. Individuals who met the following criteria were included in the study: (1) aged 18 years or older, and (2) had taken part in both routine physical examinations and blood tests. The following individuals were excluded from the study: (1) patients diagnosed with cancer; (2) patients with viral hepatitis or individuals suffering from long-term chronic liver diseases; and (3) patients with autoimmune diseases, including rheumatoid arthritis and systemic lupus erythematosus. Initially, a total of 24,287 adults underwent physical examinations for this study. Through the careful application of the inclusion and exclusion criteria, the final sample size comprised 23187 individuals. The age range of the participants varied from 18 to 101 years old (average age: 51.3 ± 13.9 years). There were 12471 males (53.8%) and 10716 females (46.2%). The methodology was approved by the Medical Ethics Committee of Taizhou Hospital in Zhejiang Province, affiliated with Wenzhou Medical University (#K20230924). Because of the retrospective design of this study, the Medical Ethics Committee of Taizhou Hospital of Zhejiang Province exempted patient informed consent. This research did not affect the patients’ health and privacy.
Data Collection
First, we measured the height and weight of the subjects to obtain a body mass index (BMI, kg/m²) and also measured their systolic blood pressure (SBP) and diastolic blood pressure (DBP) using an Omron HEM-7200 blood pressure meter. The patients underwent blood collection procedures from 7 am to 8 am and EDTA-K2 anticoagulant samples were measured using a Sysmex 2100D routine hematology analyzer for platelet (PLT), white blood cell (WBC), red blood cell (RBC) counts. A Beckman Coulter AU5800 autoanalyzer was used to detect the serum concentrations of alanine aminotransferase (ALT), γ-glutamyl transpeptidase (GGT), alkaline phosphatase (ALP), aspartate aminotransferase (AST), total bilirubin (TB), albumin (ALB), total protein (TP), blood urea nitrogen (BUN), serum creatinine (Scr), uric acid (UA), fasting plasma glucose (FPG), triglycerides (TG), total cholesterol (TC), low-density lipoprotein cholesterol (LDL-C), high-density lipoprotein cholesterol (HDL-C), sdLDL-C and C-reactive protein (CRP). All participants’ height, weight, blood pressure measurements, and blood collection were completed in the morning on an empty stomach and at rest. After collecting the relevant test results of the subjects, the data was added to a physical examination record system.
Diagnostic Criteria
According to the MetS diagnostic criteria recommended by the Chinese Medical Association Diabetes Branch, if the patient has three or all of the following four components, the diagnosis of MS is confirmed: (1) Overweight and/or obesity: BMI ≥ 25.0 (kg/m2); (2) Hyperglycemia: FPG ≥ 6.1 mmol/L (110 mg/dL) and/or 2hPG ≥ 7.8 mmol/L (140 mg/dL), and/or those who have been diagnosed with diabetes and treated; (3) Hypertension: SBP/DBP ≥ 140/90 mmHg, and/or confirmed as hypertension and treated; (4) Blood lipid disorders: fasting blood TG ≥ 1.7 mmol/L (150 mg/dL), and/or fasting blood HDL-C <0.9 mmol/L (male) or <1.0 mmol/L (female). According to the above diagnostic criteria, patients were divided into MS group and non-MS group, and the subject population also was divided into groups 0, 1, 2, 3, and 4 based on the number of abnormal MetS components. In addition, considering the various parameters mentioned above, we proposed the following metabolic disorder criteria for various MetS diagnostic indicators: ① High BMI: BMI ≥ 25.0 (kg/m2); ② High TG: TG ≥ 1.7 mmol/L; ③ Low HDL-C: HDL-C<0.9 mmol/L (male) or <1.0 mmol/L (female); ④ High SBP: SBP ≥ 140 mmHg; ⑤ High DBP: DBP ≧ 90mmHg; ⑥ High FPG: FPG ≥ 6.1mmol/L. Dyslipidmia refer to blood lipid disorders. In addition, according to the quartile of sdLDL-C concentration, the subjects were divided into Q1 group (sdLDL-C: < 0.67 mmol/L), Q2 group (sdLDL-C: 0.67–0.89 mmol/L), Q3 group (sdLDL-C: 0.90–1.15 mmol/L), and Q4 group (sdLDL-C: ≥1.16 mmol/L).
Statistical Analysis
To compare baseline parameters between MetS and non-MetS groups, the independent sample t–test was used when the data was normally distributed and expressed as mean standard deviation. In addition, we used the Mann–Whitney U-test when the data was not normally distributed and expressed as p50% (p25%, p75%). The differences between categorical variables were compared using the Chi-Squared test. The receiver operating characteristic (ROC) curve is used to explore the diagnostic value of sdLDL-C, sdLDL-C/HDL-C ratio, and sdLDL-C/LDL-C ratio for MetS. We also relied on logistic regression analysis to explore the occurrence of MetS subjects under the quartile grouping of sdLDL-C concentration. The above statistical analysis was conducted using SPSS (version 24.0). Mediation analysis was used to explore the potential relationship between sdLDL-C and various components of MetS and was conducted by R (version 4.1.3, Austria). A two-tailed P value <0.05 was considered statistically significant.
Result
Baseline Characteristics of Subjects
As aforementioned, a total of 23187 subjects were included in this study, ranging in age from 18 to 101 years old, including 12471 males (53.8%) and 10716 females (46.2%). Among the participants, 2241 (9.7%) were MetS patients. The proportion of male patients, Age, SBP, DBP, BMI, RBC, WBC, ALT, AST, ALP, GGT, TP, ALB, Scr, BUN, UA, FPG, CRP, TG, TC, LDL-C, sdLDL-C, sdLDL-C / HDL-C ratio, sdLDL-C / LDL-C ratio in MetS group was significantly higher than that of the non-MetS group (all P < 0.05), and HDL-C was significantly lower than that of the non-MetS group (P < 0.001). There was no difference in PLT and TB between the two groups (Table 1). The concentration of sdLDL-C surges with the increase in the number of MetS components (Figure 1A). The average concentrations of sdLDL-C in groups 0, 1, 2, 3, and 4 were 0.77 mmol/L, 0.91 mmol/L, 1.05 mmol/L, 1.15 mmol/L, 1.22 mmol/L, respectively. The sdLDL-C / LDL-C and sdLDL-C / HDL-C ratios also increased with the growth in the number of MetS components (Figure 1B and C)
 |
Table 1 Baseline Characteristics of the Study Participants |
 |
Figure 1 Serum sdLDL-C concentration (A), sdLDL-C/HDL-C ratio (B) and sdLDL-C/LDL-C ratio (C) according to the number of MetS components. |
Correlation Coefficients of sdLDL-C and MetS-Related Parameters
Table 2 shows that there is a strong positive correlation between sdLDL-C and TG (r=0.711), TC (r=0.672), LDL-C (r=0.781), and GGT (r=0.420), while there is a strong negative correlation between sdLDL-C and HDL-C (r=−0.417).
 |
Table 2 The Correlation of Serum sdLDL-c Concentration and MetS-Related Parameters |
Risk of MetS and Its Related Component Abnormalities Under Different Quartile sdLDL-C Concentrations
After age and gender calibration we identified that, compared with Q1 level (<0.67 mmol/L), the OR (95% CI) of Q4 level subjects for MetS, high SBP, high DBP, hypertension, high BMI, high FPG, high TG, low HDL-C, dyslipidemia were 9.034 (7.531, 10.837), 1.768 (1.609, 1.942), 2.417 (2.142, 2.727), 1.896 (1.733, 2.074), 1.142 (1.058, 1.233), 2.215 (1.966, 2.496), 80.339 (68.076, 94.811), 3.343 (2.548, 4.387), 64.222 (55.214, 74.700) respectively (Table 3).
 |
Table 3 Odds Ratios for MetS and Its Related Abnormalities Under Different Quartile sdLDL-C Concentrations |
The Diagnostic Value of sdLDL-C, sdLDL-C/HDL-C Ratio, and sdLDL-C/LDL-C Ratio for MetS
The optimal cut-off values of sdLDL-C, sdLDL-C/HDL-C, and sdLDL-C/LDL-C ratios in the case of diagnosed MetS is 0.98 mmol/L, 0.71, and 0.33, respectively (Table 4). The ROC curve is shown in Figure 2, and area under the curve (AUC) of sdLDL-C and sdLDL-C/HDL-C ratio, sdLDL-C/LDL-C ratio is 0.716 (0.705, 0.726), 0.729 (0.719, 0.739), 0.760 (0.751, 0.770), while sdLDL-C, sdLDL-C/HDL-C, and sdLDL-C/LDL-C ratios achieved good negative predictive value (NPV), with 95.4%, 96.0%, and 96.5%, respectively (Table 4 and Figure 2).
 |
Table 4 The Diagnostic Value of sdLDL-C, sdLDL-C / HDL-C Ratio, sdLDL-C / LDL-C Ratio in MetS |
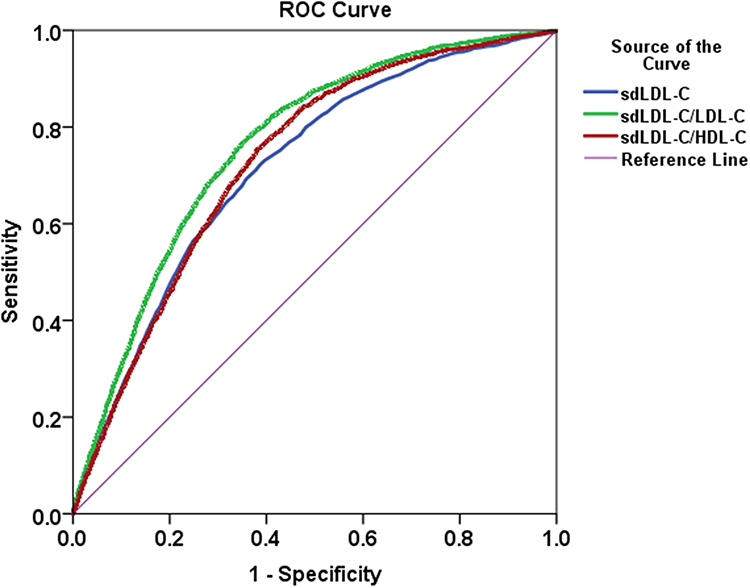 |
Figure 2 Receiver operating characteristic (ROC) curve of sdLDL-C, sdLDL-C/HDL-C ratio, sdLDL-C/LDL-C ratio diagnostic MetS. |
The mediating effects of sdLDL-C on MetS related components (TG, SBP, DBP, GLU, BMI, HDL-C)
Additionally, due to the strong correlation between GGT and sdLDL-c (Table 2), we also had to analyze the effects of sdLDL-C mediated GGT on MetS related components. As shown in Figure 3, sdLDL-C mediated a correlation of 7.5% between HDL-C and BMI concentration (mediation effect = 0.0767, P = 0.030), 4.8% between HDL-C and TG concentration (mediation effect = −0.0871, P = 0.028), −5.3% between HDL-C and GGT (mediation effect = −1.685, P = 0.022), and 12.8% between GGT and TG (mediation effect = 0.0004, P = 0.014).
 |
Figure 3 Path diagram of the mediation analysis of sdLDL-C on MetS-related components. |
Discussion
This study involved 23,187 subjects and their medical data was used to explore the differences in serum sdLDL-C concentrations between MetS patients and non-MetS patients. Our analyses confirmed that the risk of MetS occurrence is associated with serum sdLDL-C concentrations and also helped us identify the diagnostic value of sdLDL-C for MetS. Finally, we conducted a mediation analysis to explore the relationship between various components of MetS mediated by sdLDL-C.
The sdLDL-C is a unique subclass of LDL-C, widely believed to be associated with the occurrence and development of CVD15 and considered a potential risk factor for atherosclerosis.16 In T2DM patients, an increase in serum sdLDL-C may increase the severity of coronary heart disease.17 The many changes of sdLDL-C in cardiovascular and metabolic diseases collaborated to amplify the study and conclusions regarding its clinical application. SdLDL is currently identified as a risk factor for CVD by the National Cholesterol Education Program18 and past research suggests that sdLDL-C is recommended for screening familial hyperlipidemia in large populations.19 The measurement of sdLDL-C is encouraged as a routine item for lipid profile screening, in order to prevent, evaluate, and monitor the treatment of CVD.20
Our outcomes confirmed that, compared with non-MetS patients, the sdLDL-C, sdLDL-C/LDL-C ratio, and sdLDL-C/HDL-C ratio of MetS patients were significantly increased. These results are similar to the data presented in a related Korean study in which the levels of sdLDL-C in MetS patients were significantly higher than those in healthy controls.13 The study showed a good correlation between TG levels and sdLDL-C concentrations, revealing that TG is one of the most important contributors to sdLDL-C concentration and sdLDL-C/LDL-C ratio.13 In our results, the concentration of sdLDL-C surges with the increase in the number of MetS components. Also, sdLDL-C is mainly positively correlated with TG, TC, LDL-C, and negatively correlated with HDL-C. This suggests that sdLDL-C may be associated with MS through its lipid metabolism regulatory function.
We relied on data regarding sdLDL-C, sdLDL-C/LDL-C, and sdLDL-C/HDL-C ratios to diagnose MetS, and all three indicators achieved good diagnostic value, with sdLDL-C/LDL-C ratio achieving the highest AUC. Another related study showed that the serum levels of sdLDL-C in MS patients were higher than those in non-MetS patients. Compared with the levels of sdLDL-C ratio and LDL-C, the correlation between sdLDL-C/LDL-C ratio and various parameters related to MetS was closer, and weight loss led to a significant decrease in the sdLDL-C/LDL-C ratio.21 We explored the prevalence of MetS and its components under different quartile concentrations of sdLDL-C and found that high concentrations of sdLDL-C were risk factors for the occurrence of MetS and its components. All the studies mentioned above revealed that sdLDL-C is a marker of MetS.
We further explored the relationship between sdLDL-C and various components of MetS through mediation analysis and sdLDL-C mediated a correlation of 7.5% between HDL-C and BMI (mediation effect = 0.0767), 4.8% between HDL-C and TG (mediation effect = −0.0871), −5.3% between HDL-C and GGT (mediation effect = −1.685). HDL-C is considered as “good cholesterol”, and is involved in the entire process of cholesterol reverse transport.22 In previous studies, researchers found a negative correlation between plasma HDL-C levels and CVD risk.23 Reduced HDL-C levels are the diagnostic criteria for MetS and according to our data, sdLDL-C is negatively correlated with HDL-C (r = −0.417), this is consistent with the results of the mediating effect.
Another mediation analysis on MetS showed that sdLDL-C mediated a 38.6% correlation between waist circumference and TG concentration, as well as a 13.5% correlation between waist circumference and FPG.14 However, this specific study explored the male population, while our study explored both male and female populations. We also found that sdLDL-C mediated a correlation of 12.8% between GGT and TG. GGT is a glycosylated protein on the surface of cell membranes and is an enzyme involved in the metabolism of glutathione and cysteine since it can maintain the homeostasis of glutathione and cysteine.24 GGT has been widely used as a marker for liver dysfunction, bile duct damage, and alcohol intake.25,26 In addition, elevated GGT activity plays an important role in the occurrence and development of CVD, MetS, and atherosclerosis.26 A meta-analysis of prospective studies confirmed the positive correlation between GGT levels and the risk of MetS, but not with alcohol consumption, proposing that GGT may be a promising biomarker for predicting MetS.27 Our results further revealed the existence of an intrinsic relationship between GGT and MetS through mediation analysis, shedding light on the fact that GGT and sdLDL-C can serve as biomarkers of MetS.
Advantage and Limitation: Advantages: This is a large sample size study that includes both male and female populations. Limitation: the populations of this study with an incidence of MetS of 9.7%, which is slightly lower than the current prevalence of MetS in China. The reason behind this difference may be that the population in this study is limited to southern cities in China, with the majority being working class, mainly Han Chinese. Related research data shows that the epidemiology of MetS in China can increase from 3.6% to 21.68% with age, and there are significant differences in the prevalence of MetS among different ethnic groups in China.28 There are also reports confirming that the prevalence of MetS among Chinese adults has increased from 9.5% in 2002 to 18.7% from 2010 to 2012, with the fastest growth occurring among young people, rural residents, and impoverished families.29 Therefore, we plan to amplify our analysis in the future and conduct relevant research through a multicenter, involving a multi-ethnic population.
In summary, the data presented here confirmed that high-level sdLDL-C is a risk factor for MetS, and sdLDL-C has good diagnostic efficacy for MetS, especially with superior NPV. Our mediation analysis revealed that sdLDL-C can mediate the relationship between HDL-C and BMI, TG, and GGT, and sdLDL-C can also mediate the relationship between GGT and TG. In conclusion, sdLDL-C may affect the occurrence and development of MS by participating in lipid metabolism and regulation of GGT activity, and it can be used as a potential molecular marker for the diagnosis of MetS.
Data Sharing Statement
Dataset used during the current study is available from the corresponding author (Jinxi Hu) on request.
Ethical Approval and Informed Consent
All procedures performed in the studies involving human participants accorded with the ethical standards of the Medical Ethics Committee of Taizhou Hospital of Zhejiang Province (#K20230924), and with the 1964 Helsinki Declaration and its later amendments, or other comparable ethical standards.
Author Contributions
All authors made a significant contribution to the work reported, whether that is in the conception, study design, execution, acquisition of data, analysis, and interpretation, or in all these areas; took part in drafting, revising, or critically reviewing the article; gave final approval of the version to be published; have agreed on the journal to which the article has been submitted; and agree to be accountable for all aspects of the work.
Funding
The Taizhou Social Development Science and Technology Project (#23ywb25) supported this work.
Disclosure
The authors report no conflicts of interest in this work.
References
1. Eckel RH, Alberti KG, Grundy SM, Zimmet PZ. The metabolic syndrome. Lancet. 2010;375(9710):181–183. doi:10.1016/S0140-6736(09)61794-3
2. Mendrick DL, Diehl AM, Topor LS, et al. Metabolic syndrome and associated diseases: from the bench to the clinic. Toxicol Sci. 2018;162:36–42. doi:10.1093/toxsci/kfx233
3. Masrouri S, Moazzeni SS, Cheraghloo N, Azizi F, Hadaegh F. The clinical value of metabolic syndrome and its components with respect to sudden cardiac death using different definitions: two decades of follow-up from the Tehran lipid and glucose study. Cardiovasc Diabetol. 2022;21:269. doi:10.1186/s12933-022-01707-1
4. Zafar U, Khaliq S, Ahmad HU, Manzoor S, Lone KP. Metabolic syndrome: an update on diagnostic criteria, pathogenesis, and genetic links. Hormones. 2018;17:299–313. doi:10.1007/s42000-018-0051-3
5. Aguilar M, Bhuket T, Torres S, Liu B, Wong RJ. Prevalence of the metabolic syndrome in the United States, 2003–2012. JAMA. 2015;313:1973–1974. doi:10.1001/jama.2015.4260
6. Taghizadeh S, Alizadeh M. The role of lipids in the pathogenesis of metabolic syndrome in adolescents. Exp Clin Endocrinol Diabetes. 2018;126:14–22. doi:10.1055/s-0043-106439
7. Kim JE, Kim JS, Jo MJ, et al. The roles and associated mechanisms of adipokines in development of metabolic syndrome. Molecules. 2022;27:1.
8. Towfighi A, Ovbiagele B. Metabolic syndrome and stroke. Curr Diab Rep. 2008;8:37–41. doi:10.1007/s11892-008-0008-z
9. Dziegielewska-Gesiak S, Muc-Wierzgon M. Inflammation and oxidative stress in frailty and metabolic syndromes-two sides of the same coin. Metabolites. 2023;13. doi:10.3390/metabo13040475
10. Dziegielewska-Gesiak S, Wyszomirska K, Fatyga E, Wysocka E, Muc-Wierzgon M. The role of oxidant-antioxidant markers and resistin in metabolic syndrome elderly individuals. Sci Prog. 2021;104(2):368504211006510. doi:10.1177/00368504211006510
11. Adiels M, Olofsson SO, Taskinen MR, Boren J. Overproduction of very low-density lipoproteins is the hallmark of the dyslipidemia in the metabolic syndrome. Arterioscler Thromb Vasc Biol. 2008;28:1225–1236. doi:10.1161/ATVBAHA.107.160192
12. Nikolic D, Katsiki N, Montalto G, Isenovic ER, Mikhailidis DP, Rizzo M. Lipoprotein subfractions in metabolic syndrome and obesity: clinical significance and therapeutic approaches. Nutrients. 2013;5:928–948. doi:10.3390/nu5030928
13. Cho Y, Lee SG, Jee SH, Kim JH. Hypertriglyceridemia is a major factor associated with elevated levels of small dense LDL cholesterol in patients with metabolic syndrome. Ann Lab Med. 2015;35:586–594. doi:10.3343/alm.2015.35.6.586
14. Fan J, Liu Y, Yin S, et al. Small dense LDL cholesterol is associated with metabolic syndrome traits independently of obesity and inflammation. Nutr Metab. 2019;16. doi:10.1186/s12986-019-0334-y
15. Liou L, Kaptoge S. Association of small, dense LDL-cholesterol concentration and lipoprotein particle characteristics with coronary heart disease: a systematic review and meta-analysis. PLoS One. 2020;15:e0241993. doi:10.1371/journal.pone.0241993
16. Jin X, Yang S, Lu J, Wu MS. Dense low-density lipoprotein-cholesterol and atherosclerosis: relationship and therapeutic strategies. Front Cardiovasc Med. 2021;8:804214. doi:10.3389/fcvm.2021.804214
17. Huang J, Gu JX, Bao HZ, et al. Elevated serum small dense low-density lipoprotein cholesterol may increase the risk and severity of coronary heart disease and predict cardiovascular events in patients with type 2 diabetes mellitus. Dis Markers. 2021;2021:5597028. doi:10.1155/2021/5597028
18. National Cholesterol Education Program Expert Panel on Detection, E. Treatment of high blood cholesterol in, A. Third report of the National Cholesterol Education Program (NCEP) expert panel on detection, evaluation, and treatment of high blood cholesterol in adults (adult treatment panel iii) final report. Circulation. 2002;106:3143–3421. doi:10.1161/circ.106.25.3143
19. Hirano T, Nohtomi K, Sato Y, Kamata K, Ito Y. Small dense LDL-cholesterol determined by a simple precipitation assay for screening familial combined hyperlipidemia. Atherosclerosis. 2009;205:603–607. doi:10.1016/j.atherosclerosis.2009.01.009
20. Santos HO, Earnest CP, Tinsley GM, Izidoro LFM, Macedo RCO. Small dense low-density lipoprotein-cholesterol (sdLDL-C): analysis, effects on cardiovascular endpoints and dietary strategies. Prog Cardiovasc Dis. 2020;63:503–509. doi:10.1016/j.pcad.2020.04.009
21. Satoh N, Wada H, Ono K, et al. Small dense LDL-cholesterol relative to LDL-cholesterol is a strong independent determinant of hypoadiponectinemia in metabolic syndrome. Circ J. 2008;72:932–939. doi:10.1253/circj.72.932
22. Zhang Q, Ke Y, Hong H. HDL and Lipid Metabolism. Adv Exp Med Biol. 2022;1377:49–61.
23. Hovingh GK, Rader DJ, Hegele RA. HDL re-examined. Curr Opin Lipidol. 2015;26:127–132. doi:10.1097/MOL.0000000000000161
24. Jiang S, Jiang D, Tao Y. Role of gamma-glutamyltransferase in cardiovascular diseases. Exp Clin Cardiol. 2013;18:53–56.
25. Whitfield JB. Gamma glutamyl transferase. Crit Rev Clin Lab Sci. 2001;38:263–355. doi:10.1080/20014091084227
26. Neuman MG, Malnick S, Chertin L. Gamma glutamyl transferase - an underestimated marker for cardiovascular disease and the metabolic syndrome. J Pharm Pharm Sci. 2020;23:65–74. doi:10.18433/jpps30923
27. Liu CF, Zhou WN, Fang NY. Gamma-glutamyltransferase levels and risk of metabolic syndrome: a meta-analysis of prospective cohort studies. Int J Clin Pract. 2012;66:692–698. doi:10.1111/j.1742-1241.2012.02959.x
28. Qin X, Qiu L, Tang G, et al. Prevalence of metabolic syndrome among ethnic groups in China. BMC Public Health. 2020;20:297. doi:10.1186/s12889-020-8393-6
29. He Y, Li Y, Bai G, et al. Prevalence of metabolic syndrome and individual metabolic abnormalities in China, 2002–2012. Asia Pac J Clin Nutr. 2019;28:621–633. doi:10.6133/apjcn.201909_28(3).0023
 © 2024 The Author(s). This work is published and licensed by Dove Medical Press Limited. The
full terms of this license are available at https://www.dovepress.com/terms
and incorporate the Creative Commons Attribution
- Non Commercial (unported, 3.0) License.
By accessing the work you hereby accept the Terms. Non-commercial uses of the work are permitted
without any further permission from Dove Medical Press Limited, provided the work is properly
attributed. For permission for commercial use of this work, please see paragraphs 4.2 and 5 of our Terms.
© 2024 The Author(s). This work is published and licensed by Dove Medical Press Limited. The
full terms of this license are available at https://www.dovepress.com/terms
and incorporate the Creative Commons Attribution
- Non Commercial (unported, 3.0) License.
By accessing the work you hereby accept the Terms. Non-commercial uses of the work are permitted
without any further permission from Dove Medical Press Limited, provided the work is properly
attributed. For permission for commercial use of this work, please see paragraphs 4.2 and 5 of our Terms.