
Back to Journals » International Journal of General Medicine » Volume 19
The Relationship Between Magnetic Resonance Diffusion Tensor Imaging Parameters and Muscle Dysfunction in Patients with Osteoporosis: A Cross-Sectional Retrospective Study
Authors Wang H, Yang Y, Cui J, Wang Y, Zhang C, Guo Z, Zheng D
Received 29 August 2025
Accepted for publication 10 April 2026
Published 23 April 2026 Volume 2026:19 560521
DOI https://doi.org/10.2147/IJGM.S560521
Checked for plagiarism Yes
Review by Single anonymous peer review
Peer reviewer comments 2
Editor who approved publication: Dr Woon-Man Kung
Hui Wang,1,* Yueying Yang,2,* Jie Cui,1 Ying Wang,1 Chen Zhang,1 Zhiming Guo,1 Dong Zheng1
1Department of Radiology, Ninth Medical Center of PLA General Hospital, Beijing, 100101, People’s Republic of China; 2Department of Endocrinology, Ninth Medical Center of PLA General Hospital, Beijing, 100101, People’s Republic of China
*These authors contributed equally to this work
Correspondence: Dong Zheng, Ninth Medical Center of PLA General Hospital, No. 9, Anxiang Beili, Chaoyang District, Beijing, 100101, People’s Republic of China, Email [email protected]
Objective: To explore the relationship between magnetic resonance (MR) diffusion tensor imaging (DTI) parameters and muscle dysfunction in patients with osteoporosis (OP), and provide a basis for clinical diagnosis and treatment.
Methods: A retrospective study was conducted on 100 patients with osteoporosis treated in Ninth Medical Center of PLA General Hospital from January 2021 to January 2024. All patients underwent DTI examination and evaluated according to the Lovett muscle strength grading system (0– 5 levels). Patients with muscle strength grades 0– 3 were defined as the group with poor muscle function (n=31) and good muscle function (grades 4– 5, n=69). The affecting factors were analyzed through logistic regression model. Pearson model was used to analyze the correlation.
Results: The fraction anisotropy (FA) values of the gluteus maximus, gracilis, rectus femoris, adductor femoris, and long adductor femoris in the poor group were all lower than the good group (all P< 0.05). The apparent diffusion coefficient (ADC) values of the gracilis muscle (1.02 ± 0.34 mm2/s vs 1.74 ± 0.41 mm2/s), adductor femoris muscle (1.07 ± 0.33 mm2/s vs 1.76 ± 0.38 mm2/s), and long adductor femoris muscle (1.04 ± 0.34 mm2/s vs 1.68 ± 0.34 mm2/s) were all lower than the good group (all P< 0.05). FA decrease and ADC increase in the adductor major and adductor longus muscles were independent factors affecting thigh muscle dysfunction (P< 0.05). The weakening of OP muscle function was positively correlated with the decrease of muscle FA and ADC (P< 0.05). The AUC predicted by the combination of FA and ADC was 0.722 (95% CI: 0.6239– 0.821), higher than those predicted by a single parameter (P< 0.05).
Conclusion: There is a correlation between DTI parameters FA and ADC in different muscle parts and the occurrence of muscle dysfunction, and they have potential predictive value for muscle dysfunction in OP patients.
Keywords: diffusion tensor imaging, magnetic resonance, osteoporosis, muscle microstructure, muscle function
A Letter to the Editor has been published for this article.
Introduction
Osteoporosis (OP) is a pathological condition characterized by decreased bone density and degeneration of bone tissue microstructure, mainly affecting middle-aged and elderly people.1 OP has become an important public health issue worldwide. According to statistics, the global incidence of OP among people aged 50–85 is approximately 21.7%,2 and about one-third of women and one-fifth of men over the age of 50 will experience osteoporotic fractures.3 In China, according to the first national epidemiological survey conducted by the National Health Commission, the incidence rate among people aged 65 and above is 32.0%, with 51.6% for women and 10.7% for men.4 In clinical practice, OP patients mainly present with bone pain, spinal deformities, and even fractures, posing a significant threat to their health and safety.
Research has shown that there is an interaction between bones and muscles, mainly achieved through mechanical stimulation and the secretion of related active factors.5 The decline in immune function, endocrine system disorders, and hormonal imbalances can collectively affect the balance between bone formation and bone resorption, leading to damage to skeletal muscle fibers and decreased muscle function, thereby further promoting the progression of OP.6 Diffusion Tensor Imaging (DTI) technology is an imaging technique based on the anisotropy of water molecule diffusion, which can non-invasively reflect the diffusion of water molecules in the body and reproduce the course of muscle fibers through specific software.7 The microstructural changes revealed by DTI are highly disease-specific. For instance, in stroke research, DTI is mainly used to assess nerve fiber damage and the function of the brain’s lymphoid-like system. In oncology, it is used to monitor changes in cell density caused by treatment.8 For OP, the core issue lies in the interaction between the “bone-muscle” unit. The imbalance of the bone microenvironment in OP patients can lead to secondary skeletal muscle disorders, manifested as muscle fiber atrophy, fat infiltration, and fibrosis. The DTI parameters, namely the fractional anisotropy (FA) and the mean diffusion (MD), can non-invasively quantify the disordered arrangement of these muscle fibers and the changes in the water diffusion environment of the tissues, thereby providing unique imaging biomarkers for understanding the muscle strength decline in patients with OP.9 However, there has been no research on the application of DTI technique in the diagnosis and treatment of muscle weakness in OP patients. One of the core pathologies of muscle dysfunction in OP patients is the structural degeneration of muscle fibers. DTI can non-invasively quantify OP related muscle fiber structural changes, indicating that DTI may not only detect muscle fiber structural abnormalities in OP patients early, but also dynamically evaluate intervention efficacy.10
In this study, we aimed to conduct in-depth analysis of the muscle microstructure of OP patients through DTI, to explore the correlation between muscle FA and ADC parameters and muscle strength function, clarify the underlying pathological physiological basis, and preliminarily evaluate the potential of these imaging parameters in identifying muscle strength decline, in order to provide new imaging evidence for a deeper understanding of skeletal muscle complications in OP.
Materials and Methods
General Materials
A retrospective study was conducted on 100 patients who were diagnosed with OP and treated in Ninth Medical Center of PLA General Hospital during January 2021 to January 2024. Inclusion criteria: (1) The patients met the OP related diagnostic criteria who were diagnosed with both symptoms and bone density testing:11 T-score≤-2.5 standard deviations; Bone mass at the waist and hip were measured by DXA. Osteoporosis was diagnosed if either meets the osteoporosis criteria. (2) The patients were aged 60–70 years old. (3) The patients had not experienced any fractures in the past year. (4) The patient has signed a written informed consent form. Exclusion criteria: (1) Patients who had recently used drugs that affected muscle metabolism and muscle function (such as glucocorticoids, statins, etc). (2) The patients also had diabetes and other diseases that might affect muscle and bone metabolism. (3) The patients had concurrent malignant tumors. This study has been approved by the ethics committee of Ninth Medical Center of PLA General Hospital, and all operations were conducted in accordance with the principles of the Helsinki Declaration.
Demographic Data
A total of 100 patients were finally included. Among them, 47 were male and 53 were female; the age ranged from 62 to 68 years, with an average of (65.52 ± 1.33) years; the disease duration was 2 to 5 years, with an average of (3.14 ± 0.22) years; the body mass index (BMI) ranged from 22.56 to 26.10 kg/m2, with an average of (23.51 ± 1.03) kg/m2. The flowchart of the specific inclusion and exclusion cases was shown in Figure 1.
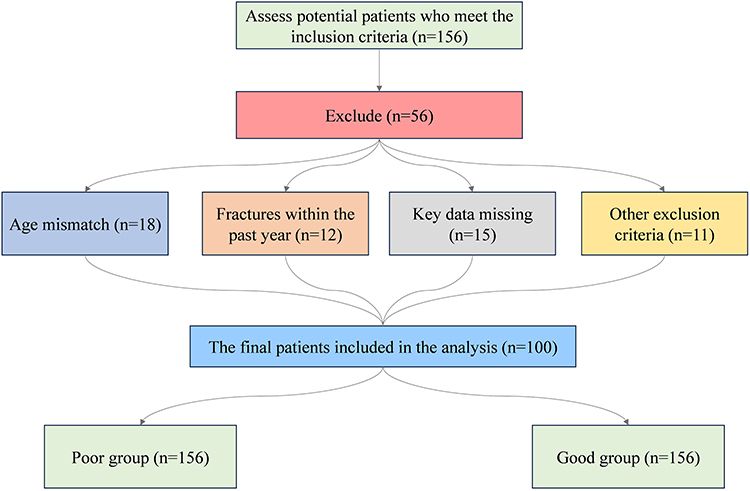 |
Figure 1 Flowchart of case inclusion. |
Methods
The US GE Premier 3.0 T MRI scanner was adopted, with a 16-channel flexible coil. To ensure that the subjects are in a resting state, they should avoid strenuous exercise before the examination and rest for 30 to 40 minutes before the scan. The images should be captured when the shoulder joints were in a naturally relaxed state. The patient was placed in a supine position with their head in front, lying flat on the examination bed with their thighs as close to the center of the magnet as possible. The lower limbs to be examined were kept in a standard neutral position with their toes pointing upwards. A large soft surface coil was wrapped around the middle and lower two-thirds of the thigh to be examined, and a soft cushion was placed behind it. Sandbags were placed on both sides to assist in fixation. At the same time, the legs were kept immobilized to avoid motion artifacts. Parameter settings: The axial scan range starts from the middle-upper third plane of the thigh to the middle of the patella, with the positioning line parallel to the course of the supraspinatus muscle. DTI adopted axial scanning with a repetition time (TR) of 6000 ms and an echo time (TE) of 89 ms, collecting 15 gradient coding directions, b=500 s/mm2, layer thickness of 3.5 mm, layer spacing of 0 mm, collecting 35 layers, F0V 240 mm × 240mm, matrix of 128 × 128mm, and scanning time of 3 min 18s (Figure 2).
 |
Figure 2 Comparison of DTI images and tractography of the right thigh. (A) DTI-FA color coded image; (B) DTI-FA grayscale image; (C) DTI-ADC image; (D) Tractography of the rectus femoris muscle in a patient with good muscle function; (E) Tractography of the rectus femoris muscle in a patient with poor muscle function; (F) Tractography of the gracilis muscle in a patient with good muscle function; (G) Tractography of the gracilis muscle in a patient with poor muscle function. |
The collected raw images were uniformly transmitted to the backend workstation (GE ADW 4.7 workstation), and the workstation Functool software were used for post-processing of DTI data. The computer automatically constructed the fraction anisotropy (FA) and apparent diffusion coefficient (ADC) images. Then it was superimposed on the PDWI fat-suppressed image. DTI adopted the axial position which was more convenient for the identification and measurement of muscles. Two physicians with more than 3 years of clinical imaging diagnosis experience analyzed. Regions of interest (ROI) were selected, and the FA and ADC of the thigh muscles (rectus femoris, gracilis femoris, adductor maximus, and adductor longus muscles) were measured at the same layer. The area of the selected ROI was approximately 35–40 mm2. It is preferably selected in the central part of the muscle belly, avoiding the fat infiltration area and the artifact area. After measuring each part three times, the average value is taken. Measurement on each part was repeated by 3 times and the average of the two parameters was calculated. Fiber tract imaging: the scanned DTI data was transmitted to the GE ADW4.7 workstation, the FiberTrack function was loaded, the muscles were delineated in the corresponding axial position, the fiber bundles passing through the muscles were selected for tracking, and the layers were removed to obtain a clear fiber tract imaging image (Figure 3A and B).
 |
Figure 3 Schematic diagram of the region of interest (ROI) selection method. Taking the axial DTI parameter map superimposed on the PDWI fat-suppressed image as an example, the selection position of the ROI was illustrated. The ROI area was approximately 35–40 mm2, selected in the central region of the muscle belly, avoiding fat infiltration, blood vessels, and artifact areas. Each site was measured three times and the average value was taken. (A) Axial FA Color-coded Image. Data processing was performed using DTI post-processing software on a GE ADW4.7 workstation to obtain an anisotropic (FA) color-coded image. (B) Axial T1WI Image. Axial spin echo (SE) sequence T1WI image: TR 600ms, TE 18s, FOV 28cm × 20cm, slice thickness 3mm, slice spacing 0.3mm. The meaning of white circles: Examples of outlining ROIs along the muscle contours in the rectus femoris and gracilis muscles. |
Muscle Function Assessment
After the patient was admitted to the hospital and before the DTI examination, a rehabilitation therapist who had received unified training measured the muscle function of the patient’s right lower limb (ie., the side for which the DTI scan was conducted) according to the standardized Lovett muscle strength grading method.12 To control the fluctuations during the day, all evaluations were conducted during a fixed period in the afternoon (14:00–16:00). The specific testing procedure was as follows: The patient was placed in a supine position and the tested limb is relaxed. The evaluator then sequentially tested the main movements such as hip flexion, extension, knee flexion, and extension. The muscle strength level was determined based on the patient’s ability to perform anti-gravity and resistance exercises: 0 level (no contraction); 1 level (slight contraction, no joint movement); 2 level (can move parallel to the bed surface, unable to resist gravity); 3 level (can complete full joint movements against gravity); 4 level (can perform activities under partial resistance); 5 level (can resist complete resistance, normal muscle strength). The therapist received specialized training specific to the research protocol before the assessment, and randomly selected 10% of the cases (10 cases) for independent assessment by another experienced therapist. The consistency of the two assessment results was good (Kappa = 0.87). The muscle strength levels 4 (able to resist partial resistance) and 5 (normal muscle strength) were defined as “good muscle function”, and muscle strength levels 0–3 (from complete paralysis to only being able to resist gravity) were defined as “muscle dysfunction”.
Statistical Analysis
Statistical analysis on clinical data was performed using SPSS 25.0, and the normally distributed quantitative data were presented in the form of ( ) and compared using t-test. The enumeration data were presented in the form of cases (%) and tested using χ2 or F-test. The sample size of this study (n=100) referred to the empirical rule in Logistic regression analysis that the number of events (ie. 31 cases of muscle dysfunction) should be at least 10 times the number of predictor variables.13 The number of predictor variables included in this study was less than 10, and the sample size basically met the analysis requirements. The muscle DTI parameters (FA and ADC values) that showed statistically significant differences between groups in the univariate analysis (P < 0.05) were selected as independent variables, and the muscle functional status (good = 0, poor = 1) was taken as the dependent variable, multivariate Logistic regression analysis was conducted to explore the independent influencing factors. Pearson correlation analysis was adopted, and the predictive performance of the relevant indicators was analyzed by the ROC curve. The area under the curve (AUC) and its 95% confidence interval were reported. According to the common standards for diagnostic accuracy studies,14 an AUC > 0.7 indicates an acceptable discrimination degree. When the P value was less than 0.05, it indicated that the difference was statistically significant.
Results
Comparison of the Muscle Function
Muscle function evaluation was conducted on 100 patients included in this study, with 31 cases (31%) of poor muscle function and 69 cases (69%) of good muscle function. As shown in Table 1, the two groups of patients had similar values in key baseline characteristics such as age (poor group: 65.31 ± 1.14 years vs. good group: 65.22 ± 1.06 years), disease duration (3.22 ± 0.31 years vs. 3.17 ± 0.19 years), and BMI (23.62 ± 1.02 kg/m2 vs. 23.48 ± 1.13 kg/m2). Subsequent statistical tests confirmed that these differences were not statistically significant (P > 0.05, Table 1). This indicated that the two groups were comparable in terms of major demographics and clinical aspects, providing a foundation for subsequent analyses.
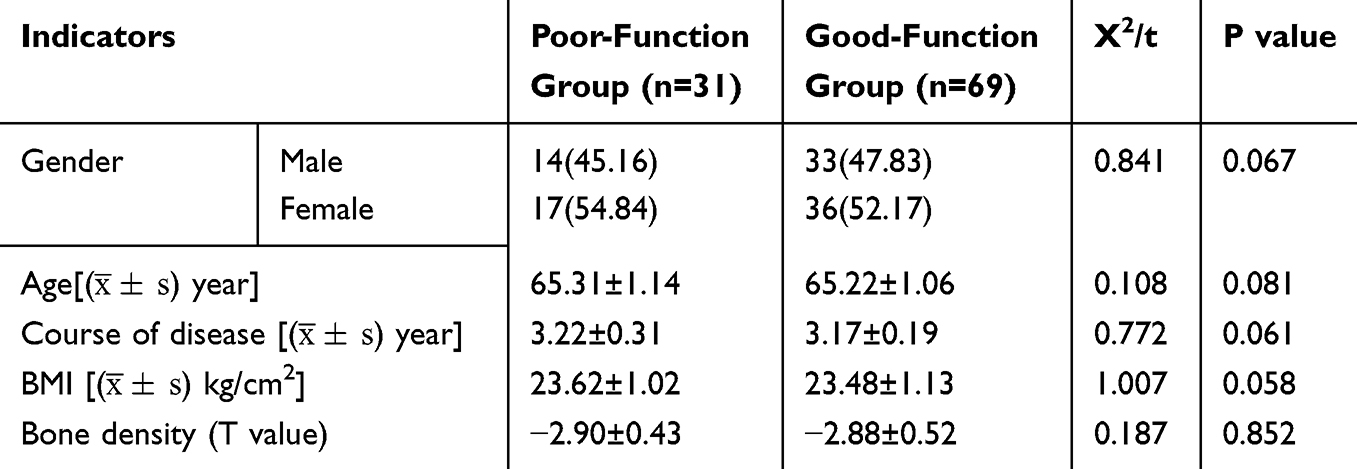 |
Table 1 Comparison of Clinical Basic Conditions of Patients with Different Muscle Functions |
Comparison of DTI Parameters Among Different Muscle Functional Groups
The measurement results of DTI parameters for each muscle in the two groups of patients were shown in Figure 4. In terms of FA values, the gluteus maximus, gracilis femoris, rectus femoris, adductor magnus, and adductor longus of the patients in the poor group were significantly lower than those in the good group (all P<0.05). In terms of ADC values, the gracilis femoris, adductor magnus, and adductor longus of patients in the poor group were significantly lower than those in the good group (all P<0.05). The FA and ADC values of the medial femoral muscle, the middle femoral muscle, and the lateral femoral muscle did not show statistical differences between the two groups (all P>0.05). The above results indicated that the patients in the group with poor muscle function had significantly lower FA values in the gluteus maximus, gracilis femoris, rectus femoris, adductor magnus, and adductor longus, as well as significantly lower ADC values in the gracilis femoris, adductor magnus, and adductor longus compared to the group with good muscle function. This suggested that the microstructural changes in these muscles may be related to the decline in muscle strength.
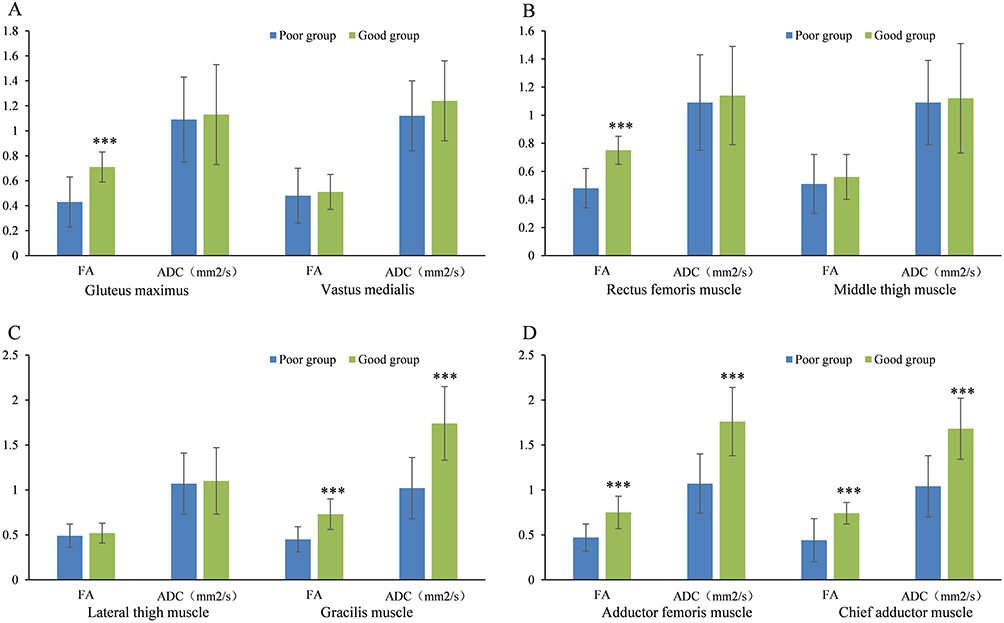 |
Figure 4 Comparison of DTI parameters of muscles in different muscle strength function groups. (A) Comparison of FA and ADC values of gluteus maximus and vastus medialis between the two groups; (B) Comparison of FA and ADC values of rectus femoris and vastus intermedius between the two groups; (C) Comparison of FA and ADC values of vastus lateralis and gracilis between the two groups; (D) Comparison of FA and ADC values of adductor magnus and adductor longus between the two groups. Note: *** P < 0.001 compared with the poor group. |
Multivariate Regression Analysis of Muscle Dysfunction in OP Patients
The muscle DTI parameters (FA of gluteus maximus, FA of gracilis femoris, FA of rectus femoris, FA of adductor magnus, FA of adductor longus, ADC of gracilis femoris, ADC of adductor magnus, ADC of adductor longus) that showed statistically significant differences between groups in the univariate analysis were selected as independent variables, and the muscle functional status (good = 0, poor = 1) was taken as the dependent variable for the multivariate Logistic regression analysis. The results were shown in Table 2.
 |
Table 2 Multivariate Regression Analysis of Muscle Dysfunction in OP Patients |
The analysis results showed that a decrease in FA of the adductor magnus (OR = 1.219, 95% CI: 0.643–3.148, P = 0.010) and a decrease in FA of the adductor longus (OR = 1.318, 95% CI: 0.787–4.846, P = 0.014) were independent risk factors for poor muscle function. That is, for every 1-unit decrease in the FA values of the adductor magnus and adductor longus, the risk of poor muscle function increased by 21.9% and 31.8%, respectively. The increased ADC values of the adductor magnus (OR = 0.427, 95% CI: 0.304–1.132, P = 0.001) and the increased ADC values of the adductor longus (OR = 0.129, 95% CI: 0.116–1.112, P = 0.020) were negatively correlated with poor muscle strength function, indicating protective factors. The FA values of the gluteus maximus, the gracilis femoris, the rectus femoris muscle, and the ADC value of the gracilis femoris did not show independent effects in the regression model (all P > 0.05).
Correlation Analysis Between Muscle DTI Parameters and Muscle Dysfunction
Pearson correlation analysis was conducted on the DTI parameters (FA value, ADC value) of the muscles and the muscle dysfunction in OP patients. The results were shown in Table 3. The analysis results indicated that the muscle weakness in OP patients was positively correlated with the decreased FA value of the muscles (r = 0.626, P = 0.001) and the decreased ADC value of the muscles (r = 0.644, P = 0.015). This suggested that the decrease in the FA value and ADC value of the muscles has a synchronous change trend with the aggravation of the muscle dysfunction degree, and the two have consistency in reflecting the muscle function status.
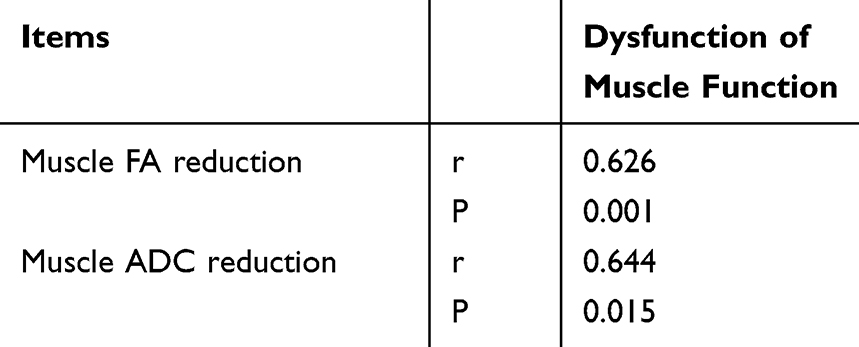 |
Table 3 Correlation Analysis of Muscle DTI Parameters with Muscle Strength Dysfunction |
The Efficacy of Muscle DTI Parameters in Predicting Muscle Dysfunction
The poor muscle unction of OP patients was regarded as the state variable, and the DTI parameters (FA of the adductor magnus, FA of the adductor longus, ADC values of the adductor magnus and ADC values of the adductor longus) with significant significance in the multivariate regression analysis as the test variables, the ROC curve was drawn (Figure 5). The efficacy indicators of each parameter’s individual and combined predictions were shown in Table 4. Among them, AUC of the combined prediction of FA and ADC was 0.722 (95% CI: 0.632–0.812), with a sensitivity of 90.2% (95% CI: 81.2–95.2%) and a specificity of 80.3% (95% CI: 70.1–88.1%). The AUC value of this combined prediction was higher than that of using FA or ADC alone for prediction. The results showed that the combined application of FA and ADC had a good predictive efficacy for muscle strength dysfunction in patients with OP. Its predictive accuracy, sensitivity and specificity are all superior to those of a single parameter, suggesting that the combined application of these two DTI parameters can more comprehensively assess the risk of muscle dysfunction.
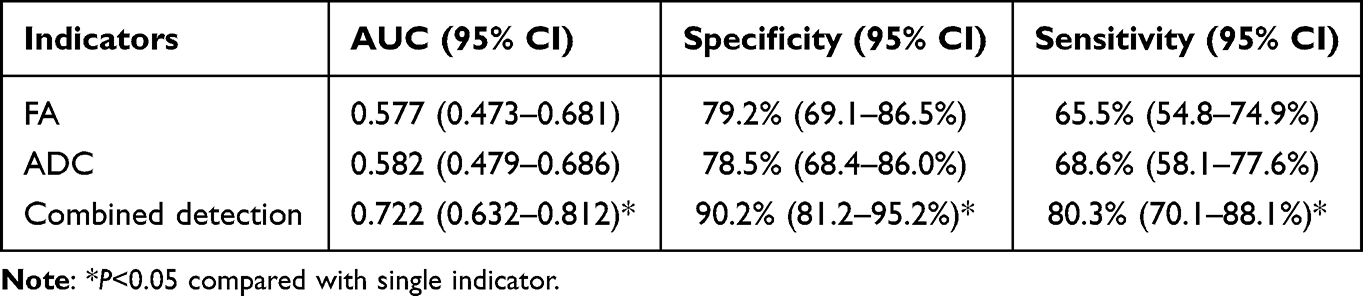 |
Table 4 The Efficacy of Muscle DTI Parameters in Predicting Muscle Dysfunction |
 |
Figure 5 ROC curve. |
Discussion
In this study, 100 OP patients were tested for muscle function, and 31.0% had poor muscle function, which is consistent with relevant research reports.15 All patients underwent DTI examination. The results showed that the poor-function group had lower FA values of gluteus maximus, gracilis femoris, rectus femoris, adductor femoris, and long adductor femoris in were lower than the good-function group (P<0.05), as well as lower ADC values of gracilis femoris, adductor femoris, and long adductor femoris than the good-function group (P<0.05). The possible reason may be that the presence of cell membranes inside muscle fibers restricts the diffusion of water molecules, especially in the longitudinal direction of the cell, where the diffusion rate of water molecules slows down compared to the parallel direction, exhibiting diffusion anisotropy characteristics.16 There is a close interaction between muscles and bones, which together maintain human motor function. The effect of muscles on bones is mainly through two levels: mechanics and chemistry. Among them, the main mechanical effect is muscle contraction, which applies stress stimulation to the bones and increases bone density.17 Some studies have pointed out that under the pathological conditions of OP, Ca2+will be lost in large quantities, bone density will be significantly reduced, and thus indirectly cause endocrine disorders, manifested as decreased muscle mass and decreased muscle function.18
Meanwhile, this study conducted logistic regression analysis, and the results showed that the increase in FA values and decrease in ADC values of the adductor major and adductor longus muscles in OP patients were independent factors affecting muscle function (P<0.05). The changes in DTI parameters of specific muscle groups (especially the adductor muscle group) may have specific marker value for muscle weakness. In the future, these findings can be verified in other musculoskeletal diseases or in the elderly population to confirm their cross-population applicability and stability. Further Pearson correlation analysis indicated that from a biological perspective, a decrease in FA typically reflected disordered muscle fiber arrangement and impaired membrane structure integrity, and a decrease in ADC may be related to the remodeling of extracellular matrix and the reduction of the space for water molecule diffusion, both of which were typical imaging markers of muscle atrophy and functional decline. Previous studies have also supported similar viewpoints. Lo et al19 found in a comparative study of DTI and histology in rat skeletal muscles that FA was highly correlated with the integrity of muscle fiber structure. Joshi et al20 also observed a positive correlation between FA and muscle strength in the forearm muscle groups of patients with cerebral palsy, further confirming the reliability of DTI parameters in characterizing the association between muscle structure and function. The results of this study are in line with the above literature, jointly suggesting that DTI can be used to capture the early microstructural changes of muscle fibers in OP, providing an imaging basis for the clinical identification of subclinical muscle weakness.
In recent years, the application of DTI technique in the assessment of skeletal muscles has gradually gained attention. In the assessment of skeletal muscles in vulnerable populations (including patients with sarcopenia and frailty), multi-parameter MRI studies have shown that the FA value has a significant positive correlation with muscle cross-sectional area (CSA), indicating that FA can reflect the comprehensive changes in muscle quantity and quality.21 Furthermore, in animal models of age-related sarcopenia and muscle sterile injury, it was found that FA was significantly increased during the muscle regeneration stage and was positively correlated with the degree of tissue regeneration (r = 0.88), while ADC showed the opposite dynamic change, suggesting that FA and ADC reflect different pathological physiological processes of muscle structure and microenvironment, respectively.22 In this study, the sensitivity (90.2%) and specificity (80.3%) of the combined prediction were also superior to those of a single parameter, which was consistent with the trend of the above studies, further supporting the potential value of the combined application of DTI parameters in the assessment of muscle strength related to OP. FA and ADC respectively reflect the directionality of muscle fiber arrangement and the overall diffusion capacity of water molecules within the tissue, and they exhibit different change patterns under pathological conditions. In the animal models of muscular dystrophy, the FA value of the damaged muscles was significantly decreased, while the ADC, axial diffusion coefficient (AD), and radial diffusion coefficient (RD) were significantly increased, and the magnitude of changes in these DTI parameters were consistent with the degree of muscle strength decline.23 In the context of OP, skeletal muscles exhibit both fibrous atrophy and changes in the microenvironment, and a single parameter is difficult to fully reflect the pathological features mentioned above. Therefore, combining FA and ADC can complement their respective information blind spots and improve the ability to distinguish muscle dysfunction. This type of multi-parameter combined strategy has a precedent in study of skeletal muscle DTI, further validating their rationality in complex pathological conditions.
Limitations
- This study was a single-center, retrospective design with a limited sample size (n=100), and all patients came from the same medical institution, which may introduce selection bias and limit the generalizability of the results. Further multi-center, large-sample prospective studies are needed to verify these findings.
- The subjects of the study were mostly aged between 60 and 70. Whether the conclusion is applicable to younger or older patients with OP, as well as other populations with musculoskeletal disorders, still requires further exploration.
- Although some confounding factors have been controlled, the specific variables such as the patients’ exercise levels, nutritional status, chronic pain, and daily activity abilities were not comprehensively collected and analyzed. This might interfere with the relationship between DTI parameters and muscle strength.
- This study followed the conventional clinical DTI protocol. However, the ability to distinguish differences in the cross-section of fast and slow muscle fibers within the skeletal muscle was insufficient. During the scanning process, physiological movements such as breathing and heartbeat might introduce errors, thereby affecting the accuracy of the parameters.
- The follow-up period of this study was relatively short (12 months). The long-term effects of OP itself, aging and degeneration on DTI parameters were not distinguished.
- This study set the age range at 60–70 years old, aiming to focus on the core group of elderly OP patients and to minimize the confounding effects of age on the DTI parameters of skeletal muscle. This age range may limit the extrapolation of the research results to younger or older OP populations. This is an important limitation of this study and future research should expand the age spectrum to verify the generalizability of the conclusions.
Conclusion
This study applied DTI technique to assess skeletal muscle function in patients with OP. Both the DTI parameters (FA and ADC) were positively correlated with decreased muscle function, providing preliminary evidence for understanding the imaging biomarkers of muscle strength decline in OP patients. However, given the sample limitations of this study, the retrospective design, and the uncontrolled potential confounding factors, the above conclusions still need to be further verified in prospective, large-sample, and multi-center studies. Future research should combine more comprehensive clinical variables and long-term follow-up to more rigorously evaluate the practical application value and clinical transformation potential of DTI in the assessment of muscle unction in OP.
Innovations
(1) This study may break through the limitation of traditional osteoporosis research that only focuses on bone loss. It regards the quantitative parameters of FA and ADC measured by DTI technique in skeletal muscle as the precursor biological changes of muscle dysfunction. This may help establish a cascade mechanism of bone microenvironment imbalance→muscle fiber damage→muscle function decline.
(2) Based on the fact that changes in DTI parameters occur earlier than clinical symptoms of muscle function decline, this study transforms the traditional muscle function endpoint assessment into a predictive and interventional pre-biomarker.
Data Sharing Statement
The datasets generated during and/or analyzed during the current study are available from the corresponding author on reasonable request.
Ethics Approval
All procedures performed in studies involving human participants were in accordance with the ethical standards of the institutional and/or national research committee and with the 1964 Helsinki declaration and its later amendments or comparable ethical standards.
This study was approved by The Ethics Committee of Ninth Medical Center of PLA General Hospital (S2024005).
Written Informed consent was obtained from participants for the participation in the study and all methods were carried out in accordance with relevant guidelines and regulations.
Consent to Participate
Written Informed consent was obtained from every human participant in the study and the patients participating in the study all agree to publish the research results.
Funding
There is no funding to report.
Disclosure
The authors have no relevant financial or non-financial interests to disclose in this work.
References
1. Peyman H, Elizabeth E, Dominik O, et al. Bone evaluation study-2: update on the epidemiology of osteoporosis in Germany. Archiv Osteoporosis. 2024;19(1):26. doi:10.1007/s11657-024-01380-9
2. Salari N, Ghasemi H, Mohammadi L, et al. The global prevalence of osteoporosis in the world: a comprehensive systematic review and meta-analysis. J Orthop Surg Res. 2021;16(1):609. doi:10.1186/s13018-021-02772-0
3. Mithal A, Bansal B, Kyer CS, Ebeling P. The asia-pacific regional audit-epidemiology, costs, and burden of osteoporosis in India 2013: a report of international osteoporosis foundation. Indian J Endocrinol Metab. 2014;18(4):449–11. doi:10.4103/2230-8210.137485
4. Wang linhong epidemiological survey report on osteoporosis in China 2018. People’s Health Press, 2021. Chinese.
5. Dupuit M, Rance M, Morel C, et al. Effect of concurrent training on body composition and gut microbiota in postmenopausal women with overweight or obesity. Med Sci Sports Exerc. 2022;54(3):517–529. doi:10.1249/MSS.0000000000002809
6. JUPPI HK, Sipila S, Fachada V, et al. Total and regional body adiposity increases during menopause-evidence from a follow-up study. Aging Cell. 2022;21(6):e13621. doi:10.1111/acel.13621
7. Silva HJ, Maira A. Using DTI tractography to guide tDCS interventions in a complex acquired brain Injury neurorehabilitation protocol - a case report. Brain Stimulation. 2023;16(1):376–377. doi:10.1016/j.brs.2023.01.745
8. Di Pietro G, Scimeca M, Iundusi R, et al. Differences between muscle from osteoporotic and osteoarthritic subjects: in vitro study by diffusion-tensor MRI and histological findings. Aging Clin Exp Res. 2020;32(12):2489–2499. doi:10.1007/s40520-020-01483-6
9. Oefner C, Riemer E, Funke K, Werner M, Heyde CE, Schoenfelder S. Determination of anisotropic elastic parameters from morphological parameters of cancellous bone for osteoporotic lumbar spine. Med Biol Eng Comput. 2022;60(1):263–278. doi:10.1007/s11517-021-02465-0
10. Mohammed MS, Mostafa RRE. A,Mohamed M A S,et al.Role of magnetic resonance diffusion tensor imaging in assessment of back muscles in young adults with chronic low back pain. Egyptian J Radiol Nuclear Med. 2023;54(1):1–8.
11. W BN, C MP, Michael EL, et al. American Association of Clinical Endocrinologists/American College of Endocrinology Clinical Practice Guidelines for the Diagnosis and Treatment of Postmenopausal Osteoporosis-2020 Update. Endocr Pract. 2021;27(4):379–380. doi:10.1016/j.eprac.2021.02.001
12. Wei L. Zheng Jiejiao Development history and grading progress of manual muscle strength examination. Chin Rehabilit Theor Pract. 2015;21(6):666–669. Chinese.
13. Peduzzi P, Concato J, Kemper E, Holford TR, Feinstein AR. A simulation study of the number of events per variable in logistic regression analysis. J Clin Epidemiol. 1996;49(12):1373–1379. doi:10.1016/S0895-4356(96)00236-3
14. Roumeliotis S, Abd ElHafeez S, D’Arrigo G, et al. Fundamentals and applications of the receiver operating characteristic curve analysis in the research of endothelial dysfunction in chronic kidney disease. Life. 2022;12(9):1402. doi:10.3390/life12091402
15. Martín-Noguerol T, Barousse R, Wessell DE, Rossi I, Luna A. Clinical applications of skeletal muscle diffusion tensor imaging. Skeletal Radiol. 2023;52(9):1639–1649. doi:10.1007/s00256-023-04350-3
16. Wang Z, Petersson S, Moreno R, Wang R. Anisotropic mechanical properties Quantification in skeletal muscle using magnetic resonance elastography and diffusion tensor imaging. J Biomech. 2025;186:112737. doi:10.1016/j.jbiomech.2025.112737
17. Lulu C, Siyu W. Correlation between bone mineral density and sarcopenia in US adults: a population-based study. J Orthopaedic Surg Res. 2023;18(1):588. doi:10.1186/s13018-023-04034-7
18. Yu PC, Hsu CC, Lee WJ, et al. Muscle-to-fat ratio identifies functional impairments and cardiometabolic risk and predicts outcomes: biomarkers of sarcopenic obesity. J Cachexia Sarcopenia Muscle. 2022;13(1):368–376. doi:10.1002/jcsm.12877
19. Lo J, Berry BD, Tang Q, et al. Diffusion tensor imaging of rat rotator cuff muscle with histopathological correlation: an exploratory study. NMR Biomed. 2025;38(6):e70058. doi:10.1002/nbm.70058
20. Joshi D, Hruby A, Dewald APJ, et al. Quantifying structural properties of forearm flexor muscles in individuals with hemiparetic cerebral palsy using diffusion tensor imaging. Physiol Rep. 2025;13(11):e70404. doi:10.14814/phy2.70404
21. Abe T, Nakatani M, Loenneke JP. Relationship between ultrasound muscle thickness and MRI-measured muscle cross-sectional area in the forearm: a pilot study. Clin Physiol Funct Imaging. 2018;38(4):652–655. doi:10.1111/cpf.12462
22. Esposito A, Campana L, Palmisano A, et al. Magnetic resonance imaging at 7T reveals common events in age-related sarcopenia and in the homeostatic response to muscle sterile injury. PLoS One. 2013;8(3):e59308. doi:10.1371/journal.pone.0059308
23. McMillan AB, Shi D, Pratt SJP, Lovering RM. Diffusion tensor MRI to assess damage in healthy and dystrophic skeletal muscle after lengthening contractions. J Biomed Biotechnol. 2011;2011:970726. doi:10.1155/2011/970726
 © 2026 The Author(s). This work is published and licensed by Dove Medical Press Limited. The
full terms of this license are available at https://www.dovepress.com/terms
and incorporate the Creative Commons Attribution
- Non Commercial (unported, 4.0) License.
By accessing the work you hereby accept the Terms. Non-commercial uses of the work are permitted
without any further permission from Dove Medical Press Limited, provided the work is properly
attributed. For permission for commercial use of this work, please see paragraphs 4.2 and 5 of our Terms.
© 2026 The Author(s). This work is published and licensed by Dove Medical Press Limited. The
full terms of this license are available at https://www.dovepress.com/terms
and incorporate the Creative Commons Attribution
- Non Commercial (unported, 4.0) License.
By accessing the work you hereby accept the Terms. Non-commercial uses of the work are permitted
without any further permission from Dove Medical Press Limited, provided the work is properly
attributed. For permission for commercial use of this work, please see paragraphs 4.2 and 5 of our Terms.
Recommended articles

Lumbar Spine Bone Mineral Density Measurement: Comparison of Dual-Energy X-Ray Absorptiometry and Fat Content Evaluation by Dixon Chemical Shift MRI
Chang FX, Fan DH, Huang G, He JH
International Journal of General Medicine 2022, 15:6415-6424
Published Date: 4 August 2022