")
Back to Journals » International Journal of General Medicine » Volume 15
Lumbar Spine Bone Mineral Density Measurement: Comparison of Dual-Energy X-Ray Absorptiometry and Fat Content Evaluation by Dixon Chemical Shift MRI
Authors Chang FX, Fan DH, Huang G, He JH
Received 14 April 2022
Accepted for publication 22 July 2022
Published 4 August 2022 Volume 2022:15 Pages 6415—6424
DOI https://doi.org/10.2147/IJGM.S370814
Checked for plagiarism Yes
Review by Single anonymous peer review
Peer reviewer comments 3
Editor who approved publication: Dr Scott Fraser
Fei-xia Chang,1 Dun-hui Fan,2 Gang Huang,3 Jian-hong He2
1Radiology Department, Dunhuang City Hospital, Dunhuang, 736200, People’s Republic of China; 2Department of General Surgery, Dunhuang City Hospital, Dunhuang, 736200, People’s Republic of China; 3Radiology Department, Gansu Provincial People’s Hospital, Lanzhou, 730000, People’s Republic of China
Correspondence: Fei-xia Chang, Imaging Center Department, Gansu Provincial Maternity and Child-care Hospital, No.143, Qilihe North Street, Lanzhou, 730000, People’s Republic of China, Email [email protected]
Background: To assess whether the fat signal intensity and fat fraction (FF) of the lumbar vertebrae as measured on the Dixon chemical shift magnetic resonance imaging (MRI) technique can be correlated with the lumbar vertebra bone mineral density (BMD) measured using dual-energy X-ray absorptiometry (DXA).
Methods: Forty-five patients were retrospectively collected, and 180 lumbar vertebral bodies (L1-L4) were included. All patients underwent DXA and MRI examinations of the lumbar spine. Taking the T value of DXA as the gold standard and using the diagnostic criteria of the World Health Organization: T score ≥ − 1.0SD as normal, − 1.0 ∼ − 2.5SD as osteopenia, and ≤ − 2.5SD as osteoporosis. Meanwhile, the signal intensity on T2WI was measured, and FF of L1-L4 vertebral bodies was calculated on MRI images. Bone marrow fat FF calculation formula: FF = [Mfat/(Mfat + Mwater)] × 100% (Mwater and Mfat refer to the total pixel signal intensity value of the region of interest in water image and lipid image, respectively). Finally, the association of signal intensity and FF with DXA was evaluated.
Results: Totally 180 vertebral bodies in 45 patients were enrolled. According to the T value, they were divided into the normal group (n = 70), osteopenia group (n = 40), and osteoporosis group (n = 70). The fat signal intensity of the normal group, osteopenia group, and osteoporosis group were 96.6 ± 21.8, 154.5 ± 48.7, 216.3 ± 92.6, and the FF were 30.1 ± 6.2%, 52.6 ± 7.6%, 77.5 ± 7.9%, respectively. Among the three groups, the lumbar T2 fat signal intensity and FF had statistical differences (P < 0.01). Besides, the lumbar fat signal intensity and FF were negatively related to DXA (r =− 0.65 and − 0.93, P < 0.01).
Conclusion: The fat content calculated using the Dixon chemical shift MRI had an inverse relation with BMD. Moreover, the Dixon chemical shift MRI might provide complementary information to osteoporosis-related research fields.
Keywords: magnetic resonance, water-lipid separation technology, vertebral body signal intensity, fat fraction, osteoporosis
Introduction
Osteoporosis is a major public health problem. According to the statistics, approximately 50% of women and 20% of men are at risk of developing osteoporosis-related fractures.1 Although dual-energy X-ray absorptiometry (DXA) has not been fully used for osteoporosis screening, it is still considered as the gold standard for the diagnosis of osteoporosis by the World Health Organization (WHO).2,3 DXA is generally applied for the diagnosis of osteoporosis in postmenopausal women and men over the age of 50 years. The T value of the lumbar spine or hip joint less than −2.5 is diagnosed as osteoporosis. In addition, some techniques such as quantitative computed tomography (QCT) and ultrasound are available for the evaluation of bone mineral density (BMD). However, the DXA technique is determined as the gold standard for diagnosing osteoporosis by the WHO. In this paper, the measurement is based on the T value for comparative research.
Increasing evidence has revealed that a reduction in bone mass has been observed in osteoporosis related to aging and menopause, which is accompanied by an accumulation of the marrow fat volume. These studies indicate that marrow adipogenesis may play a crucial role in the pathophysiology of osteoporosis.4–6 Therefore, studying the changes in the content of bone marrow adipose tissue in the vertebral body is of great significance to assess the risk of osteoporosis and fractures. Hydrogen proton magnetic resonance spectroscopy (1H-MRS) is a non-invasive radiation-free examination, which can analyze the content of water and fat in the vertebral cancellous bone, and detect early changes in bone quality before the abnormal cancellous bone morphology appears. It plays an important role in exploring the pathogenesis of osteoporosis since MRS can accurately measure the fat content and its percentage to water by chemical shifting and can reveal the fat content of cancellous bone from the cellular or even molecular level.5,7 Nevertheless, MRS is not a routine application sequence, which should be performed in a high-field magnetic resonance machine. Besides, the examination requires a long time and patient cooperation with big challenges. Thus, 1H-MRS is difficult to be promoted in vertebral body examination, leading to its limit in clinical applications. Recent advances in rapid chemical-shift magnetic resonance imaging (MRI) have contributed to the development of time-efficient, computationally robust, and accurate water-fat separation techniques including the Dixon technique.8 Studies have proven that Dixon as a chemical shift-based water-fat separation method can quantitatively analyze the fat content in the organs.5,9 Therefore, patients undergoing the DXA and routine lumbar MRI examination were enrolled for image measurement and analysis. The routine lumbar spine sequence in our hospital includes the Dixon chemical shift MRI, which provides convenience for this study. The signal intensity of each vertebral body lipid phase was measured, and the fat fraction (FF) was calculated to assess lumbar bone marrow fat content.
The purpose of this study was to assess whether the fat content of the lumbar vertebra as measured on the Dixon chemical shift MRI technique correlates to the lumbar vertebra BMD measured using DXA.
Materials and Methods
Patients
A total of 45 patients (29 females) undergoing lumbar spine examination in Gansu Provincial Hospital between January 2016 and March 2020 were enrolled in the study. The median ages of the patients were 57.5 (50–68 years), 57.2 (51–70 years), and 57.9 (50–69 years) in the normal, group, osteopenia group, and osteoporosis group, respectively. No significant differences were observed between the groups (Table 1). All patients completed the 3.0T Dixon chemical shift MRI examination of the lumbar spine within one week after the BMD examination. Inclusion criteria: (1) without diseases that affect bone metabolism (such as hyperthyroidism, alcoholism, diabetes, severe chronic liver, and kidney disease, etc.); (2) not taking drugs that affect bone metabolism; (3) no history of malignant tumors, blood diseases, tuberculosis, chemotherapy, and radiotherapy; (4) not taking antiepileptic drugs, glucocorticoids, diuretics, and other drugs that affect bone metabolism. Exclusion criteria: (1) vertebrae with degenerative changes; (2) wedge fractures; (3) vertebrae with lesions such as hemangioma, lipoma, or compression fractures.
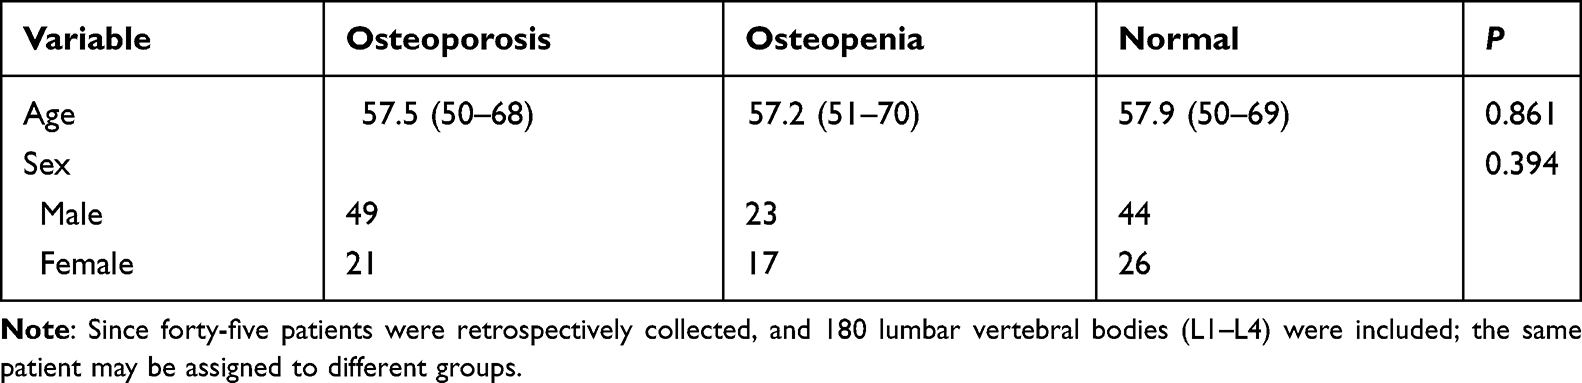 |
Table 1 Demographic Characteristics and Data of the Patients |
DXA and MR Examination
The lumbar spine BMD was measured using a GE-Lunar DPX DXA bone densitometer. BMD (g/cm2) and the corresponding T value of the lumbar vertebral bodies (L1-L4) at the anteroposterior position of all the subjects were detected using GE-Lunar DPX following the manufacturer’s instructions. Prior to each day’s tests, Quality Assurance calibration was performed using a block that consists of a tissue-equivalent material and three bone simulation chambers with known bone mineral content. Based on the diagnostic criteria proposed by the Chinese Society of Osteoporosis and Bone Mineral Research: normal (T score ≥ −1.0SD), osteopenia (T score from −1.0 to −2.5SD), and osteoporosis (T score ≤ −2.5SD), severe osteoporosis (T score ≤ −2.5 SD in combination with one or more fragility fractures).9,10
Lumbar MRI examinations were performed on a 3.0T system (Skyra, Siemens, Germany), using a spinal phased-array coil. MR scan sequence included the following: sagittal T2WI chemical shift imaging: TR = 3500ms, TE = 82ms, flip angle = 150°, echo chain = 6, layer thickness = 4mm, layer spacing = 0.8mm, matrix = 256 × 256, FOV = 260mm × 260mm, and 15 layers were scanned in total. After that, the system automatically generated 4 images, comprising a positive phase, a negative phase, a fat image, and a water image.
Image Analysis and Measurement
The MRI scanning images were transferred to the multi-modality workplace (MMWP, VE40 post-processing workstation), and the vertebral bone marrow fat content was measured independently by two radiologists. The most median sagittal T2 lipid-phase image of the vertebral bodies (L1-L4) was selected, and a region of interest (ROI) was manually drawn including the cancellous bone part of the entire vertebral body, which needed to avoid the entrance of the vertebral vein and cortical bone (Figure 1A). A post-processing software was used to calculate and measure the FF: [Mfat/(Mfat + Mwater)] × 100%. Similarly, FF in the most median sagittal position of the vertebral bodies (L1-L4) was measured as shown in Figure 1B.
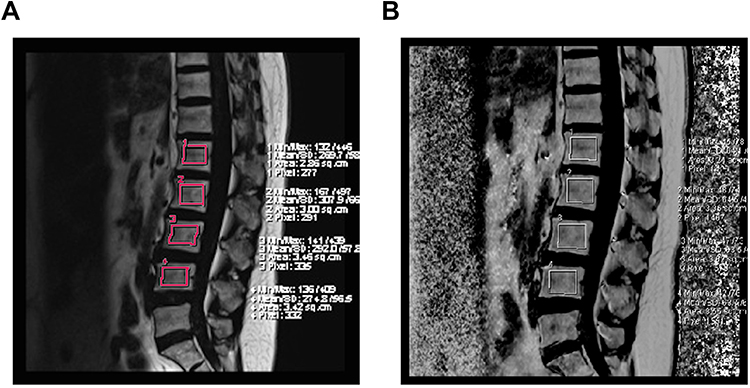 |
Figure 1 (A) T2 lipid phase image of the lumbar spine. To draw the ROI manually in the most median sagittal position of the vertebral bodies (L1-L4), and measure the signal intensity. (B) To calculate FF by a post-processing software: [Mfat/(Mfat + Mwater)] × 100%, an ROI was manually drawn through the most median sagittal position of the vertebral bodies (L1-L4) to measure FF. |
Statistical Analysis
Data analysis was performed using SPSS 17.0 statistical software. Measurement data were expressed as median ± SD and median (min-max), and the homogeneity of variance was tested before the statistics. The vertebral body signal intensity and FF were compared between groups by one-way ANOVA and the Least-Significant Difference was used for pairwise comparison within the group. A linear correlation analysis was performed between the signal intensity and FF of the vertebral bodies, respectively, and the bone mass measured by DXA. Multivariate logistic regression analysis was employed to analyze the independent predictors for bone mass change. P < 0.05 indicated a statistically significant difference.
Results
A total of 180 vertebrae involved 45 patients were included in the study. In accordance with the T value, they were divided into the normal group (n = 70), osteopenia group (n = 40), and osteoporosis group (n = 70). The signal intensity of the vertebral body lipid phase in the normal group, osteopenia group, and osteoporosis group was 96.6 ± 21.8, 154.5 ± 48.7, and 216.3 ± 92.6, and the FF was 30.1 ± 6.2%, 52.6 ± 7.6%, and 77.5 ± 7.9%, respectively.
As shown in the 3.0T Dixon chemical shift MRI lumbar spine lipid in-phase image, a small amount of adipose tissue with a slightly higher signal was observed in the lipid phase in the normal group (Figure 2A and B), and dissemination of high-signal fat components with different sizes was found in the osteopenia group (Figure 3A and B). In the osteoporosis group, the edges of the vertebral bodies were osteogenetic and became sharp, and multiple pieces of high-signal fat components were shown in the vertebral bodies (Figure 4A and B). A preliminary judgment can be made on whether and how much fat is contained in the tissues and lesions through the lipid-phase image.
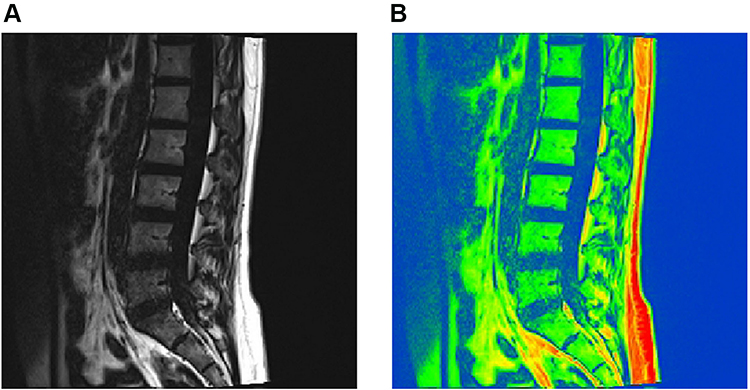 |
Figure 2 T2 lipid phase images in the normal group. (A) A small number of fat components with a slightly higher signal was observed on the image. (B) The orange region in the pseudo-color image represents a small amount of fat component. |
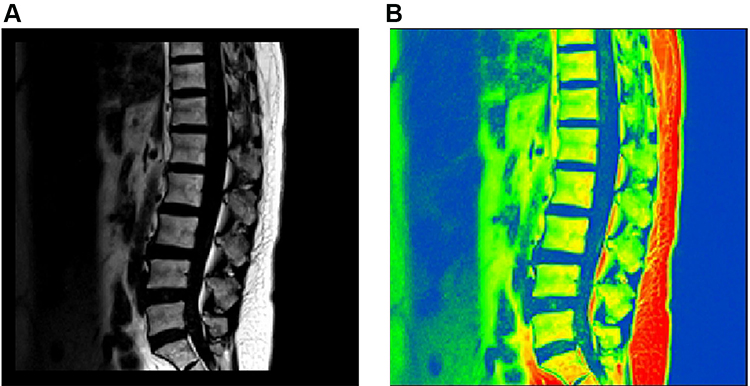 |
Figure 3 T2 lipid phase images in the osteopenia group. (A) High-signal fat components of different sizes were scattered on the image. (B) The orange region in the pseudo-color image represents the scattered fat component. |
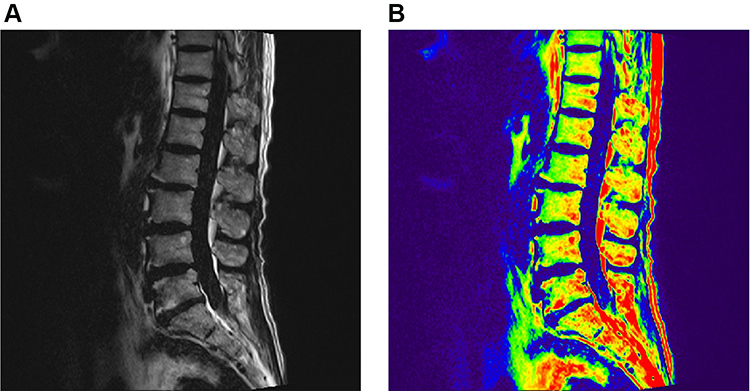 |
Figure 4 T2 lipid phase images in the osteoporosis group. (A) The edges of the vertebral bodies were osteogenetic and sharp, and there were multiple sheets of high-signal fat components in the vertebral bodies. (B) The Orange region in the pseudo-color image represents the multiple sheets of fat component. |
The Relationship Between Vertebral Body Signal Intensity and BMD
The signal intensities of the vertebral body in the normal group, osteopenia group, and osteoporosis group were 96.6 ± 21.8, 154.5 ± 48.7, and 216.3 ± 92.6 with statistical differences between groups (P < 0.01) (Table 2). Besides, there were significant differences in the pairwise comparison within the group (Table 3). As shown in Figure 5, the signal intensity of the lipid phase was negatively correlated with the DXA result (r =−0.65, P < 0.01). This result indicated that fat content change was related to BMD.
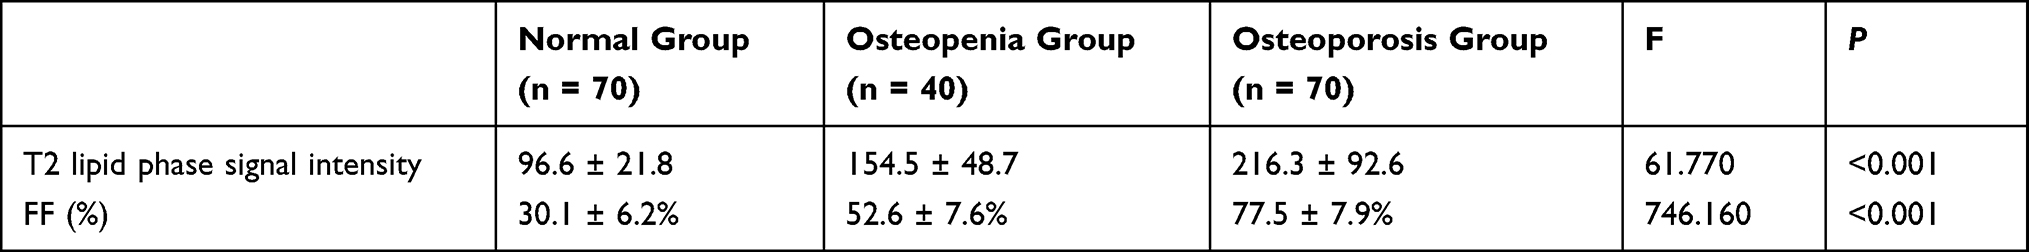 |
Table 2 Numerical Comparison Between Signal Intensity and FF of Vertebral Body and BMD |
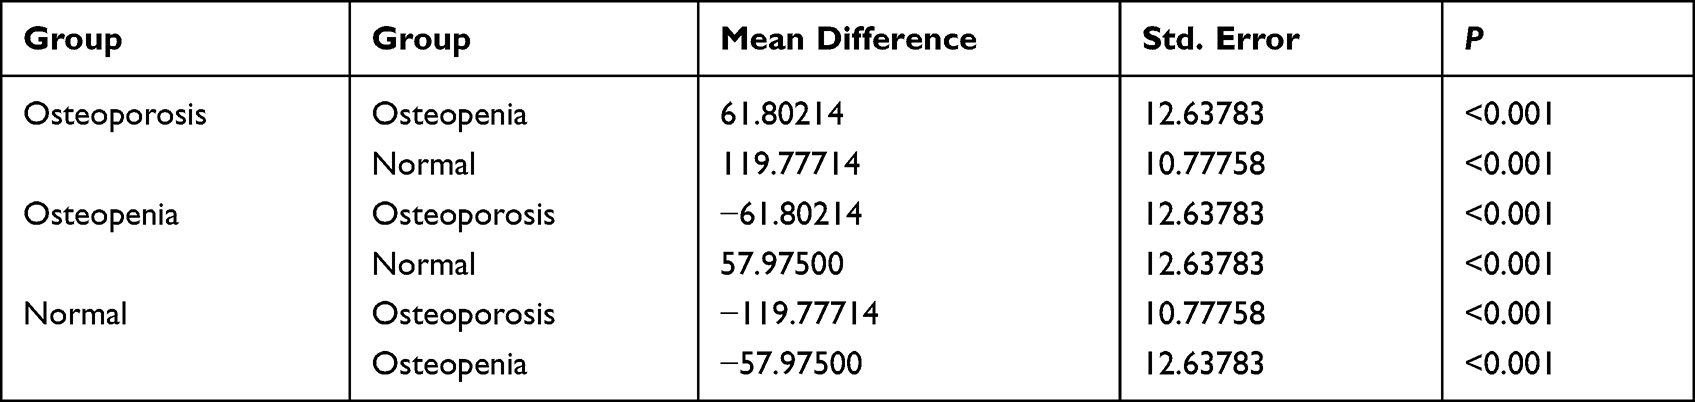 |
Table 3 Comparison of Intra-Group Vertebral Body Signal Intensity of Different Lumbar Spine Bone Mass Groups |
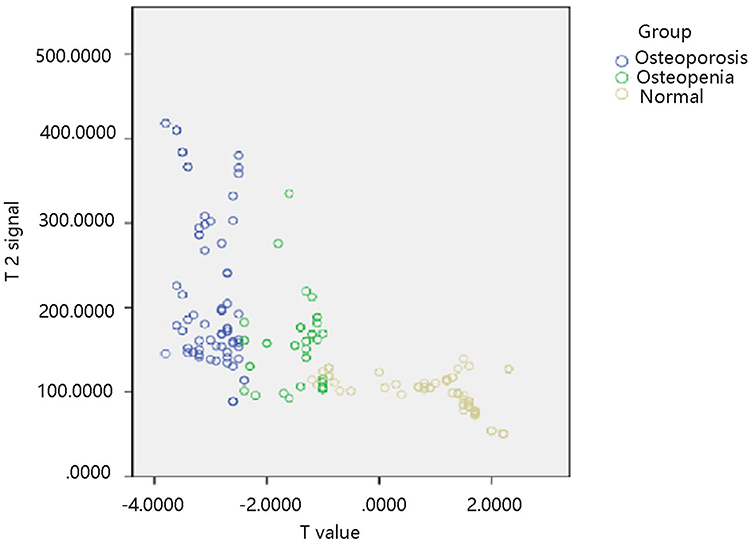 |
Figure 5 Linear relationship between T2 lipid phase signal intensity and DXA. (r=−0.65, R2=0.434, P<0.01). |
The Relationship Between Vertebral Body FF and BMD
The vertebral body FF in the normal group, the osteopenia group, and the osteoporosis group were 30.1 ± 6.2%, 52.6 ± 7.6%, and 77.5 ± 7.9% with a statistical difference between the groups (P < 0.01) (Table 2). The differences between the pairwise comparisons within the group were statistically significant (Table 4). The vertebral body FF had a negative relation with DXA (r =−0.93, P < 0.01) (Figure 6). This finding also suggested that fat content was negatively related to BMD.
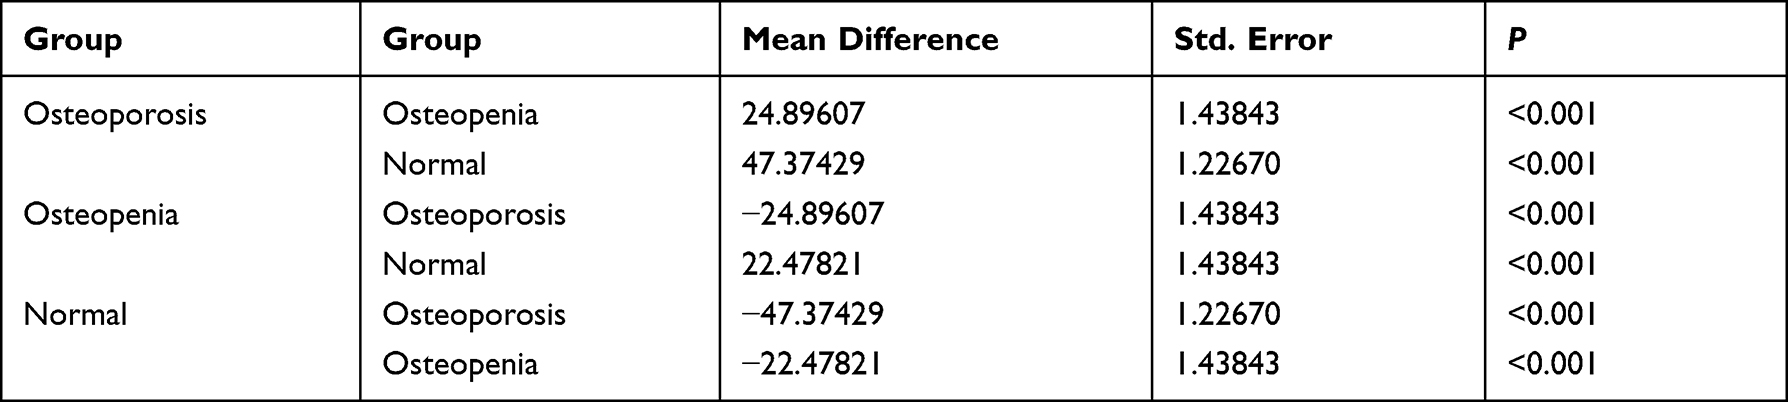 |
Table 4 Comparison of Intra-Group Vertebral Body FF of Different Lumbar Spine Bone Mass Groups |
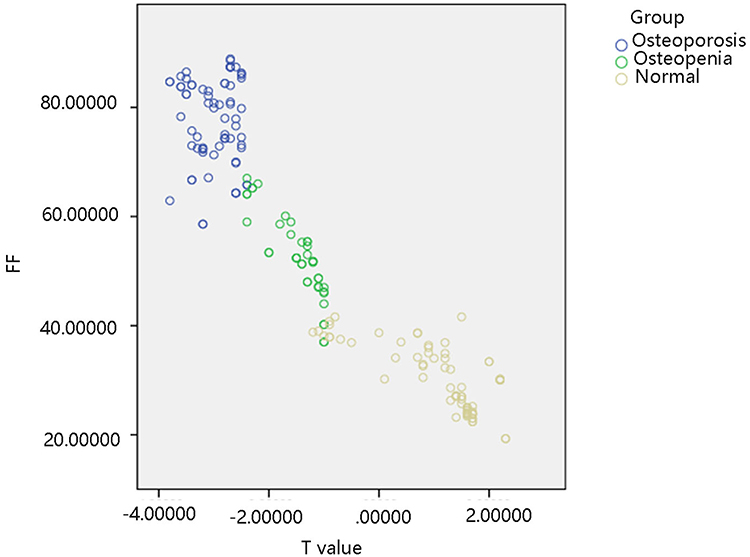 |
Figure 6 Linear relationship between FF of vertebral body and DXA (r =−0.93, R2=0.870, P <0.01). |
Multivariate Analysis of Predictors of Bone Mass Change
To assess independent factors for predicting the bone mass change, age, sex, T2 signal intensity, and FF were integrated into multivariate logistic regression analysis. The result showed that FF was an independent risk factor for predicting abnormal bone mass change (P < 0.01) (Table 5).
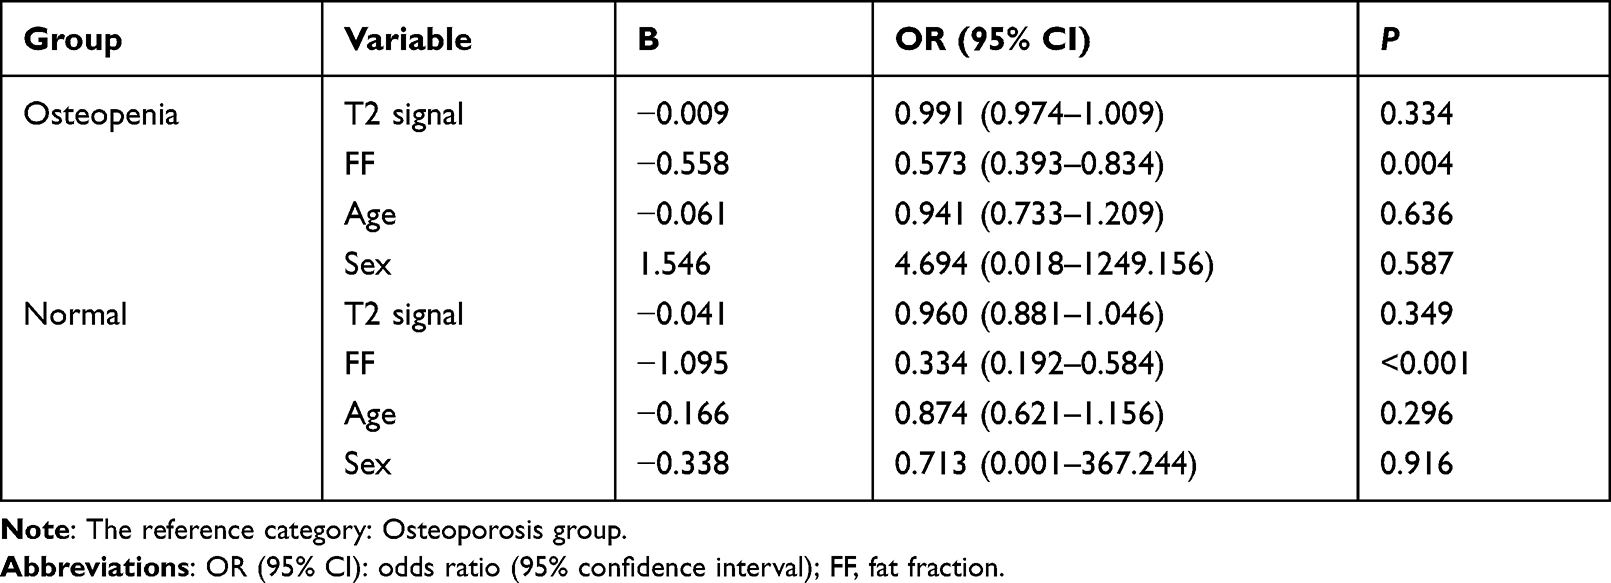 |
Table 5 Independent Risk Factors of Bone Mass Change Using Multivariate Logistic Regression Analysis |
Discussion
Osteoporosis is defined as a systemic metabolic bone disease characterized by decreased bone mass and microarchitectural deterioration of the bone tissue, leading to increased bone fragility and fracture risk.11 In recent years, the incidence of osteoporosis has been increasing in China. It has become a major public health problem, causing a huge economic burden on families and society. Therefore, early detection or prediction for osteoporosis are urgently needed.
Various approaches could be used for BMD assessment, but these methods have their inherent limitations. For instance, DXA is the current gold standard for evaluating BMD, which has the advantages of convenient operation, short detection time, and low-dose ionizing radiation (the radiation dose is equivalent to 1/30 of the chest radiograph). It has been recognized as a preferred method for assessing BMD, but the accuracy of DXA is lower than QCT and it has inconsistent measurements among various DXA machines due to different image analysis algorithms.12,13 The QCT measurement method was employed to assess BMD by using three-dimensional technology, which is less affected by bone volume and has high resolution.14 The results are measured by three-dimensional rotation to eliminate the interference caused by overlapped vertebral bodies and patient position. Besides, the accuracy of QCT for diagnosing osteoporosis is gradually recognized, while its wide clinical application is limited because of the high radiation dose and high cost.
MRI water-fat separation technology could reflect the changes in vertebral body fat content by measuring the signal decline index to predict bone mass change, which indicates the potential use of MRI for early detection or prediction of osteoporosis. Justesen et al15 studied human iliac bone marrow fat content through biopsy and compared the bone marrow fat content of normal subjects and osteoporotic patients. They found that the cancellous bone volume was significantly reduced, and the fat content in bone marrow was notably increased in the elderly and patients with osteoporosis. By studying the pathological anatomy of iliac bone in 84 cadaver specimens, Meunier et al16 observed that the content of adipose tissue decreased from about 60% of the elderly to about 15% of the young, and the content of cancellous bone was reduced from about 26% to about 16%. Naveiras et al17 proved that bone-marrow adipocytes in the vertebral body were the main negative regulators of the bone marrow microenvironment. Antagonizing marrow adipogenesis might enhance hematopoietic recovery in clinical bone-marrow transplantation, thereby preventing bone loss. Hajek et al18 conducted an autopsy study on 3 cases of cadavers, and they proved that the speckled and patchy abnormal signals in the lumbar spine bone marrow on the MRI were fat tissues through pathology, thereby determining the fat content of the bone marrow is of great value for the determination of vertebral bone mass. These studies revealed that bone marrow fat content was closely linked to aging and osteoporosis. Moreover, the vertebral bone marrow fat content increases sharply in postmenopausal females due to the reduction of estrogen levels in postmenopausal females. An increase in the fat content of bone marrow was also related to smoking behavior and physical activity.19
Dixon Chemical shift MR technology can be used to non-invasively measure the fat content in tissues.20 Bone is a body support system, and the lumbar spine is the axial skeleton of a human. There are many cancellous bone structures in the vertebral body, which is the site of bone loss first. Therefore, this study took L1-L4 vertebral bodies as the research object and evaluated whether the T2 lipid-phase signal intensity and FF of lumbar cancellous bone calculated using 3.0T Dixon chemical shift MRI technology could be correlated to BMD measured using DXA.
In this study, a total of 45 patients with 180 vertebrae were included, and they were grouped according to the T value. The vertebral body lipid-phase signal intensities of the normal group, osteopenia group, and osteoporosis group were 96.6 ± 21.8, 154.5 ± 48.7, and 216.3 ± 92.6, respectively. The differences between and within groups were statistically significant. The lipid-phase signal intensity was negatively correlated with DXA (r=−0.65, P<0.01), indicating that the measurement of the vertebral body signal intensity can reflect the changes in vertebral bone marrow fat content. The FF of the normal group, the osteopenia group, and the osteoporosis group were 30.1 ± 6.2%, 52.6 ± 7.6%, and 77.5 ± 7.9%, respectively, and there were significant differences between and within groups. FF had a negative relationship with DXA, and the correlation coefficient was r=−0.93. The results indicated that the fat content calculated using the Dixon chemical shift MRI had an inverse relation with BMD. Of note, FF could independently predict the bone mass change, suggesting that the FF might have a wider application prospect for assessing the BMD of the lumbar spine to predict osteoporosis.
Previous studies have also presented the use of the chemical shift MRI technique in evaluating bone marrow fat content with diverse results. G.-W. Li et al demonstrated that FF had an inverse association with lumbar spine BMD, and patients with osteopenia and osteoporosis had a notably higher marrow fat content than those with normal bone mass.21 The signal intensity ratio for the benign compression fracture group and normal marrow control group was significantly lower than that in the malignant vertebral compression group.22 Sun et al observed a significant difference in chemical shift rate between normal and abnormal bone mass.23 These findings shared a common trend with our results. However, these findings differ from the results of another study by Gokalp et al, in which there was no significant difference between osteopenia and osteoporosis groups regarding vertebral bone marrow fat content.3 In an attempt to explain their results, they mentioned a fast decrease in the water fraction among women above 25 years and noted that the median bone marrow fat content in the age group of 50–65 years was 45.5–51.5%, indicating an age-related influence. Youn et al24 used chemical shift-based MRI water-fat separation technology to analyze the relationship between vertebral bone marrow FF and BMD, showing that the vertebral body fat content of the osteopenia group was not statistically different from that of the normal group. These inconsistent results may also be related to a certain error in the DXA measurement of the lumbar spine BMD at anteroposterior projection.25 Additionally, variations in the water fraction of vertebral bone marrow depend on the age and gender of the subjects, which may contribute to the inconsistency. Therefore, further studies are required to validate the results of our study.
This study has several limitations. First, our study lacks pathological support and long-term follow-up research. Second, the number of cases is small, so the critical value of the research requires to be confirmed in a larger cohort and external testing. In addition, the signal intensities measured by MRI are not a physical entity and are dependent on many different factors. Therefore, further studies are necessary to support this conclusion.
Author Information
Details of Fei-xia Chang’s current affiliation are as follows: Imaging Center Department, Gansu Provincial Maternity and Child-care Hospital, Lanzhou 730000, China.
Data Sharing Statement
The datasets used and/or analyzed during the current study are available from the corresponding author on reasonable request.
Ethics Approval and Consent to Participate
The study protocol was approved by The Ethical Committee of Gansu Provincial Hospital. All the patients signed the written informed consents based on the guidelines of the Gansu Provincial Hospital before participating in the study. All samples were made anonymous according to the ethical and legal standards. All the procedures were performed under principles of the local law and the Declaration of Helsinki.
Funding
This work was supported by the Science-Technology Foundation for Middle-aged and Young Scientist of Gansu Province, China. [Grant Number 17JR5RF350].
Disclosure
The authors declare no conflicts of interest.
References
1. Hiligsmann M, Kanis JA, Compston J, et al. Health technology assessment in osteoporosis. Calcif Tissue Int. 2013;93(1):1–14. doi:10.1007/s00223-013-9724-8
2. Blake GM, Fogelman I. Role of dual-energy X-ray absorptiometry in the diagnosis and treatment of osteoporosis. J Clin Densitom. 2007;10(1):102–110. doi:10.1016/j.jocd.2006.11.001
3. Gokalp G, Mutlu FS, Yazici Z, Yildirim N. Evaluation of vertebral bone marrow fat content by chemical-shift MRI in osteoporosis. Skeletal Radiol. 2011;40(5):577–585. doi:10.1007/s00256-010-1048-4
4. Li GW, Tang GY, Liu Y, Tang RB, Peng YF, Li W. MR spectroscopy and micro-CT in evaluation of osteoporosis model in rabbits: comparison with histopathology. Eur Radiol. 2012;22(4):923–929. doi:10.1007/s00330-011-2325-x
5. Shen W, Chen J, Gantz M, et al. MRI-measured pelvic bone marrow adipose tissue is inversely related to DXA-measured bone mineral in younger and older adults. Eur J Clin Nutr. 2012;66(9):983–988. doi:10.1038/ejcn.2012.35
6. Cohen A, Dempster DW, Stein EM, et al. Increased marrow adiposity in premenopausal women with idiopathic osteoporosis. J Clin Endocrinol Metab. 2012;97(8):2782–2791. doi:10.1210/jc.2012-1477
7. Di Iorgi N, Rosol M, Mittelman SD, Gilsanz V. Reciprocal relation between marrow adiposity and the amount of bone in the axial and appendicular skeleton of young adults. J Clin Endocrinol Metab. 2008;93(6):2281–2286. doi:10.1210/jc.2007-2691
8. Alizai H, Nardo L, Karampinos DC, et al. Comparison of clinical semi-quantitative assessment of muscle fat infiltration with quantitative assessment using chemical shift-based water/fat separation in MR studies of the calf of post-menopausal women. Eur Radiol. 2012;22(7):1592–1600. doi:10.1007/s00330-012-2404-7
9. Hu HH, Kim HW, Nayak KS, Goran MI. Comparison of fat-water MRI and single-voxel MRS in the assessment of hepatic and pancreatic fat fractions in humans. Obesity. 2010;18(4):841–847. doi:10.1038/oby.2009.352
10. Roca M, Mota J, Alfonso P, Pocovi M, Giraldo P. S-MRI score: a simple method for assessing bone marrow involvement in Gaucher disease. Eur J Radiol. 2007;62(1):132–137. doi:10.1016/j.ejrad.2006.11.024
11. Hotca A, Ravichandra S, Mikheev A, Rusinek H, Chang G. Precision of volumetric assessment of proximal femur microarchitecture from high-resolution 3T MRI. Int J Comput Assist Radiol Surg. 2015;10(1):35–43. doi:10.1007/s11548-014-1009-9
12. Mohamed EI, Meshref RA, Abdel-Mageed SM, Moustafa MH, Badawi MI, Darwish SH. A novel morphological analysis of DXA-DICOM images by artificial neural networks for estimating bone mineral density in health and disease. J Clin Densitom. 2019;22(3):382–390. doi:10.1016/j.jocd.2018.08.006
13. Sollmann N, Loffler MT, Kronthaler S, et al. MRI-based quantitative osteoporosis imaging at the spine and femur. J Magn Reson Imaging. 2021;54(1):12–35. doi:10.1002/jmri.27260
14. Guglielmi G, van Kuijk C, Li J, Meta MD, Scillitani A, Lang TF. Influence of anthropometric parameters and bone size on bone mineral density using volumetric quantitative computed tomography and dual X-ray absorptiometry at the Hip. Acta Radiol. 2006;47(6):574–580. doi:10.1080/02841850600690363
15. Justesen J, Stenderup K, Ebbesen EN, Mosekilde L, Steiniche T, Kassem M. Adipocyte tissue volume in bone marrow is increased with aging and in patients with osteoporosis. Biogerontology. 2001;2(3):165–171. doi:10.1023/A:1011513223894
16. Meunier P, Aaron J, Edouard C, Vignon G. Osteoporosis and the replacement of cell populations of the marrow by adipose tissue. A quantitative study of 84 iliac bone biopsies. Clin Orthop Relat Res. 1971;80:147–154. doi:10.1097/00003086-197110000-00021
17. Naveiras O, Nardi V, Wenzel PL, Hauschka PV, Fahey F, Daley GQ. Bone-marrow adipocytes as negative regulators of the haematopoietic microenvironment. Nature. 2009;460(7252):259–263. doi:10.1038/nature08099
18. Hajek PC, Baker LL, Goobar JE, et al. Focal fat deposition in axial bone marrow: MR characteristics. Radiology. 1987;162(1 Pt 1):245–249. doi:10.1148/radiology.162.1.3786770
19. da Silva VN, Fiorelli LN, da Silva CC, Kurokawa CS, Goldberg TB. Do metabolic syndrome and its components have an impact on bone mineral density in adolescents? Nutr Metab. 2017;14(1):1. doi:10.1186/s12986-016-0156-0
20. Ojanen X, Borra RJ, Havu M, et al. Comparison of vertebral bone marrow fat assessed by 1H MRS and in-phase and out-of-phase MRI among family members. Osteoporos Int. 2014;25(2):653–662. doi:10.1007/s00198-013-2472-9
21. Li GW, Xu Z, Chen QW, et al. Quantitative evaluation of vertebral marrow adipose tissue in postmenopausal female using MRI chemical shift-based water-fat separation. Clin Radiol. 2014;69(3):254–262. doi:10.1016/j.crad.2013.10.005
22. Zidan DZ, Habib LA, NA Chalabi. Quantitative chemical-shift MR imaging cutoff value: benign versus malignant vertebral compression – initial experience. Egypt J Radiol Nucl Med. 2014;45(3):779–786. doi:10.1016/j.ejrnm.2014.05.016
23. Sun Y, Han Z, Wang F, Wang B, Zhang L. Feasibility of using double-echo chemical shift imaging to monitor bone mass change in aged patients with lumbago: a pilot study. Res Sq. 2020. doi:10.21203/rs.3.rs-97042/v1
24. Youn I, Lee HW, Kim JK. Correlation between vertebral marrow fat fraction measured using Dixon quantitative chemical shift MRI and BMD value on dual-energy X-ray absorptiometry. J Korean Magn Reson Soc. 2013;16(1):16–24. doi:10.13104/jksmrm.2012.16.1.16
25. Schneider DL, Bettencourt R, Barrett-Connor E. Clinical utility of spine bone density in elderly women. J Clin Densitom. 2006;9(3):255–260. doi:10.1016/j.jocd.2006.04.116
 © 2022 The Author(s). This work is published and licensed by Dove Medical Press Limited. The full terms of this license are available at https://www.dovepress.com/terms.php and incorporate the Creative Commons Attribution - Non Commercial (unported, v3.0) License.
By accessing the work you hereby accept the Terms. Non-commercial uses of the work are permitted without any further permission from Dove Medical Press Limited, provided the work is properly attributed. For permission for commercial use of this work, please see paragraphs 4.2 and 5 of our Terms.
© 2022 The Author(s). This work is published and licensed by Dove Medical Press Limited. The full terms of this license are available at https://www.dovepress.com/terms.php and incorporate the Creative Commons Attribution - Non Commercial (unported, v3.0) License.
By accessing the work you hereby accept the Terms. Non-commercial uses of the work are permitted without any further permission from Dove Medical Press Limited, provided the work is properly attributed. For permission for commercial use of this work, please see paragraphs 4.2 and 5 of our Terms.