Back to Journals » Clinical Interventions in Aging » Volume 21
The Relationship Between Gait Task Performance and Plasma Biomarkers for Alzheimer’s Disease in Cognitively Unimpaired Older Adults and Patients with Mild Cognitive Impairment
Authors Sergio J, Price A ![]() , Snyder PJ, Doster SA, Durkin M, Strenger JR, Thompson LI, Stradtman M, Sinoff S, Alber J
, Snyder PJ, Doster SA, Durkin M, Strenger JR, Thompson LI, Stradtman M, Sinoff S, Alber J
Received 13 September 2025
Accepted for publication 13 December 2025
Published 11 February 2026 Volume 2026:21 562194
DOI https://doi.org/10.2147/CIA.S562194
Checked for plagiarism Yes
Review by Single anonymous peer review
Peer reviewer comments 2
Editor who approved publication: Prof. Dr. Nandu Goswami
Jordan Sergio,1,2,* Ashley Price,1,2,* Peter J Snyder,1,3 Savannah A Doster,1,2 Maeve Durkin,1,2 Jennifer R Strenger,4 Louisa I Thompson,2,5 Megan Stradtman,2,5 Stuart Sinoff,6 Jessica Alber1,2
1George & Anne Ryan Institute for Neuroscience, Department of Biomedical and Pharmaceutical Sciences, University of Rhode Island, Kingston, Rhode Island, USA; 2Butler Hospital Memory & Aging Program, Warren Alpert Medical School of Brown University, Providence, RI, USA; 3Department of Neurology, Alpert Medical School of Brown University, Providence, RI, USA; 4Postbaccalaureate Premedical Program, Bryn Mawr College, Bryn Mawr, PA, USA; 5Department of Psychiatry and Human Behavior, Warren Alpert Medical School of Brown University, RI, USA; 6Neuroscience Institution, Morton Plant Hospital, BayCare Medical Group, Clearwater, FL, USA
*These authors contributed equally to this work
Correspondence: Jessica Alber, George & Anne Ryan Institute for Neuroscience, Department of Biomedical and Pharmaceutical Sciences, University of Rhode Island, 130 Flagg Road, Kingston, RI, 0288, USA, Email [email protected]
Purpose: The Timed Up and Go (TUG) is a 20-foot gait assessment, with TUG-dual task (DT) serial subtractions to determine dual-task cost. Alzheimer’s disease (AD) risk is established using plasma biomarkers and APOE genotyping.
Methods: We investigated: 1) TUG/TUG-DT differences between AD low-risk cognitively unimpaired (CU) older adults (N = 74), AD high-risk CU older adults (N = 87), and mild cognitively impaired (MCI) older adults (N = 33) and 2) the relationship between TUG/TUG-DT performance and plasma biomarkers. One hundred and ninety-four older adults ages 55– 80 completed TUG/TUG-DT, a fasting blood draw, and APOE genotyping. Scores on the Clinical Dementia Rating Scale (CU = 0; CI = ≥ 0.5) and Montreal Cognitive Assessment (CU ≥ 24; CI = ≤ 23) determined whether participants were placed into the CU low-risk, CU high-risk, or MCI groups. Risk level for CU participants were assessed by APOE genotyping. Those participants who carried at least one copy of the APOE ϵ4 allele were designated to the high-risk group (n = 87). Participants with no APOE ϵ4 allele were assigned to the low-risk group (n = 75).
Results: MCI participants took longer to perform the TUG than CU participants (p < 0.001). CU high-risk and MCI group performed similarly on step counts, while the CU low-risk took significantly fewer steps (p< 0.001). Speed predicted whether someone was below an AD-risk threshold for pTau217 in CU participants (n = 150). Exploratory generalized additive models showed plasma biomarkers predicted gait metrics in CU groups.
Conclusion: Step count may be more sensitive, compared to speed alone, in identifying those in preclinical AD stages. Gait metrics (speed and efficiency) played a key role as a clinical manifestation of early AD pathophysiology determined by blood-based biomarker concentration. Combining these assessments offers a multidimensional, cost-effective approach for preclinical-AD screening and potential early intervention.
Keywords: blood biomarkers, timed up and go, gait metrics, pTau217, pTau181
Introduction
Alzheimer’s disease (AD) is a gradually progressive neurodegenerative disorder and the most common cause of dementia. Characterized by the accumulation of amyloid plaques and neurofibrillary tau tangles, AD leads to neuronal loss and synaptic dysfunction.1 As of 2023, approximately 1 in 9 individuals over the age of 65 in the United States are affected by AD.2 Although no single genetic cause has been identified, the apolipoprotein E (APOE) gene plays a significant role in influencing the risk of developing AD.2 Individuals with a heterozygous APOE ε4 allele have an approximately 3- to 4-fold increased risk of developing AD compared to non-carriers, while those with the homozygous APOE ε4 allele face a significantly higher risk, with estimates ranging from 9 to 15 times greater risk.3–6
Gait changes and alterations in motor function are notable symptoms of AD.7–9 Gait analysis serves as a crucial non-invasive tool for assessing mobility in both aging and neurodegenerative disease. In advanced stages of dementia, mobility loss becomes widespread and has serious implications, including a heightened risk of falls, diminished independence, and reduced engagement in meaningful activities.10 In individuals with amnestic mild cognitive impairment (MCI), gait disturbances have been linked to an increased risk of progression to AD dementia.11 Notably, those with AD often exhibit gait deficits, such as reduced walking velocity as measured by the 10-meter walk test at a comfortable pace.12 The Timed Up and Go (TUG) test is a common mobility assessment tool that measures functional tasks such as standing, walking, and sitting back down. It is primarily used to assess mobility, balance, and fall risk in older adults. In healthy aging, TUG times tend to increase slightly with age, but significant delays may indicate mobility or balance issues.13 In AD, longer TUG times reflect greater mobility and balance impairments, which are linked to higher fall risk. The Timed Up and Go-Dual Task (TUG-DT) builds on the TUG by adding a cognitive component, requiring individuals to perform a secondary task—like counting—while completing the mobility task. This dual-task format helps assess cognitive-motor interactions. In healthy aging, the TUG-DT reveals how cognitive load impacts mobility, with modest delays typically observed in older adults. However, these delays are usually subtle and not indicative of serious impairment. High dual-task costs on the TUG-DT is associated with risk for progression to dementia and may be a valuable tool for early intervention.14 While extensive research has examined gait in patients with MCI and AD, there has been limited investigation into changes in gait in preclinical AD,15 a phase of AD in which there are cerebral biomarker changes but no cognitive symptoms. This stage has recently emerged as an ideal target for secondary prevention therapeutics, and clinical trials of monoclonal antibodies in this phase to slow/prevent disease development are ongoing.16 Currently, preclinical AD is diagnosed at specialty clinics using assessments such as amyloid positron emission tomography (Aβ-PET) and lumbar puncture, which are invasive, costly, and require interpretation by specialist teams. Blood biomarkers for AD hold the potential to enhance early diagnosis, monitor disease progression, and facilitate personalized treatment strategies. Among these biomarkers are phosphorylated tau at the 181 residue (pTau181), phosphorylated tau at residue 217 (pTau217), amyloid beta (Aβ) 42/40 ratio, and neurofilament light chain (NfL). Among these, pTau181 serves as a key biomarker for distinguishing AD dementia from non-AD dementias and Aβ-PET negative cognitively unimpaired (CU) older adults.17 pTau217 has been utilized due to its high specificity and sensitivity for AD. Additionally, the Aβ 42/40 ratio is crucial in AD research; a higher ratio suggests a lower risk of developing the disease, given that Aβ42 is more prone to aggregation and is predominantly found in senile plaques.18 Furthermore, NfL is a biomarker that reflects neurodegeneration more broadly, which can directly impact motor function and is associated with the prediction of gait decline, as observed in neurodegenerative diseases such as Parkinson’s disease.19,20 The development of biomarkers and clinical tools to detect preclinical AD is essential to allow for the early identification and treatment of the disease, especially given the recent approval of disease modifying therapeutics.21,22
Prior work revealed a positive association between gait assessments and AD biomarkers Aβ40, Aβ42, and NfL in a multiethnic cohort of 1,348 participants.23 The association between gait and blood-based biomarkers was supported by evidence that individuals with increased NfL and Aβ showed a decline in gait speed over years.24 To our knowledge, these recent studies are the first to investigate if biomarkers can explain the differences in gait assessment scores.
While gait changes are established in symptomatic MCI and AD, longitudinal research has identified a decline in gait metrics approximately 12 years before MCI onset.25 Extensive research in gait as a predictor of preclinical AD remains understudied. Therefore, the central objectives of this study are to: 1) investigate gait changes in preclinical AD and MCI participants using a standardized clinical gait assessment (the TUG and TUG-DT) and 2) examine the relationship between motor performance on the TUG/TUG-DT and AD blood biomarkers (pTau181, pTau217, Aβ 42/40, and NfL) in preclinical and MCI participants. Understanding these relationships may facilitate early intervention strategies to monitor and prevent falls in both preclinical and symptomatic AD.
Materials and Methods
Participants
Participants were recruited over a two-year period from the Butler Alzheimer’s Prevention Registry (BAPR), part of the Butler Memory & Aging Program, in Providence, Rhode Island, and from the BayCare Morton Plant research site in Clearwater, Florida. Key inclusion criteria were an age range of 55–80, and scores above cut-off values on cognitive assessment measures (defined below). The exclusionary criteria, as previously published,26 included certain medical conditions that could compromise assessment validity (ie, some ocular or neurological conditions, brain injuries with lasting impairments, uncontrolled hypertension, or insulin requiring diabetes). Additionally, individuals with recent substance abuse, psychiatric disorders, or some uncontrolled systemic illnesses were excluded to maintain data integrity and participant safety. Prior to beginning the study, all included participants voluntarily agreed to participate after reviewing the informed consent. During enrollment, participants were divided into one of three groups: CU low-risk (n = 74), CU high-risk (n = 87), and MCI patients (n = 33). The MCI group included 4 mild AD individuals and 29 MCI individuals. Cognitive ability was based on scores on the Clinical Dementia Rating Scale (CU = 0; cognitively impaired ≥ 0.5) and the Montreal Cognitive Assessment (CU ≥ 24; cognitively impaired ≤ 23).27 For CU groups, AD-risk level was determined by APOE genotyping at screening visits (Spartan Bioscience, Inc., Ottawa, ON.) and first degree family history of AD. Participants with no APOE ε4 allele and no first-degree family history of AD were assigned to the low-risk group (n = 74), while those who carried at least one copy of the APOE ε4 allele and had a first-degree family history of AD were assigned to the high-risk group (n = 87). For this analysis, 194 community-dwelling older adults (mean age = 67.28 ± 6.06 years) (see Table 1) completed the study visit including the TUG gait tasks and a blood draw. BayCare Health System institutional review board approval was obtained prior to data collection (#2018.106-BMP) and the data was in accordance with the principles stated in the Declaration of Helsinki.
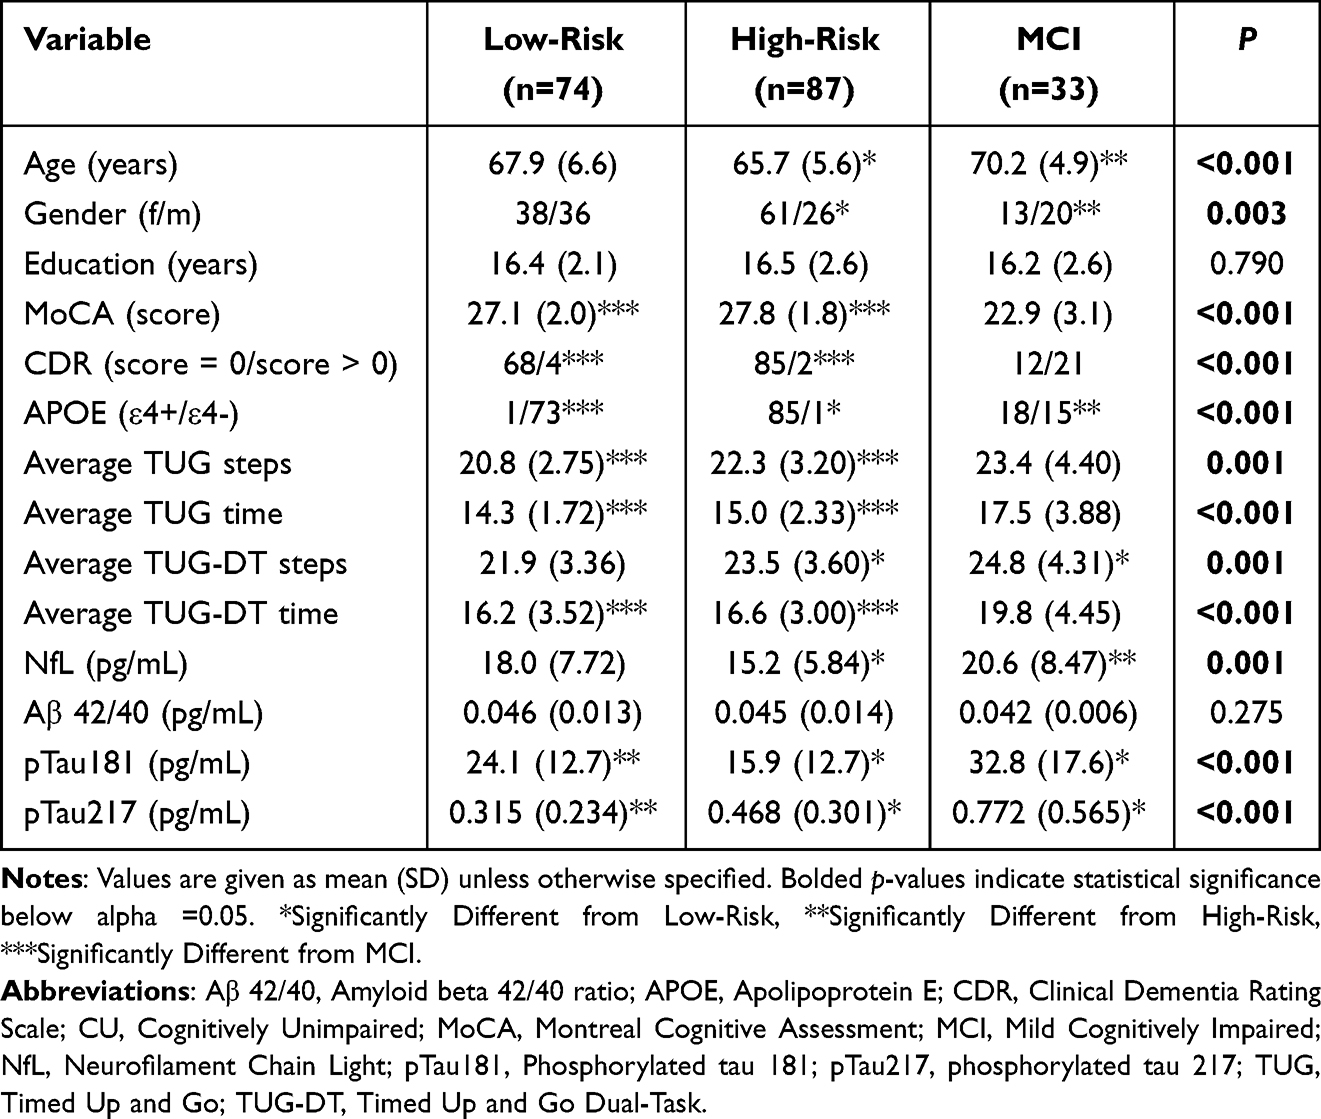 |
Table 1 Demographics of CU Low-Risk, CU High-Risk, and MCI Groups |
Procedure
Test Procedures of Timed Up-and-Go and Timed Up-and-Go Dual-Task
The TUG and TUG-DT were administered sequentially during a single visit to examine gait. The outcome variables from the gait assessments included time to complete each task, step count per task, and dual-task cost (DTC). Equipment used to administer the tasks included a standard armchair, video camera, stopwatch, and tape on the floor at a 10-foot mark. Two raters were present: one rater to read the scripts and transcribe participant verbal responses, and the other to video record the tasks for later verification of scores.
After seating the participant in an armchair, the rater confirmed that the participant could see the tape mark on the floor, positioned 10-feet in front of them, which indicated the stop and turn point. Verbal instructions were then provided for two practice trials to familiarize the participant with task components: 1) the gait task – rising from a seated position and walking at a normal pace for 10 feet, stop and turn around, walking back to the chair, and sitting back down and 2). The cognitive task-verbal serial subtraction from 100 by 3s. Once participants had practiced each component of the task, and it was clear they understood the task components, they completed two trials of both the TUG (gait task only) and TUG-DT (gait task + cognitive task).
Outcome Measures
The outcome measures for the TUG and TUG-DT were as follows: 1) TUG and TUG-DT – Time of completion for each trial of both tasks, measured to the nearest 10th of a second (start time: participant lifted off of the seat, stopped time: participant completely seated in seat); 2) TUG and TUG-DT - number of steps was counted on the video recordings of each participant; 3) TUG-DT only – number of correct serial subtractions. Each of the three outcome variables was collected for trials 1 and 2 of the relevant tasks. A mean score for each of the three outcomes was calculated based on Trials 1 and 2. The entire task was recorded on video, and all three outcomes were verified during video review by two qualified raters.
Blood Biomarkers
Participants completed a fasting blood draw of approximately 17.5mL. The blood sample acquisition, for assessment of AD biomarkers in plasma (mL = 10) and serum (mL = 7.5), was preprocessed by published pre-analytic standard protocols28 within one hour of collection and stored in −80 C. Samples were analyzed using standard analytic protocols29 at the University of North Texas Health Sciences Center. Plasma samples (500μL) were prepared for assay with a customized Hamilton Robotic StarPlus system (Microlab STAR line) and assayed using single molecule analysis via SIMOA assay measuring individual concentrations (pg/mL) of biomarker NfL (associated with neurodegeneration) and plasma Aβ1–42. Concentrations of plasma pTau181 were assayed on Simoa HD-X instruments (Quanterix, Billerica, MA, USA).30 Plasma pTau217 was also measured on a HD-X assay, with a validated, novel single molecule array developed by ALZpath, Inc. This novel assay uses a special monoclonal antibody that specifically captures pTau217, along with an N-terminal detector antibody and a peptide calibrator.
Statistical Analysis
R-studio version 4.3.1 was used for all analyses. Video recordings of the number of steps (n = 166) and speed of the gait task (n = 194) were analyzed and scored by both the study lead neurologist (SS) and rater. DTC was calculated with variable averages between TUG and TUG-DT to determine the change in performance in number of steps and then in task duration. Time cost was calculated as 100*(TUG-DT time – TUG time)/TUG time). Step cost was calculated as 100*(TUG-DT step – TUG step)/TUG step).31 There was missing step data (TUG and TUG-DT) from 28 participants due to camcorder failure or corrupted during file transfer resulting in inaccurate recordings. There were 182 participants with blood biomarker data. Of these participants, there were 2 participants who were excluded due to abnormally high pTau181 concentration levels, and 38 additional participants who had missing pTau217 data. We acknowledge that loss of gait and blood biomarker data could unintentionally bias the results.
One-way analysis of variances (ANOVAs) was used to determine group differences for continuous demographic variables. Chi-square tests and Fisher’s exact tests were used to determine group differences for categorical demographic variables. Sensitivity analyses using one-way ANOVAs and Fisher’s exact tests were conducted to determine differences in age, gender, education, Clinical Dementia Rating Scale scores, Montreal Cognitive Assessment scores, and APOE genotype for individuals included and excluded in each set of analyses (Table S1).
One-way analysis of covariances (ANCOVAs) was employed to determine mean group differences on 16 TUG outcome variables (see Table 2) while controlling for participant age, gender, and years of education. Bonferroni corrections were used to correct for multiple comparisons. Pairwise t-tests were used to determine which groups differed for each outcome.
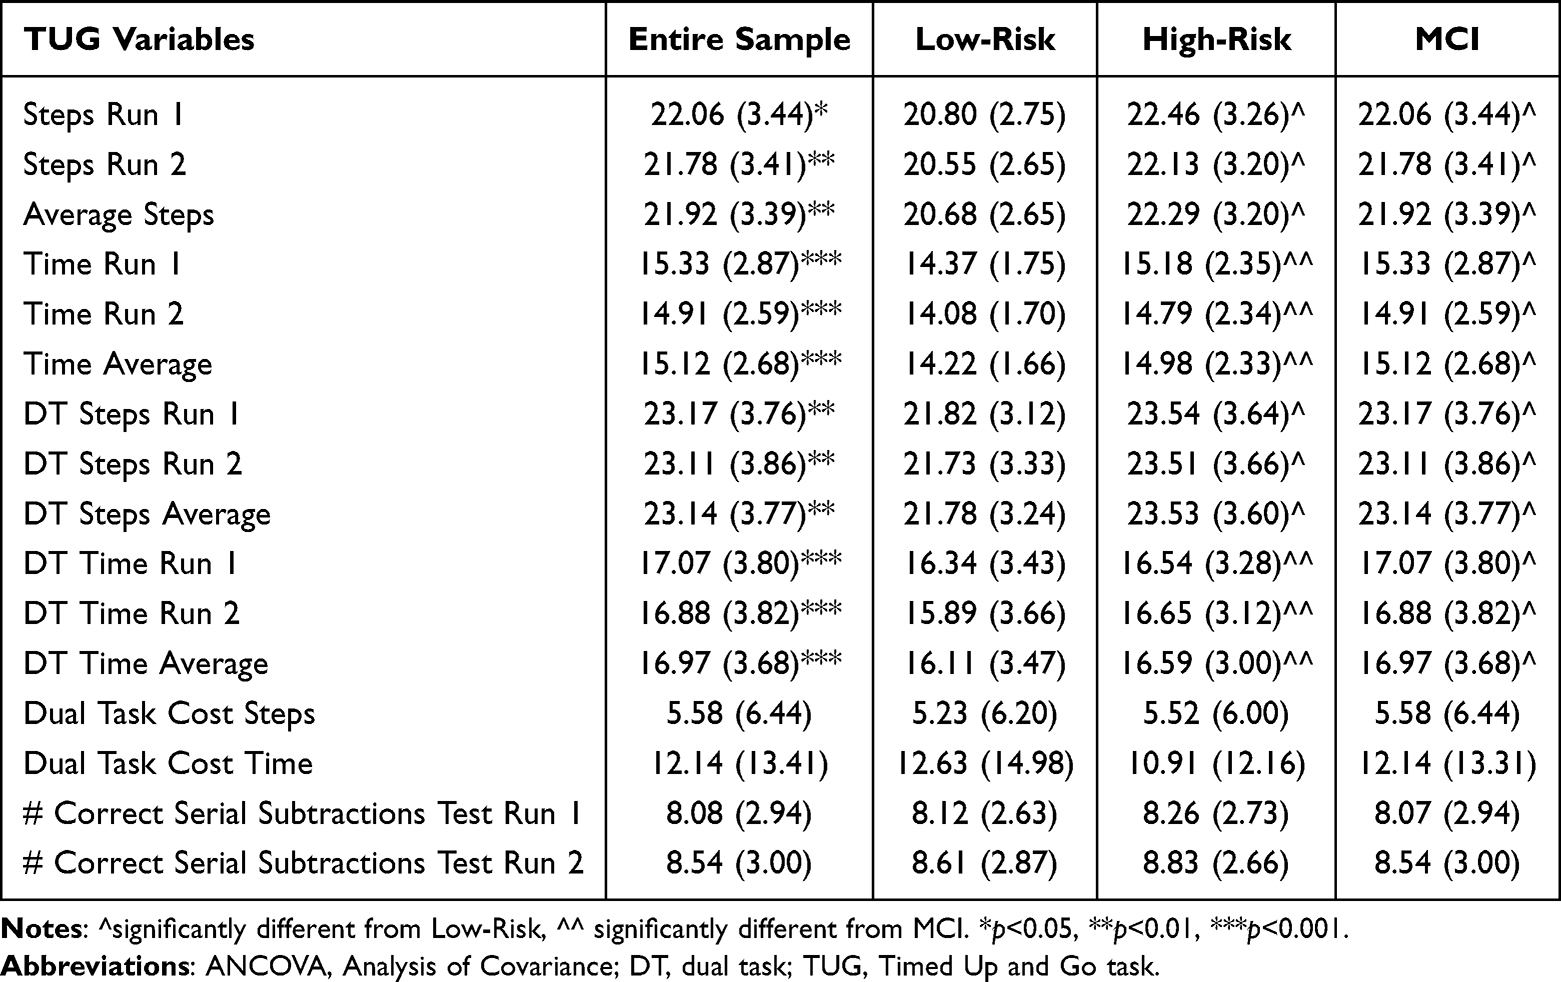 |
Table 2 ANCOVA Results of TUG Variables Controlling for Age, Gender, and Years of Education |
Logistic regressions were conducted in the CU participants with pTau217 data (n = 111) to determine whether average TUG steps, TUG time, TUG-DT steps, or TUG-DT time predicted whether someone was above or below a predetermined threshold for plasma pTau217 (0.495),32 while controlling for age, gender, and education. Model assumptions were checked, including residual plots, linearity of the logit, and outlier checks.
Three sets of generalized additive models (GAMs) were conducted (1. CU group comprised low-risk and high-risk participants, 2. low-risk CU only, 3. high-risk CU only) to examine whether plasma biomarkers predicted TUG outcomes (mean time, mean number of steps), while controlling for age, gender, and years of education. While the use of multiple linear regression was trialed first, model assumptions including the normality of residuals for some predictors were violated. After comparing model fit of multiple linear regression and GAMs using the Akaike information criteria, followed by ANOVAs, all models supported the use of GAMs. GAMs were selected as a non-parametric alternative to linear regression because they provide the flexibility to add both linear predictors and smooth predictors to the model, depending on the linearity of the relationship between each predictor and outcome. To limit the potential for overfitting in our models, we employed the least number of smooth terms necessary by visualizing linearity between predictor and outcome and assessed effective degrees of freedom for the smooth terms to ensure their inclusion was warranted.
Results
Demographics
Table 1 provides a summary of the demographics in the current study. In brief, 194 participants, divided into low-risk (N = 74), high-risk (N = 87), and MCI group (N = 33), were included for TUG analyses (n = 161 for CU). 185 (~95%) of participants were Caucasian, 5 participants were African American, and 3 were Native American. Briefly, groups differed on age (F = 7.75, p < 0.001), gender (F = 5.88, p = 0.002), and MoCA score (F = 63.90, p < 0.001). Post-hoc analyses revealed that the high-risk group was significantly younger and more likely to be women (p < 0.01), and that the MCI group performed worse on the MoCA (p < 0.001). For gait performance, the groups differed on TUG and TUG-DT outcomes. The MCI group completed TUG significantly slower with a higher step count compared to CU groups (p < 0.001). The CU low-risk group completed TUG and TUG-DT fastest with the fewest steps compared to CU high-risk and MCI groups (p=0.001).
For blood biomarker analyses, 180 participants were divided into low-risk (N = 67), high-risk (N = 83), and MCI group (N = 30) for TUG analyses (n = 150 for CU). Groups differed in NfL (F = 7.20, p < 0.001), pTau181 (F = 18.49, p < 0.001), and pTau217 (F = 13.15, p < 0.001) concentrations. Tukey’s post hoc analyses revealed that the MCI group had significantly higher NfL (p < 0.01) than the high-risk group and higher pTau181 and pTau217 levels than both the high-risk (p < 0.01) and low-risk (p < 0.05) groups. The high-risk group had significantly higher levels of pTau217 (p < 0.05) and lower levels of pTau181 (p < 0.01) and NfL (p < 0.05) than the low-risk group.
Group Differences in TUG and TUG-DT Performance
One-way ANCOVAs (controlling for age, gender, and years of education) were run to compare the mean differences between the three groups on trial 1, trial 2, and mean TUG steps, TUG time, TUG-DT steps, TUG-DT time, DTC for steps and time, and the average number of correct serial subtractions. For TUG step analyses, 28 observations were excluded due to missingness in average steps (Total N = 166; see Table S1 for sensitivity analyses). All p-values for group differences were Bonferroni corrected. Exploratory age x gender interactions were tested, however, given no differences in this interaction and no change to the observed group differences, the interaction term was left out to run the most parsimonious models. Increased age was significantly associated with greater steps and time in TUG and TUG-DT outcomes (p < 0.01) and was not significant for DTC or number of correct serial subtractions (p > 0.05). Across groups, males took significantly fewer steps (p < 0.05) on average than females for TUG step outcomes (p <0.05) (Figure S1). There was no gender difference across groups in TUG time (p >0.05) (Figure S1).
For TUG number of steps, there was a significant group difference for number of steps taken in TUG test run 1 (F(2, 161) = 9.08, p <0.01), test run 2 (F(2, 161) = 9.55, p < 0.01), and average across both test runs (F(2, 161) = 9.56, p <0.01). Pairwise t-tests revealed that the low-risk group took significantly less steps than both the high-risk and MCI groups (p < 0.05) (Figure 1). These group differences remained for test run 1 (F(2, 161) = 9.35, p < 0.01) test run 2 (F(2, 161) = 9.05, p < 0.01), and average steps (F(2, 161) = 9.48, p < 0.01) for the TUG-DT. The low-risk group took significantly less steps than both the high-risk and MCI (p < 0.05) groups on the TUG-DT (Figure 1).
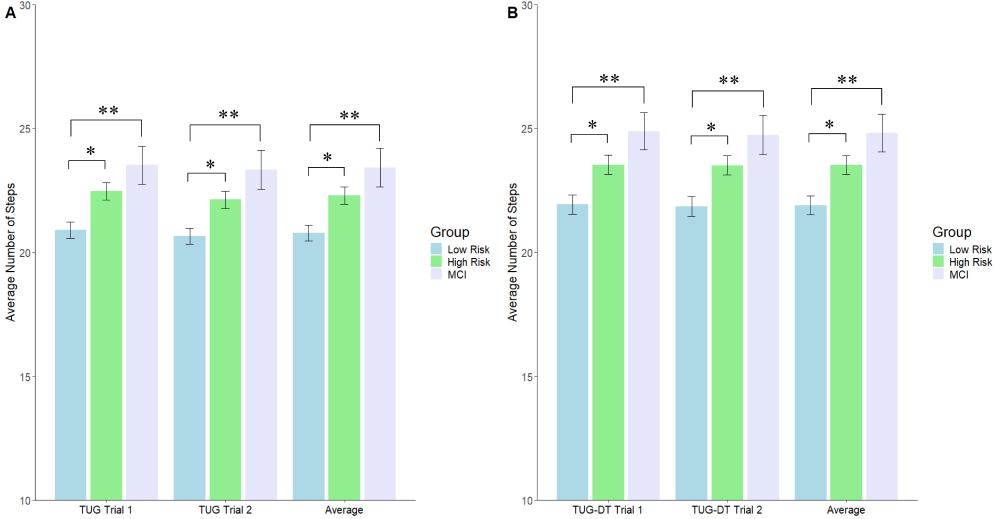 |
Figure 1 Bar graphs representing ANCOVA results for TUG and TUG-DT step performance, accounting for age, gender, and years of education. (A) Compares participant TUG average steps performance across the low-risk, high-risk, and MCI groups. (B) Compares participant TUG-DT average steps performance across the low-risk, high-risk, and MCI groups. The average steps to complete the TUG was recorded in trials 1 and 2, and then averaged to determine the average TUG steps and TUG-DT steps. *p<0.05, **p<0.01. |
For TUG time, there were significant group differences for test run 1 (F(2,189) = 22.08, p < 0.001), test run 2 (F(2,189) = 20.03, p < 0.001), average time (F(2,189) = 22.22, p < 0.001). Pairwise t-tests revealed that the MCI group took significantly more time than both the low-risk and high-risk groups (p < 0.001) (Figure 2). These group differences remained for the mean time of test run 1 (F(2,189) = 14.95), p < 0.001), test run 2 (F(2,189) = 13.30), p < 0.001), and average (F(2,189) = 14.89, p < 0.001) for the TUG-DT. The MCI group took significantly longer than both the low-risk and high-risk groups (p < 0.001).
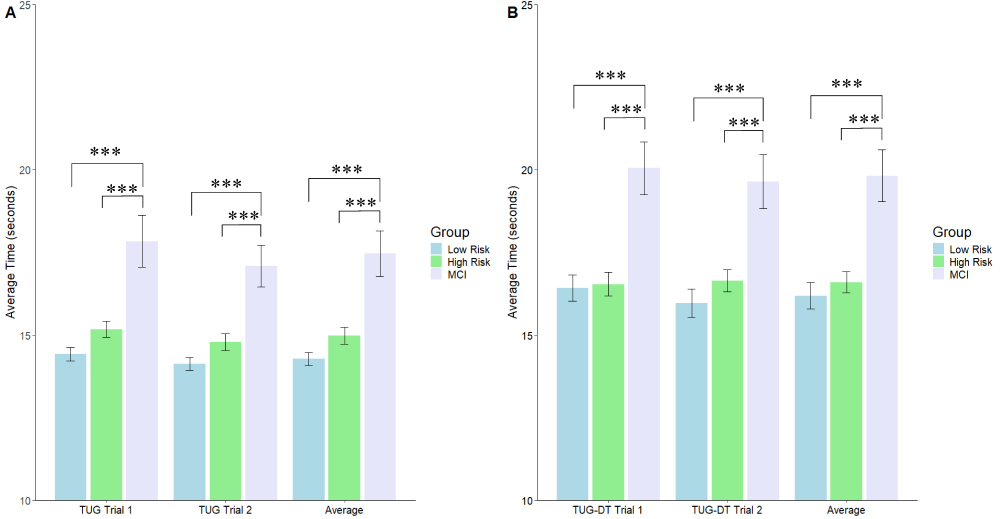 |
Figure 2 Bar graphs representing ANCOVA results for TUG and TUG-DT time, accounting for age, gender, and years of education. (A) Compares participant TUG average completion time across the low-risk, high-risk, and MCI groups. (B) Compares participant TUG-DT average completion time across the low-risk, high-risk, and MCI groups The time to complete the TUG was recorded in trials 1 and 2, and then averaged to determine the average TUG time and TUG-DT time. ***p<0.001. |
There were no significant group differences for dual-task cost steps, dual-task cost time, or number of correct serial subtractions on the TUG-DT in test run 1 or test run 2 (p > 0.05).
Predictive Value of TUG Performance on pTau217
We conducted hierarchical logistic regressions to determine whether TUG or TUG-DT performance predicted pTau217 status (positive vs negative) in the low-risk and high-risk CU sample (n = 111), based on a predetermined cut-off of.495 pg/mL.30 Thirty-nine CU participants were excluded due to missing data (sensitivity analyses in Table S1). All regressions controlled for age, gender, and years of education. As preliminary analysis, gender had a weak association with pTau217 concentration (r = −0.04). An ANCOVA controlling for age, gender, and years of education suggested that the MCI group had significantly higher pTau217 concentration than the low-risk (p <0.01) and high-risk (p=0.05) groups, and that the high-risk group had significantly higher pTau217 concentrations than the low-risk group (p<0.01) after Bonferroni corrections.
In step 1, higher age was a significant predictor of positive pTau217 status (p = 0.02). In steps 2, 3, and 4, gender (p = 0.54), years of education (p = 0.88), and group assignment (p < 0.01) respectively were added to age (p < 0.01) as covariates. In step 5, we added average TUG steps (model 1), average TUG-DT steps (model 2), average TUG time (model 3), or average TUG-DT time (model 4) as a fifth predictor to create 4 different logistic regression models predicting pTau217 status. While models including average TUG steps (p = 0.71) or TUG-DT steps (p = 0.98) and TUG-DT time (p = 0.076) were not statistically significant, average TUG time significantly predicted plasma pTau217 status, with a one-unit increase corresponding to a 41% lower likelihood of positivity (OR = 0.588 (95% CI:0.388,0.833), p = 0.006) while accounting for age (p < 0.001), gender (p = 0.659), and years of education (p = 0.299). Average TUG time remained significant after adjusting for multiple comparisons using Bonferroni correction (p =.03). A Receiver Operating Characteristic (ROC) curve was generated to examine sensitivity and specificity for the model including age, gender, years of education, and average TUG time logistic regression predicting pTau217 status (Figure 3). The area under the ROC curve was 0.826 with a sample prevalence of 21%. The model achieved a 43.5% sensitivity and 97% specificity with positive and negative predictive values of .714 and .866, respectively, in classifying whether someone was pTau217 positive or negative based on average TUG time.
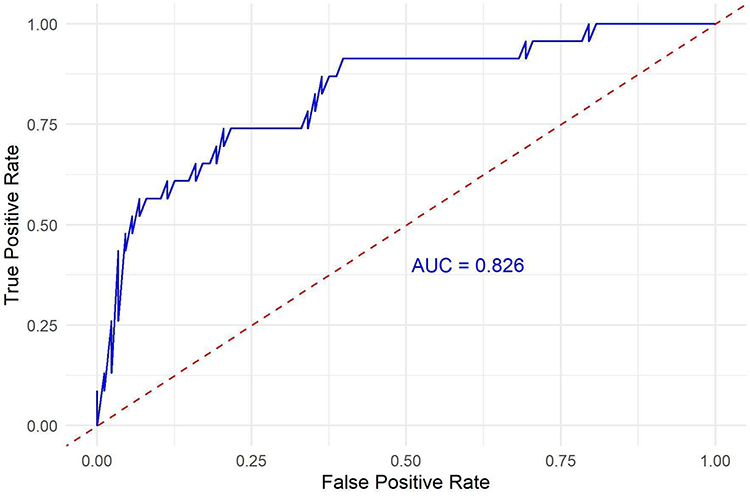 |
Figure 3 ROC curve illustrating the sensitivity and specificity of average TUG time in predicting pTau217 positivity, with an AUC value of .826 indicating strong discrimination for whether participants are below the pTau217 positivity threshold. |
Exploratory Associations of Plasma Biomarkers and TUG Performance
Exploratory hierarchical GAMs were run in a subset of CU participants (N = 91) to determine whether blood biomarker concentrations, including concentrations of plasma Aβ42/40, NfL, pTau181, and pTau217 biomarkers predicted the following outcome measures: 1) average TUG steps, 2) average TUG-DT steps, 3) average TUG time, and 4) average TUG-DT time. From the 150 CU participants with blood biomarker concentrations, 59 additional participants were excluded from these analyses due to missing data in blood biomarkers and average TUG steps (sensitivity analyses in Table S1). We ran the same models for the low-risk (n = 39) and high-risk (n = 52) subsets of the CU group. For each outcome, the following hierarchical models were run:
Model 1: OUTCOME = age
Model 2: OUTCOME = age + gender
Model 3: OUTCOME = age + gender + years of education
Model 4: OUTCOME = age + gender + years of education + Aβ42/40
Model 5: OUTCOME = age + gender + years of education + Aβ42/40 + NFL
Model 6: OUTCOME = age + gender + years of education + Aβ42/40 + NFL + pTau181
Model 7: OUTCOME = age + gender + years of education + Aβ42/40 + NFL + pTau181 + pTau217
The reported models include all predictors as main effects. Since adjusted R-squared is less informative for GAMs, we report both the deviance explained and adjusted R-squared.33 Table 3 and Table 4 show GAM statistics for TUG steps/time and TUGDT steps/time, respectively.
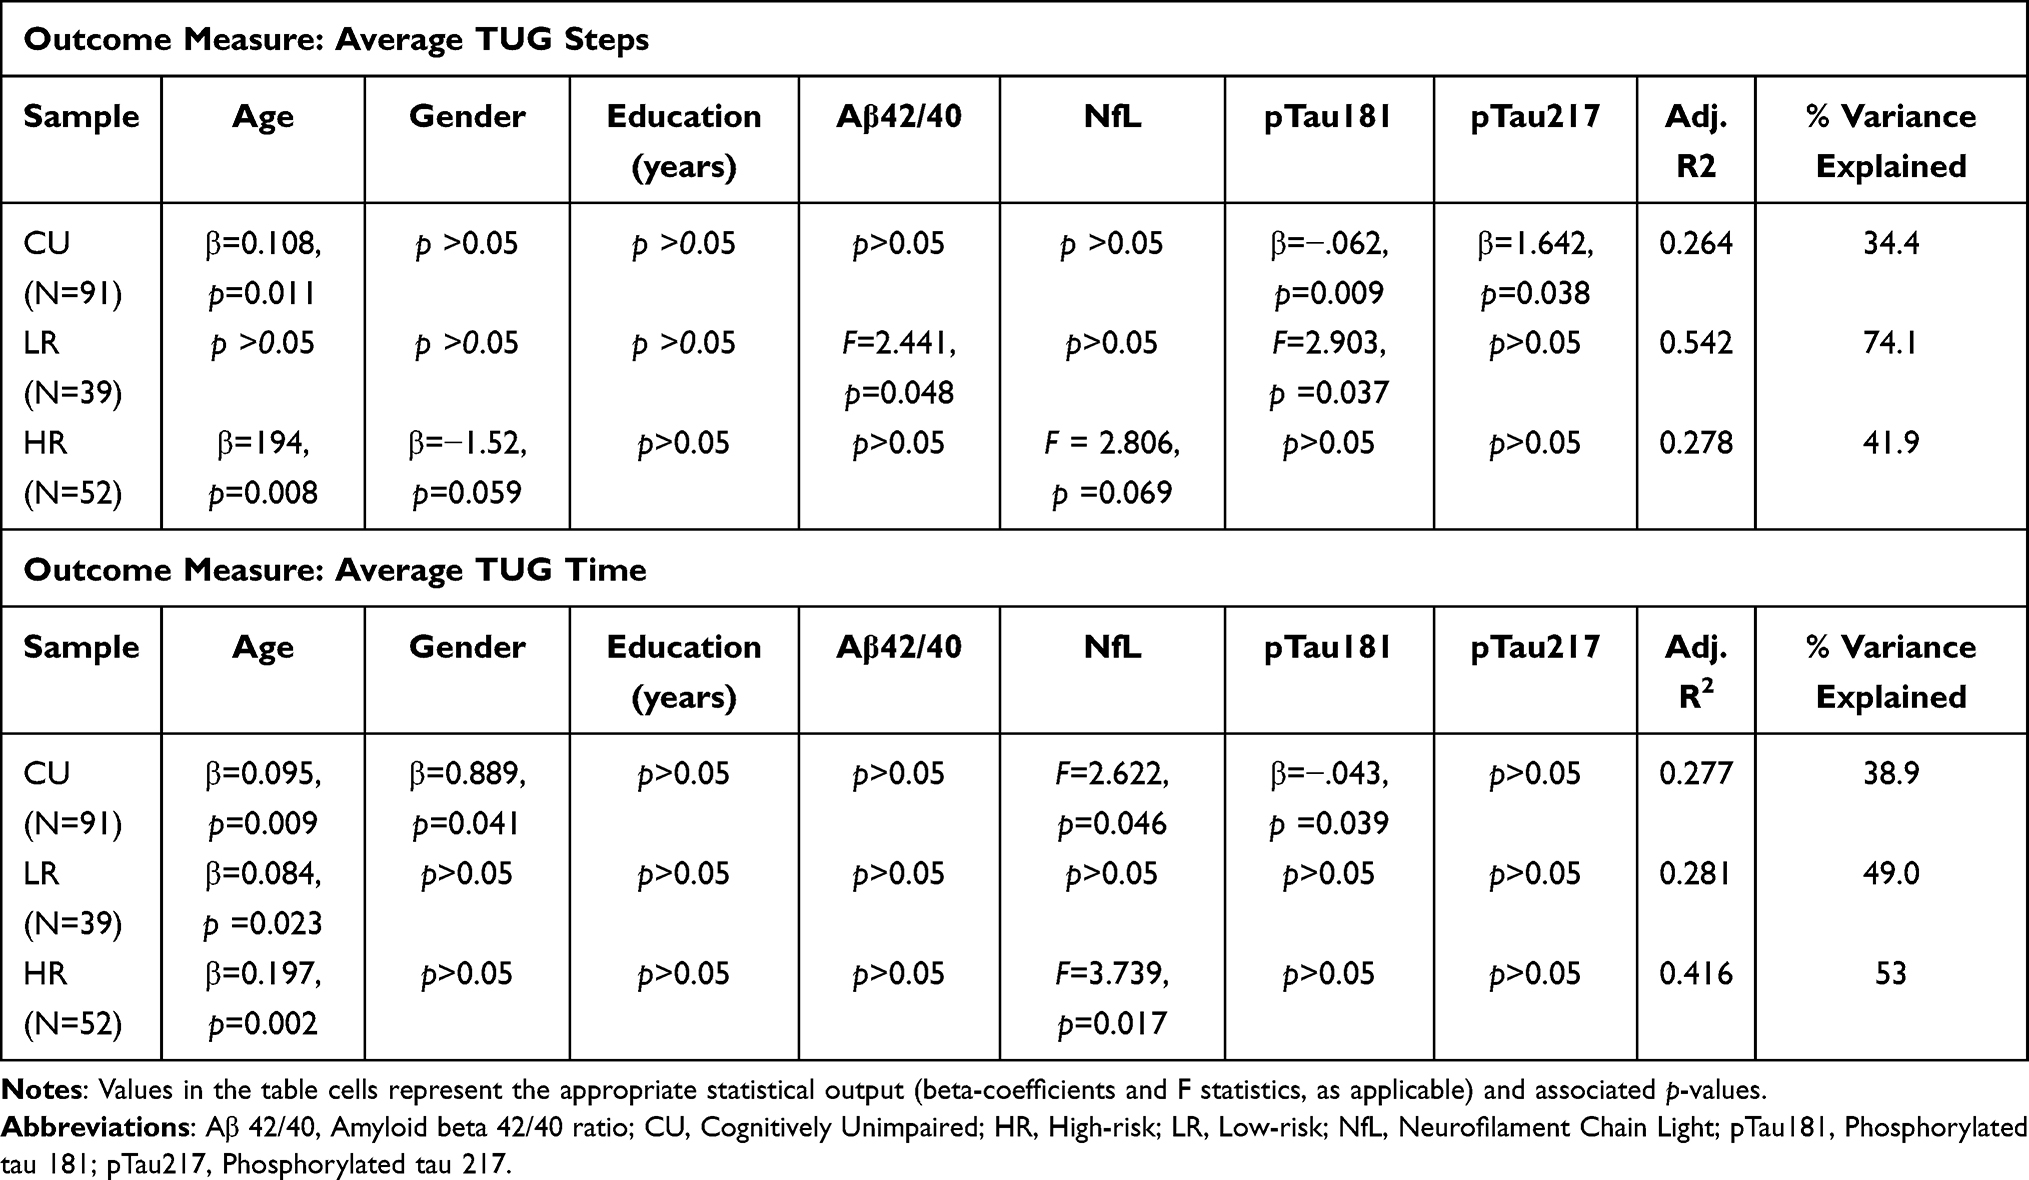 |
Table 3 Generalized Additive Model Results for Timed Up and Go (TUG) Steps and Time Outcomes |
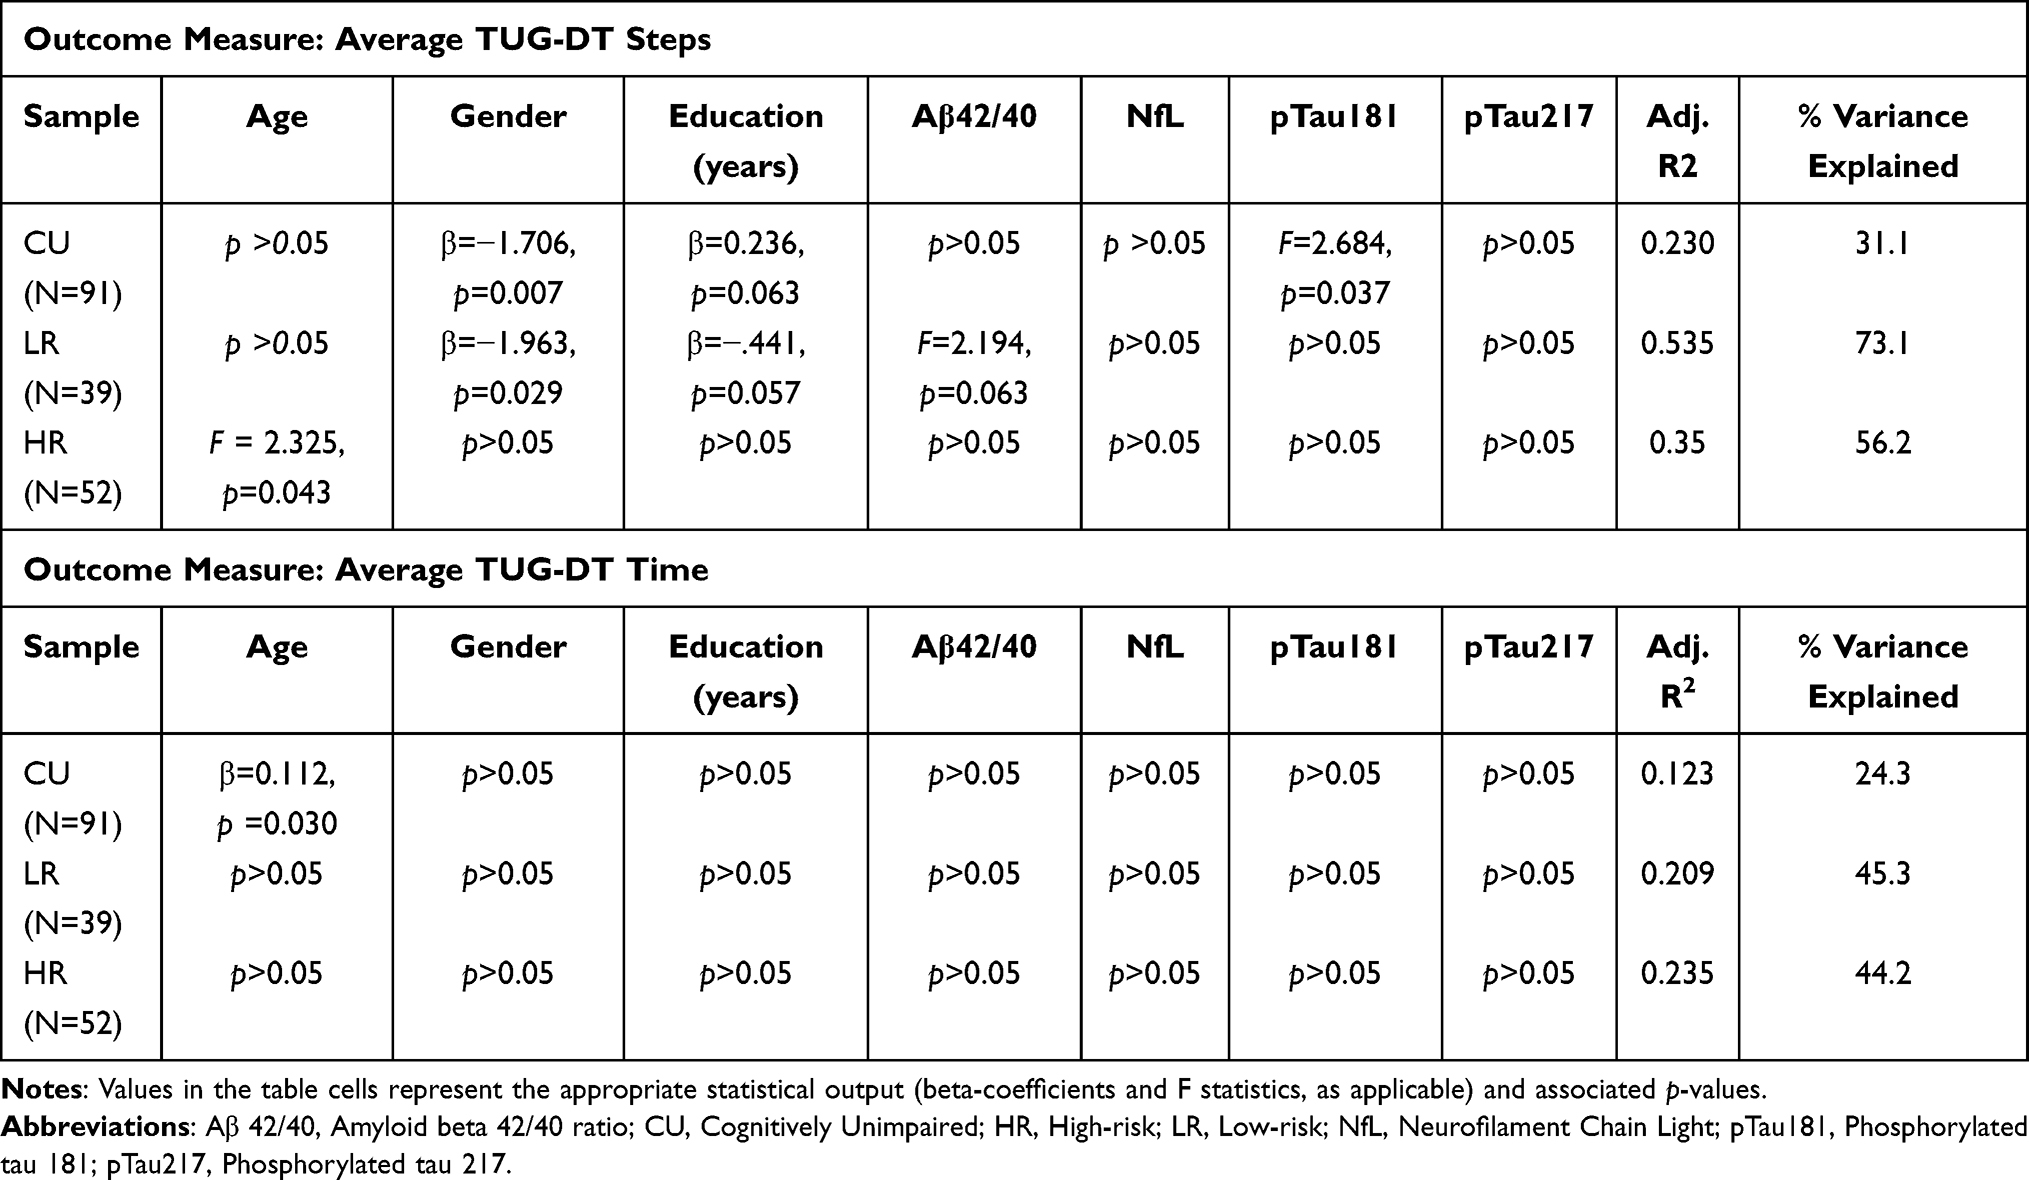 |
Table 4 Generalized Additive Model Results for Timed Up and Go Dual Task (TUG-DT) Steps and Time Outcomes |
In the CU group including low and high-risk CU, the full model predicting average TUG steps showed age, pTau181, and pTau217 as significant predictors, explaining 34.4% of the variance. In the low-risk group, Aβ42/40 and pTau181 were significant. This model explained 74.1% of the variance. In the high-risk group, only age was significant, while NfL was trending toward significance. This model explained 41.9% of the variance. For average TUG-DT steps, gender and pTau181 were significant and the model explained 31.3% of the variance. pTau181 and gender were significant in the low-risk group (73.1% explained). Only age was significant in the high-risk group (56.6% variance explained).
For average TUG time, age, gender, NfL, and pTau181 were significant in the total CU group (38.9% variance explained). Only age was a significant predictor in the low-risk group. In the high-risk group, age and NfL were significant predictors and this model explained 53.0% of the variance. For average TUG-DT time in the CU group, only age was significant (24.3% variance explained). There were no significant predictors in the low-risk group or high-risk groups individually for TUG-DT time.
Discussion
The objectives of this study were to examine: 1) group differences between CU older adults at low and high risk for AD and MCI patients on a standardized clinical measure of gait performance and efficiency and 2) the relationship between gait performance and plasma biomarkers of AD. Our results show notable group differences between CU older adults and MCI patients in gait performance on the TUG and TUG-DT, with MCI patients having a slower gait speed than CU older adults. A novel finding is that our CU high-risk group showed performance similar to the MCI group in terms of gait efficiency (number of steps) in the TUG and TUG-DT, while the CU low-risk group showed greater gait efficiency compared to the CU high-risk and MCI groups. Notably, no significant step differences were found between the high-risk group and the MCI group, suggesting that these individuals may share similar levels of mobility challenges while executing gait tasks.
The group differences in TUG and TUG-DT time showed that the MCI group had slower gait speed than the CU group, with no distinction between the high and low-risk CU groups. However, group differences in TUG and TUG-DT steps showed that both the MCI and high-risk groups took more steps than the lower risk group. This raises the question of whether step metrics may be a more sensitive indicator of early disease changes in at-risk older adults, as supported in other research.34 Larger studies in more diverse samples are needed to replicate this finding, and longitudinal data would help clarify whether step data can be used as a clinical prognostic to detect subtle differences between high- and low-risk older adults for AD.
While preliminary analysis examining unadjusted bivariate associations between plasma biomarkers and gait were not significant (Table 5), we were interested in examining whether TUG performance may predict whether individuals are above or below a threshold for pTau217 positivity since it is well documented that plasma pTau217 is a well-validated biomarker of cerebral amyloidosis.35,36 Blood biomarkers provide a cost-effective and minimally invasive approach compared to other biomarkers (ie amyloid and tau PET, lumbar puncture for CSF), as pTau217 is a comparable biomarker to amyloid PET.37 Our results showed that TUG speed is a specific predictor of plasma pTau217 status in the CU groups (low-risk and high-risk) (Figure 3). As the average TUG time worsened, the likelihood of being below the threshold for pTau217 increased. This is a counterintuitive finding; we would expect that as performance worsens, participants would be more likely to be above the threshold for pTau217. The model (Figure 3) demonstrated low sensitivity and highly specificity, meaning that in this sample, gait speed worked well to identify those below the threshold for pTau217 (few false positives), but weak in identifying those above it. This finding aligns with PET research that support an association between slower gait speed and higher Aβ accumulation in brain regions responsible for gait function, including posterior and anterior putamen, and occipital cortex.38 Taken together, clarifying the utility of the TUG as a potential screening tool in discriminating pTau217 positivity in CU older adults is an important future direction given the TUG is an easy timed gait task widely used in clinical settings.
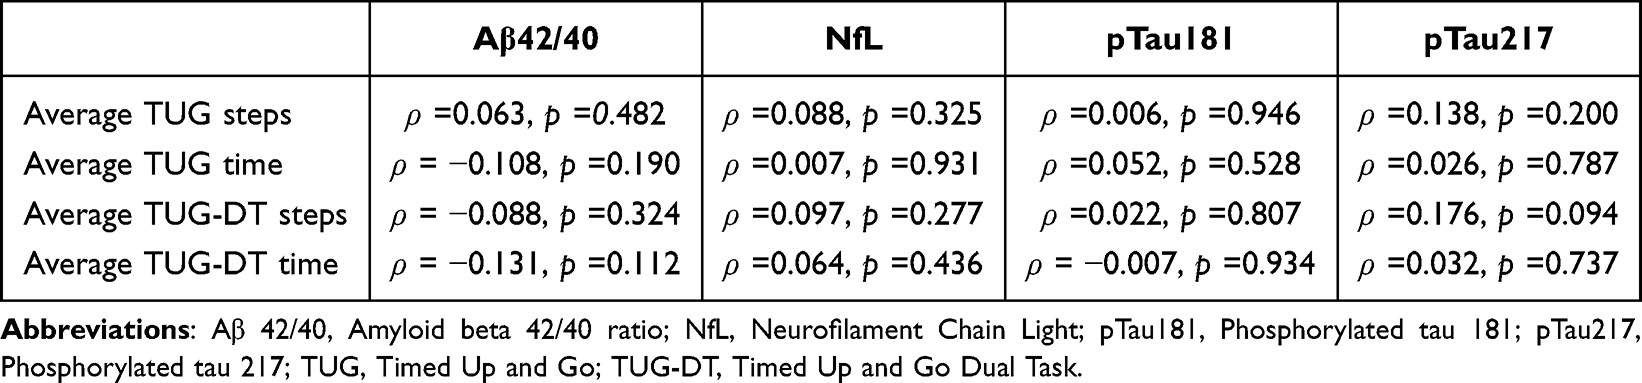 |
Table 5 Bivariate Spearman Correlations Between Blood Biomarkers and TUG Outcomes in the CU Sample (n = 150) |
Our findings showing that plasma biomarkers, specifically pTau181 and pTau217, independently predict gait performance on the TUG and TUG-DT in the combined CU groups are novel. Specifically, pTau181 emerged as a stronger predictor on gait outcomes, while pTau217 contributes to some TUG changes (Table 3 and Table 4). This aligns with our results showing that high-risk CU individuals perform similarly to those in the MCI group in gait efficiency on the TUG and TUG-DT, suggesting a continuum in which tau pathologies impact mobility prior to cognitive decline. While these relationships should be viewed as exploratory, tau plasma biomarkers, when assessed alongside gait metrics, may provide information about preclinical AD risk.
Given previous work using lower-extremity gait tasks showed that individuals with impaired gait performance were 2–3 times more likely to develop AD than someone without motor function deficits,39 the relationship between gait and blood-based biomarkers presents a promising avenue for early detection of AD pathophysiology and potential interventions. Additional clinical evaluation tools that are easily administered and implemented, such as gait tasks and blood analysis, can aid in early detection of those in need of early intervention, such as lifestyle changes and disease modifying therapies.
Limitations and Future Directions
One limitation is that our study method to collect gait metrics was largely observational and subject to human error. Gait assessments could be enhanced by using accelerometers for precise quantitative data,40 reducing potential bias by human observation. Additionally, the use of wearable devices can capture additional gait features (step length, bilateral coordination, stance time, swing time, etc.) that would otherwise be difficult to collect through observation alone. Moreover, precise data would strengthen the ability to find subtle differences between groups. This was mitigated in our study by evaluation of video by multiple raters; however, future studies should implement these technologies to avoid human error.
Additionally, our sample was highly educated, largely White, and does not reflect performance across different races and ethnicities. Given findings suggesting that ethnicity plays a role in the relationship between functional outcomes and plasma biomarkers,23 future work should examine gait performance and plasma biomarkers in larger, more diverse samples, over a longer time to elucidate whether these findings are robust outside of our population.
Finally, the absence of covariates that influence muscle strength, mobility, and physical activity (eg, body mass index, medication use, and kidney function) limits interpretability. Future studies should account for factors, which contribute to a variability in biomarker concentration and gait performance to strengthen the interpretation of the findings.
Conclusion
Despite this study’s limitations, our findings demonstrate that blood biomarker analysis can detect early mobility changes, and combining biomarker assessments with gait task outcomes improves the ability to identify individuals at risk for both mobility and cognitive decline. Gait metrics were associated with AD blood biomarkers, suggesting that subtle motor changes may reflect early AD-related pathologies in unimpaired populations. These results support the theory that gait changes may be one of the earliest clinical manifestations of AD pathophysiology, but additional research is warranted. The variation in the association between specific gait metrics and biomarkers emphasizes the need for a multidimensional approach to gait assessments in a clinical setting. Future research exploring multimodal biomarkers and wearable devices in longitudinal study designs would establish if these combined measures serve as a cost-effective tool for preclinical-AD screening.
Abbreviations
Aβ, Amyloid beta; Aβ-PET, Amyloid positron emission tomography; AD, Alzheimer’s disease; ANCOVA, Analysis of covariance; ANOVA, Analysis of variance; APOE, Apolipoprotein E; BAPR, Butler Alzheimer’s Prevention Registry; GAM, Generalized additive models; MCI, Mild Cognitive Impairment; NfL, Neurofilament light chain; pTau181, Phosphorylated tau 181; pTau217, Phosphorylated tau 217; ROC, Receiver Operating Characteristic; TUG, Timed Up and Go Task; TUG-DT, Timed Up and Go-Dual Task.
Data Sharing Statement
The data reported in this manuscript can be accessed with the permission of the corresponding author.
Funding
This work was supported by a grant from the Ptak Family to the Morton Plant Mease Foundation (to PJS) and a grant from the National Institute on Aging R01AG079241 (to JA).
Disclosure
JA is supported by the National Institute on Aging [R01AG079241, R21AG074153]; the Food and Drug Administration [1-U01FD008399-01]; and the Warren Alpert Foundation. The authors report no other conflicts of interest in this work. The abstract of this paper was presented at the Alzheimer’s Association International Conference (AAIC) 2025 as a poster presentation with interim findings. The poster abstract was published in Alzheimer’s Association International Conference and is available online at: https://alz.confex.com/alz/2025/meetingapp.cgi/Paper/107578
References
1. National Institute on Aging. What causes Alzheimer disease? 2024. Available from: https://www.nia.nih.gov/health/what-causes-alzheimer-disease.
2. National Institute on Aging. Alzheimer’s disease genetics fact sheet. U.S. Department of Health and Human Services. n.d. Available from: https://www.nia.nih.gov/health/alzheimers-causes-and-risk-factors/alzheimers-disease-genetics-fact-sheet.
3. Corder EH, Saunders AM, Strittmatter WJ, et al. Gene dose of apolipoprotein E type 4 allele and the risk of Alzheimer’s disease in late onset families. Science. 1993;261(5123):921–13. doi:10.1126/science.8346443
4. Farrer LA. Effects of age, sex, and ethnicity on the association between apolipoprotein E genotype and Alzheimer disease. A meta-analysis. APOE and Alzheimer disease meta analysis consortium. JAMA. 1997;278(16):1349–1356. doi:10.1001/jama.1997.03550160069041
5. Neu SC, Pa J, Kukull W, et al. Apolipoprotein E genotype and sex risk factors for alzheimer disease: a meta-analysis. JAMA Neurol. 2017;74(10):1178–1189. doi:10.1001/jamaneurol.2017.2188
6. Genin E, Hannequin D, Wallon D, et al. APOE and Alzheimer disease: a major gene with semi-dominant inheritance. Mol Psychiatry. 2011;16(9):903–907. doi:10.1038/mp.2011.52
7. Nadkarni NK, Mawji E, McIlroy WE, Black SE. Spatial and temporal gait parameters in Alzheimer’s disease and aging. Gait Posture. 2009;30(4):452–454. doi:10.1016/j.gaitpost.2009.07.003
8. Pettersson AF, Olsson E, Wahlund L-O. Motor function in subjects with mild cognitive impairment and early Alzheimer’s disease. Dement Geriatr Cognit Disord. 2005;19(5–6):299–304. doi:10.1159/000084555
9. Andrade-Guerrero J, Martínez-Orozco H, Villegas-Rojas MM, et al. Alzheimer’s disease: understanding motor impairments. Brain Sci. 2024;14(11):1054. doi:10.3390/brainsci14111054
10. Zhang W, Low L-F, Schwenk M, Mills N, Gwynn JD, Clemson L. Review of gait, cognition, and fall risks with implications for fall prevention in older adults with Dementia. Geriatr Cogn Disord. 2019;48(1–2):17–29. doi:10.1159/000504340
11. Verghese J, Wang C, Lipton RB, Holtzer R, Xue X. Quantitative gait dysfunction and risk of cognitive decline and dementia. J Neurol Neurosurg Psychiatry. 2007;78(9):929–935. doi:10.1136/jnnp.2006.106914
12. Gras LZ, Kanaan SF, McDowd JM, Colgrove YM, Burns J, Pohl PS. Balance and gait of adults with very mild Alzheimer disease. J Geriatric PhysTher. 2015;38(1):1–7. doi:10.1519/jpt.0000000000000020
13. Herman T, Giladi N, Hausdorff JM. Properties of the ‘timed up and go’ test: more than meets the eye. Gerontology. 2011;57(3):203–210. doi:10.1159/000314963
14. Montero-Odasso MM, Sarquis-Adamson Y, Speechley M, et al. Association of dual-task gait with incident dementia in mild cognitive impairment. JAMA neurol. 2017;74(7):857. doi:10.1001/jamaneurol.2017.0643
15. Jack CR, Andrews JS, Beach TG, et al. Revised criteria for diagnosis and staging of Alzheimer’s disease: alzheimer’s Association workgroup. Alzheimer’s & Dementia. 2024;20(8):5143–5169. doi:10.1002/alz.13859
16. Rafii MS, Sperling RA, Donohue MC, et al. The AHEAD 3-45 study: design of a prevention trial for Alzheimer’s disease. Alzheimers Dement. 2023;19(4):1227–1233. doi:10.1002/alz.12748
17. Coomans EM, Verberk IMW, Ossenkoppele R, et al. A head-to-head comparison Between plasma pTau181 and tau PET along the Alzheimer’s disease continuum. J Nuclear Med. 2023;64(3):437–443. doi:10.2967/jnumed.122.264279
18. Hansson O, Lehmann S, Otto M, Zetterberg H, Lewczuk P. Advantages and disadvantages of the use of the CSF amyloid β (Aβ) 42/40 ratio in the diagnosis of Alzheimer’s disease. Alzheimers Res Ther. 2019;11(1:34. doi:10.1186/s13195-019-0485-0
19. Ng ASL, Tan YJ, Yong ACW, et al. Utility of plasma neurofilament light as a diagnostic and prognostic biomarker of the postural instability gait disorder motor subtype in early Parkinson’s disease. Mol Neurodegener. 2020;15(1):33. doi:10.1186/s13024-020-00385-5
20. Nadkarni AN, Mukamal KJ, Zhu X, et al. Associations of neurological biomarkers in serum with gait measures. Cardiovascu Health Study J Gerontol a Biol Sci Med Sci. 2024;79(5):glae043. doi:10.1093/gerona/glae043
21. Van Dyck CH, Swanson CJ, Aisen P, et al. Lecanemab in early Alzheimer’s disease. N Engl J Med. 2023;388(1):9–21. doi:10.1056/nejmoa2212948
22. Sims JR, Zimmer JA, Evans CD, et al. Donanemab in early symptomatic Alzheimer disease. JAMA. 2023;330(6):512. doi:10.1001/jama.2023.13239
23. O’Bryant S, Petersen M, Hall J, et al. Characterizing plasma NfL in a community-dwelling multi-ethnic cohort: results from the HABLE study. Alzheimer’s & Dementia. 2022;18(2):240–250. doi:10.1002/alz.12404
24. He L, de Souto Barreto P, Aggarwal G, et al. Plasma Aβ and neurofilament light chain are associated with cognitive and physical function decline in non-dementia older adults. Alzheimers Res Ther. 2020;12(1):128. doi:10.1186/s13195-020-00697-0
25. Buracchio T, Dodge HH, Howieson D, Wasserman D, Kaye J. The trajectory of gait speed preceding mild cognitive impairment. Arch Neurol. 2010;67(8):980–986. doi:10.1001/archneurol.2010.159
26. Alber J, Goldfarb D, Thompson LI, et al. Developing retinal biomarkers for the earliest stages of Alzheimer’s disease: what we know, what we don’t, and how to move forward. Alzheimers Dement. 2020;16(1):229–243. doi:10.1002/alz.12006
27. Nasreddine ZS, Phillips NA, Bédirian V, et al. The montreal cognitive assessment, MoCA: a brief screening tool for mild cognitive impairment. J Am Geriatr Soc. 2005;53(4):695–699. doi:10.1111/j.1532-5415.2005.53221.x
28. O’Bryant SE, Gupta V, Henriksen K, et al. Guidelines for the standardization of preanalytic variables for blood-based biomarker studies in Alzheimer’s disease research. Alzheimers Dement. 2015;11(5):549–560. doi:10.1016/j.jalz.2014.08.099
29. O’Bryant SE, Edwards M, Johnson L, et al. A blood screening test for Alzheimer’s disease. Alzheimer’s Dementia. 2016;3(1):83–90. doi:10.1016/j.dadm.2016.06.004
30. Karikari TK, Pascoal TA, Ashton NJ, et al. Blood phosphorylated tau 181 as a biomarker for Alzheimer’s disease: a diagnostic performance and prediction modelling study using data from four prospective cohorts. Lancet Neurol. 2020;19(5):422–433. doi:10.1016/S1474-4422(20)30071-5
31. Ahman HB, Giedraitis V, Cedervall Y, et al. Dual-task performance and neurodegeneration: correlations between timed up-and-go dual-task test outcomes and Alzheimer’s disease cerebrospinal fluid biomarkers. J Alzheimer’s Dis. 2019;71(s1):S75–S83. doi:10.3233/jad-181265
32. Snyder PJ, Alber J, Jeromin A, et al. (2023). Direct comparison of four blood plasma based biomarkers in preclinical Alzheimer’s disease.
33. Wood SN. Generalized additive models: an introduction with R. 2017. chapman and hall/CRC.
34. Löfgren N, Berglund L, Giedraitis V, et al. Extracted step parameters during the timed up and go test discriminate between groups with different levels of cognitive ability—a cross-sectional study. BMC Geriatr. 2025;25(1). doi:10.1186/s12877-025-05828-6
35. Ashton NJ, Brum WS, Di Molfetta G, et al. Diagnostic accuracy of a plasma phosphorylated tau 217 immunoassay for Alzheimer disease pathology. JAMA neurol. 2024;81(3):255. doi:10.1001/jamaneurol.2023.5319
36. Devanarayan V, Doherty T, Charil A, et al. Plasma pTau217 predicts continuous brain amyloid levels in preclinical and early Alzheimer’s disease. Alzheimer’s Dementia. 2024;20(8):5617–5628. doi:10.1002/alz.14073
37. Warmenhoven N, Salvadó G, Janelidze S, et al. A comprehensive head-to-head comparison of key plasma phosphorylated tau 217 biomarker tests. Brain. 2024;awae346. doi:10.1093/brain/awae346
38. Del Campo N, Payoux P, Djilali A, et al. Relationship of regional brain β-amyloid to gait speed. Neurology. 2016;86(1):36–43. doi:10.1212/wnl.0000000000002235
39. Aggarwal NT, Wilson RS, Beck TL, Bienias JL, Bennett DA. Motor dysfunction in mild cognitive impairment and the risk of incident Alzheimer disease. Arch Neurol. 2006;63(12):1763–1769. doi:10.1001/archneur.63.12.1763
40. Marin J, Marin JJ, Blanco T, de la Torre J, Salcedo I, Martitegui E. Is my patient improving? Individualized gait analysis in rehabilitation. Appl Sci. 2020;10(23):8558. doi:10.3390/app10238558
 © 2026 The Author(s). This work is published and licensed by Dove Medical Press Limited. The
full terms of this license are available at https://www.dovepress.com/terms
and incorporate the Creative Commons Attribution
- Non Commercial (unported, 4.0) License.
By accessing the work you hereby accept the Terms. Non-commercial uses of the work are permitted
without any further permission from Dove Medical Press Limited, provided the work is properly
attributed. For permission for commercial use of this work, please see paragraphs 4.2 and 5 of our Terms.
© 2026 The Author(s). This work is published and licensed by Dove Medical Press Limited. The
full terms of this license are available at https://www.dovepress.com/terms
and incorporate the Creative Commons Attribution
- Non Commercial (unported, 4.0) License.
By accessing the work you hereby accept the Terms. Non-commercial uses of the work are permitted
without any further permission from Dove Medical Press Limited, provided the work is properly
attributed. For permission for commercial use of this work, please see paragraphs 4.2 and 5 of our Terms.
Recommended articles
L-α-GPC in Cognitive Decline: Mechanisms and Clinical Evidence in Neurodegenerative Disorders
Putri VA, Hapsari RS, Amalia R
Neuropsychiatric Disease and Treatment 2026, 22:579603
Published Date: 19 May 2026