")
Back to Journals » Clinical Epidemiology » Volume 9
The relation of CUN-BAE index and BMI with body fat, cardiovascular events and diabetes during a 6-year follow-up: the Hordaland Health Study
Authors Vinknes KJ , Nurk E , Tell GS , Sulo G, Refsum H, Elshorbagy AK
Received 29 June 2017
Accepted for publication 26 September 2017
Published 8 November 2017 Volume 2017:9 Pages 555—566
DOI https://doi.org/10.2147/CLEP.S145130
Checked for plagiarism Yes
Review by Single anonymous peer review
Peer reviewer comments 4
Editor who approved publication: Professor Henrik Sørensen
Kathrine J Vinknes,1 Eha Nurk,1,2 Grethe S Tell,3 Gerhard Sulo,3 Helga Refsum,1,4 Amany K Elshorbagy4,5
1Department of Nutrition, Institute of Basic Medical Sciences, Faculty of Medicine, University of Oslo, Oslo, Norway; 2Department of Surveillance and Evaluation, National Institute for Health Development, Tallinn, Estonia; 3Department of Global Public Health and Primary Care, University of Bergen, Bergen, Norway; 4Department of Pharmacology, University of Oxford, Oxford, UK; 5Department of Physiology, Faculty of Medicine, University of Alexandria, Alexandria, Egypt
Objective: We compared Clínica Universidad de Navarra-Body Adiposity Estimator (CUN-BAE) and body mass index (BMI) as correlates of body fat percent (BF%) and the association with future risk of cardiovascular disease (CVD) and type 2 diabetes in a Caucasian population.
Methods: We used data from 6796 individuals (born 1925–27 and 1950–52) from the Hordaland Health Study, a prospective cohort study in Norway. The study was conducted in 1992–1993 and 1997–1999. Cross-sectional analyses were conducted with data from 1997/99, including BF% measured by dual-energy X-ray absorptiometry. Longitudinal analyses included BMI and CUN-BAE calculated in 1992/93, and self-reported information on CVD events and diabetes in 1997/99.
Results: The correlation between CUN-BAE and BF% (r=0.88) was stronger than between BMI and BF% (r=0.56). In sex-stratified analyses, CUN-BAE and BMI correlated similarly with BF% in men (r=0.77 and r=0.76, respectively) and women (r=0.82 and r=0.81, respectively). In longitudinal analyses, the odds ratio (per 1 SD increase) of CVD and type 2 diabetes was higher for BMI (ORCVD =1.23 [95% CI: 1.11–1.36]; ORdiabetes =2.11 [1.82–2.45]) than for CUN-BAE (ORCVD =1.15 [1.04–1.27]; ORdiabetes =2.06 [1.72–2.47]) in the total population. In sex-stratified analyses, CUN-BAE showed higher CVD and diabetes risk than BMI: in men BMI ORCVD =1.22 (1.04–1.44), ORdiabetes =2.13 (1.64–2.83); CUN-BAE ORCVD =1.93 (1.54–2.43), ORdiabetes =4.33 (2.80–6.71); and in women BMI ORCVD =1.22 (1.07–1.39), ORdiabetes =2.11 (1.76–2.53); CUN-BAE ORCVD =2.06 (1.69–2.51), ORdiabetes =5.45 (3.87–7.67).
Conclusion: CUN-BAE is more strongly associated with future risk of type 2 diabetes and CVD compared with BMI in analysis stratified by sex. As a measure of adiposity in men and women separately, CUN-BAE has no advantage over BMI, except when the value of estimated BF% itself is of interest.
Keywords: anthropometry, body composition, body fat, body mass index, cardiovascular disease risk, diabetes risk
Introduction
In epidemiological studies and clinical work, various indexes are used as anthropometric measurements of body fatness such as waist to height, weight to height, body mass index (BMI; kg/m2), and the Rohrer index (kg/m3).1 The use of BMI is the most common way to assess overweight and obesity. There are several known limitations with BMI such as the lack of reflecting body fat differences across sex, age and race,2,3 as well as classifying individuals with high muscle mass as overweight or obese.4 Therefore, new practical adiposity indices are frequently suggested as more accurate estimators of body fat such as the body adiposity index (BAI)5 and the Clínica Universidad de Navarra-Body Adiposity Estimator (CUN-BAE).6 Previously, we evaluated the BAI based on hip circumference and height.7 This index showed good agreement with body fat percent (BF%) at the population level, but not when men and women were evaluated separately, possibly due to the higher correlation between hip circumference and BF% in women than in men. Furthermore, BAI substantially underestimated BF% in overweight and obese individuals (>25 kg/m2). Another index developed by a group of researchers to predict BF%, is CUN-BAE, which is based on age, sex, and BMI.6,8 This index, which was developed from data on 6510 white men and women aged 18–80 years, showed the highest correlation with BF% measured by air displacement plethysmography compared with other anthropometric measures.6 In the same study, the authors reported similar results in a separate cohort of white men and women aged 17–76 years (n=1149). In addition, the CUN-BAE index was better correlated with cardiometabolic risk factors than BMI and waist circumference in a third group of 634 white men and women. Few studies have compared this index with direct measures of body fat. In a group of 40 Caucasian subjects aged 61–84 years, Lara et al9 showed that CUN-BAE estimates were similar to fat mass measurements by air displacement plethysmography but not with dual-energy X-ray absorptiometry (DXA). In 3200 Caucasian men and women aged 18–65 years, Fuster-Parra et al10 found similar correlations of BMI, BAI and CUN-BAE with body fat measured by bioelectrical impedance analysis.
The increasing interest in body fat estimation derives primarily from the association of body adiposity with major chronic diseases, including type 2 diabetes, cardiovascular disease (CVD) and cancer.11,12 Therefore, the clinical usefulness of an adiposity index largely depends on its ability to predict obesity-related morbidity. The cross-sectional associations of CUN-BAE with biochemical risk markers of CVD, and with odds ratio (OR) of hypertension and type 2 diabetes have been reported.13,14 However, the associations of CUN-BAE estimates with hard CVD events, such as myocardial infarction and stroke, have not been evaluated.
In the present study, we used data from a large Caucasian cohort to: 1) compare the cross-sectional correlations of CUN-BAE, BMI, BAI, and other anthropometric variables with BF% measured by DXA; 2) examine the associations of CUN-BAI and BMI with the risk of type 2 diabetes and CVD events during a median 6-year follow-up.
Methods
Study population
The present study uses data from 2 surveys in the Hordaland Health Study (HUSK), which was conducted as a collaboration between the University of Bergen, the National Health Screening Service (now part of the Norwegian Institute of Public Health), and local health services in Bergen, Norway. The first examination was in 1992–1993 (the Hordaland Homocysteine Study [HHS]-I), and the second was conducted in a subgroup during 1997–1999 (HHS-II/HUSK). Participants from both surveys (N=6796) were men and women from 2 age groups: middle aged (47–49 years in 1999) and elderly (71–74 years in 1999). Prior history of CVD was collected from self-administered questionnaires in both surveys and validated with computerized records containing discharge diagnoses for all hospitalizations occurring between the baseline screening and May 31, 1998, at the 6 hospitals serving Hordaland County.15 DXA measurements of body composition were conducted in a subset of the study population in 1997–1999. Further details of the study protocol have been described previously.16 The study protocol was reviewed by the Regional Committee for Medical and Health Research Ethics of Western Norway, approval no. 2009/825/REK Vest. Each participant signed an informed consent.
The current study includes 2 sets of analyses, each addressing 1 of the study objectives. The first set uses data from the survey conducted in 1997–1999 and analyzes the correlations of CUN-BAE and other anthropometric measures with BF% and agreement between CUN-BAE and BF%. Data for this analysis were available for 5193 men and women. The second set is a longitudinal analysis of the association of CUN-BAE and BMI (assessed in 1992–1993) and subsequent CVD events (self-reported in 1997–1999). This analysis was conducted in 5339 (in CVD subgroup analyses the N is 1%–2% higher) men and women who had data available on the required anthropometric measures at HHS, and information on prevalent CVD at both surveys. For hypertension and diabetes, data were available from, 6124 to 6796 participants, respectively. The number of subjects at each stage of the study is depicted in Figure S1. For the purpose of this study, CVD events included angina pectoris, myocardial infarction and cerebrovascular stroke. Hypertension was analyzed as a separate outcome, and defined as being on antihypertensive treatment. Presence of type 2 diabetes was assessed by self-report with the item “have you, or have you had diabetes”. Participants with recorded CVD or diabetes in 1992–1993 were excluded in the longitudinal analysis predicting risk of CVD events or type 2 diabetes between the 2 surveys. Since our analysis was based on those who developed diabetes after the age of 47, we assumed that the type of diabetes developed was type 2 in all cases.
Anthropometric and body composition measurements
In both surveys, height and weight were measured in light clothing, without shoes, to the nearest 1 cm and 0.5 kg, respectively, and BMI was calculated as the ratio of weight in kilograms to the square of height in meters. Overweight and obesity were defined according to the World Health Organization definition as BMI equal to 25–29.9 and ≥30 kg/m2, respectively. Waist circumference was measured (in 1997–1999) at the umbilicus to the nearest 1 cm and with the subject standing and breathing normally. Hip circumference was measured (in 1997–1999) as the maximum circumference around the buttocks. CUN-BAE was calculated as −44.988+(0.503 × age)+(10.689 × sex)+(3.172 × BMI) − (0.026 × BMI2)+(0.181 × BMI × sex) − (0.02 × BMI × age) – (0.005 × BMI2 × sex)+(0.00021 × BMI2 × age) where male = 0 and female = 1 for sex, and age in years.6 BAI was calculated as (hip circumference [cm]/height [m]1.5)−18.5 Rohrer index was calculated as weight in kilograms divided by height in meters cubed.1
Body composition was assessed by DXA17 on a stationary fan-beam densitometer using EXPERT-XL software (version 1.72−1.9; Lunar Corporation, Madison, WI, USA), as previously described.18 The coefficient of variation for fat mass was 1.9%.
Statistical analyses
Pearson’s correlation coefficients were used to evaluate associations of CUN-BAE, anthropometric measurements and metabolic risk factors with BF%. We assessed the significance of the difference between 2 correlation coefficients by using the Fisher r-to-z transformation. To visually compare the CUN-BAE and DXA data, we used Bland–Altman plots.19,20 The plots show the difference between the 2 methods on the y axes (CUN-BAE – DXA) vs the average of the 2 measurements on the x axes ([CUN-BAE + DXA]/2). The limits of agreement between the 2 methods were defined as mean difference ± 1.96 SD.20 To study the association of BMI and CUN-BAE calculated from HHS in 1992 with CVD risk over 6 years, logistic regression models were used. BMI and CUN-BAE were expressed as standardized z-scores to provide comparable associations per 1 SD increase. We calculated OR and 95% CI for type 2 diabetes and CVD events between 1992 and 1999 for 1 SD increase in BMI and CUN-BAE calculated from 1992. Participants reporting CVD events or diabetes in 1992 were excluded from the logistic regression analysis. We conducted 3 models: An unadjusted model (Model 1) and 2 multivariate-adjusted models. The multivariate models included age, sex (in analyses with the total group), and smoking status (Model 2); and, additionally, serum cholesterol level, systolic blood pressure, and type 2 diabetes in models with CVD (Model 3). The covariates included in the adjusted models were selected based on their significant correlations both with the independent variables (CUN-BAE and BMI) and outcomes (CVD events and diabetes). Physical activity level, education and alcohol intake did not change the models appreciably and these variables were therefore not included in the final analyses. Statistical analyses were performed using IBM SPSS Statistics for WINDOWS (22.0; IBM Corp., Armonk, NY, USA). Tests of significance were 2-tailed and P≤0.05 was considered significant.
Results
Characteristics of the study population
The study population (5193 individuals out of 6796 with complete data available) consisted of 57.6% women, and included 2 age groups; 59.4% aged 47–49 years, and 40.6% aged 71–74 years in 1999 (Table 1). The mean BF% (standard deviation) determined by DXA was 25.8 (7.5%) in men and 38.1 (8.2%) in women, whereas the mean BF% estimated by the CUN-BAE was 27.3 (4.3%) in men and 37.9 (5.4%) in women. About 62.9% of men were overweight or obese (BMI >25 kg/m2), compared with 47.2% of women.
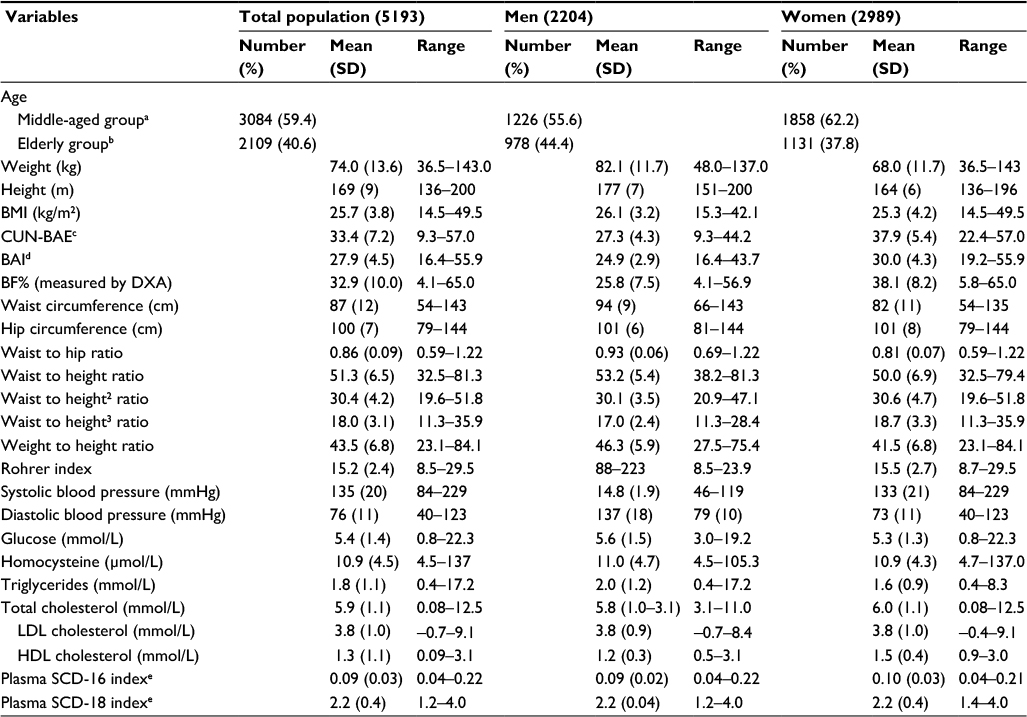 | Table 1 Characteristics of participants in the Hordaland Health Study (1997–1999) Notes: aMiddle-aged group: 47–49 years of age. bElderly group: 71–74 years of age. cCUN-BAE = -44.988+(0.503 × age)+(10.689 × sex)+(3.172 × BMI) - (0.026 × BMI2)+(0.181 × BMI × sex) - (0.02 × BMI × age) - (0.005 × BMI2 × sex)+(0.00021 × BMI2 × age) where male = 0 and female = 1 for sex, and age in years. dBody adiposity index: hip (cm)/height (m)1.5 - 18. en = 2021 in total group, n = 924 men and 1097 women. Abbreviations: BAI, Body adiposity index; BF%, body fat percentage; BMI, body mass index; CUN-BAE, Clínica Universidad de Navarra-Body Adiposity Estimator; DXA, dual-energy X-ray absorptiometry; HDL, high-density lipoprotein; LDL, low-density lipoprotein; SCD, stearoyl-coenzyme A desaturase. |
Correlations of CUN-BAE with BF%, anthropometric measurements and metabolic risk factors
Of all the anthropometric measurements, CUN-BAE showed the highest correlation with BF% measured by DXA (r=0.88) in the total population, followed by BAI (r=0.78), while BMI showed a weaker correlation (r=0.56) (P<0.001 for all pairwise comparisons between the correlation coefficients) (Figure 1; Table S1). In analysis stratified by sex, CUN-BAE showed the highest correlation with BF% (for men, r=0.77; for women, r=0.82), and BMI showed essentially similar correlations (for men, r=0.76; for women, r=0.81) that were not significantly different from the correlations between CUN-BAE and BF%. The correlation of BAI with BF% was weaker (for men, r=0.57; for women, r=0.72) compared with CUN-BAE and BMI (P<0.001 for both comparisons). Similar correlations with BF% were observed for BMI, CUN-BAE and BAI when stratified by age group (data not shown). The correlations of metabolic risk factors with BF%, BMI, CUN-BAE, BAI and waist circumference are shown in Table S2.
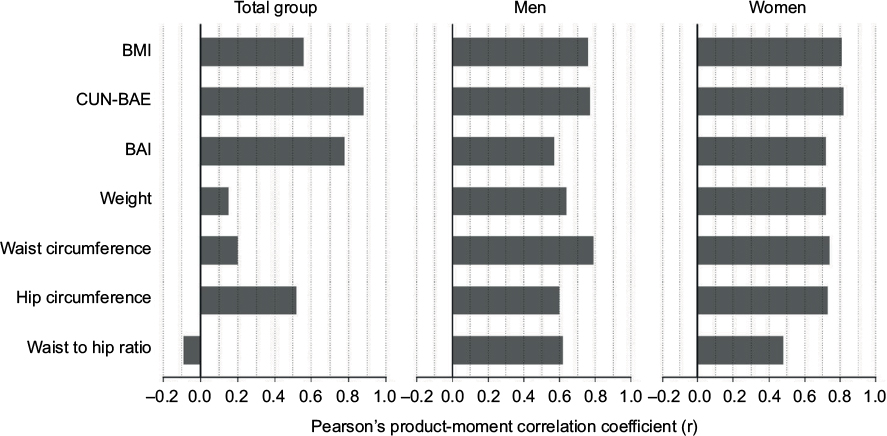 | Figure 1 Correlations of anthropometric variables and body adiposity indices with BF% measured by DXA in the Hordaland Health Study (1997–1999). Notes: The X-axis represents Pearson’s product-moment correlation coefficient (r) for the total group and in men and women separately. Abbreviations: BAI, body adiposity index, BMI, body mass index; BF%, body fat percentage; CUN-BAE, Clínica Universidad de Navarra-Body Adiposity Estimator; DXA, dual-energy X-ray absorptiometry |
Agreement plot between BF% measured by DXA and CUN-BAE
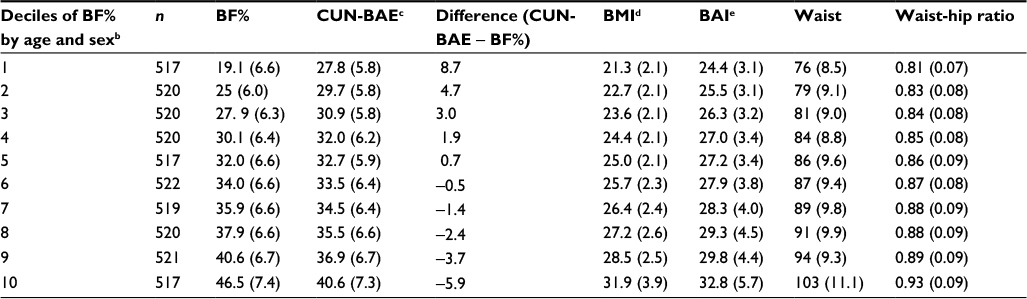
The Bland–Altman plots of the agreement between BF% as measured by DXA and calculated by CUN-BAE showed a tendency toward overestimation of BF% by the CUN-BAE in subjects with lower BF% and underestimation of BF% in subjects with higher BF% (Figure 2). The mean (SD) difference in body fat between CUN-BAE and DXA was −0.51 (5.03%) in the total population, +1.52 (5.02%) in men and −0.24 (4.90%) in women. The mean differences showed similar patterns for men and women in the 2 age groups, except the positive mean difference for women in the elderly group (+0.40 [5.15%]). Comparing mean BF% by DXA to CUN-BAE in sex-specific deciles according to BF% by DXA (Table 2) confirmed the findings from the Bland–Altman plots (Figure 2). Both CUN-BAE and BAI overestimated BF% in normal weight subjects with lower BF% (Table 2), and underestimated BF% in overweight or obese subjects with higher BF%, but the underestimation error in case of CUN-BAE (e.g., −5.8% in the highest decile of BF%) was smaller than that of BAI (−13.8%). CUN-BAE predicted BF% best for deciles in the BMI range 24–26 kg/m2. The comparison between BF% and CUN-BAE in age and sex-specific deciles of BF% were similar as in the sex-specific deciles (Table S3).
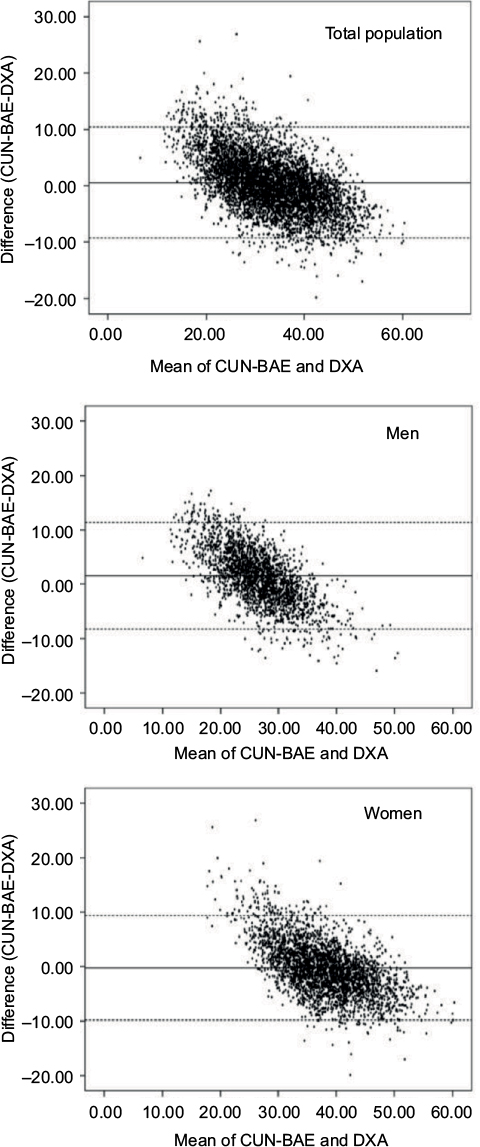 | Figure 2 Comparison of body fat percentage as measured by CUN-BAE and dual-energy X-ray in men and women in the Hordaland Health Study (1997–1999). Notes: Bland–Altman plots show the difference between CUN-BAE and DXA measurements against the mean of CUN-BAE and DXA measurements. The solid lines represent the average difference between CUN-BAE and DXA measurements. The dotted lines are the 95% limits of agreement (mean ± 1.96 SD). Abbreviations: DXA, dual-energy X-ray absorptiometry; CUN-BAE, Clínica Universidad de Navarra-Body Adiposity Estimator. |
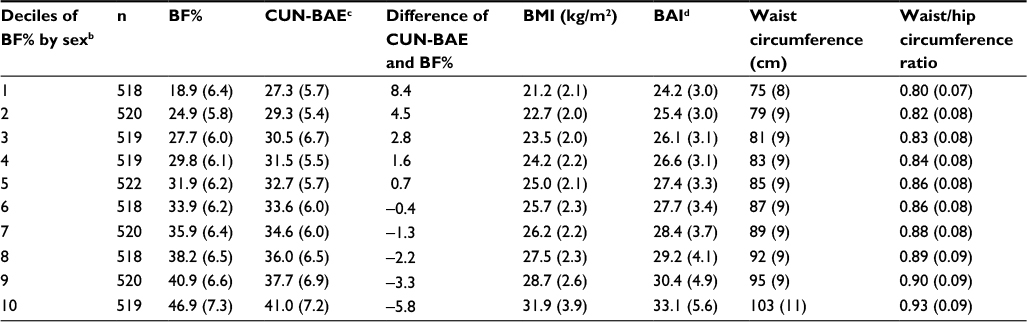 | Table 2 Classification of subjects in the Hordaland Health Study (1997–1999) according to deciles of estimated BF% from DXA measurements and the difference between BF% from DXA measurements and CUN-BAEa Notes: aData are mean (SD) unless otherwise indicated. bThe deciles were estimated separately for men and women and the results are presented combined for both sexes. cCUN-BAE = −44.988+(0.503 × age)+(10.689 × sex)+(3.172 × BMI) − (0.026 × BMI2)+(0.181 × BMI × sex) − (0.02 × BMI × age) − (0.005 × BMI2 × sex)+(0.00,021 × BMI2 × age) where male = 0 and female = 1 for sex, and age in years. dBody adiposity index: hip (cm)/height (m)1.5–18. Abbreviations: BAI, Body adiposity index; BF%, body fat percentage; BMI, body mass index; CUN-BAE, Clínica Universidad de Navarra-Body Adiposity Estimator; DXA, dual-energy X-ray absorptiometry. |
The relations of CUN-BAE and BMI with future risk of CVD and type 2 diabetes
During a median of 6 years follow-up, 462 individuals (4.7% of men and 3.6% of women) developed CVD and 130 individuals (0.9% of men and 1.0% of women) developed diabetes (assumed to be type 2 due to older age of the participants at onset). Table 3 shows the OR for risk of developing CVD, hypertension and type 2 diabetes at follow-up (HUSK) for 1 SD increase in BMI or CUN-BAE at baseline (HHS) in unadjusted analysis (Model 1); and after adjustment for smoking status, in addition to age (and sex in analyses with the total group) for BMI (Model 2). One SD of BMI represents 3.6 kg/m2 in the total group, 3.1 kg/m2 in men and 3.9 kg/m2 in women. For CUN-BAE, 1 SD represents 7.5% body fat in the total group, 4.5% in men, and 5.5% for women. In the total population, the OR for CVD risk was slightly higher for BMI than CUN-BAE in unadjusted analysis, as well as in Model 2 (Table 3) and after further adjustment for serum cholesterol level, systolic blood pressure, and type 2 diabetes in models predicting CVD (Model 3, BMI: OR =1.24, 95% CI: 1.12, 1.38 per 1 SD increase; CUN-BAE: OR =1.11, 95% CI: 1.00, 1.23).
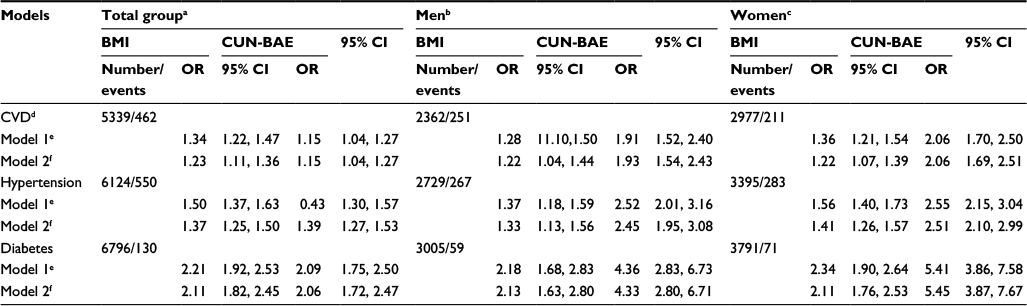 | Table 3 OR and 95% CI for CVD and diabetes risk for one SD increase in baseline BMI and CUN-BAE in the Hordaland Health Study (1992–1993 and 1997–1999) Notes: aOne SD in the total group: BMI, 3.6 kg/m2; CUN-BAE, 7.5% body fat. bOne SD in men: BMI, 3.1 kg/m2; CUN-BAE, 4.5% body fat. cOne SD in women: BMI, 3.9 kg/m2; CUN-BAE, 5,5% body fat. dCVD includes stroke, myocardial infarction, and angina from 1992 through 1999. eModel 1: Unadjusted analyses. fModel 2: Adjusted for smoking status, in addition age (and sex in analyses with the total group) for BMI. Abbreviations: BMI, body mass index; CI, confidence interval; CUN-BAE; Clínica Universidad de Navarra-Body Adiposity Estimator, CVD, cardiovascular disease risk; OR, odds ratio. |
Similar patterns were observed for risk of type 2 diabetes. However, the associations of CUN-BAE, but not BMI, were stronger in sex-stratified analyses. In men, increasing CUN-BAE was associated with higher risk of CVD (Model 2) and type 2 diabetes compared with BMI. In women, the increase in CVD and diabetes risk was similarly greater with increasing CUN-BAE compared with BMI.
The relation of CUN-BAE and BMI with risk of hypertension is shown in Table 3. CUN-BAE showed stronger associations with hypertension than BMI in both the total population and in sex-stratified analysis. In Model 2, 1 SD increase in CUN-BAE in women was associated with a 2.5-fold increase in the risk of hypertension, compared with a 1.4-fold increase in the risk for 1 SD increase of BMI. For all outcomes, the results were nearly similar after further adjustments for serum cholesterol level, systolic blood pressure, and type 2 diabetes in models with CVD (Model 3, data not shown). When the 2 age groups were examined separately, CUN-BAE weaker associated with risk of CVD, type 2 diabetes and hypertension than BMI (data not shown).
Table S4 shows the relations of CUN-BAE and BMI with the different CVD events separately (cerebrovascular stroke, myocardial infarction, angina). The pattern of results was essentially similar as in pooled analysis. The OR for the different CVD outcomes was slightly higher for BMI than for CUN-BAE in the total population, whereas in men and women, increasing CUN-BAE was associated with higher OR for all 3 outcomes. When comparing the associations of CUN-BAE in men vs women (in Model 2), there appeared to be an overall stronger association with risk of stroke in men and angina in women (Table S4). In Model 2, the OR for myocardial infarction per SD increase in CUN-BAE was similar in men (2.31 [1.62, 3.31]) and women (2.28 [1.59, 3.27]).
Discussion
In the current study, the CUN-BAE calculation of BF% was more strongly correlated with BF% than BMI in the total group and in men and women separately. CUN-BAE overestimated BF% in lean subjects and underestimated BF% in subjects with higher BF%. Furthermore, we found that in men and women separately, higher CUN-BAE was associated with greater risk of future CVD events, type 2 diabetes, and hypertension compared with BMI. Thus in absence of actual measures of fat mass, CUN-BAE may be an overall useful tool for calculation of BF% and stratification for CVD and type 2 diabetes risk in Caucasian men and women.
CUN-BAE is essentially a BMI measure that takes into account sex and age-related differences in adiposity. Thus, since BF% differs in men and women at a given BMI,21 BMI performed as well as CUN-BAE in predicting body fat in analyses that were stratified by sex. Fuster-Parra et al10 have similarly noted that in multiple regression models with measured BF% as the dependent variable, BMI was an equally strong predictor of BF% as CUN-BAE alone, once age and sex were adjusted for.
Despite this apparent redundancy of CUN-BAE and other equations of body fat estimation, it remains a useful tool when the actual value of BF% itself is of interest, as in epidemiologic studies with no body composition data available. As a surrogate measure of BF%, CUN-BAE performed well in our population. Among numerous adiposity markers, CUN-BAE was the strongest correlate of BF% (r=0.88) in the total population, and remained a strong correlate in men and women separately. Fuster-Parra et al10 reported a similar correlation (r=0.86) between CUN-BAE and BF% measured by bioelectric impedance in a population of 3200 men and women with a wider and younger age range (18–65 years).
Since CUN-BAE does not rely on other measures of adiposity (e.g., waist), it simply estimates the “expected” BF% for a given age, sex and BMI. Thus, those with higher proportions of body fat will have a CUN-BAE measurement that underestimates their BF%, and vice versa, as observed in the current study. The underestimation was not severe (−5.8% in the highest decile of actual BF%), compared with BAI (−13.8%), which is based only on hip circumference and height.22 We previously proposed that the severe underestimation of BF% by BAI in obese subjects might result from the fact that, as body weight increases, the increase in hip circumference does not adequately reflect the increase in truncal adiposity.7 Although CUN-BAE avoids this pitfall, it markedly overestimated BF% in normal weight individuals with low body fat. Those in the lowest decile of BF% had a CUN-BAE (27.3%) that was 1.44 times their actual BF% by DXA (18.9%). This suggests that CUN-BAE will be of limited value in populations with high prevalence of leanness, for example, cancer, HIV and renal patients. The underestimation of BF% in lean subjects was likely not apparent in the original report of CUN-BAE since the population was predominantly overweight and obese (93% of men and 79% of women).6 We postulate that an equation that takes into account another measure of adiposity, such as waist, may improve the prediction of BF% in very lean and obese individuals.
The association of obesity with prospective risk of disease, including CVD, has been intensively studied. Arguably, the ultimate value of these population studies is to inform risk stratification for individuals in order to determine the hazard of impending CVD. Since male sex is an independent risk factor for CVD,23 and given the sexual dimorphism in BF%,21 studies of obesity in relation to CVD risk often investigate a single sex or each sex separately.24–26 In sex-stratified analysis, CUN-BAE was more related to risk of CVD events compared with BMI in both men and women. After controlling for age and smoking, the risk of CVD was higher for CUN-BAE than BMI in both sexes. A similar advantage of CUN-BAE over BMI was observed for type 2 diabetes, angina, stroke, and hypertension. However, when men and women were pooled in the analysis, the associations of CUN-BAE with all outcomes dropped to below that of BMI. Conflictingly, sex-stratified analysis of 9555 Iranian subjects revealed equally modest associations of BMI and CUN-BAE with odds of having CVD risk factors, including metabolic syndrome, hypercholesterolemia and hypertension.13 The discrepancy with our findings may reflect the different outcomes measured (risk factors vs CVD events). It may also be linked to ethnic differences in body composition,3 and in the contribution of total body adiposity to CVD risk.27,28 Our findings in Caucasians are supported by recent reports of stronger associations of CUN-BAE compared with BMI with odds of type 2 diabetes and hypertension in a cross-sectional investigation of 3888 European whites.29
When men and women were pooled in the analysis, however, the CUN-BAE associations with disease risks were weaker than BMI. In this respect, CUN-BAE appears to mimic BF%. Since BMI is a sex-independent measure of obesity, it correlates more strongly than BF% with cardiometabolic risk markers in analysis pooled by sex. In pooled analysis in the present study, BMI indeed showed stronger cross-sectional correlations with systolic and diastolic blood pressure, as well as plasma glucose, triglycerides, HDL-cholesterol and homocysteine, compared with either BF% or CUN-BAE. Others have similarly reported higher correlation coefficients for BMI (compared with BF%), with blood pressure, glucose, triglycerides and HDL-cholesterol, as well as C-reactive protein, fibrinogen and insulin resistance.30 As expected from the sexual dimorphism of body fatness, values of CUN-BAE and BF% were 38% and 48% higher, respectively, in women than men; yet men had higher frequency of CVD events. It is therefore not surprising that, in men and women combined, CUN-BAE was a relatively poor predictor of CVD.
Strength and limitations
Strengths of the present study include the availability of precise measurements of BF% by DXA in a large population of men and women, allowing evaluation of CUN-BAE within sizable samples of lean, overweight and obese subjects. Another advantage is the prospective design. This enabled evaluation of the relations of CUN-BAE with future CVD and type 2 diabetes risk, thus avoiding reverse causality. A limitation of the study is that DXA measurements were not available at baseline (HHS) in 1992–1993. Such data would have allowed a direct comparison of the relations of measured and estimated BF% with CVD and diabetes risk. Diabetes was self-reported based on a question that did not specify the type of diabetes. Based on the relatively old age of participants, the assumption was made that they developed type 2 diabetes, but the possibility that a minority developed type 1 diabetes cannot be excluded. The study population was Caucasian, within 2 narrow age ranges, which limits generalizability to other age and ethnic groups. However, our data likely reflects CUN-BAE performance in middle-aged and elderly subjects.
Conclusion
In summary, compared with BMI, CUN-BAE showed stronger association with risk of CVD and type 2 diabetes events over a 6-year follow-up in middle-aged and elderly subjects, provided that men and women were evaluated separately. CUN-BAE correlated well with BF% measured by DXA, but overestimated BF% in normal-weight subjects with low body fat, which limits its usefulness in predominantly lean populations, for example, cancer patients. Overall, our findings suggest that CUN-BAE may improve risk stratification for CVD and type 2 diabetes at the individual level and in population studies of separate sex, at least in Caucasians. Given this apparent advantage, replication of this data is warranted in different ethnic groups, as well as evaluation of CUN-BAE against prospective risk of other diseases.
Acknowledgments
This work was supported by the Advanced Research Program of Norway; the Research Council of Norway; the Norwegian Rheumatism Association; the Johan Throne Holst Foundation for Nutrition Research; and the University of Oslo, Norway.
Disclosure
The authors report no conflicts of interest in this work.
References
WHO. Physical status: The use of and interpretation of anthropometry, Report of a WHO Expert Committee. World Health Organ Tech Rep Ser: World Health Organization;1995;854:1–452. | ||
Camhi SM, Bray GA, Bouchard C, et al. The relationship of waist circumference and BMI to visceral, subcutaneous, and total body fat: sex and race differences. Obesity (Silver Spring). 2011;19(2):402–408. | ||
Rush EC, Freitas I, Plank LD. Body size, body composition and fat distribution: comparative analysis of European, Maori, Pacific Island and Asian Indian adults. Br J Nutr. 2009;102(4):632–641. | ||
Witt KA, Bush EA. College athletes with an elevated body mass index often have a high upper arm muscle area, but not elevated triceps and subscapular skinfolds. J Am Diet Assoc. 2005;105(4):599–602. | ||
Bergman RN, Stefanovski D, Buchanan TA, et al. A better index of body adiposity. Obesity (Silver Spring). 2011;19(5):1083–1089. | ||
Gomez-Ambrosi J, Silva C, Catalan V, et al. Clinical usefulness of a new equation for estimating body fat. Diabetes Care. 2012;35(2):383–388. | ||
Vinknes KJ, Elshorbagy AK, Drevon CA, et al. Evaluation of the body adiposity index in a Caucasian population: the Hordaland health study. Am J Epidemiol. 2013;177(6):586–592. | ||
Gomez-Ambrosi J, Silva C, Galofre JC, et al. Body mass index classification misses subjects with increased cardiometabolic risk factors related to elevated adiposity. Int J Obes (Lond). 2012;36(2):286–294. | ||
Lara J, Siervo M, Bertoli S, et al. Accuracy of three novel predictive methods for measurements of fat mass in healthy older subjects. Aging Clin Exp Res. 2014;26(3):319–325. | ||
Fuster-Parra P, Bennasar-Veny M, Tauler P, Yanez A, Lopez-Gonzalez AA, Aguilo A. A comparison between multiple regression models and CUN-BAE equation to predict body fat in adults. PLoS One. 2015;10(3):e0122291. | ||
Obesity and overweight – fact sheet N°311. June; 2016. Available from: http://www.who.int/mediacentre/factsheets/fs311/en/. Accessed April 27, 2016. | ||
Arnold M, Pandeya N, Byrnes G, et al. Global burden of cancer attributable to high body-mass index in 2012: a population-based study. Lancet Oncol. 2015;16(1):36–46. | ||
Haghighatdoost F, Sarrafzadegan N, Mohammadifard N, Asgary S, Boshtam M, Azadbakht L. Assessing body shape index as a risk predictor for cardiovascular diseases and metabolic syndrome among Iranian adults. Nutrition. 2014;30(6):636–644. | ||
Martin V, Davila-Batista V, Castilla J, et al. Comparison of body mass index (BMI) with the CUN-BAE body adiposity estimator in the prediction of hypertension and type 2 diabetes. BMC Public Health. 2016;16(1):82. | ||
Nurk E, Tell GS, Vollset SE, Nygard O, Refsum H, Ueland PM. Plasma total homocysteine and hospitalizations for cardiovascular disease: the Hordaland Homocysteine Study. Arch Intern Med. 2002; 162(12):1374–1381. | ||
Refsum H, Nurk E, Smith AD, et al. The Hordaland Homocysteine Study: a community-based study of homocysteine, its determinants, and associations with disease. J Nutr. 2006;136(6 Suppl):1731S–1740S. | ||
Pietrobelli A, Formica C, Wang Z, Heymsfield SB. Dual-energy X-ray absorptiometry body composition model: review of physical concepts. Am J Physiol. 1996;271(6 Pt 1):E941–E951. | ||
Gjesdal CG, Halse JI, Eide GE, Brun JG, Tell GS. Impact of lean mass and fat mass on bone mineral density: The Hordaland Health Study. Maturitas. 2008;59(2):191–200. | ||
Bland JM, Altman DG. Statistical methods for assessing agreement between two methods of clinical measurement. Lancet. 1986;1(8476):307–310. | ||
Bland JM, Altman DG. Measuring agreement in method comparison studies. Stat Methods Medi Res. 1999;8(2):135–160. | ||
Rothman KJ. BMI-related errors in the measurement of obesity. Int J Obes (Lond). 2008;32(Suppl 3):S56–S59. | ||
Bergman RN, Stefanovski D, Buchanan TA, et al. A better index of body adiposity. Obesity (Silver Spring). 2011;19(5):1083–1089. | ||
Pencina MJ, D’Agostino RB Sr, Larson MG, Massaro JM, Vasan RS. Predicting the 30-year risk of cardiovascular disease: the framingham heart study. Circulation. 2009;119(24):3078–3084. | ||
Wilson PW, Kannel WB. Obesity, diabetes, and risk of cardiovascular disease in the elderly. Am J Geriatr Cardiol. 2002;11(2):119–123,125. | ||
Huxley R, Mendis S, Zheleznyakov E, Reddy S, Chan J. Body mass index, waist circumference and waist:hip ratio as predictors of cardiovascular risk–a review of the literature. Eur J Clin Nutr. 2010;64(1):16–22. | ||
Katsiki N, Ntaios G, Vemmos K. Stroke, obesity and gender: a review of the literature. Maturitas. 2011;69(3):239–243. | ||
Bhopal R, Unwin N, White M, et al. Heterogeneity of coronary heart disease risk factors in Indian, Pakistani, Bangladeshi, and European origin populations: cross sectional study. BMJ. 1999;319(7204):215–220. | ||
Forouhi NG, Sattar N, Tillin T, McKeigue PM, Chaturvedi N. Do known risk factors explain the higher coronary heart disease mortality in South Asian compared with European men? Prospective follow-up of the Southall and Brent studies, UK. Diabetologia. 2006;49(11):2580–2588. | ||
Martin V, Davila-Batista V, Castilla J, et al. Comparison of body mass index (BMI) with the CUN-BAE body adiposity estimator in the prediction of hypertension and type 2 diabetes. BMC Public Health. 2016;16:82. | ||
Dervaux N, Wubuli M, Megnien JL, Chironi G, Simon A. Comparative associations of adiposity measures with cardiometabolic risk burden in asymptomatic subjects. Atherosclerosis. 2008;201(2):413–417. |
Supplementary data
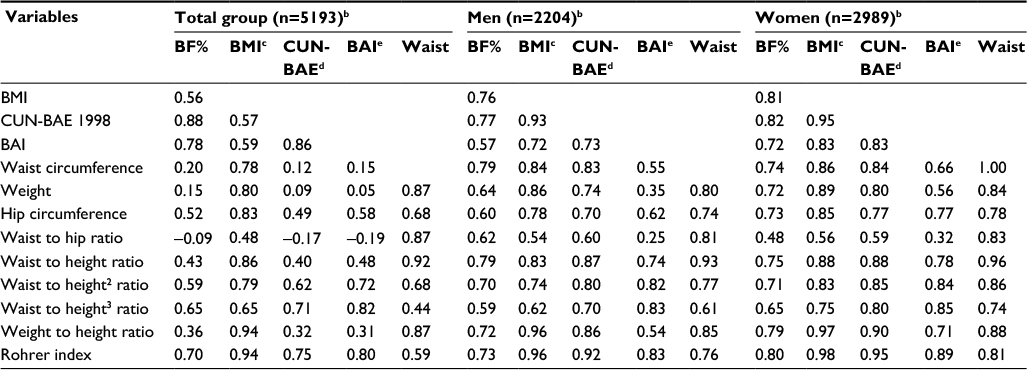 | Table S1 Correlations between BF%, body adiposity indices, and anthropometric variables in the Hordaland Health Study (1997–1999)a Notes: aData are Pearson’s product-moment correlation coefficient (r). P<0.001 for all. bFor some variables less than 0.5% data are missing. cBody mass index: weight (kg)/height (m)2. dCUN-BAE = –44.988+(0.503 × age)+(10.689 × sex)+(3.172 × BMI) – (0.026 × BMI2)+(0.181 × BMI × sex) – (0.02 × BMI × age) – (0.005 × BMI2 × sex)+ (0.00021 × BMI2 × age) where male = 0 and female = 1 for sex, and age in years. eBody adiposity index: hip (cm)/height (m)1.5 – 18. Abbreviations: BAI, body body adiposity index, BMI, body mass index; BF%, body fat percentage; CUN-BAE, Clínica Universidad de Navarra-Body Adiposity Estimator. |
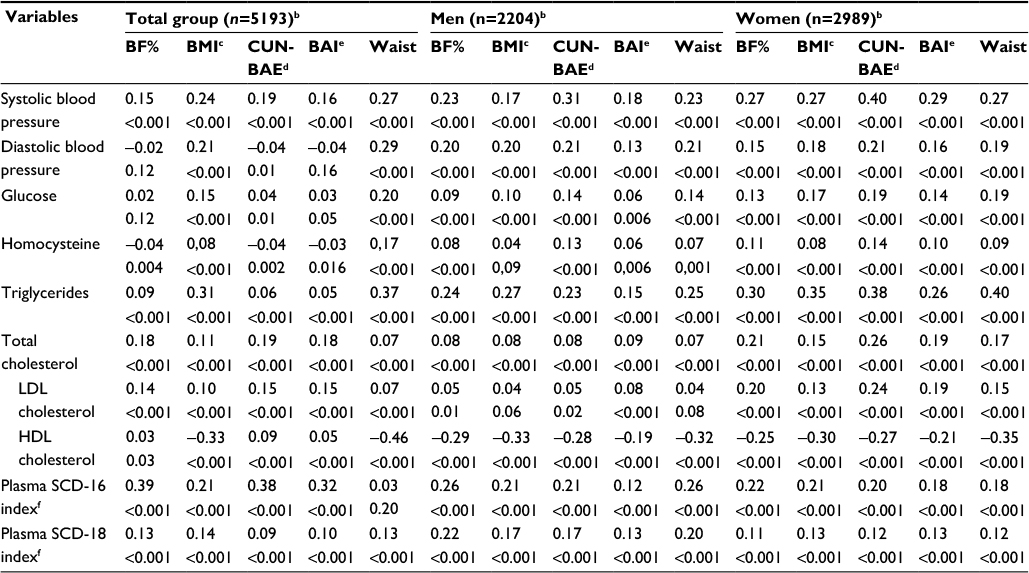 | Table S2 Correlations between BF%, body adiposity indices, anthropometric variables and metabolic risk factors in the Hordaland Health Study (1997–1999)a Notes: aData are Pearson correlation coefficients and associated P-values (lower). bFor some variables less than 0.5% data are missing. cBody mass index: weight (kg)/height (m)2. dCUN-BAE = –44.988+(0.503 × age)+(10.689 × sex)+(3.172 × BMI) – (0.026 × BMI2)+(0.181 × BMI × sex) – (0.02 × BMI × age) – (0.005 × BMI2 × sex)+(0.00021 × BMI2 × age) where male = 0 and female = 1 for sex, and age in years. eBody adiposity index: hip (cm)/height (m)1.5 – 18. fn = 1986 in total group, n = 913 men and 1073 women. Abbreviations: BAI, body body adiposity index, BMI, body mass index; BF%, body fat percentage; CUN-BAE, Clínica Universidad de Navarra-Body Adiposity Estimator; HDL, high-density lipoprotein; LDL, low-density lipoprotein; SCD, stearoyl-coenzyme A desaturase. |
 | Table S3 Classification of subjects in the Hordaland Health Study (1997–1999) according to deciles of estimated BF% from DXA measurements and the difference between BF% from DXA measurements and CUN-BAEa Notes: aData are mean (standard deviation) unless otherwise indicated. bThe deciles were estimated separately for men and women in the middle-aged and elderly groups and the results are presented combined for both sexes and age-groups. cCUN-BAE = −44.988+(0.503 × age)+(10.689 X sex)+(3.172 × BMI) − (0.026 × BMI2)+(0.181 × BMI X sex) − (0.02 × BMI × age) − (0.005 × BMI2 × sex)+(0.00,021 × BMI2 × age) where male = 0 and female = 1 for sex, and age in years. dBody mass index: weight (kg)/height (m)2. eBody adiposity index: hip (cm)/height (m)1.5–18. Abbreviations: BAI, body adiposity index, BMI, body mass index; BF%, body fat percentage; CUN-BAE, Clínica Universidad de Navarra-Body Adiposity Estimator; DXA, dual-energy X-ray absorptiometry. |
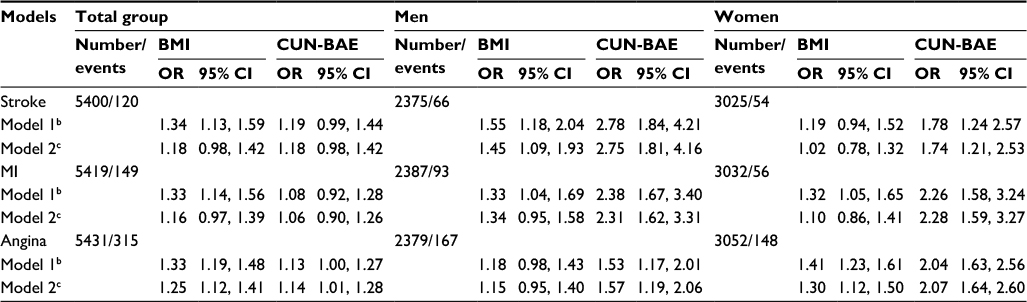 | Table S4 OR and 95% CI for CVD risk for one SD increase in baseline BMI and CUN-BAE in the Hordaland Health Study (1992–1993 and 1997–1999)a Notes: aCVD includes stroke, myocardial infarction, and angina from 1992 through 1999. bModel 1: Unadjusted analyses. cModel 2: Adjusted for smoking status, in addition age (and sex in analyses with the total group) for BMI. Abbreviations: BMI, body mass index; CI, confidence interval; CUN-BAE; Clínica Universidad de Navarra-Body Adiposity Estimator; CVD, cardiovascular disease risk; MI, myocardial infarction; OR, odds ratio. |
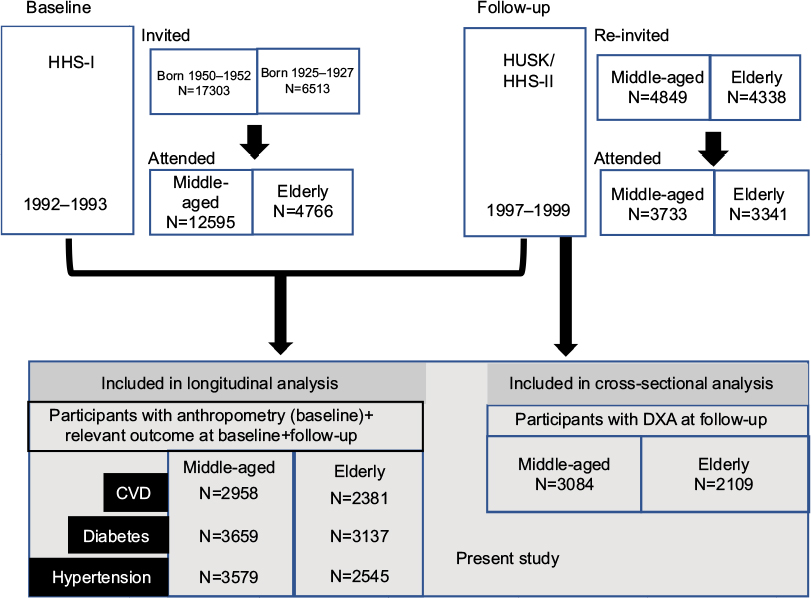 | Figure S1 Recruitment in the Hordaland Homocysteine Study and Hordaland Health Study. Notes: The figure shows the numbers of individuals at each stage of the study, and number of individuals used in the analyses in the present study. Abbreviations: CVD, cardiovascular disease; DXA, dual-energy X-ray absorptiometry; HHS, Hordaland Homocysteine Study; HUSK, Hordaland Health Study. |
 © 2017 The Author(s). This work is published and licensed by Dove Medical Press Limited. The
full terms of this license are available at https://www.dovepress.com/terms.php
and incorporate the Creative Commons Attribution
- Non Commercial (unported, v3.0) License.
By accessing the work you hereby accept the Terms. Non-commercial uses of the work are permitted
without any further permission from Dove Medical Press Limited, provided the work is properly
attributed. For permission for commercial use of this work, please see paragraphs 4.2 and 5 of our Terms.
© 2017 The Author(s). This work is published and licensed by Dove Medical Press Limited. The
full terms of this license are available at https://www.dovepress.com/terms.php
and incorporate the Creative Commons Attribution
- Non Commercial (unported, v3.0) License.
By accessing the work you hereby accept the Terms. Non-commercial uses of the work are permitted
without any further permission from Dove Medical Press Limited, provided the work is properly
attributed. For permission for commercial use of this work, please see paragraphs 4.2 and 5 of our Terms.