")
Back to Journals » Diabetes, Metabolic Syndrome and Obesity » Volume 16
The Ratio of Serum Uric Acid to Glycosylated Haemoglobin as a Predictor of All-Mortality in Elderly Patients with Diabetic Foot Ulcers: A Longitudinal Cohort Study
Authors Huang X, Deng L, Huang J, Sun J, Wang Q, Mo J , Zhai Z, Nong Y, Lu W
Received 28 May 2023
Accepted for publication 7 September 2023
Published 12 September 2023 Volume 2023:16 Pages 2779—2790
DOI https://doi.org/10.2147/DMSO.S423017
Checked for plagiarism Yes
Review by Single anonymous peer review
Peer reviewer comments 2
Editor who approved publication: Professor Gian Paolo Fadini
Xiuxian Huang,1,* Licai Deng,1,* Jianhao Huang,1,* Jingxia Sun,1 Qiu Wang,1 Jiacheng Mo,2 Zhenwei Zhai,1 Yuechou Nong,1 Wensheng Lu1,*
1Department of Endocrinology and Metabolism, Guangxi Academy of Medical Sciences and the People’s Hospital of Guangxi Zhuang Autonomous Region, Nanning, Guangxi, 530021, People’s Republic of China; 2Information Network Center of Guangxi Academy of Medical Sciences and the People’s Hospital of Guangxi Zhuang Autonomous Region, Nanning, Guangxi, 530021, People’s Republic of China
*These authors contributed equally to this work
Correspondence: Wensheng Lu, Email [email protected]
Aim: To clarify the relationship between serum uric acid (UA) and glycosylated hemoglobin (UA/HbA1c) ratio and all-cause mortality in patients with diabetic foot ulcers (DFUs).
Methods: A total of 172 inpatients with DFUs (PEDIS grades 2– 4) were eligible for inclusion in this study from 2018 to 2023. This was a retrospective, longitudinal cohort study. All subjects were followed up every 6 months for a median of 60 months. According to the cutoff value of the UA/HbA1c ratio of 39.07 obtained from ROC analysis, the participants were divided into two groups: low-level (≤ 39.07, n = 107) and high-level (> 39.07, n = 65) groups. The correlation between UA/HbA1c ratio and all-cause mortality was also evaluated by Cox regression analysis TheKaplan-Meier survival curve analysis and Log rank tests were used to assess the incidence rates of all-cause mortality. The contribution rate of risk factors was estimated by the population-attributable risk percentage (PAR%) analysis.
Results: ROC analysis showed that the optimal cutoff values for UA and the UA/HbA1c ratio were 372 μmol/L and 39.07, respectively. Multivariate Cox regression analysis indicated that a high UA/HbA1c ratio (HR =4.63; 95% CI = 2.004– 10.7, P < 0.001) was independently associated with a high risk of all-cause mortality in patients with DFUs. Stratified analysis indicated that subjects aged ≥ 60 years had a greater risk of all-cause mortality associated with a high UA/HbA1c ratio (HR = 4.450; 95% CI = 1.711– 11.574, P = 0.002). Kaplan-Meier survival analysis showed that all-cause mortality had a significant positive association with a high UA/HbA1c ratio (log-rank, P < 0.001) and a significant negative correlation with the lowered HbA1c level (< 6.5%) after a follow-up of 32 months (log-rank, P < 0.001). The population attributable risk percentage (PAR%) analysis suggested that the contribution rate of the high-level UA/HbA1c ratio to all-cause mortality was 33.7%, which was much greater than the 19.69% of UA.
Conclusion: In brief, our study showed that for every 1.0% increase in the UA/HbA1c ratio, the all-cause mortality rate in elderly patients with DFUs aged ≥ 60 years increased by 3.45-fold. For elderly patients with DFUs, a safe and effective strategy to reduce all-cause mortality is to strictly control serum UA levels to < 372 μmol/L and appropriately loosen the control goal of HbA1c to ≥ 6.5%.
Keywords: diabetic foot ulcer, uric acid to glycosylated hemoglobin ratio, all-cause mortality
Introduction
Diabetic foot ulcer (DFU) is a serious complication of diabetes with a poor prognosis and high medical costs. According to the International Working Group on the Diabetic Foot (IWGDF), DFUs refer to a foot ulcer, infection, or profound tissue destruction related to lower limb peripheral neuropathy and peripheral vascular disease. The pathogenesis of DFUs involves macrovascular and microvascular disease, peripheral neuropathy, and infection Caused by glycotoxicity and lipotoxicity. Diabetic wounds, which are chronic wounds, are difficult to heal owing to multiple risk factors such as ischemia, infection, and foreign bodies. Current clinical therapies for DFUs involve multifaceted interventions, including wound treatment such as negative pressure wound therapy (NPWT), platelet-rich plasma gel (PRP), biological agents, skin grafts and stem cell therapy, restoration of blood supply, neurotrophic treatment, systemic support therapy and rational use of antibiotics. Factors related to the mortality of DFU include major adverse cardio-cerebral events (MACCEs) caused by sepsis, pulmonary embolism, surgical amputation. DFU is estimated to occur in approximately 15% of patients with diabetes in China,1 of which 40% recur within 1 year, 60% within 3 years, and 65% within 5 years.2 The 5-year mortality rate associated with DFU is comparable to that associated with cancer.3 Compared with diabetic patients without DFUs, individuals with DFUs have a 2.5-fold increased risk of death.4 Therefore, it is important to identify and evaluate risk factors associated with all-cause mortality in patients with DFUs.
Serum UA is the final product of purine metabolism. UA levels are associated with cardiovascular disease,5–7 diabetes,8–10 and hypertension.11 In addition, hyperuricemia has been proven to be positively related to the severity of diabetic complications such as diabetic retinopathy, nephropathy, peripheral neuropathy, and peripheral vascular disease.12–17 However, whether hyperuricemia is associated with prognostic outcomes in elderly patients with DFUs remains unclear. HbA1c reflects the blood glucose level over the past 3 months. According to guidelines formulated by the American Diabetes Association, the treatment goal for type 2 diabetes is to control HbA1c to ≤ 7% or ≤ 6.5%.18 HbA1c is closely associated with mortality, whether diabetes mellitus or non-diabetes, in acute or ordinary situations.19–22 Additionally, one study showed that HbA1c is an ideal predictive biochemical marker for foot ulcer healing.23 However, for the main clinical outcomes in elderly patients with DFUs, it remains unclear whether the lower control goal of HbA1c improves the outcome.
To date, few studies have explored the risk factors of prognostic outcomes in elderly patients with DFUs. Therefore, this retrospective longitudinal cohort study aimed to clarify the relationship between the UA/HbA1c ratio and all-cause mortality in DFU patients for the first time.
Methods
Study Design and Subjects Enrollment
This was a retrospective longitudinal cohort study (approval number: KY-sy-2019-01). The process of screening patients from the database is shown in Figure 1. The inclusion criteria were as follows: (1) diabetes diagnosed according to the World Health Organization (WHO) 1999 standard24 and (2) diagnosis and grade of DFUs according to the International Working Group on the Diabetic Foot (IWGDF) guidelines.25 The exclusion criteria were as follows: (1) nondiabetic foot ulcers (n = 42), (2) type 1 diabetes mellitus (n = 79), (3) age < 18 years (n = 12), presence of tumors (n = 18), receiving hemodialysis treatment (n = 26), and using glucocorticoids or immunosuppressants (n = 13), and (4) incomplete medical records (n = 81), lost to follow-up (n = 52), and follow-up time < 1 year (n = 84). Finally, 172 patients with DFUs (PEDIS grade 2 4) were eligible for inclusion as the research subjects. Based on the cut-off value of the UA/HbA1c ratio of 39.07, obtained from ROC analysis, the enrolled patients were divided into two groups: low-level (≤ 39.07, n = 107) and high-level (> 39.07, n = 65). The association between the UA/HbA1c ratio and all-cause mortality was evaluated. Given the retrospective nature of the study, written informed consent was not required. This study was conducted in accordance with the guidelines outlined in the Declaration of Helsinki and was approved by the Ethics Committee of the People’s Hospital of Guangxi Zhuang Autonomous Region.
 |
Figure 1 Flowchart for selecting the study participants from the Foot Health Management Anonymous Database. |
Baseline Characteristics Data Collection
Demographic data, anthropometric data, laboratory biochemical index data, hospitalization medical records, and visit data were anonymously collected from the Foot Health Management Database of the Diabetic Foot Center of the People’s Hospital of the Guangxi Zhuang Autonomous Region.
Related Definitions
Several related definitions in this study are as follows: (1) According to the World Health Organization (WHO) definition,24 people aged ≥ 60 years in the Asia-Pacific region are defined as elderly people.26 (2) The serum UA was tested by Roche COBAS Integra 800. According to the ROC analysis, the optimal cut-off values of UA, a serum UA concentration > 372 μmol/L was defined as high-level UA and a serum UA concentration ≤ 372 μmol/L was defined as low-level UA. (3) HbA1c was tested by Roche cobas c 513. HbA1c ≥ 6.5% was defined as a high HbA1c level and HbA1c < 6.5% was defined as a low HbA1c level.24 (4) According to the ROC analysis, the optimal cut-off values of UA/HbA1c ratio, a UA/HbA1c ratio > 39.07 was, defined as a high UA/HbA1c ratio, and a UA/HbA1c ratio ≤ 39.07 was, defined as a low UA/HbA1c ratio. (5) The main endpoint was all-cause mortality acquired through outpatient services, WeChat app software, and telephone visits. (6) Population attributable risk percentage (PAR%) was calculated using the following formula: PAR% = Pe (RR ‒ 1)/[Pe (RR ‒ 1) + 1], where Pe represents the percentage of the population with a given UA or UA/HbA1c level.
Statistical Analysis
Normally distributed variables are displayed as means (±SD) and non-normally distributed variables as medians (interquartile ranges). Discontinuous variables are expressed as frequencies. Student’s t-test was used for normally distributed continuous variables, and the non-parametric Mann–Whitney U-test was used for non-normally distributed continuous variables. The chi-square test was used for intergroup comparisons of categorical variables. Risk factors for all-cause mortality were assessed using Cox regression analysis. Stratified analyses were then performed for each subgroup. Kaplan-Meier analysis and Log rank tests were used to assess the incidence rates of all-cause mortality. Sample size and power analysis were calculated using PASS 11.0 software (https://www.ncss.com/download/pass/updates/pass11/), and when there were more than 60 cases in each group, it had a high testing power of over 90%. Data analyses were performed using GraphPad Prism 9.3 (GraphPad Software, San Diego, CA, and the SPSS 26.0 statistical software Package for the Social Sciences (IBM Corp., Armonk, NY, USA). Statistical significance was set at P < 0.05.
Results
Baseline Characteristics
The baseline data of the participants are presented in Table 1. Of the 172 subjects, 107 (62.2%) had a low UA/HbA1c ratio (≤ 39.07) and 65 (37.8%) had a high UA/HbA1c ratio (> 39.07). The baseline characteristics showed that, between the two groups, there were no significantly statistical differences in age, gender, smoking, hypertension history, SBP, DBP, diabetic foot history, duration of diabetic foot, severity of diabetic foot ulcer, PAD, DPN, WBC, Hb, TC, TG, HDL-C, LDL-C (all P values > 0.05). However, there were significant differences in CHD, CVD, ALB, Cr, UA, FBG, and HbA1c levels (all P < 0.05). The above results indicated that there was a significant difference in the variables UA and HbA1c between the two groups, implying that further exploration of the interaction between variables UA and HbA1c was of great value.
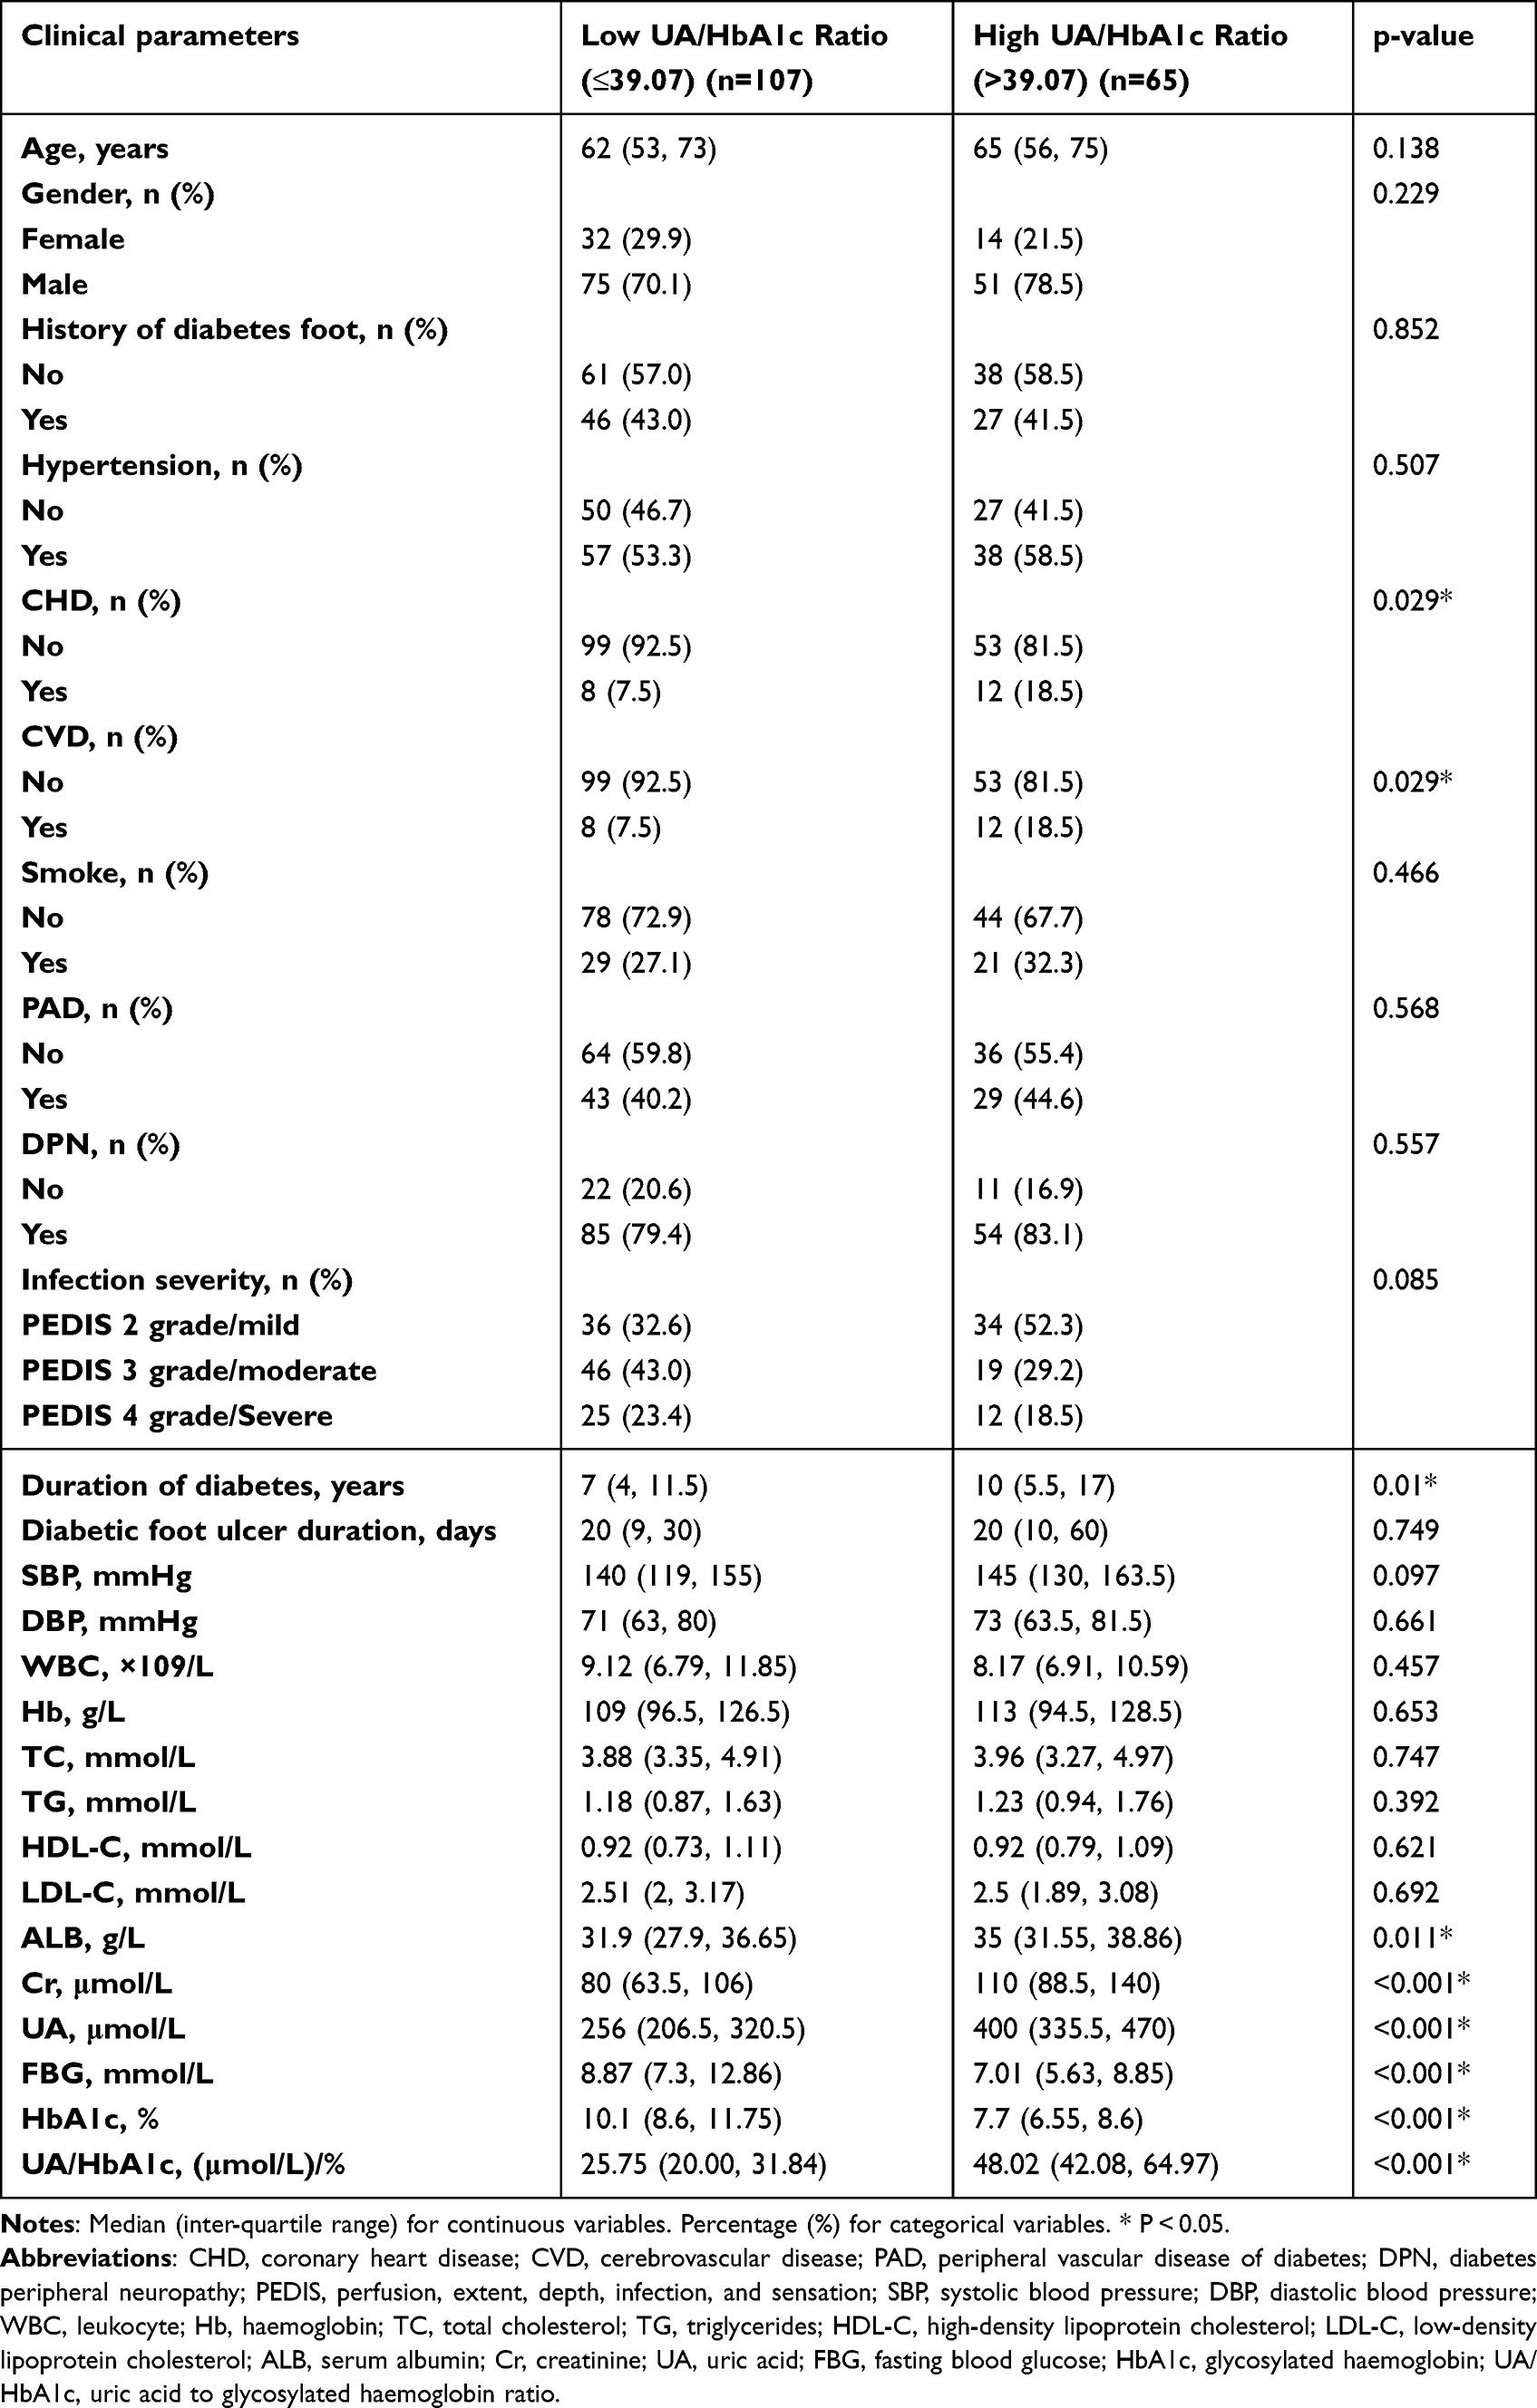 |
Table 1 Baseline Clinical Characteristics of Subjects |
ROC Analysis
The results of the ROC analysis are shown in Figure 2. The optimal cut-off values of UA and UA/HbA1c ratio were 372 μmol/L and 39.07 (μmol/L)/%, respectively. The area under the curve (AUC) of UA was 0.681, with a sensitivity of 55.9% and a specificity of 76.8% (95% CI =0.574–0.788, P = 0.001). The AUC of the UA/HbA1c ratio was 0.742, with a sensitivity of 70.6% and a specificity of 70.3% (95% CI = 0.652–0.832, P < 0.001). The paired comparison of ROC curves showed that the diagnostic efficacy of the UA/HbA1c ratio was greater than UA (P = 0.013). The above results showed that compared to UA, the UA/HbA1c ratio, an indicator reflecting the interaction between UA and HbA1c, was a more valuable diagnostic indicator for all-cause mortality in DFUs.
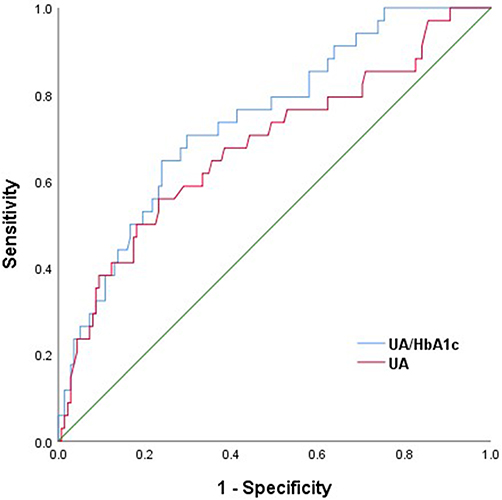 |
Figure 2 ROC analysis for the optimal cutoff value predicting the effect of UA or UA/HbA1c ratio on all-cause mortality. Abbreviations: ROC, receiver operating characteristic curve; UA, uric acid; HbA1c, glycosylated hemoglobin; AUC, area under the curve. Notes: The cutoff values for UA and UA/HbA1c were 372 μmol/L and 39.07 (μmol/L)/%, respectively. The AUC of UA was 0.681 (95% CI = 0.574–0.788, P = 0.001). The sensitivity and specificity of the UA cutoff values were 55.9% and 76.8%, respectively. The AUC of UA/HbA1c ratio was 0.742 (95% CI = 0.652–0.832, P < 0.001). The sensitivity and specificity of the UA/HbA1c cut-off values were 70.6% and 70.3%, respectively. Paired comparisons of ROC curves showed that the diagnostic efficacy of the UA/HbA1c ratio was greater than UA (P = 0.013). |
Cox Regression Analysis
The risk factors for all-cause mortality were evaluated using univariate and multivariate Cox regression analyses (Table 2). We constructed three Cox regression models: model I, unadjusted; model II, adjusted for age and sex; and model III, model II with additional adjustments for CHD, CVD, diabetes duration, ALB, and Cr. In model III, the high-level UA/HbA1c ratio (HR = 4.63, 95% CI = 2.004–10.7, P < 0.001) and high-level UA (HR = 3.229, 95% CI = 1.562–6.678, P = 0.002) were identified as independent risk factors for all-cause mortality in DFU patients (all P values < 0.05); however, after adjusting for confounding factors, the high-level HbA1c was not independent associated with all-cause mortality (HR = 0.968, 95% CI = 0.380–2.464, P = 0.946).
 |
Table 2 Cox Regression Analysis Evaluating Risk Factors for All-Cause Mortality in Patients with DFUs |
Stratification Analysis in Subgroups
The results of the stratification analyses by age and severity of ulcers (moderate or above infection) are shown in the Forest plots (Figure 3). In the ulcer severity subgroup, a high UA/HbA1c ratio was associated with a high all-cause mortality rate (HR = 3.302, 95% CI = 1.153–9.456, P = 0.026), while high-level UA was not (HR = 2.409, 95% CI = 0.84–6.914, P = 0.102). In the elderly subgroup aged ≥ 60 years, a high UA/HbA1c ratio (HR = 4.45; 95% CI = 1.711–11.574, P = 0.002) and high-level UA (HR = 3.392, 95% CI = 1.349–8.53, P = 0.009) were associated with high all-cause mortality rates, whereas there was no correlation in the younger subgroup aged < 60 years. In addition, an elevated UA/HbA1c ratio increased the risk of all-cause mortality by 3.45 times in elderly patients aged ≥ 60 years with DFUs.
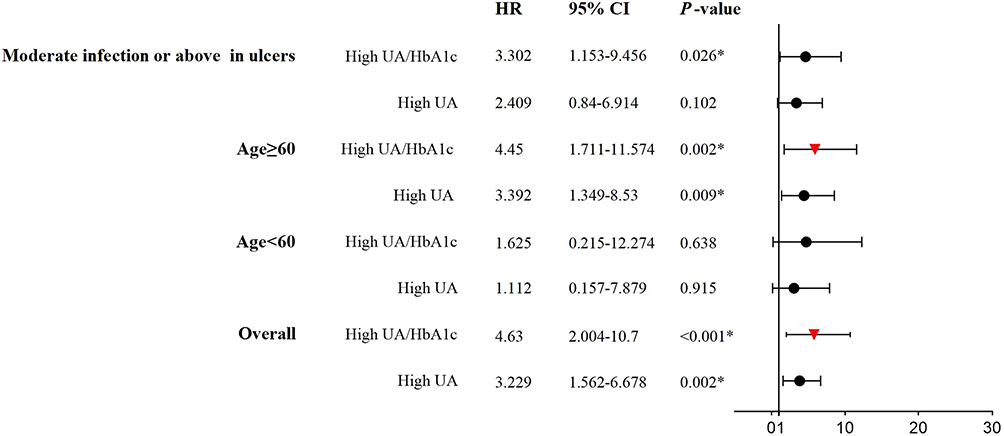 |
Figure 3 Forest plots showing the results of stratification analyses in subgroups. Abbreviations: HR, hazard ratio; CI, confidence interval. Notes: Each stratification was adjusted for all factors, including all independent variables in the regression analysis, except for the stratification factor. |
Kaplan-Meier Survival Curve Analysis
Of 172 patients, 34 (19.8%) died during the follow-up period. We analyzed the effect of different levels of HbA1c, UA, and the UA/HbA1c ratio on the risk of all-cause mortality in patients with DFUs using Kaplan-Meier survival curves and Log rank tests. The results showed that, compared with high-level HbA1c, low-level HbA1c was negatively associated with a high risk of all-cause mortality after a follow-up period of 32 months (log rank, P < 0.001), while HbA1c was not a risk factor for all-cause mortality within a follow-up time of 32 months (log rank, P > 0.05) (Figure 4). Meanwhile, compared to low-level UA and low-level UA/HbA1c ratio, high-level UA and high-level UA/HbA1c ratio were positively associated with a high risk of all-cause mortality (log rank, all P < 0.001) (Figures 5 and 6).
 |
Figure 4 The cumulative incidence of all-cause mortality by HbA1c level. Abbreviation: HbA1c, glycosylated hemoglobin. Notes: Kaplan-Meier analysis showed a significant negative association between low HbA1c levels and the incidence rates of all-cause mortality after a follow-up of 32 months (log rank, P < 0.001); however, HbA1c was not a risk factor for all-cause mortality within a follow-up time of 32 months (log rank, P > 0.05). High-level HbA1c was defined as HbA1c level ≥ 6.5%, and low-level HbA1c was defined as HbA1c level < 6.5%. |
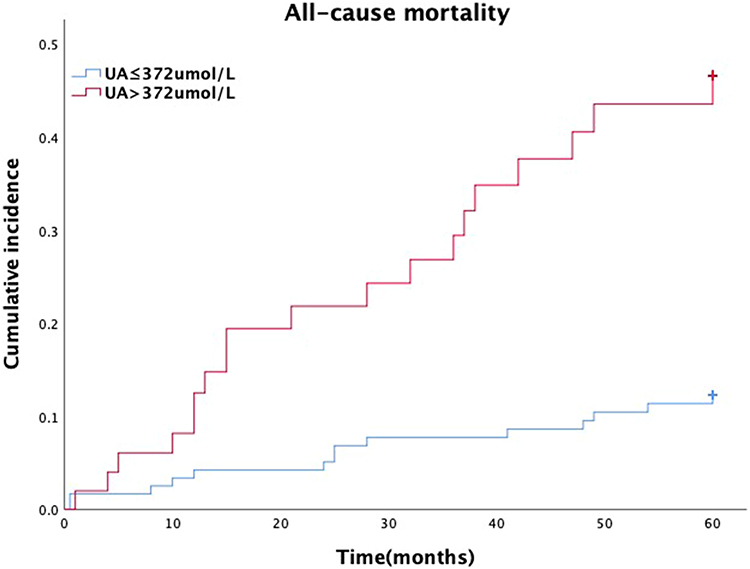 |
Figure 5 The cumulative incidence of all-cause mortality by UA level. Abbreviation: UA, uric acid. Notes: Kaplan-Meier analysis showed a significant positive association between high-level UA and the incidence rates of all-cause mortality (log-rank, P < 0.001). High-level UA referred to a serum UA concentration > 372 μmol/L, and low-level UA referred to a serum UA concentration ≤ 372 μmol/L. |
 |
Figure 6 The cumulative incidence of all-cause mortality by UA/HbA1c ratio level. Abbreviations: UA, uric acid; HbA1c, glycosylated hemoglobin. Notes: Kaplan-Meier analysis showed a significant positive association between a high UA/HbA1c ratio and the incidence rates of all-cause mortality (log-rank, P < 0.001). High-level UA/HbA1c ratio was defined as UA/HbA1c ratio > 39.07 (μmol/L)/%, and low-level UA/HbA1c ratio was defined as UA/HbA1c ratio ≤ 39.07 (μmol/L)/%. |
Population Attributable Risk Percentage (PAR%) Analysis
Population attributable risk percentage (PAR%) analysis indicated that, compared to the low-level UA/HbA1c ratio and the low-level UA, for the PAR of all-cause mortality, the high-level UA/HbA1c ratio and the high-level UA were 33.7% and 19.69%, respectively (Table 3). The contribution of the high-level UA/HbA1c ratio to all-cause mortality was greater than that of high-level UA.
 |
Table 3 Population Attributable Risk Proportion of All-Cause Mortality Associated with High UA and High UA/HbA1c Ratio |
Discussion
Diabetic foot ulcers are characterized by high morbidity, disability, and mortality and can lead to life-threatening conditions. To date, few studies have explored the risk factors of prognostic outcomes in elderly patients with DFUs. Therefore, based on this longitudinal cohort study, we focused on the relationship between metabolic indicators (serum UA, HbA1c, and the UA/HbA1c ratio) and all-cause mortality.
We found that, even after adjusting for confounding factors, in Cox regression model-III, the high-level UA/HbA1c ratio (HR = 4.63, 95% CI = 2.004–10.7, P < 0.001) and the high-level UA (HR = 3.229, 95% CI = 1.562–6.678, P = 0.002) were closely associated with high risk for all-cause mortality. In particular, subgroup stratification analysis showed that an elevated UA/HbA1c ratio increased the risk of all-cause mortality by 3.45 times in elderly patients aged ≥ 60 years with DFUs. Meanwhile, the contribution rate of the high-level UA/HbA1c ratio to all-cause mortality (33.7%) was greater than that of the high-level UA ratio (19.69%). Therefore, the UA/HbA1c ratio is a more valuable predictive indicator of all-cause mortality in elderly patients with DFUs than is UA. On the contrary, there is no doubt about the importance of UA. Many studies have shown that UA is closely related to the occurrence of diabetes27–31 and progression of macrovascular and microvascular complications.32–35 A growing body of evidence has confirmed that the main pathological mechanism of UA is the induction of endothelial dysfunction through the activation of oxidative stress and inflammatory responses, ultimately increasing cardiovascular mortality.36–38 This is consistent with the Kaplan-Meier survival curve analysis, which showed that UA increased the risk of all-cause mortality in patients with DFUs in our study. It is well known that the pathological mechanisms of DFU involve macrovascular, microvascular, and wound infection pathology.39,40 Therefore, the relationship between UA and the prognosis of diabetic foot is reasonable both biologically and clinically. We believe that the main reason for the greater weight of the UA/HbA1c ratio for all-cause mortality compared to UA is due to HbA1c. In this study, Kaplan-Meier survival curve analysis showed a significant negative correlation between low HbA1c levels and a high risk of all-cause mortality after a follow-up period of more than 32 months (log-rank, P < 0.001), while HbA1c was not a risk factor for all-cause mortality within a follow-up time of 32 months (log-rank, P > 0.05). Probably, hypoglycemic events play a crucial role in the high risk of all-cause mortality in elderly patients aged ≥ 60 years with DFUs in a low-level HbA1c situation. According to numerous previous research findings, hypoglycemic events can trigger major adverse cardio-cerebral events (MACCEs). Our study indicated also that the control goal of HbA1c < 6.5% recommended by the guidelines41 might not be applicable to the elderly, especially those aged ≥ 60 years with DFUs. Therefore, the results of this study remind clinicians two essential points as follows: (1) given that hypoglycemic events can trigger MACCEs, try to avoid hypoglycemic events in the whole treatment process, particularly for the elderly with diabetes mellitus; (2) to pay more attention to the risk factors for all-cause mortality such as UA, HbA1c, and UA/HbA1c ratio, identify high-risk patients as soon as possible, and take effective prevention strategies timely to prevent DFU patients from adverse clinical outcomes and reduce all-cause mortality in routine clinical practices.
This study had several limitations. First, owing to the retrospective nature of the cohort study, the number of male and female subjects did not match, although there was no significant statistical difference between the two groups, which may have affected the results. However, the sample size of this study was relatively small. Second, we excluded patients with follow-up < 1 year or those lost to follow-up, so the true outcomes of these patients are not yet clear, and the true mortality may be underestimated. Third, further clinical trials are needed to determine whether lowering serum uric acid and loosening the blood glucose goal can improve the clinical prognosis in elderly patients with DFUs.
In conclusion, our study showed that, for every 1.0% increase in the UA/HbA1c ratio, the all-cause mortality rate in elderly patients with DFUs aged ≥ 60 years increased 3.45-fold. For elderly patients with DFUs, a safe and effective strategy to reduce all-cause mortality is to strictly control serum UA levels to < 372 μmol/L and appropriately loosen the control goal of HbA1c to ≥ 6.5%. Additionally, the conclusion of this study still needs to be further confirmed by large-size, randomized, double-blind, multicenter, prospective longitudinal cohort studies.
Data Sharing Statement
The People’s Hospital of Guangxi Zhuang Autonomous Region hereby solemnly makes the declaration that encrypts medical record data using data anonymity technology to safeguard patient privacy and advance clinical research while ensuring the reliability and accuracy of medical data. As a result, every medical record information collected from the Information Network Centre of the People’s Hospital of Guangxi Zhuang Autonomous Region’s information system is authentic and anonymous.
Ethics Approval and Consent to Participate
Due to the retrospective nature of this study, written informed consent was not required. This study was conducted in accordance with the guidelines outlined in the Declaration of Helsinki and was approved by the Ethics Committee of the People’s Hospital of Guangxi Zhuang Autonomous Region.
Acknowledgments
We thank the Podiatry Studio of the Department of Endocrinology and Metabolism, Foot Health Management Center, Information Network Center, and Medical Record Information Quality Control Department, People’s Hospital of the Guangxi Zhuang Autonomous Region.
Funding
This research was funded by the National Natural Science Foundation of China (82160052, 81560044, 30860113).
Disclosure
The authors declare that they have no known competing financial interests or personal relationships that could influence the work reported in this study.
References
1. Doğruel H, Aydemir M, Balci MK. Management of diabetic foot ulcers and the challenging points: an endocrine view. World J Diabetes. 2022;13:27–36. doi:10.4239/wjd.v13.i1.27
2. Armstrong DG, Boulton AJM, Bus SA. Diabetic foot ulcers and their recurrence. N Engl J Med. 2017;376(24):2367–2375. doi:10.1056/NEJMra1615439
3. Armstrong DG, Swerdlow MA, Armstrong AA, Conte MS, Padula WV, Bus SA. Five year mortality and direct costs of care for people with diabetic foot complications are comparable to cancer. J Foot Ankle Res. 2020;13(1):16. doi:10.1186/s13047-020-00383-2
4. Walsh JW, Hoffstad OJ, Sullivan MO, Margolis DJ. Association of diabetic foot ulcer and death in a population-based cohort from the United Kingdom. Diabet Med. 2016;33(11):1493–1498. doi:10.1111/dme.13054
5. Fenech G, Rajzbaum G, Mazighi M, Blacher J. Serum uric acid and cardiovascular risk: state of the art and perspectives. Joint Bone Spine. 2014;81(5):392–397. doi:10.1016/j.jbspin.2014.01.008
6. Sharaf El Din UAA, Salem MM, Abdulazim DO. Uric acid in the pathogenesis of metabolic, renal, and cardiovascular diseases: a review. J Adv Res. 2017;8(5):537–548. doi:10.1016/j.jare.2016.11.004
7. Verma S, Ji Q, Bhatt DL, et al. Association between uric acid levels and cardio-renal outcomes and death in patients with type 2 diabetes: a subanalysis of EMPA-REG OUTCOME. Diabetes Obes Metab. 2020;22(7):1207–1214. doi:10.1111/dom.13991
8. Ioachimescu AG, Brennan DM, Hoar BM, et al. Serum uric acid, mortality and glucose control in patients with Type 2 diabetes mellitus: a PreCIS database study. Diabet Med. 2007;24(12):1369–1374. doi:10.1111/j.1464-5491.2007.02302.x
9. Katsiki N, Papanas N, Fonseca VA, et al. Uric acid and diabetes: is there a link? Curr Pharm Des. 2013;19(27):4930–4937. doi:10.2174/1381612811319270016
10. Katsiki N, Dimitriadis GD, Mikhailidis DP. Serum uric acid and diabetes: from pathophysiology to cardiovascular disease. Curr Pharm Des. 2021;27(16):1941–1951. doi:10.2174/1381612827666210104124320
11. Lee SW, Kim HC, Nam C, et al. Age-differential association between serum uric acid and incident hypertension. Hypertens Res. 2019;42(3):428–437. doi:10.1038/s41440-018-0168-4
12. Chen D, Sun X, Zhao X, Liu Y. Associations of serum uric acid and urinary albumin with the severity of diabetic retinopathy in individuals with type 2 diabetes. BMC Ophthalmol. 2020;20(1):467. doi:10.1186/s12886-020-01713-5
13. Mauer M, Doria A. Uric acid and diabetic nephropathy risk. Contrib Nephrol. 2018;192:103–109.
14. Zhang W, Chen L, Lou M. Association of elevated serum uric acid with nerve conduction function and peripheral neuropathy stratified by gender and age in type 2 diabetes patients. Brain Sci. 2022;12(12):1704. doi:10.3390/brainsci12121704
15. Kaewput W, Thongprayoon C, Rangsin R, et al. The association between serum uric acid and peripheral neuropathy in patients with type 2 diabetes mellitus: a multicenter nationwide crosssectional study. Korean J Fam Med. 2020;41(3):189–194. doi:10.4082/kjfm.18.0205
16. Tseng CH. Independent association of uric acid levels with peripheral arterial disease in Taiwanese patients with Type 2 diabetes. Diabet Med. 2004;21(7):724–729. doi:10.1111/j.1464-5491.2004.01239.x
17. Ye X, Cao Y, Gao F, et al. Elevated serum uric acid levels are independent risk factors for diabetic foot ulcer in female Chinese patients with type 2 diabetes. J Diabetes. 2014;6(1):42–47. doi:10.1111/1753-0407.12079
18. American Diabetes Association. Standards of medical care in diabetes-2017 abridged for primary care providers. Clin Diabetes. 2017;35(1):5–26. doi:10.2337/cd16-0067
19. Liberty IF, Abu Freha N, Baumfeld Y, et al. Prognostic value of glycated hemoglobin for one year mortality following hospitalization in the internal medicine ward. Isr Med Assoc J. 2015;17(5):277–281.
20. Wu S, Wang C, Jia Q, et al. HbA1c is associated with increased all-cause mortality in the first year after acute ischemic stroke. Neurol Res. 2014;36(5):444–452. doi:10.1179/1743132814Y.0000000355
21. Pan W, Lu H, Lian B, et al. Prognostic value of HbA1c for in-hospital and short-term mortality in patients with acute coronary syndrome: a systematic review and meta-analysis. Cardiovasc Diabetol. 2019;18(1):169. doi:10.1186/s12933-019-0970-6
22. Grossman A, Beloosesky Y, Schlesinger A, et al. The association between glycated hemoglobin levels and mortality in non-diabetic elderly subjects. Eur J Intern Med. 2016;27:57–61. doi:10.1016/j.ejim.2015.10.010
23. Vella L, Gatt A, Formosa C. Does baseline hemoglobin a1c level predict diabetic foot ulcer outcome or wound healing time? J Am Podiatr Med Assoc. 2017;107(4):272–279. doi:10.7547/15-176
24. Alberti KGMM, Zimmet PZ. Diagnosis and classification of diabetes mellitus and its complications. Part 1: diagnosis and classification of diabetes mellitus provisional report of a WHO consultation. Diabetic Med. 1998;15:539–553. doi:10.1002/(SICI)1096-9136(199807)15:7<539::AID-DIA668>3.0.CO;2-S
25. Lipsky BA, Senneville É, Abbas ZG, et al. Guidelines on the diagnosis and treatment of foot infection in persons with diabetes (IWGDF 2019 update). Diabetes Metab Res Rev. 2020;36. doi:10.1002/dmrr.3280
26. Definition of an older or elderly person. Available from: http://www.who.int/healthinfo/survey/ageingdefnolder/en/.
27. King C, Lanaspa MA, Jensen T, Tolan DR, Sánchez-Lozada LG, Johnson RJ. Uric Acid as a Cause of the Metabolic Syndrome. Contrib Nephrol. 2018;192:88–102.
28. Bhole V, Choi JW, Kim SW, de Vera M, Choi H. Serum uric acid levels and the risk of type 2 diabetes: a prospective study. Am J Med. 2010;123(10):957–961. doi:10.1016/j.amjmed.2010.03.027
29. Kodama S, Saito K, Yachi Y, et al. Association between serum uric acid and development of type 2 diabetes. Diabetes Care. 2009;32(9):1737–1742. doi:10.2337/dc09-0288
30. Xu YL, Xu KF, Bai JL, et al. Elevation of serum uric acid and incidence of type 2 diabetes: a systematic review and meta-analysis. Chronic Dis Transl Med. 2016;2(2):81–91. doi:10.1016/j.cdtm.2016.09.003
31. Lv Q, Meng XF, He FF, et al. High serum uric acid and increased risk of type 2 diabetes: a systemic review and meta-analysis of prospective cohort studies. PLoS One. 2013;8(2):e56864. doi:10.1371/journal.pone.0056864
32. Yan D, Wang J, Jiang F, et al. A causal relationship between uric acid and diabetic macrovascular disease in Chinese type 2 diabetes patients: a Mendelian randomization analysis. Int J Cardiol. 2016;214:194–199. doi:10.1016/j.ijcard.2016.03.206
33. Pafili K, Katsiki N, Mikhailidis DP, Papanas N. Serum uric acid as a predictor of vascular complications in diabetes: an additional case for neuropathy. Acta Diabetol. 2014;51(5):893–894. doi:10.1007/s00592-014-0631-x
34. Xiong Q, Liu J, Xu Y. Effects of uric acid on diabetes mellitus and its chronic complications. Int J Endocrinol. 2019;2019:9691345. doi:10.1155/2019/9691345
35. Hayfron-Benjamin CF, van den Born BJ, Amoah AGB, et al. Associations of serum uric acid levels with macrovascular and renal microvascular dysfunction among individuals from sub-saharan Africa. JAMA Netw Open. 2021;4(10):e2128985. doi:10.1001/jamanetworkopen.2021.28985
36. Chida R, Hisauchi I, Toyoda S, et al. Impact of irbesartan, an angiotensin receptor blocker, on uric acid level and oxidative stress in high-risk hypertension patients. Hypertens Res. 2015;38(11):765–769. doi:10.1038/hr.2015.82
37. Corry DB, Tuck ML. Uric acid and the vasculature. Curr Hypertens Rep. 2006;8(2):116–119. doi:10.1007/s11906-006-0006-y
38. Puddu P, Puddu GM, Cravero E, Vizioli L, Muscari A. Relationships among hyperuricemia, endothelial dysfunction and cardiovascular disease: molecular mechanisms and clinical implications. J Cardiol. 2012;59(3):235–242. doi:10.1016/j.jjcc.2012.01.013
39. Zhang L, Fu G, Deng Y, et al. Risk factors for foot ulcer recurrence in patients with comorbid diabetic foot osteomyelitis and diabetic nephropathy: a 3-year follow-up study. Int Wound J. 2023;20(1):173–182. doi:10.1111/iwj.13861
40. Megallaa MH, Ismail AA, Zeitoun MH, et al. Association of diabetic foot ulcers with chronic vascular diabetic complications in patients with type 2 diabetes. Diabetes Metam Synd. 2019;13(2):1287–1292. doi:10.1016/j.dsx.2019.01.048
41. American Diabetes Association. 7. Obesity management for the treatment of type 2 diabetes: standards of medical care in diabetes-2018. Diabetes Care. 2018;41(Suppl 1):S65–S72. doi:10.2337/dc18-S007
 © 2023 The Author(s). This work is published and licensed by Dove Medical Press Limited. The full terms of this license are available at https://www.dovepress.com/terms.php and incorporate the Creative Commons Attribution - Non Commercial (unported, v3.0) License.
By accessing the work you hereby accept the Terms. Non-commercial uses of the work are permitted without any further permission from Dove Medical Press Limited, provided the work is properly attributed. For permission for commercial use of this work, please see paragraphs 4.2 and 5 of our Terms.
© 2023 The Author(s). This work is published and licensed by Dove Medical Press Limited. The full terms of this license are available at https://www.dovepress.com/terms.php and incorporate the Creative Commons Attribution - Non Commercial (unported, v3.0) License.
By accessing the work you hereby accept the Terms. Non-commercial uses of the work are permitted without any further permission from Dove Medical Press Limited, provided the work is properly attributed. For permission for commercial use of this work, please see paragraphs 4.2 and 5 of our Terms.