")
Back to Journals » Diabetes, Metabolic Syndrome and Obesity » Volume 16
The Ratio of Fibrinogen to Albumin is Related to the Occurrence of Retinopathy in Type 2 Diabetic Patients
Authors Chen X , Zhao J , You Y, Li Z, Chen S
Received 6 February 2023
Accepted for publication 6 June 2023
Published 23 June 2023 Volume 2023:16 Pages 1859—1867
DOI https://doi.org/10.2147/DMSO.S407391
Checked for plagiarism Yes
Review by Single anonymous peer review
Peer reviewer comments 3
Editor who approved publication: Prof. Dr. Antonio Brunetti
Xiaoyi Chen,1,2 Jingyu Zhao,3 Yanxue You,1,2 Zelin Li,2 Shuchun Chen2
1Graduate School, Hebei North University, Zhangjiakou, 075000, People’s Republic of China; 2Department of Endocrinology, Hebei General Hospital, Shijiazhuang, 050051, People’s Republic of China; 3Graduate School, North China University of Science and Technology, Tangshan, 063210, People’s Republic of China
Correspondence: Shuchun Chen, Department of Endocrinology, Hebei General Hospital, 348, Heping West Road, Shijiazhuang, Hebei, 050051, People’s Republic of China, Email [email protected]
Purpose: Type 2 diabetic retinopathy is a long-term chronic inflammatory disease. The aim of this study was to investigate the relationship between fibrinogen to albumin ratio (FAR) and retinopathy in type 2 diabetic patients.
Methods: This was a retrospective study that included 500 patients with type 2 diabetes mellitus (T2DM), and were divided into non-diabetic retinopathy group (NDR, n=297) and diabetic retinopathy group (DR, n=203) according to fundus examination findings, and the DR group was further divided into non-proliferative retinopathy group (NPDR, n=182) and proliferative retinopathy group (PDR, n=21). Baseline data of patients were collected, and the fibrinogen to albumin ratio (FAR) and neutrophil to lymphocyte ratio (NLR) were calculated to analyze the correlation between FAR and NLR and type 2 diabetic retinopathy.
Results: The FAR and NLR were significantly higher in the DR group compared with the NDR group (both P < 0.001). Spearman correlation analysis showed that FAR was positively correlated with NLR and DR (P < 0.05). As the FAR quartile increased, the prevalence of DR increased (14.8%, 16.7%, 25.1%, and 43.30%, respectively; P < 0.05). Multifactorial logistic regression analysis showed that FAR, diabetic course, systolic blood pressure (SBP) and diabetic peripheral neuropathy (DPN) were risk factors for the development of DR in patients with T2DM. The area under the ROC curve for FAR to predict DR progression was 0.708, with an optimal critical value of 7.04, and the area under the ROC curve for diabetes duration and SBP to predict DR was 0.705 and 0.588, respectively.
Conclusion: Our findings show for the first time that FAR is an independent risk factor for assessing DR in patients with type 2 diabetes.
Keywords: fibrinogen to albumin ratio, type 2 diabetes mellitus, diabetic retinopathy, inflammation, influencing factors
A Letter to the Editor has been published for this article.
Introduction
Diabetic retinopathy (DR) is a localized microvascular pathology of the retina in people living with diabetes caused by long-term high glucose, and is one of the common complications of T2DM.1 With the increasing prevalence of type 2 diabetes, DR has become one of the leading causes of blindness worldwide, especially in working-age people, and seriously affects the quality of life of patients.2,3 Recent studies have shown that the retinal vessels are the only small blood vessels visible to the unaided human eye, yet diabetic retinal neuropathy, which is not visible to the unaided human eye, occurs earlier than retinal vasculopathy.4 Currently, the early identification and diagnosis of DR in clinical practice mainly relies on ophthalmologic examination and also requires the use of ocular ultrasound, and there is a lack of simple, feasible and hematologic biomarkers that can reflect the severity of the disease. Therefore, the search for simple, fast and feasible predictors can help in the early diagnosis and prevention of DR.
An increasing number of studies have identified an important role of chronic low-grade inflammatory response in the pathogenesis of DR.5 Neutrophil/lymphocyte ratio (NLR), an indicator of inflammation, is positively associated with DR in patients with T2DM.6 Previous studies found that fibrinogen (FIB) is not only an indicator of coagulation but also a marker of inflammation. Huang et al7 found that FIB levels correlated with DR in T2DM patients. Meanwhile, albumin (ALB) has antioxidant and anti-inflammatory functions.8 Therefore, the fibrinogen to albumin ratio (FAR) may reflect the inflammatory state and may be associated with the development of chronic inflammation-related diseases. FAR has been found to be associated with the development and prognosis of cancer, COVID-19 and diabetic nephropathy.9–11 However, the correlation between FAR and DR has received little attention so far. FAR is calculated by biochemical tests and has the advantages of being simple, inexpensive and noninvasive. Therefore, the purpose of this study was to analyze the risk factors for retinopathy in type 2 diabetic patients and to investigate the role of FAR in DR.
Methods
Study Design
This was a cross-sectional study. The study was conducted in accordance with the Declaration of Helsinki and approved by the Hebei General Hospital Ethics Committee.
Study Participants
This is a retrospective study in which clinical data were collected from a total of 500 patients with clearly diagnosed type 2 diabetes mellitus in the Hebei General Hospital between August 2019 and June 2021. All patients with T2DM were diagnosed according to the World Health Organization (WHO) 1999 diagnostic criteria for diabetes.12 Patients with type 1 DM patients or acute complications of type 2 DM patients, pregnancy and lactation, severe cardiac, hepatic or renal insufficiency or cancer, cataract, glaucoma or other ophthalmic diseases, recent infections or those with immune system or hematologic disorders were excluded. All patients underwent fundus examination and were divided into non-diabetic retinopathy group (NDR, n=297) and diabetic retinopathy group (DR, n=203) according to the DR grading criteria established by the International Academy of Ophthalmology in 2002.13 The DR group was divided into non-proliferative diabetic retinopathy (NPDR, n=182) and proliferative diabetic retinopathy (PDR, n=21). The study was approved by the Ethics Committee of the Hebei General Hospital, and all participants signed an informed consent form.
Data Collection and Laboratory Analysis
Basic information on the included population was collected, including age, gender, duration of diabetes, history of smoking, history of alcohol, SBP, diastolic blood pressure (DBP) and DPN, as well as body mass index (BMI) calculated by measuring height and weight. Laboratory tests, including glycosylated hemoglobin (HbAlc), fasting blood glucose (FPG), fibrinogen (FIP), serum albumin (Alb), white blood cells, neutrophils, lymphocytes, monocytes, glutamic aminotransferase (ALT), glutamic oxalacetic aminotransferase (AST), total cholesterol (TC), and triglyceride (TG), high-density lipoprotein cholesterol (HDL-C), low-density lipoprotein cholesterol (LDL-C), hemoglobin (HGB), glomerular filtration rate (eGFR), creatinine (Cr), urea nitrogen (BUN), uric acid (UA), etc. FAR was calculated by dividing fibrinogen by albumin, NLR by neutrophil count (× 109 / L) divided by lymphocyte count (× 109 /L).
Statistical Analyses
SPSS 25.0 was applied to analyze the collected data, and GraphPad Prism 8.0.2 was plotted. Normally distributed data were expressed as mean ± standard deviation, and independent samples t-test was used for comparison between groups; non-normal data were expressed as median and interquartile spacing [M (P25%, P75%)], and Mann–Whitney U-test was used for comparison between groups. Count data were expressed as percentages (%), and the χ2 test was used for comparison between groups. Spearman correlation was used for correlation analysis. Binary logistic regression was used to analyze the risk factors of DR in T2DM patients, and grouping was performed according to the quartiles of FAR with trend test, and subject operating characteristic curve (ROC) and area under the curve (AUC) were applied to determine the predictive value of FAR for the occurrence of DR in patients with T2DM. Statistical significance was detected bilaterally, and the difference was considered statistically significant at P < 0.05.
Results
Participant Characterization
Among all T2DM patients, the duration of diabetes was much longer in DR patients than in non-DR patients (P < 0.01). Higher age, systolic blood pressure, DPN, HbA1c, GFR, FIB, Neutrophils, Lymphocytes, NLR, and FAR and lower levels of BMI, SUA, ALT, AST, and ALB were observed in patients with DR (all P < 0.05). However, no significant differences were observed in gender, smoking history, alcohol history, diastolic blood pressure, Hypertension, FPG, TC, TG, HDL-C, LDL-C, BUN, and Scr between DR and non-DR patients (Table 1). DR patients were divided into two groups (PDR and NPDR) according to severity. The PDR group had higher DM duration, FIB NLR, and FAR levels were higher in the PDR group than in the NPDR group, and the differences were statistically significant (P < 0.05) (Table 2).
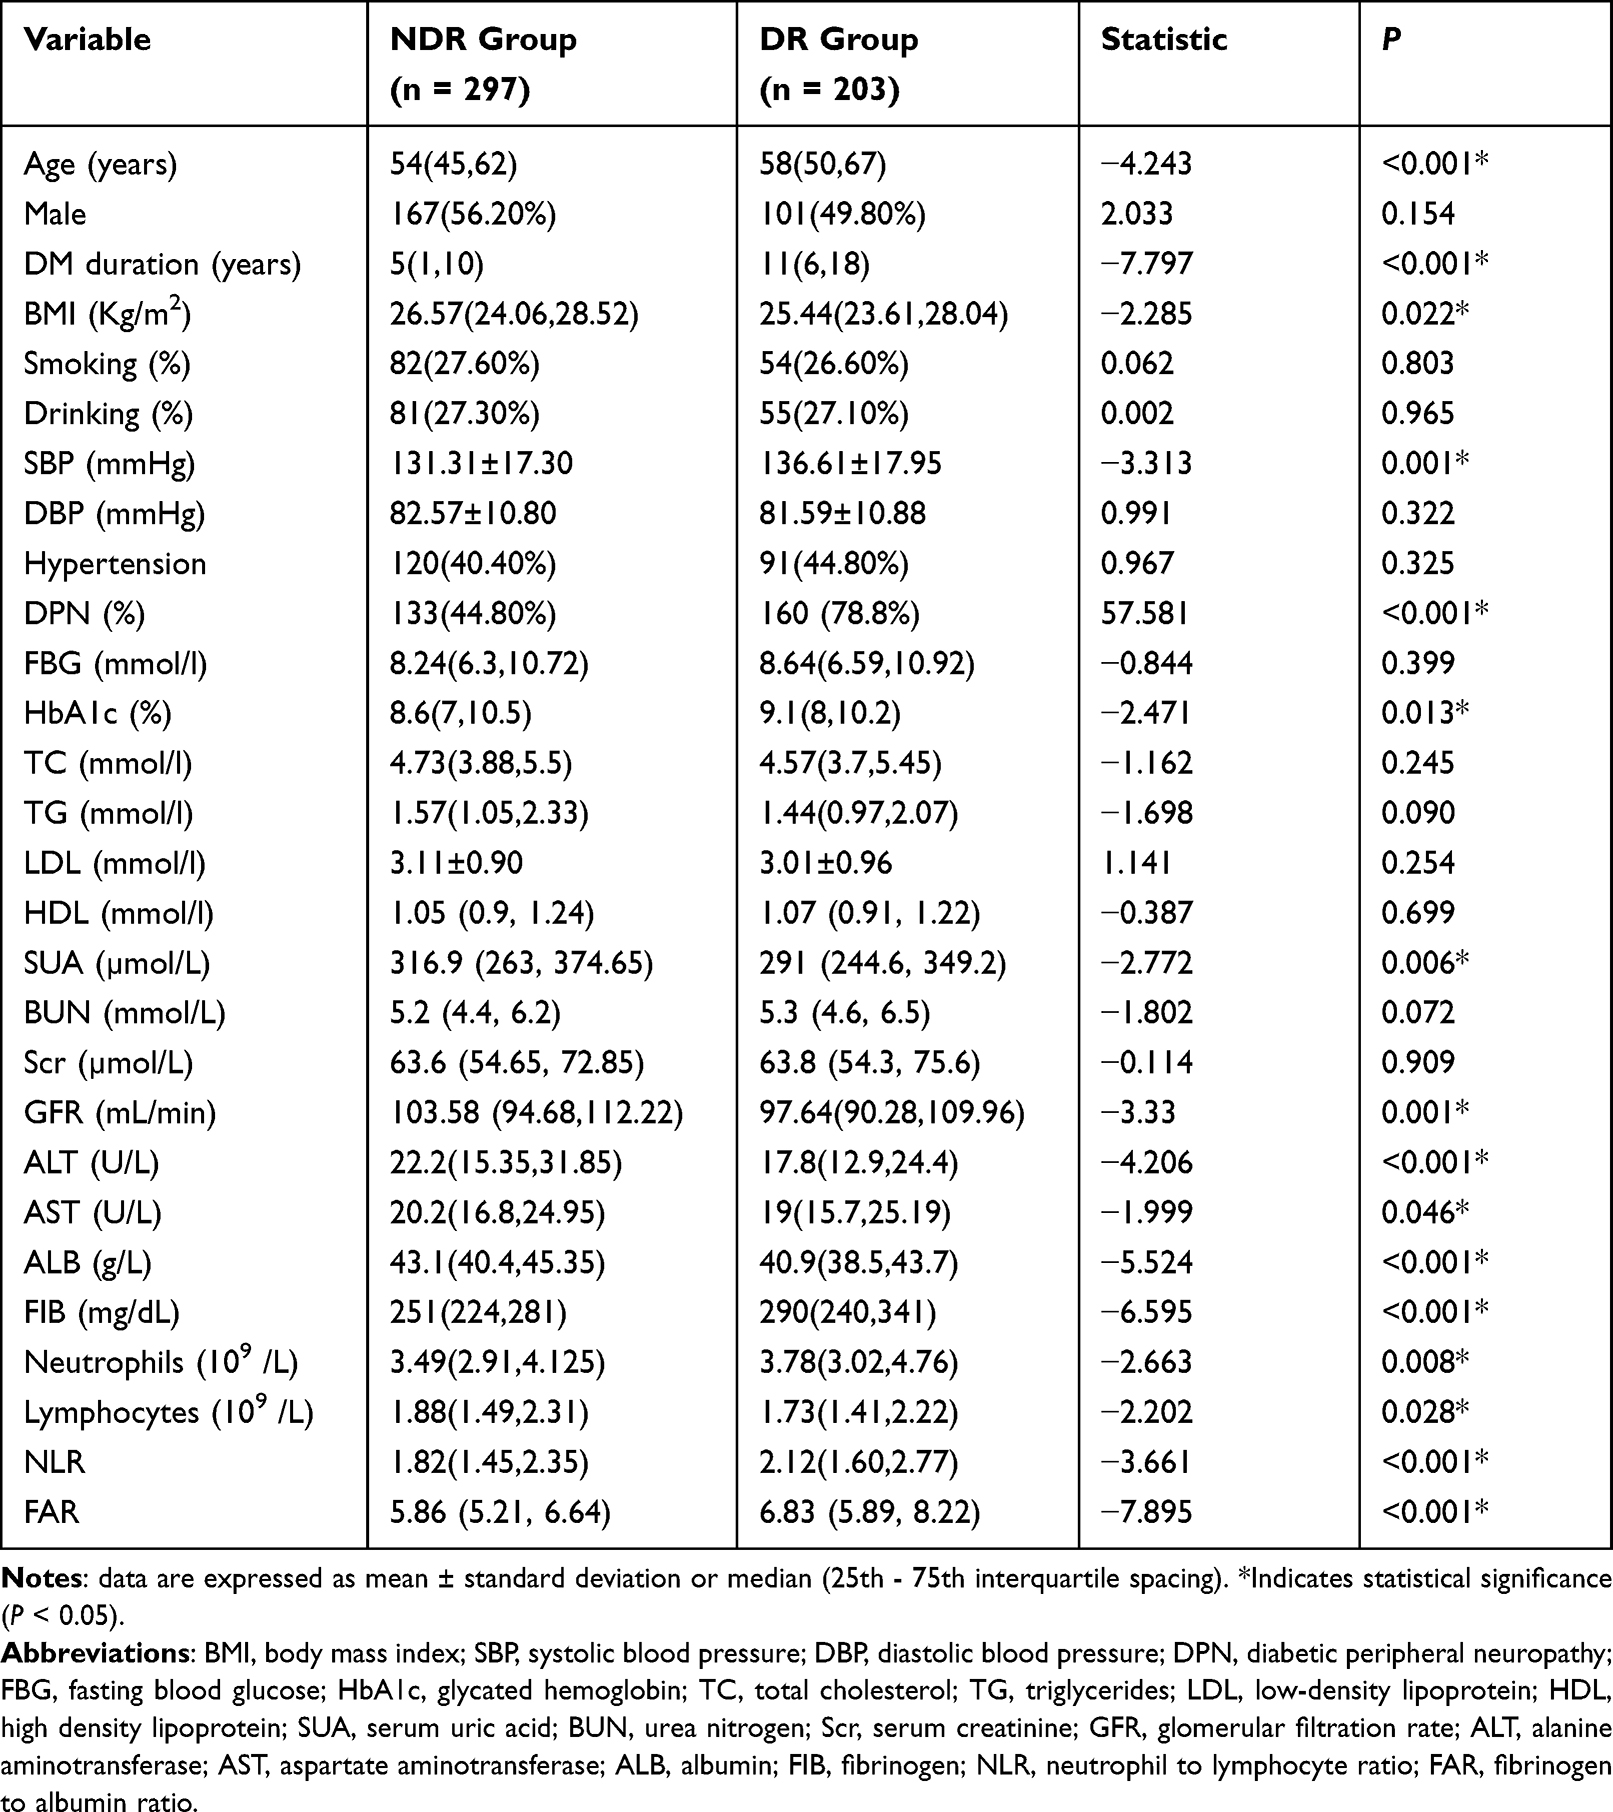 |
Table 1 Baseline Patient Characteristics and Laboratory Results |
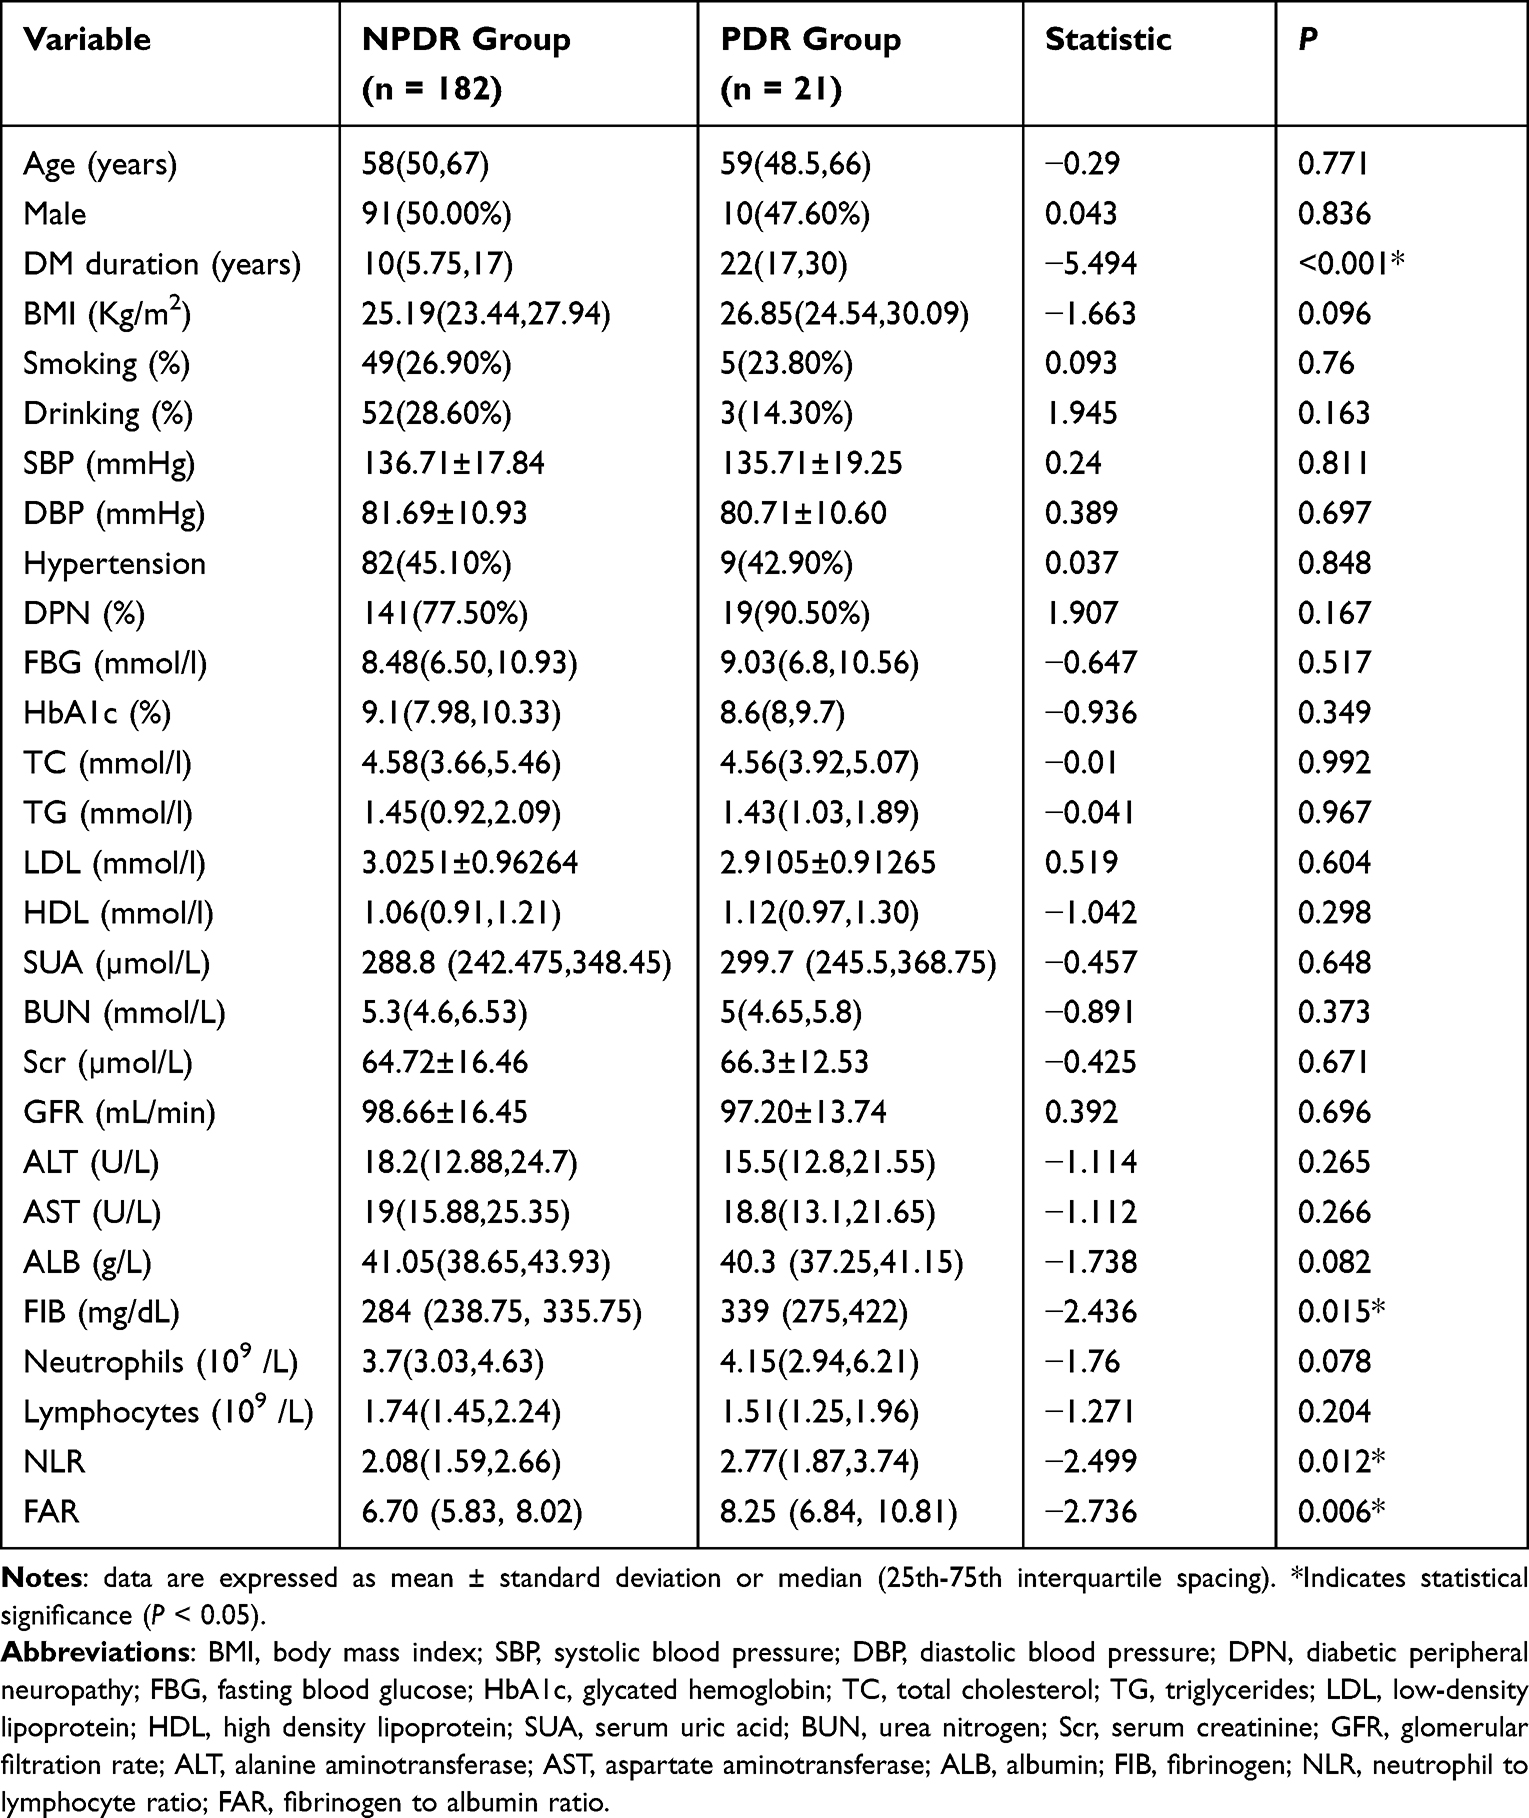 |
Table 2 Comparison of General Data and Biochemical Indexes Between NPDR and PDR Groups |
Correlation Between FAR and Various Indicators in Patients with T2DM
Correlation analysis showed that FAR showed positive correlation with age, gender, DM duration, SBP, Hypertension, DR, DPN, HbA1c, FIB, Neutrophils, NLR (P < 0.05), and negative correlation with smoking, alcohol consumption, SUA, Scr, GFR, ALT, AST, ALB (P < 0.01), and no significant correlation with other indicators (Table 3).
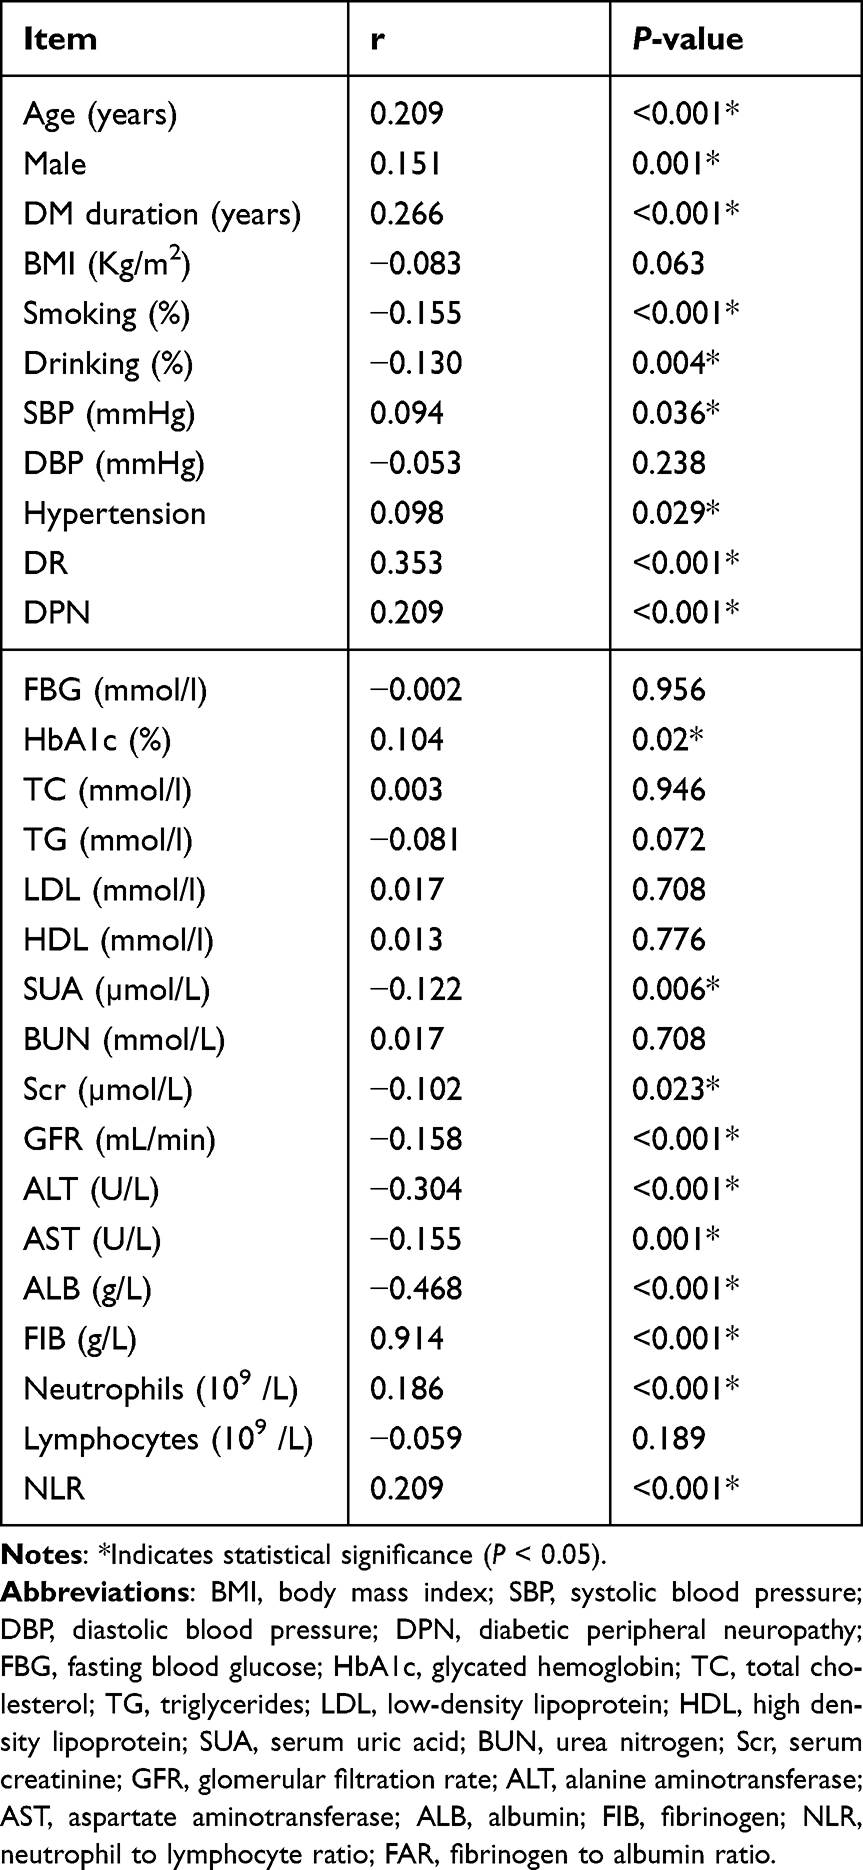 |
Table 3 Univariate Correlation Analysis of FAR with Each Indicator |
FAR is Closely Related to NLR
Linear regression and correlation analysis showed a significant linear correlation between FAR and NLR (adjusted R2 = 0.356; P < 0.001) (Figure 1).
 |
Figure 1 Simple linear regression analysis of FAR versus NLR for all T2DM patients. Abbreviations: NLR, neutrophil-to-lymphocyte ratio; FAR, fibrinogen to albumin ratio. |
FAR Interquartile Spacing and DR Trend Test in T2DM Patients
All enrolled patients were grouped according to their FAR interquartile spacing levels (A~D) and divided into groups A (FAR < 5.3689), B (5.3689 < FAR < 6.1924), C (6.1924 < FAR < 7.1881), and D (FAR > 7.1881) for trend tests. The prevalence of DR increased with increasing FAR quartiles (14.8%, 16.7%, 25.1%, and 43.30%, respectively), and the differences were statistically significant (P < 0.05) (Table 4).
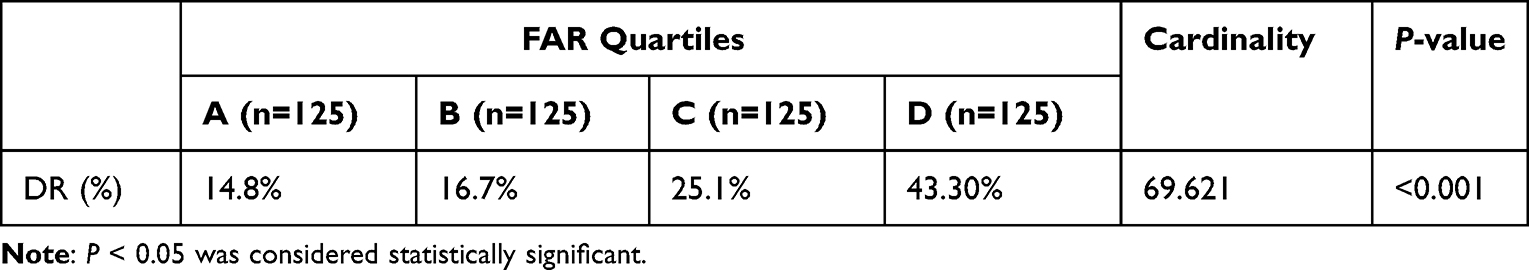 |
Table 4 FAR Interquartile Spacing and Detection Rate of DR for Trend Test |
Multi-Factor Logistic Regression Analysis of DR
After using DR as the dependent variable, variables with differences in the comparison of basic data as independent variables, and excluding covariates such as ALB and FIB, multi-factor logistic regression analysis was performed, and the results showed that the duration of diabetes, SBP, DPN and FAR were independent risk factors for DR, in which, controlling for other independent variables, each unit increase in FAR increased the T2DM patients were 0.507 times more likely to develop DR (P < 0.001) (Table 5).
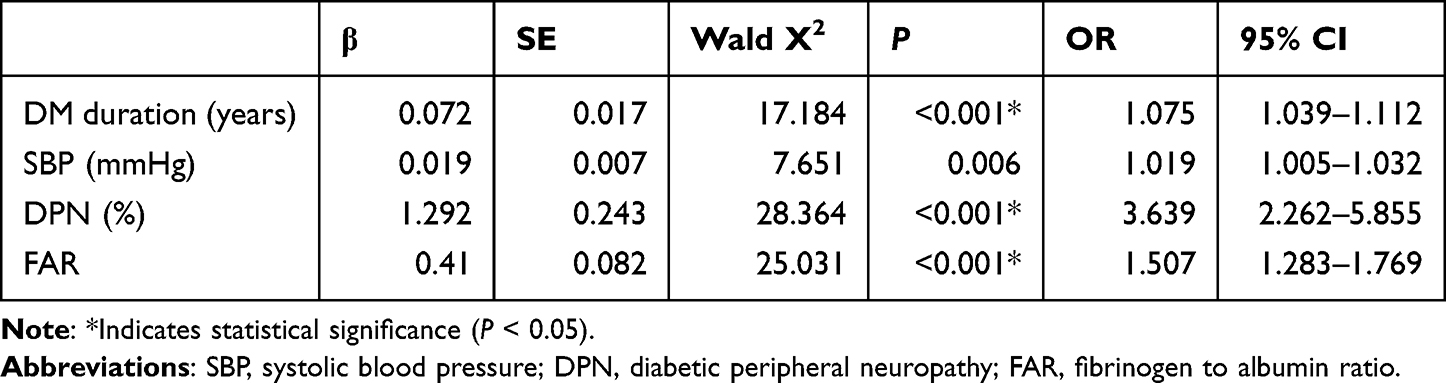 |
Table 5 Multifactorial Logistic Regression Analysis of DR in Patients with T2DM |
ROC Curve Analysis of FAR and DR
The area under the curve (AUC) of FAR for predicting DR according to the ROC curve was 0.708 (95% CI = 0.66 ~ 0.756, P < 0.001). At the maximum of the Jorden index, the FAR cut-off value of 7.04 had the best predictability of DR with a sensitivity of 47.8% and specificity of 87.2%. DM duration greater than 114 months had 65% sensitivity and 69% specificity in predicting DR with an area under the curve of 0.705 (95% CI = 0.658 ~ 0.752, P < 0.001). SBP levels greater than 136 mmHg had 52.2% sensitivity and 63.3% specificity in predicting DR, with an area under the curve of 0.588 (95% CI = 0.538 ~ 0.639, P = 0.001) (Figure 2).
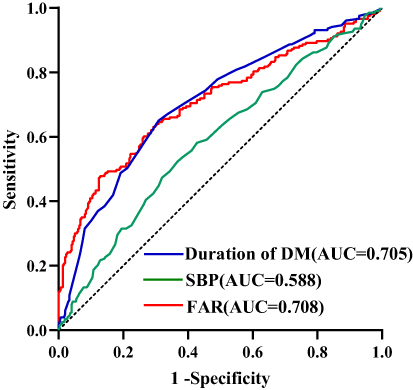 |
Figure 2 ROC curve analysis of the predictive value of fibrinogen to albumin ratio (FAR), duration of diabetes mellitus (DM) and systolic blood pressure (SBP) for DR. |
Discussion
The number of DR patients worldwide continues to rise as the prevalence of DM increases.14 DR is classified according to the course of the disease into NPDR and PDR. NPDR retinas show microaneurysms, hemorrhages, and exudates, while PDR is mainly characterized by the formation of neovascularization.15,16 The pathogenesis of DR is not fully understood, and is currently thought to be related to abnormal metabolic pathways, oxidative stress and inflammation.17,18 Among them, chronic inflammation is a key factor in the development of DR.
Fibrinogen is a soluble protein synthesized primarily by the liver that reflects inflammatory changes in vascular lesions and the coagulation status of the body.19,20 Fibrinogen concentration increases exponentially when the body undergoes tissue damage and inflammatory response.21 Previous literature suggests a link between fibrinogen and inflammation involved in the progression of DR.7,22 In the present study, we found that fibrinogen levels were significantly higher in the DR group compared to the NDR group, and fibrinogen levels were higher in the PDR subgroup compared to the NPDR subgroup, suggesting that fibrinogen levels are associated with the development of DR in people living with diabetes, which is consistent with the findings of Huang et al7 Albumin plays an important role in extracellular antioxidant and immune defense mechanisms, has been shown to have protective anti-inflammatory properties,23 and is associated with microvascular complications in T2DM.8 FAR is the ratio of fibrinogen to albumin, and some studies11 have shown that FAR better reflects inflammatory status than fibrinogen or albumin alone, and, because it is simple and economical to obtain, helps clinicians in the initial assessment of the patient’s condition is facilitated by its easy and economical availability.
FAR has been found to be closely associated with diabetes and can be used to predict and evaluate diabetes-related renal vascular disease,11 and atherosclerosis.24 However, the association between FAR and DR has not been reported. In our study, FAR and NLR were higher in the DR group than in the NDR group, and FAR and NLR were higher in the PDR subgroup than in the NPDR subgroup, both of which were positively correlated with DR, and the risk of developing DR in patients with type 2 diabetes gradually increased with higher FAR levels. In addition, recent studies have shown that fibrinogen is a key regulator of inflammation.25 Specifically, fibrinogen regulates the interaction between leukocytes and endothelial cells to mediate the release of cytokines and chemokines to activate macrophages,26 which are considered to be the basic cells of inflammation.27 Also, it can bind to CD11b/CD18 integrin receptors thereby inducing monocytes to express TNF-α and IL-1.28 In addition, numerous studies have demonstrated that NLR is strongly associated with DR severity and is an independent predictor of DR.6,29 Our study showed that FAR was positively correlated with NLR. In summary, we hypothesize that FAR may be involved in the pathogenesis of DR by influencing inflammation, but further confirmation with large sample size data is needed in the future.
The ROC curve analysis in this study showed that the best critical value of FAR to predict DR progression was 7.04 with an AUC value of 0.708, suggesting that FAR has a good predictive value for DR occurrence in T2DM patients and may be a potential marker to assess the occurrence of DR in T2DM patients. When the FAR exceeds 7.04 in people living with diabetes, further clarification is needed to determine whether DR occurs. In addition, the duration of diabetes mellitus is an influencing factor for DR. a longer duration of DM represents a longer exposure to risk factors and an increased incidence of DM-related complications in DM patients. A prospective cohort study30 showed that the incidence of DR increased with increasing duration of DM disease, and the results of this study are consistent with this.
However, there are some limitations of the current study. First, this study was a retrospective study of clinical cases with some selection bias, and the sample size of this study was small, which needs to be validated by multicenter, large sample, and prospective studies in the future. Second, the relationship between the inflammatory mechanism of diabetic retinopathy and different types of diabetes deserves further study. Finally, long-term clinical observation of fibrinogen may also provide more information on the prognosis of patients.
Conclusion
Our findings show for the first time that FAR is closely related to the development of DR in patients with T2DM, providing a basis for early detection, intervention and treatment of DR.
Disclosure
The authors report no conflicts of interest in this work.
References
1. Oshitari T. Neurovascular impairment and therapeutic strategies in diabetic retinopathy. Int J Environ Res Public Health. 2021;19(1):439. doi:10.3390/ijerph19010439
2. Yau JW, Rogers SL, Kawasaki R, et al. Global prevalence and major risk factors of diabetic retinopathy. Diabetes Care. 2012;35:556–564. doi:10.2337/dc11-1909
3. Cheung N, Mitchell P, Wong TY. Diabetic retinopathy. Lancet. 2010;376:124–136. doi:10.1016/S0140-6736(09)62124-3
4. Sinclair SH, Schwartz SS. Diabetic retinopathy-an underdiagnosed and undertreated inflammatory, neuro-vascular complication of diabetes. Front Endocrinol. 2019;10:843. doi:10.3389/fendo.2019.00843
5. Forrester JV, Kuffova L, Delibegovic M. The role of inflammation in diabetic retinopathy. Front Immunol. 2020;11:583687. doi:10.3389/fimmu.2020.583687
6. He X, Qi S, Zhang X, et al. The relationship between the neutrophil-to-lymphocyte ratio and diabetic retinopathy in adults from the United States: results from the national health and nutrition examination survey. BMC Ophthalmol. 2022;22:346. doi:10.1186/s12886-022-02571-z
7. Huang Q, Wu H, Wo M, et al. Clinical and predictive significance of plasma fibrinogen concentrations combined monocyte-lymphocyte ratio in patients with diabetic retinopathy. Int J Med Sci. 2021;18:1390–1398. doi:10.7150/ijms.51533
8. Zhu Y, Cai X, Liu Y, et al. Serum albumin, but not bilirubin, is associated with diabetic chronic vascular complications in a Chinese type 2 diabetic population. Sci Rep. 2019;9:12086. doi:10.1038/s41598-019-48486-6
9. Demir O, Demirag G, Aslan G. Prospective evaluation of hematological parameters in preoperative renal cell cancer patients. BMC Urol. 2022;22:201. doi:10.1186/s12894-022-01118-0
10. Torun A, Cakirca TD, Cakirca G, et al. The value of C-reactive protein/albumin, fibrinogen/albumin, and neutrophil/lymphocyte ratios in predicting the severity of CoVID-19. Rev Assoc Med Bras. 2021;67:431–436. doi:10.1590/1806-9282.20200883
11. Wang K, Xu W, Zha B, et al. Fibrinogen to albumin ratio as an independent risk factor for type 2 diabetic kidney disease. Diabetes Metab Syndr Obes. 2021;14:4557–4567. doi:10.2147/DMSO.S337986
12. Puavilai G, Chanprasertyotin S, Sriphrapradaeng A. Diagnostic criteria for diabetes mellitus and other categories of glucose intolerance: 1997 criteria by the Expert Committee on the Diagnosis and Classification of Diabetes Mellitus (ADA), 1998 WHO consultation criteria, and 1985 WHO criteria. Diabetes Res Clin Pract. 1999;44:21–26. doi:10.1016/s0168-8227(99)00008-x
13. Wilkinson CP, Ferris FR, Klein RE, et al. Proposed international clinical diabetic retinopathy and diabetic macular edema disease severity scales. Ophthalmology. 2003;110:1677–1682. doi:10.1016/S0161-6420(03)00475-5
14. Tan GS, Gan A, Sabanayagam C, et al. Ethnic differences in the prevalence and risk factors of diabetic retinopathy: the Singapore epidemiology of eye diseases study. Ophthalmology. 2018;125:529–536. doi:10.1016/j.ophtha.2017.10.026
15. Villegas VM, Schwartz SG. Current and future pharmacologic therapies for diabetic retinopathy. Curr Pharm Des. 2018;24:4903–4910. doi:10.2174/1381612825666190130140717
16. Alharbi A, Alhazmi A. Prevalence, risk factors, and patient awareness of diabetic retinopathy in Saudi Arabia: a review of the literature. Cureus. 2020;12:e11991. doi:10.7759/cureus.11991
17. Wang W, Lo A. Diabetic retinopathy: pathophysiology and treatments. Int J Mol Sci. 2018;19. doi:10.3390/ijms19061816
18. Rubsam A, Parikh S, Fort PE. Role of inflammation in diabetic retinopathy. Int J Mol Sci. 2018;19:942. doi:10.3390/ijms19040942
19. Esmon CT. Crosstalk between inflammation and thrombosis. Maturitas. 2008;61:122–131. doi:10.1016/j.maturitas.2008.11.008
20. Esmon CT. Inflammation and thrombosis. J Thromb Haemost. 2003;1:1343–1348. doi:10.1046/j.1538-7836.2003.00261.x
21. Sui J, Noubouossie DF, Gandotra S, et al. Elevated plasma fibrinogen is associated with excessive inflammation and disease severity in COVID-19 patients. Front Cell Infect Microbiol. 2021;11:734005. doi:10.3389/fcimb.2021.734005
22. Tomic M, Ljubic S, Kastelan S, et al. Inflammation, haemostatic disturbance, and obesity: possible link to pathogenesis of diabetic retinopathy in type 2 diabetes. Mediators Inflamm. 2013;2013:818671. doi:10.1155/2013/818671
23. Vincent JL, Russell JA, Jacob M, et al. Albumin administration in the acutely ill: what is new and where next? Crit Care. 2014;18:231. doi:10.1186/cc13991
24. Wang P, Yuan D, Zhang C, et al. High fibrinogen-to-albumin ratio with type 2 diabetes mellitus is associated with poor prognosis in patients undergoing percutaneous coronary intervention: 5-Year findings from a large cohort. Cardiovasc Diabetol. 2022;21:46. doi:10.1186/s12933-022-01477-w
25. Luyendyk JP, Schoenecker JG, Flick MJ. The multifaceted role of fibrinogen in tissue injury and inflammation. Blood. 2019;133:511–520. doi:10.1182/blood-2018-07-818211
26. Smiley ST, King JA, Hancock WW. Fibrinogen stimulates macrophage chemokine secretion through toll-like receptor 4. J Immunol. 2001;167:2887–2894. doi:10.4049/jimmunol.167.5.2887
27. Hamidzadeh K, Christensen SM, Dalby E, et al. Macrophages and the recovery from acute and chronic inflammation. Annu Rev Physiol. 2017;79:567–592. doi:10.1146/annurev-physiol-022516-034348
28. Mosesson MW. Fibrinogen and fibrin structure and functions. J Thromb Haemost. 2005;3:1894–1904. doi:10.1111/j.1538-7836.2005.01365.x
29. Wang JR, Chen Z, Yang K, et al. Association between neutrophil-to-lymphocyte ratio, platelet-to-lymphocyte ratio, and diabetic retinopathy among diabetic patients without a related family history. Diabetol Metab Syndr. 2020;12:55. doi:10.1186/s13098-020-00562-y
30. Liu Y, Wang M, Morris AD, et al. Glycemic exposure and blood pressure influencing progression and remission of diabetic retinopathy: a longitudinal cohort study in GoDARTS. Diabetes Care. 2013;36:3979–3984. doi:10.2337/dc12-2392
 © 2023 The Author(s). This work is published and licensed by Dove Medical Press Limited. The full terms of this license are available at https://www.dovepress.com/terms.php and incorporate the Creative Commons Attribution - Non Commercial (unported, v3.0) License.
By accessing the work you hereby accept the Terms. Non-commercial uses of the work are permitted without any further permission from Dove Medical Press Limited, provided the work is properly attributed. For permission for commercial use of this work, please see paragraphs 4.2 and 5 of our Terms.
© 2023 The Author(s). This work is published and licensed by Dove Medical Press Limited. The full terms of this license are available at https://www.dovepress.com/terms.php and incorporate the Creative Commons Attribution - Non Commercial (unported, v3.0) License.
By accessing the work you hereby accept the Terms. Non-commercial uses of the work are permitted without any further permission from Dove Medical Press Limited, provided the work is properly attributed. For permission for commercial use of this work, please see paragraphs 4.2 and 5 of our Terms.