Back to Journals » Journal of Inflammation Research » Volume 18
The Prognostic Value of Complete Blood Count-Derived Inflammatory Indicators for All-Cause Mortality in Type 2 Diabetes Mellitus: A Retrospective Cohort Study
Authors Li B ![]() , Xu Y, Zhu H, He Q
, Xu Y, Zhu H, He Q ![]() , Yin Q, Wu M, Zhang J, Cao YJ
, Yin Q, Wu M, Zhang J, Cao YJ ![]()
Received 11 June 2025
Accepted for publication 25 September 2025
Published 15 October 2025 Volume 2025:18 Pages 14231—14244
DOI https://doi.org/10.2147/JIR.S546455
Checked for plagiarism Yes
Review by Single anonymous peer review
Peer reviewer comments 3
Editor who approved publication: Dr Quan Zhang
Bowen Li,1,2,* Yue Xu,1,* Huijing Zhu,1,* Qingwei He,2,3 Qiaoxiang Yin,2 Mengdi Wu,2 Jing Zhang,2 Yan-Jie Cao2
1Graduate School, Hebei North University, Zhangjiakou, Hebei, People’s Republic of China; 2Cardiology Department, Air Force Medical Center, PLA, Beijing, People’s Republic of China; 3Air Force Clinical Medical School, Anhui Medical University, Hefei, Anhui, People’s Republic of China
*These authors contributed equally to this work
Correspondence: Yan-Jie Cao, Email [email protected] Qiaoxiang Yin, Email [email protected]
Background: Type 2 diabetes mellitus (T2DM) is closely associated with chronic inflammation. However, the value of low-cost, readily accessible complete blood count (CBC)-derived inflammatory indicators in predicting all-cause mortality among T2DM patients has not been fully evaluated. This study evaluated their predictive potential.
Methods: This single-center retrospective cohort included 619 T2DM patients. Associations between nine inflammatory indicators and all-cause mortality were assessed using multivariable-adjusted Cox regression models. Time-dependent ROC curves, Kaplan-Meier (K-M) analysis, restricted cubic spline (RCS) models, and subgroup analyses evaluated predictive performance and stability.
Results: Over a median follow-up of 1058 days, 137 deaths (22.1%) occurred. Patients in the highest quartile (Q4) of the systemic inflammation response index (SIRI, HR=2.486, 95% CI:1.291,4.788), neutrophil-to-lymphocyte ratio (NLR, HR=2.275, 95% CI:1.217,4.252), and neutrophil-monocyte to lymphocyte ratio (nMLR, HR=2.212, 95% CI:1.200,4.077) had significantly elevated mortality risk versus the lowest quartile (Q1) after adjustment (P for trend< 0.01 for all). RCS confirmed significant positive linear associations (P for nonlinearity> 0.05). Predictive ability attenuated over time per time-dependent ROC. Subgroup analyses demonstrated consistent associations across clinical subgroups (P for interaction> 0.05).
Conclusion: SIRI, NLR, and nMLR can independently predict all-cause mortality in T2DM patients and demonstrate stable performance across clinical subgroups. These low-cost, routinely tested biomarkers possess the potential to optimize risk stratification in resource-limited settings.
Keywords: diabetes, T2DM, mortality, inflammatory biomarkers, complete blood count
Introduction
World Health Organization (WHO) data indicate that type 2 diabetes mellitus (T2DM) has become a major global public health challenge. According to estimates from the International Diabetes Federation (IDF) in 2022, the global prevalence of diabetes among adults aged 20–79 years has reached 10.5% (536.6 million patients) and is projected to increase to 12.2% (783.2 million) by 2045, with the most significant growth in disease burden occurring in low- and middle-income countries.1 As one of the countries with the fastest-growing diabetes prevalence, China saw its adult diabetes prevalence climb to 12.4% in 2018, with a trend towards affecting younger populations; the prevalence among those aged 40–49 years increased by 4.7% compared to 2013.2,3 Traditional risk factors, such as glycated hemoglobin (HbA1c), exhibit certain limitations in predicting mortality risk.4,5 The UK Prospective Diabetes Study (UKPDS) found that even with intensive glycemic control (reducing HbA1c by 0.9%), the risk of myocardial infarction was only reduced by 16%.6 This suggests the need to identify novel biomarkers independent of the metabolic memory effect.
Chronic low-grade inflammation is a core mechanism in the development and progression of T2DM.7 Macrophage infiltration in adipose tissue and interleukin-6 (IL-6)/tumor necrosis factor-alpha (TNF-α)-mediated insulin resistance,8 coupled with inflammatory pathways in pancreatic β-cell apoptosis,9 collectively drive disease progression. Furthermore, inflammation leads to endothelial dysfunction via activation of the nuclear factor kappa B (NF-κB) pathway10 and promotes monocyte chemotaxis involved in atherosclerotic plaque formation,11 significantly increasing the risk of cardiovascular events. However, existing single inflammatory markers, such as white blood cell count, have notable limitations. C-reactive protein (CRP) may lack sufficient sensitivity in chronic inflammation,12 while cytokine detection (eg, IL-6) faces challenges in clinical translation due to high costs and standardization difficulties, particularly in regions with unequal healthcare resources. Low-cost, routine blood test-derived inflammatory indicators could potentially assist in achieving dynamic risk stratification.1,2
Complete blood count (CBC)-derived inflammatory indicators emerge as a potential solution due to their low cost and easy accessibility. WHO reports indicate that over 90% of healthcare facilities globally can perform CBC testing promptly.13 Composite indicators, integrating multidimensional information such as neutrophils, monocytes, and lymphocytes, may offer greater clinical value compared to single parameters like white blood cell count.14 Although indicators like the neutrophil-to-lymphocyte ratio (NLR) are widely used in cardiovascular disease prognosis,15–18 significant gaps remain in diabetes research. Existing studies related to diabetes often focus on single indicators, lack systematic comparisons, and the dynamic predictive value (eg, differences in predictive performance at different time points) remains unexplored.19,20
This study aims to systematically evaluate the predictive efficacy of eight CBC-derived inflammatory indicators and CRP for all-cause mortality in T2DM patients. By integrating time-dependent receiver operating characteristic (ROC) curves and restricted cubic spline (RCS) analysis, we seek to reveal the dynamic predictive patterns of these indicators and explore their time-specific value during the disease course. We hope to preliminarily explore the feasibility of using low-cost, easy-to-operate inflammatory risk stratification tools in resource-limited settings, thereby promoting precision medicine practice. This study is expected to provide a novel perspective for T2DM prognosis management.
Methods
Study Design and Population
Study Design
This was a single-center, retrospective cohort study, conducted in accordance with the Strengthening the Reporting of Observational Studies in Epidemiology (STROBE) guidelines.21 Study participants were recruited from hospitalized patients diagnosed with T2DM who visited the Air Force Medical Center of the People’s Liberation Army (PLA) between January 2019 and December 2022. Baseline clinical and laboratory data were extracted from the Electronic Medical Record (EMR) and the Hospital Laboratory Information System (LIS). All patients were followed up until February 2024 to obtain mortality outcome data.
Study Population and Participant Selection
Inclusion Criteria
Diagnosis of T2DM according to WHO criteria:22 1) Fasting blood glucose (FBG) ≥ 7.0 mmol/L, or 2) 2-hour plasma glucose ≥ 11.1 mmol/L during an oral glucose tolerance test (OGTT), or 3) HbA1c ≥ 6.5%, or 4) Current use of glucose-lowering medications. And availability of complete baseline routine blood test data within 24 hours of admission.
Exclusion Criteria
1. Acute infection of any cause within 30 days prior to enrollment (defined by antibiotic use or white blood cell count >10×10⁹/L accompanied by clinical symptoms). 2.Hematological diseases: Anemia (hemoglobin <120 g/L for males, <110 g/L for females), Thrombocytopenia (<150×10⁹/L) or thrombocytosis (>450×10⁹/L), Leukemia, lymphoma, or other myeloproliferative neoplasms. 3.Active malignancy within the past five years or history of chemotherapy/radiotherapy. 4.Lost to follow-up (inability to contact for outcome verification or missing survival data). 5.Death due to novel coronavirus infection or accidents.
Patient screening was performed by two independent physicians according to predefined criteria. Cases with eligibility disagreements underwent independent adjudication by a third senior physician.
Ethical Approval and Informed Consent
The study protocol was approved by the Institutional Review Board of the Air Force Medical Center of PLA (2024–56-PJ01). Given the retrospective nature of the study and the complete anonymization of patient data, the requirement for informed consent was waived. This practice complies with the Declaration of Helsinki.23
Variable Definitions
Exposure Variables
Nine inflammatory indicators were derived from routine CBC measurements taken at admission. All CBC measurements were performed within 24 hours of admission using a Sysmex XN-9000 hematology analyzer (Sysmex Corporation, Kobe, Japan). Venous blood samples (3 mL) were collected in EDTA-K2 anticoagulant tubes and analyzed within 2 hours of collection to avoid cell degradation. The laboratory participates in the national external quality assessment (EQA) program organized by the Chinese Center for Clinical Laboratories, with a 100% pass rate in annual assessments. All cell counts are expressed as absolute values (×10⁹/L):
Neutrophil-to-lymphocyte ratio (NLR): Neutrophil count / Lymphocyte count. Aggregate index of systemic inflammation (AISI): (Neutrophils × Monocytes × Platelets) / Lymphocytes. Derived neutrophil-to-lymphocyte ratio (dNLR): Neutrophils / (White blood cell count - Neutrophils). Monocyte-to-lymphocyte ratio (MLR): Monocyte count / Lymphocyte count. Neutrophil-monocyte to lymphocyte ratio (nMLR): (Neutrophils + Monocytes) / Lymphocytes. Platelet-to-lymphocyte ratio (PLR): Platelet count / Lymphocyte count. Systemic immune-inflammation index (SII): (Neutrophils × Platelets) / Lymphocytes. Systemic inflammation response index (SIRI): (Neutrophils × Monocytes) / Lymphocytes. C-reactive protein (CRP): Measured directly by immunoturbidimetry (mg/L).
Outcome Variable
The primary endpoint was death (excluding deaths due to novel coronavirus infection or accidents). Mortality data were ascertained through the following methods: 1) Active follow-up: Structured telephone interviews with patients or their families. 2) Medical record review: Cross-verification with the hospital’s electronic health records. 3) National death registry: Linkage with the Chinese Center for Disease Control and Prevention (CDC) database for validation. The follow-up period ended in February 2024.
Confounding Variables and Adjusted Models
Continuous variables: Age, Body mass index (BMI), Red blood cell count (RBC), Hemoglobin (HGB), Hematocrit (HCT), Platelet count (PLT), Fasting blood glucose (FBG), Blood urea nitrogen (BUN), Serum creatinine (Scr), Uric acid (UA), Total cholesterol (TC), Triglycerides (TG), High-density lipoprotein (HDL), Low-density lipoprotein (LDL). Categorical variables: Gender, Smoking status, Diabetic neuropathy (DN), Vascular injury (VI), Diabetic retinopathy (DR), Hypertension, Coronary artery disease (CAD), Stroke, Dyslipidemia, Venous thrombosis (VT), Glucagon-like peptide-1 receptor agonist (GLP-1RA) therapy, Sodium-glucose cotransporter-2 inhibitor (SGLT2i) therapy, Antiplatelet therapy (APT), Lipid-lowering therapy (LLT), Renin-angiotensin-aldosterone system inhibitor (RAASi) therapy. Cox proportional hazards models were sequentially adjusted as follows: Model 1: Unadjusted. Model 2: Adjusted for Age, Hypertension, CAD, Stroke, DR, and SGLT2i therapy. Model 3: Further adjusted for RBC, HGB, HCT, BUN, and Scr.
Statistical Analysis
Normally distributed continuous variables are presented as mean (standard deviation, SD), and comparisons between groups were performed using independent samples t-tests. Skewed continuous variables are presented as median (interquartile range, IQR), and comparisons between groups were performed using Wilcoxon rank-sum tests. Categorical variables are presented as counts and frequencies (percentages, %), and comparisons between groups were performed using Chi-square (χ²) tests or Fisher’s exact tests. Variables with more than 10% missing values were excluded from the analysis. For variables with missing values between 5% and 10%, multiple imputation was employed. Missing values constituting less than 5% of the data for a variable were replaced with the mean (for continuous variables) or mode (for categorical variables) of that variable. Outlier handling was performed using the boxplot method. The relationship between inflammatory indicators and mortality risk was assessed using Kaplan-Meier (K-M) curves and Cox proportional hazards models. Baseline variables showing significant differences (P < 0.05) between survivors and non-survivors were included in the multivariable models. Furthermore, the variance inflation factor (VIF) was calculated to check for multicollinearity, ensuring the independence of variables included in the models (VIF < 10 was considered acceptable). Subgroup analyses and interaction tests were conducted to explore the association between continuous inflammatory indicators and mortality across different subgroups. RCS analysis with 3 knots was used to further investigate the dose-response relationship between statistically significant inflammatory indicators and mortality. ROC curve analysis was performed to compare the predictive ability, sensitivity, and specificity of the inflammatory indicators for mortality. A P-value < 0.05 was considered statistically significant for all analyses. All statistical analyses were performed using SPSS 27 (IBM Corp., Armonk, NY, USA) and R 4.3.3 (R Foundation for Statistical Computing, Vienna, Austria).
Results
Baseline Characteristics
The flow diagram of participant selection is presented in Supplementary Figure S1. A total of 619 eligible patients were included in this study. By the study cutoff date, 137 all-cause deaths were observed (22.1%), with a median follow-up time of 1058 days. Significant differences (P < 0.05) were observed between the survivor and non-survivor groups for the following variables: Age, RBC, HGB, HCT, BUN, Scr, CRP, SII, SIRI, nMLR, MLR, NLR, AISI, Hypertension, CAD, Stroke, DR, and SGLT2i. No statistically significant differences (P ≥ 0.05) were found between the groups for Gender, BMI, PLT, FBG, UA, TC, TG, HDL, LDL, dNLR, PLR, DN, VI, Dyslipidemia, VT, Smoking status, GLP-1RA, APT, LLT, and RAASi. Details are presented in Table 1.
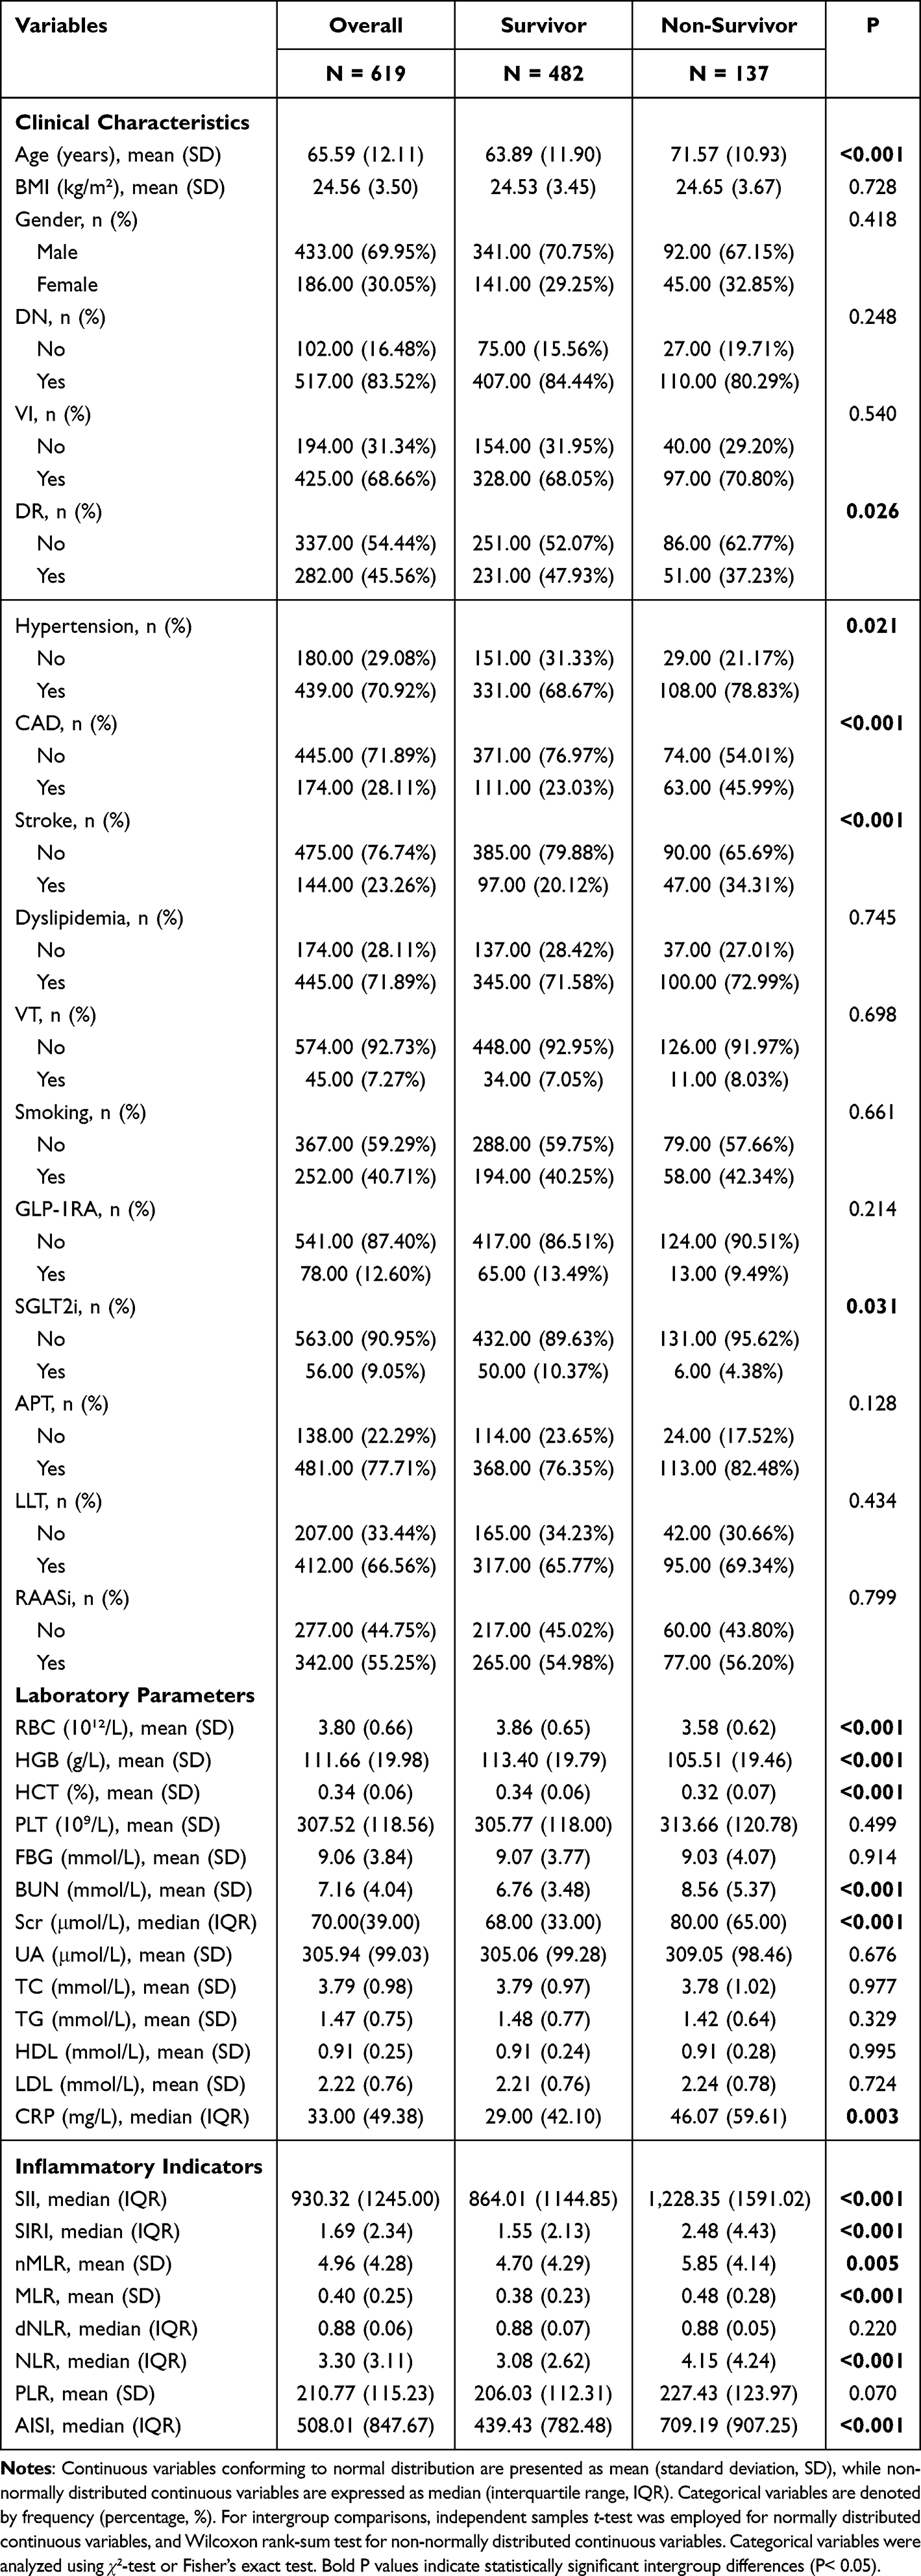 |
Table 1 Baseline Characteristics of the Study Population |
Association Between Inflammatory Indicators and All-Cause Mortality
As presented in Table 2, variables demonstrating statistically significant differences in baseline characteristics were incorporated into multi-stage adjusted models. VIF were computed to evaluate multicollinearity among variables (detailed in Supplementary Table S1), confirming variable independence (all VIF < 10). Results demonstrated that the highest quartile group (Q4) of SIRI, NLR, and nMLR remained significantly predictive of all-cause mortality risk in T2DM patients after full adjustment (Model 3), exhibiting significant trend relationships (P for trend < 0.01). Compared to the lowest quartile group (Q1): NLR yielded hazard ratios (HRs) and 95% confidence intervals (CIs) of Q2: 1.481 (0.817–2.687), Q3: 1.967 (1.095–3.533), Q4: 2.275 (1.217–4.252); nMLR yielded HRs (95% CIs) of Q2: 1.289 (0.711–2.337), Q3: 1.822 (1.022–3.246), Q4: 2.212 (1.200–4.077); SIRI yielded HRs (95% CIs) of Q2: 1.736 (0.936–3.217), Q3: 2.086 (1.137–3.825), Q4: 2.486 (1.291–4.788). These findings indicate that these derived inflammatory indicators may possess independent predictive value for all-cause mortality in T2DM patients.
 |
Table 2 Associations Between Inflammation Biomarkers and All-Cause Mortality |
As illustrated in Figure 1, K-M analysis was performed for NLR, nMLR, and SIRI using quartile-based groupings, with all censored data treated as non-informative right-censoring. Results demonstrated that all three inflammation-related indicators exhibited significant prognostic stratification value in K-M survival analysis (Log rank test P < 0.05 for each). Patient survival rates showed a dose-dependent decrease with increasing indicator levels. As detailed in Supplementary Table S2, Hommel-adjusted Log rank tests24 revealed that for all indicators, the highest quartile group (Q4) showed significant survival differences compared to Q1/Q2 groups (P < 0.05). Except for nMLR, the Q3 group also demonstrated statistically significant differences versus Q1. These findings indicate that elevated NLR, nMLR, and SIRI values are significantly associated with adverse prognosis, while suggesting that nMLR may have a relatively weaker stratification capacity.
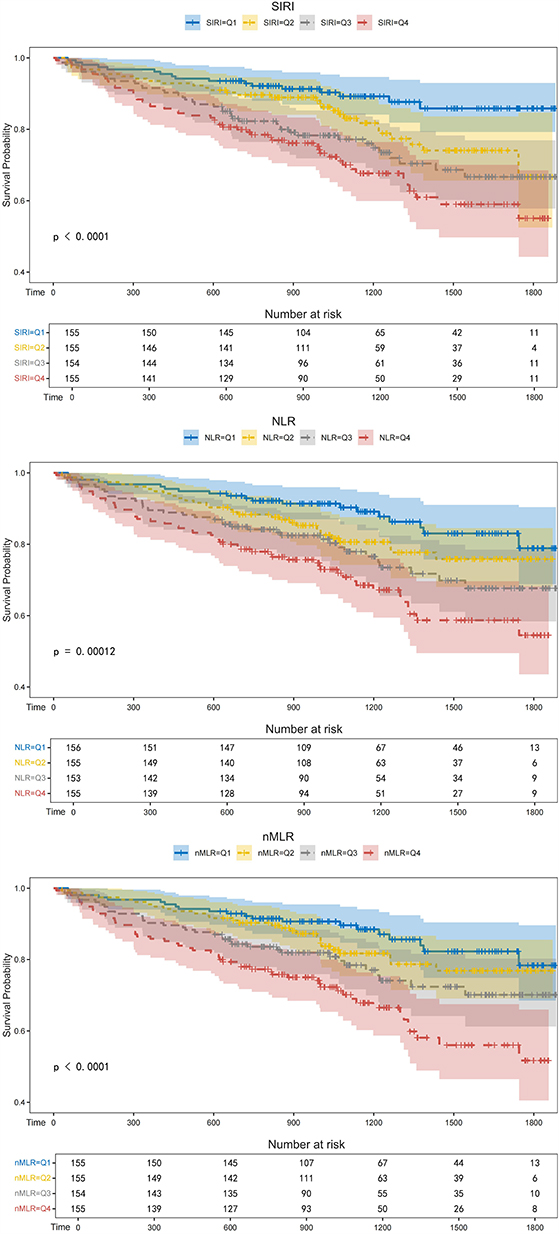 |
Figure 1 K-M Survival Curves of SIRI, NLR, and nMLR by Quartile Groups in T2DM Patients. |
RCS Curve Analysis
A 3-knot RCS model was employed to analyze the dose-response relationship between the three inflammatory markers and all-cause mortality risk. As shown in Figure 2, the association patterns between these inflammatory markers and mortality risk demonstrated consistent characteristics: SIRI (P for Overall < 0.001; P for Nonlinear = 0.316), NLR (P for Overall < 0.001; P for Nonlinear = 0.437), and nMLR (P for Overall = 0.001; P for Nonlinear = 0.348) all exhibited significant linear dose-response relationships, indicating no need for complex nonlinear modeling. Combined with the K-M curve results, these findings suggest that the association between inflammatory marker levels and mortality risk likely follows a “no safe threshold” gradual pattern.
 |
Figure 2 Restricted Cubic Spline Analysis of Associations Between SIRI, NLR, and nMLR with All-Cause Mortality in T2DM Patients. (A) SIRI; (B) NLR; Subpanel (C) nMLR. X-axis: Indicator level; Y-axis: Hazard ratio (HR) for all-cause mortality; Shaded area: 95% confidence interval (95% CI). Overall P<0.05 (SIRI/NLR: <0.001; nMLR: 0.001); Nonlinear P>0.05 (SIRI: 0.316; NLR: 0.437; nMLR: 0.348), confirming a potential positive linear relationship between each indicator and all-cause mortality. |
ROC Curve Analysis
As depicted in Figure 3, univariate ROC curves were constructed for the three indicators. The area under the curve (AUC) values at 365 days, 1095 days, and 1825 days were as follows: SIRI: 0.656/0.630/0.630; NLR: 0.661/0.624/0.619; nMLR: 0.657/0.621/0.616. As detailed in Supplementary Table S3, optimal cut-off values determined by maximizing Youden’s index were 1.82 for SIRI, 4.44 for NLR, and 3.56 for nMLR. Covariates retaining statistical significance in univariate Cox regression were incorporated to establish a base model. Subsequently, each inflammatory marker was added individually to this base model for multivariate ROC analysis. The combined AUC values with the base model at 365/1095/1825 days were: SIRI: 0.806/0.783/0.768; NLR: 0.806/0.783/0.768; nMLR: 0.805/0.782/0.767. These results demonstrate a partially time-dependent predictive performance: AUC values for all three markers progressively declined with prolonged follow-up in both univariate and multivariate models.
 |
Figure 3 Time-Dependent Predictive Performance of SIRI, NLR, and nMLR for All-Cause Mortality in T2DM Patients. (A–C) Univariate ROC at 365/1095/1825 days (AUC: 0.616–0.661); Subpanels (D–F) Multivariate ROC (with base model) at the same time points (AUC: 0.767–0.806). X-axis: 1-Specificity (False Positive Rate, FPR); Y-axis: Sensitivity (True Positive Rate, TPR). |
Subgroup Analysis
As illustrated in Figure 4, subgroup analysis demonstrated that SIRI, NLR, and nMLR exhibited cross-population generalizability in predicting all-cause mortality. The HRs remained stable across all clinical subgroups (interaction P > 0.05 for each). These findings suggest that SIRI, NLR, and nMLR possess potential as universal risk-stratification tools. Future studies should further validate the modifying effects of therapeutic interventions on the prognostic value of these inflammatory markers.
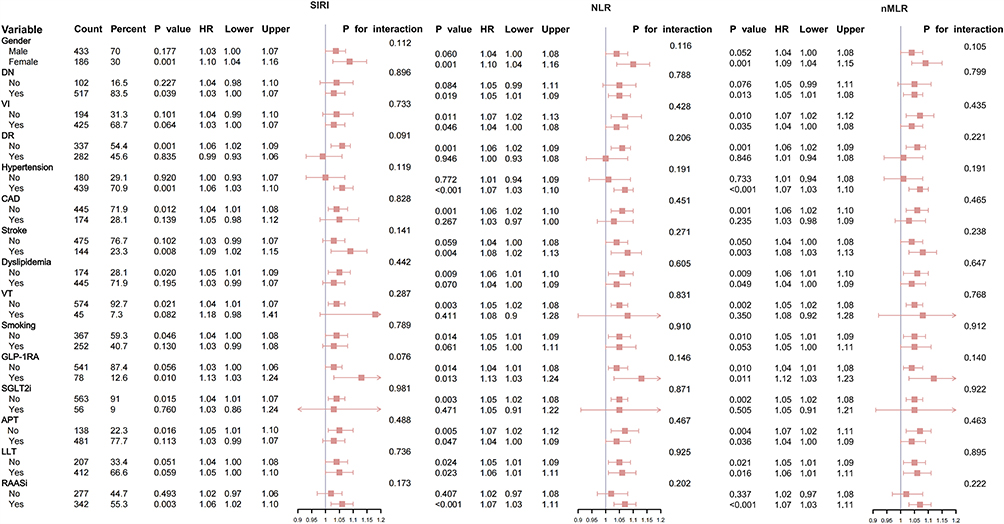 |
Figure 4 Subgroup Analysis of SIRI, NLR, and nMLR in Predicting All-Cause Mortality. |
Discussion
To our knowledge, this study is the first to explore the time-dependent predictive patterns of CBC-derived inflammatory indicators for all-cause mortality in Chinese patients with T2DM. We identified SIRI, NLR, and nMLR as potential independent predictors of all-cause mortality in T2DM, with optimal cut-off values of 1.82, 4.44, and 3.56, respectively. Time-dependent ROC curves suggested phase-specific predictive utility, while K-M survival curves indicated superior risk stratification performance for SIRI and NLR compared to nMLR. RCS analysis confirmed a positive linear relationship between all three markers and mortality risk. Subgroup analysis revealed no significant interaction effects (P > 0.05) across clinical subgroups, collectively contributing to the theoretical framework for inflammatory risk stratification in T2DM.
Multiple prior studies demonstrate that intensive glycemic control yields limited reduction in myocardial infarction risk.6,25 This implies constrained predictive capacity of traditional metabolic markers for cardiovascular events, highlighting the critical role of inflammatory mechanisms beyond glucose management in prognosis.26 Our findings validate this hypothesis: after adjusting for HGB, age, cardiovascular comorbidities, and other confounders, NLR, nMLR, and SIRI retained independent predictive value. This suggests inflammatory markers may drive mortality risk through pathways independent of metabolic memory effects (eg, endothelial dysfunction or immunosenescence), positioning them as complementary tools to traditional metabolic indicators for identifying high-risk patients.27,28
NLR, one of the earliest systematically validated CBC-derived inflammatory indices, is extensively applied in prognostic assessment of cardiovascular diseases (eg, heart failure, atherosclerosis).29–33 In diabetes research, NLR evidence remains robust but predominantly focuses on single-marker studies.29,34–36 Aligning with our results, Zhang et al37 identified NLR and SIRI as independent predictors of all-cause mortality in T2DM within a US cohort, similarly reporting non-significant associations for PLR—consistent with our findings in the Chinese population. However, their study additionally found SII, dNLR, MLR, and AISI to be significant predictors, diverging from our observations. These discrepancies may stem from population heterogeneity (eg, ethnicity, geographic distribution, lifestyle, socioeconomic status) or our more comprehensive adjustment for clinical confounders. The predictive value of CRP for T2DM mortality remains controversial.38,39 Although CRP exhibits high sensitivity in acute inflammation, its dynamic monitoring utility in chronic inflammation (eg, T2DM) may be limited—a notion supported by our null findings regarding CRP’s association with all-cause mortality.
The differential predictive efficacy among CBC-derived inflammatory indicators may be explained by interactions between their compositional characteristics and pathophysiological dynamics. The prognostic value of NLR likely stems from the dynamic equilibrium between two cell lineages: neutrophil activation directly damages vascular endothelium through the release of myeloperoxidase (MPO) and matrix metalloproteinase-9 (MMP-9),40 while lymphocytopenia reflects chronic immunosuppression (eg, reduced CD4+/CD8+ ratio).41 These dual pathways collectively drive cardiovascular risk in diabetes.42 Notably, although both SIRI and nMLR integrate myeloid and lymphoid parameters, their mathematical formulations may confer differential sensitivity to inflammatory phenotypes. The multiplicative term in SIRI (neutrophils × monocytes / lymphocytes) exhibits high sensitivity to acute synergistic effects, such as transient bursts of neutrophil extracellular traps (NETs) and monocyte chemotaxis.40 Conversely, the additive term in nMLR (neutrophils + monocytes / lymphocytes) may better capture chronic cumulative damage, exemplified by adipose tissue macrophage infiltration and sustained neutrophil activation.41
Specifically, the persistent predictive power of all three markers may arise from their dual representation of chronic low-grade inflammation and exhaustion of adaptive immunity. On one hand, sustained infiltration of neutrophils and monocytes exacerbates vascular oxidative stress via NF-κB pathway.10 On the other, lymphocytopenia impairs immune surveillance, accelerating atherosclerotic plaque instability and infection-related mortality.42 Furthermore, the observed attenuation in long-term predictive accuracy for individual markers may reflect resolution of inflammatory events (eg, NETs clearance) or therapeutic interventions (eg, statin-induced suppression of monocyte activation).9 Finally, the absence of significant interaction effects across subgroups for all three inflammatory markers underscores their robust predictive stability, though further validation remains warranted.
This study systematically evaluates the exploration of low-cost, highly accessible inflammatory markers in relation to outcomes among hospitalized patients with T2DM in Asian populations. However, several limitations warrant consideration. First, the single-center cohort’s sample size and follow-up duration constrain the generalizability of findings. Additionally, this study only included hospitalized T2DM patients, who typically have more severe disease or comorbidities compared to outpatients. This may introduce selection bias, and the findings may not be generalizable to patients with mild T2DM. Future multi-center studies with larger samples are needed to validate the stability of these markers across ethnicities and healthcare systems. Second, the study only recorded baseline measurements, while therapeutic interventions such as antiplatelet agents and statins may dynamically modulate inflammatory markers. Moreover, outcome ascertainment through telephone follow-up for some patients may introduce recall bias. Although adjusted for in Cox models, residual confounding from unmeasured variables cannot be fully excluded. Lastly, the observational design precludes causal inference, and the biological complexity of these markers remains incompletely elucidated. Future work should further explore their causal roles in diabetes and its complications.
Conclusion
This study provides initial evidence for the prognostic value of CBC-derived inflammatory markers in predicting all-cause mortality among hospitalized patients with T2DM. After multivariate adjustment, elevated SIRI, NLR, and nMLR were independently associated with increased all-cause mortality. These markers demonstrated consistent risk-predictive capacity across diverse clinical subgroups, confirming their broad applicability and stability. As low-cost, readily accessible biomarkers, SIRI, NLR, and nMLR demonstrate potential for risk stratification in diabetes management. Future research could be conducted to validate their optimal cut-off values through multi-center cohort studies and to develop dynamic monitoring protocols integrating these biomarkers, thereby complementing and refining precision management frameworks for diabetes.
Highlights
- SIRI, NLR, and nMLR independently predict all-cause mortality in T2DM patients.
- These low-cost biomarkers demonstrate stable performance across clinical subgroups.
- They offer potential for risk stratification in resource-limited settings.
Abbreviations
AISI, Aggregate Index of Systemic Inflammation; APT, Antiplatelet Therapy; BMI, Body Mass Index; BUN, Blood Urea Nitrogen; CBC, Complete Blood Count; CAD, Coronary Artery Disease; CRP, C-Reactive Protein; dNLR, Derived Neutrophil-to-Lymphocyte Ratio; DN, Diabetic Neuropathy; DR, Diabetic Retinopathy; FBG, Fasting Blood Glucose; GLP-1RA, Glucagon-like Peptide-1 Receptor Agonist; HbA1c, Glycated Hemoglobin; HCT, Hematocrit; HDL, High-density Lipoprotein; HGB, Hemoglobin; LDL, Low-density Lipoprotein; LLT, Lipid-Lowering Therapy; MLR, Monocyte-to-Lymphocyte Ratio; NF-κB, Nuclear Factor Kappa B; NLR, Neutrophil-to-Lymphocyte Ratio; nMLR, Neutrophil-Monocyte to Lymphocyte Ratio; OGTT, Oral Glucose Tolerance Test; PLR, Platelet-to-Lymphocyte Ratio; PLT, Platelet; RAASi, Renin-Angiotensin-Aldosterone System Inhibitor; RBC, Red Blood Cell; Scr, Serum Creatinine; SGLT2i, Sodium-Glucose Cotransporter-2 Inhibitor; SII, Systemic Immune-inflammation Index; SIRI, Systemic Inflammation Response Index; T2DM, Type 2 Diabetes Mellitus; TC, Total Cholesterol; TG, Triglycerides; TNF-α, Tumor Necrosis Factor-alpha; UA, Uric Acid; VI, Vascular Injury; VT, Venous Thrombosis.
Data Sharing Statement
The data used in this study can be obtained by making a reasonable request to the primary corresponding author (Yan-jie Cao).
Acknowledgments
We sincerely thank all participants in this study.
Funding
This study was funded by the Special Project for Health Care Logistics of the Air Force Medical Center (24BJZ11).
Disclosure
The authors declare no conflicts of interest in this work.
References
1. Sun H, Saeedi P, Karuranga S, et al. IDF Diabetes Atlas: global, regional and country-level diabetes prevalence estimates for 2021 and projections for 2045. Diabetes Res Clin Pract. 2022;183:109119. doi:10.1016/j.diabres.2021.109119
2. Tu WJ, Xue Y, Nie D. The prevalence and treatment of diabetes in China from 2013 to 2018. JAMA. 2022;327(17):1706. doi:10.1001/jama.2022.3014
3. Li Y, Teng D, Shi X, et al. Prevalence of diabetes recorded in mainland China using 2018 diagnostic criteria from the American Diabetes Association: national cross sectional study. BMJ. 2020;369:m997. doi:10.1136/bmj.m997
4. Budenholzer B. Glycaemia and vascular effects of type 2 diabetes. BMJ. 2001;322(7296):1245.
5. Yudkin JS. May be high risk, low benefit. BMJ. 2008;336(7646):683. doi:10.1136/bmj.39520.531319.3A
6. Stratton IM, Adler AI, Neil HA, et al. Association of glycaemia with macrovascular and microvascular complications of type 2 diabetes (UKPDS 35): prospective observational study. BMJ. 2000;321(7258):405–412. doi:10.1136/bmj.321.7258.405
7. Wellen KE, Hotamisligil GS. Inflammation, stress, and diabetes. J Clin Invest. 2005;115(5):1111–1119. doi:10.1172/JCI25102
8. Hotamisligil GS. Inflammation, metaflammation and immunometabolic disorders. Nature. 2017;542(7640):177–185. doi:10.1038/nature21363
9. Donath MY. Targeting inflammation in the treatment of type 2 diabetes: time to start. Nat Rev Drug Discov. 2014;13(6):465–476. doi:10.1038/nrd4275
10. Du X, Matsumura T, Edelstein D, et al. Inhibition of GAPDH activity by poly(ADP-ribose) polymerase activates three major pathways of hyperglycemic damage in endothelial cells. J Clin Invest. 2003;112(7):1049–1057. doi:10.1172/JCI18127
11. Libby P, Ridker PM, Hansson GK. Leducq transatlantic network on atherothrombosis. Inflammation in atherosclerosis: from pathophysiology to practice. J Am Coll Cardiol. 2009;54(23):2129–2138. doi:10.1016/j.jacc.2009.09.009
12. Rutter MK, Meigs JB, Sullivan LM, D’Agostino RB, Wilson PWF. C-reactive protein, the metabolic syndrome, and prediction of cardiovascular events in the Framingham Offspring Study. Circulation. 2004;110(4):380–385. doi:10.1161/01.CIR.0000136581.59584.0E
13. World Health Statistics. 2022: Monitoring Health for the Sdgs, Sustainable Development Goals.
14. Fest J, Ruiter R, Mulder M, et al. The systemic immune-inflammation index is associated with an increased risk of incident cancer-A population-based cohort study. Int J Cancer. 2020;146(3):692–698. doi:10.1002/ijc.32303
15. Balta S, Ozturk C. The platelet-lymphocyte ratio: a simple, inexpensive and rapid prognostic marker for cardiovascular events. Platelets. 2015;26(7):680–681. doi:10.3109/09537104.2014.979340
16. Wu CC, Wu CH, Lee CH, Cheng CI. Association between neutrophil percentage-to-albumin ratio (NPAR), neutrophil-to-lymphocyte ratio (NLR), platelet-to-lymphocyte ratio (PLR) and long-term mortality in community-dwelling adults with heart failure: evidence from US NHANES 2005–2016. BMC Cardiovasc Disord. 2023;23(1):312. doi:10.1186/s12872-023-03316-6
17. Yang YL, Wu CH, Hsu PF, et al. Systemic immune-inflammation index (SII) predicted clinical outcome in patients with coronary artery disease. Eur J Clin Invest. 2020;50(5):e13230. doi:10.1111/eci.13230
18. Mi W, Li T. Neutrophil-lymphocyte ratio as a novel biomarker of prognosis in patients with heart failure. Angiology. 2024;75(8):798–799. doi:10.1177/00033197231220240
19. Jaaban M, Zetoune AB, Hesenow S, Hessenow R. Neutrophil-lymphocyte ratio and platelet-lymphocyte ratio as novel risk markers for diabetic nephropathy in patients with type 2 diabetes. Heliyon. 2021;7(7):e07564. doi:10.1016/j.heliyon.2021.e07564
20. Zeng J, Chen M, Feng Q, et al. The platelet-to-lymphocyte ratio predicts diabetic retinopathy in type 2 diabetes mellitus. Diabetes Metab Syndr Obes. 2022;15:3617–3626. doi:10.2147/DMSO.S378284
21. von Elm E, Altman DG, Egger M, et al. The Strengthening the Reporting of Observational Studies in Epidemiology (STROBE) statement: guidelines for reporting observational studies. PLoS Med. 2007;4(10):e296. doi:10.1371/journal.pmed.0040296
22. World Health Organization, International Diabetes Federation. Definition and diagnosis of diabetes mellitus and intermediate hyperglycaemia: report of a WHO/IDF consultation. 2006 [cited May 19, 2025]. Available from: https://iris.who.int/handle/10665/43588.
23. World Medical Association. World Medical Association Declaration of Helsinki: ethical principles for medical research involving human subjects. JAMA. 2013;310(20):2191–2194. doi:10.1001/jama.2013.281053
24. Victor A, Elsässer A, Hommel G, Blettner M. Judging a plethora of p-values: how to contend with the problem of multiple testing--part 10 of a series on evaluation of scientific publications. Dtsch Arztebl Int. 2010;107(4):50–56. doi:10.3238/arztebl.2010.0050
25. UK Prospective Diabetes Study (UKPDS) Group. Intensive blood-glucose control with sulphonylureas or insulin compared with conventional treatment and risk of complications in patients with type 2 diabetes (UKPDS 33). Lancet. 1998;352(9131):837–853. doi:10.1016/S0140-6736(98)07019-6
26. Sharif S, Van der Graaf Y, Cramer MJ, et al. Low-grade inflammation as a risk factor for cardiovascular events and all-cause mortality in patients with type 2 diabetes. Cardiovasc Diabetol. 2021;20(1):220. doi:10.1186/s12933-021-01409-0
27. Pedersen BK. The anti-inflammatory effect of exercise: its role in diabetes and cardiovascular disease control. Essays Biochem. 2006;42:105–117. doi:10.1042/bse0420105
28. Petersen AMW, Pedersen BK. The anti-inflammatory effect of exercise. J Appl Physiol. 2005;98(4):1154–1162. doi:10.1152/japplphysiol.00164.2004
29. Dong G, Gan M, Xu S, Xie Y, Zhou M, Wu L. The neutrophil-lymphocyte ratio as a risk factor for all-cause and cardiovascular mortality among individuals with diabetes: evidence from the NHANES 2003–2016. Cardiovasc Diabetol. 2023;22(1):267. doi:10.1186/s12933-023-01998-y
30. Zhang X, Wei R, Wang X, et al. The neutrophil-to-lymphocyte ratio is associated with all-cause and cardiovascular mortality among individuals with hypertension. Cardiovasc Diabetol. 2024;23(1):117. doi:10.1186/s12933-024-02191-5
31. He Y, Liu X, Wang M, Ke H, Ge C. Neutrophil-to-lymphocyte ratio as a predictor of cardiovascular mortality in cancer survivors. Sci Rep. 2024;14(1):20980. doi:10.1038/s41598-024-72027-5
32. Sonaglioni A, Esposito V, Caruso C, et al. Association between neutrophil to lymphocyte ratio and carotid artery wall thickness in healthy pregnant women. Eur J Obstetrics Gynecol Reprod Biol. 2020;255:98–104. doi:10.1016/j.ejogrb.2020.10.034
33. Sharma DJ, Nath HJ, Batta A, Goala AK. Neutrophil-to-Lymphocyte Ratio (NLR) useful as a cost-effective preliminary prognostic marker in ST-Elevation Myocardial Infarction (STEMI): an observational study from a Tertiary Care Hospital in Northeast India. Cureus. 2023;15(3):e36885. doi:10.7759/cureus.36885
34. Akase T, Kawamoto R, Ninomiya D, Kikuchi A, Kumagi T. Neutrophil-to-lymphocyte ratio is a predictor of renal dysfunction in Japanese patients with type 2 diabetes. Diabetes Metab Syndr. 2020;14(4):481–487. doi:10.1016/j.dsx.2020.04.029
35. Vatankhah N, Jahangiri Y, Landry GJ, et al. Predictive value of neutrophil-to-lymphocyte ratio in diabetic wound healing. J Vasc Surg. 2017;65(2):478–483. doi:10.1016/j.jvs.2016.08.108
36. Chen HL, Wu C, Cao L, Wang R, Zhang TY, He Z. The association between the neutrophil-to-lymphocyte ratio and type 2 diabetes mellitus: a cross-sectional study. BMC Endocr Disord. 2024;24(1):107. doi:10.1186/s12902-024-01637-x
37. Zhang J, Fan X, Xu Y, et al. Association between inflammatory biomarkers and mortality in individuals with type 2 diabetes: NHANES 2005–2018. Diabet Res Clin Pract. 2024;209:111575. doi:10.1016/j.diabres.2024.111575
38. Bruno G, Landi A, Barutta F, et al. N-terminal probrain natriuretic peptide is a stronger predictor of cardiovascular mortality than C-reactive protein and albumin excretion rate in elderly patients with type 2 diabetes. Diabetes Care. 2013;36(9):2677–2682. doi:10.2337/dc13-0353
39. Sattar N, Hingorani AD. C-reactive protein and prognosis in diabetes: getting to the heart of the matter. Diabetes. 2009;58(4):798–799. doi:10.2337/db08-1788
40. Brownlee M. The pathobiology of diabetic complications: a unifying mechanism. Diabetes. 2005;54(6):1615–1625. doi:10.2337/diabetes.54.6.1615
41. Hotamisligil GS. Inflammation and metabolic disorders. Nature. 2006;444(7121):860–867. doi:10.1038/nature05485
42. Libby P. Inflammation in atherosclerosis. Nature. 2002;420(6917):868–874. doi:10.1038/nature01323
 © 2025 The Author(s). This work is published and licensed by Dove Medical Press Limited. The
full terms of this license are available at https://www.dovepress.com/terms
and incorporate the Creative Commons Attribution
- Non Commercial (unported, 4.0) License.
By accessing the work you hereby accept the Terms. Non-commercial uses of the work are permitted
without any further permission from Dove Medical Press Limited, provided the work is properly
attributed. For permission for commercial use of this work, please see paragraphs 4.2 and 5 of our Terms.
© 2025 The Author(s). This work is published and licensed by Dove Medical Press Limited. The
full terms of this license are available at https://www.dovepress.com/terms
and incorporate the Creative Commons Attribution
- Non Commercial (unported, 4.0) License.
By accessing the work you hereby accept the Terms. Non-commercial uses of the work are permitted
without any further permission from Dove Medical Press Limited, provided the work is properly
attributed. For permission for commercial use of this work, please see paragraphs 4.2 and 5 of our Terms.