Back to Journals » Journal of Inflammation Research » Volume 14
The Predictive Value of Hemocytometry Based on Peripheral Platelet-Related Parameters in Identifying the Causes of Febrile Seizures
Received 13 August 2021
Accepted for publication 28 September 2021
Published 18 October 2021 Volume 2021:14 Pages 5381—5392
DOI https://doi.org/10.2147/JIR.S334165
Checked for plagiarism Yes
Review by Single anonymous peer review
Peer reviewer comments 2
Editor who approved publication: Professor Ning Quan
Ling Tang,1 Jie-Ru Chen2
1Department of Clinical Laboratory, The Affiliated Wuxi No.2 People’s Hospital of Nanjing Medical University, Wuxi, 214001, People’s Republic of China; 2Department of Paediatrics, The Affiliated Wuxi No.2 People’s Hospital of Nanjing Medical University, Wuxi, 214001, People’s Republic of China
Correspondence: Jie-Ru Chen
Department of Paediatrics, The Affiliated Wuxi No.2 People’s Hospital of Nanjing Medical University, Wuxi, 214001, People’s Republic of China
Tel +86 13057386807
Email [email protected]
Objective: To evaluate the outcome of platelet-related parameters in children with febrile seizures (FSs) and seek low-cost markers for the clinical prediction of FSs.
Methods: A total of 79 patients with FSs (the FS group) who were hospitalized in our hospital were selected. Eighty-two patients with fever and without seizures (the FC group) and 81 healthy patients without fever (the HC group) were selected. The results of whole blood cell analysis were retrospectively analyzed.
Results: The results of whole blood cell analysis showed that platelet (PLT) count, mean platelet volume (MPV), hemoglobin (Hb), mean corpuscular volume (MCV), mean corpuscular hemoglobin (MCH), and hematocrit (HCT) levels in the FS group were significantly lower than in the FC and HC groups (P < 0.05). The platelet-to-lymphocyte ratio (PLR) in the FS and FC groups was significantly higher than in the HC group (P < 0.05), but there was no statistical difference between the FS and FC groups (P > 0.05). The PLT count in the CFS group was significantly lower than in the SFS group (P < 0.05). The PDW of the CFS group was higher compared with the SFS group (P < 0.05). The PLT count and PLR of the relapsed group were lower than those of the non-relapsed group (P < 0.05). The conducted linear regression analysis showed that MCH, PLT, and MPV were closely related to the occurrence of FSs. The binary logistic model showed that MPV was the most important protective factor related to FSs.
Conclusion: PLT and MPV are closely related to the occurrence of FSs. PLT and PDW may be able to serve as simple yet effective laboratory indicators for distinguishing different types of FSs. Low PLR levels could be used to predict the risk of FS recurrence.
Keywords: febrile seizures, hemocytes, platelet count, mean platelet volume, platelet distribution width
Introduction
Febrile seizure (FS) is the most common type of childhood seizure disease. It typically occurs in children between six months and five years old with an accompanying temperature that can reach above 38°C. While the disease is associated with fever, there is a lack of evidence of intracranial infection or other clear pathology factors (eg, brain tumor, epilepsy).1 Approximately 30–50% of cases are likely to relapse after the first onset,2 and the younger the age at the first onset, the greater the probability of recurrence in the future.
Although most cases of FSs have a good prognosis and will not cause serious harm to children,3 the condition can still be traumatic for parents. In particular, complex FSs (CFSs) are more likely to develop into epileptic seizures than simple FSs (SFSs). The condition seriously affects the physical and mental growth and life quality of children, and it can impose psychological and economic burdens on their families. Additionally, the parents of children with FSs are not always able to describe the manifestations of these seizures clearly and accurately, which can lead to confusion in the judgment of the occurrence and classification of FS. Therefore, establishing objective biomarkers for use in the prediction and judgment of the occurrence and type of FS will be of significant clinical benefit.
Whole blood cell analysis is a testing technology available in all hospitals and is simple and convenient to perform. Almost all child patients and children who receive routine physical examinations in a hospital will receive this examination. The test is convenient to clinicians and patients because it can identify useful predictive indexes. At present, several new parameters reflecting inflammatory indexes, such as neutrophil to lymphocyte ratio (NLR), platelet-to-lymphocyte ratio (PLR), and red blood cell distribution width (RDW), have begun to enter the research field of inflammation-related diseases. The predictive value of these indicators in FS has also become a new focus of clinical research. As low-cost markers of inflammatory responses, they have attracted more and more attention. However, there are few relevant studies, and the results are not consistent.4–10 For example, some6,9 believe that NLP increases the risk of FS, and NLR and RDW can be limited to distinguish between SFS and CFS. However, others5,7,8 believe that NLR and RDW cannot clearly distinguish SFS and CFS, and there is no significant difference between FS and the control group. In any case, the study of these peripheral blood inflammatory indicators opens a new idea for the clinical search for effective biomarkers of FS. Some of these studies only investigated the difference between SFS and CFS groups.6–9 Others only had a fever control group or healthy children control group,5,9,10 which did not involve the situation of children with FS recurrence, and there are few studies on the relationship between platelet-related parameters such as platelet count (PLT), mean platelet volume (MPV), and platelet distribution width (PDW) and the occurrence of febrile convulsion. Recent studies showed that in addition to hemostasis, platelets play an important role in inflammation and immunity.11 Accordingly, we decided to select platelet-related parameters in the whole blood cell analysis of peripheral blood as the focus of the current study. We also reviewed the role of other blood cell indicators in FSs to identify valuable parameters.
Materials and Methods
Research Subjects
This research represents a retrospective study with all data derived from the hospital medical records database and did not involve medical ethics or requiring the informed consent of patients.
The FS group included 79 cases of hospitalized children with FSs in Wuxi No.2 People’s Hospital (China). Seven cases were herpetic pharyngitis, eight were acute bronchitis, two were acute laryngitis, and the other 62 were all children with acute upper respiratory tract infections. Children with previous conditions such as hereditary metabolic disease, epilepsy, psychomotor retardation, congenital dysplasia, intracranial space-occupying lesion, and other brain injuries were excluded. A diagnosis of FS was made according to the 2011 American Academy of Pediatrics (AAP) criteria.12 The study population comprised 41 males and 38 females. Electroencephalography was performed in children older than three years to rule out epilepsy. A total of 15 cases involving children with focal seizures lasting more than 15 minutes (including more than two seizures within 24 hours or in the same febrile course) were classified into the CFS group. The remaining 64 cases were categorized into the SFS group.
The febrile control group. To exclude the influence of infection and fever on the study results, 82 patients of the same age and who had been hospitalized during the same period for acute upper respiratory tract infection, with fever but no seizures, and where the fever ran its course within three days were selected as the fever control (FC) group. The group included 47 males and 35 females with an average age of 3.45 ± 1.66 years.
The healthy control group. The healthy control (HC) group comprised 81 healthy children with normal physical examination results and included 36 males and 45 females with an average age of 3.43 ± 2.01 years.
Children with pre-existing heart, brain, endocrine, or other basic diseases were excluded in the FC and HC groups.
Research Methods
In the FS and FC groups, 2 mL venous blood was drawn within half an hour following admission and put into an anticoagulant tube containing EDTAK2. The samples were sent for whole blood cell analysis and C-reactive protein (CRP) detection within half an hour after mixing. In the HC group, venous blood was collected randomly by the same method for whole blood cell analysis and CRP detection. Whole blood cell analysis was performed using a Sysmex-2100 automatic blood cell analyzer. CRP was detected using an automatic specific protein instant detection analyzer (Ottoman-1000).
Statistical Analysis
Analyses were conducted using the SPSS Statistics software (v.17.0) program. A Chi-square test (χ2) or Fisher’s exact test was used for the data enumeration. Normally distributed variables were expressed as the mean ± the standard deviation (SD) and were compared with independent sample t-tests. One-way analysis of variance was used to compare the differences between the three groups. The Least-Significant Difference (LSD) test or Dunnett’s T3 test was used for pairwise comparison between groups. Linear regression analysis and binary logistic analysis were used to study the association between the FSs (dependent variable) and the detection factors (independent variables). All P-values less than 0.05 were considered statistically significant.
Results
The Comparison of Clinical and Laboratory Data Among the Febrile Seizure, Fever Control, and Healthy Control Groups
The study included 79 children (mean age 2.9 ± 1.6 years old) in the FS group, including 15 patients with CFS (mean age 4.0 ± 2.4 years old) and 64 patients with SFS (mean age 2.7 ± 1.2 years old). The control group included 163 children (mean age 3.4 ± 1.8 years old). The FS, FC, and HC groups indicated no significant differences in age, sex, and red blood cell distribution width (P>0.05). There was no significant difference in body temperature between the FS and FC groups (P > 0.05).
- ) A comparison of platelet-related parameters showed that platelet (PLT) count and mean platelet volume (MPV) in the FS group were significantly lower than those in the FC and HC groups (P < 0.05). Platelet-to-lymphocyte ratio (PLR) was higher in the FS group than in the HC group (P < 0.05), but there was no significant difference between the FS and FC groups (P > 0.05). There was no significant difference in the platelet distribution width (PDW) among the three groups (P > 0.05) (see Table 1 and Figure 1).
- ) The results of additional blood cell analysis showed that the hemoglobin, mean corpuscular volume (MCV), mean corpuscular hemoglobin (MCH), and hematocrit levels in the FS group were significantly lower than in the FC and HC groups (P < 0.05). The white blood-cell-count, neutrophil-to-lymphocyte ratio (NLR), and CRP in the FS and FC groups were significantly higher than in the HC group (P < 0.05). However, there was no significant difference between the FS and FC groups (P > 0.05). The proportion of neutrophils in the FS group was lower than in the FC group but higher than in the HC group, and the proportion of lymphocytes in the FS group was higher than in the FC group but lower than in the HC group (P < 0.05) (see Table 2).
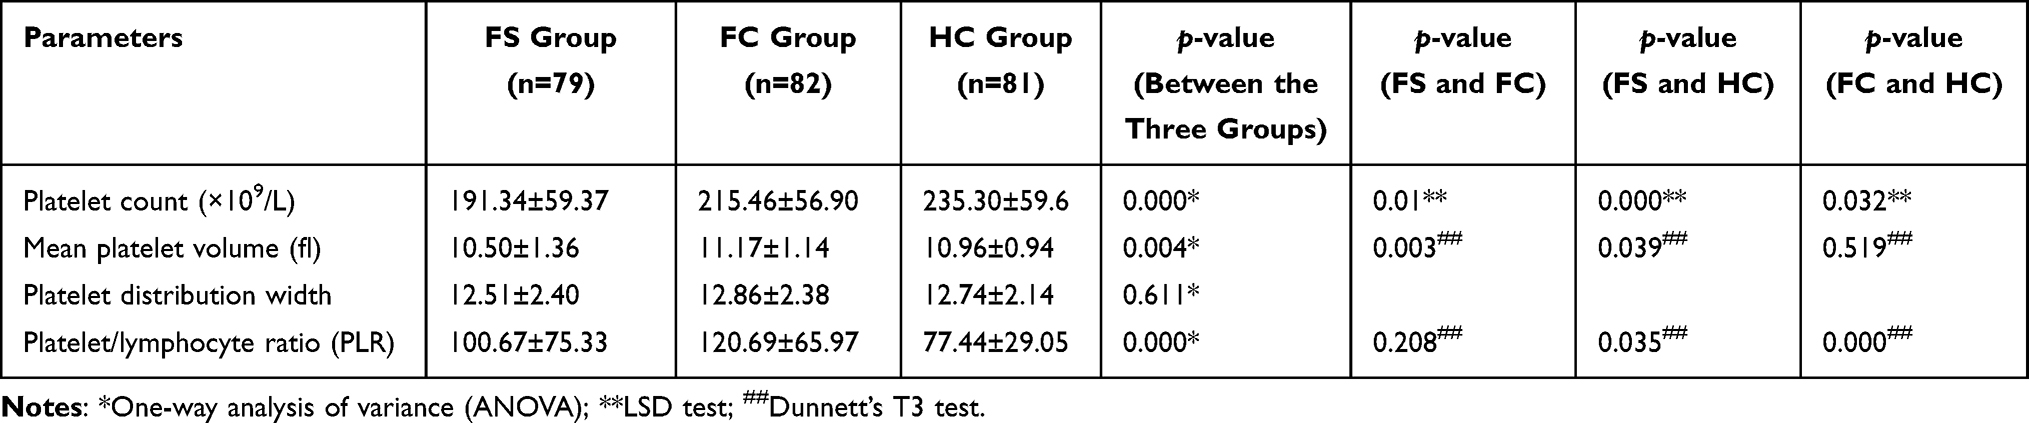 |
Table 1 Comparison of Platelet-Related Parameters Among the Three Groups |
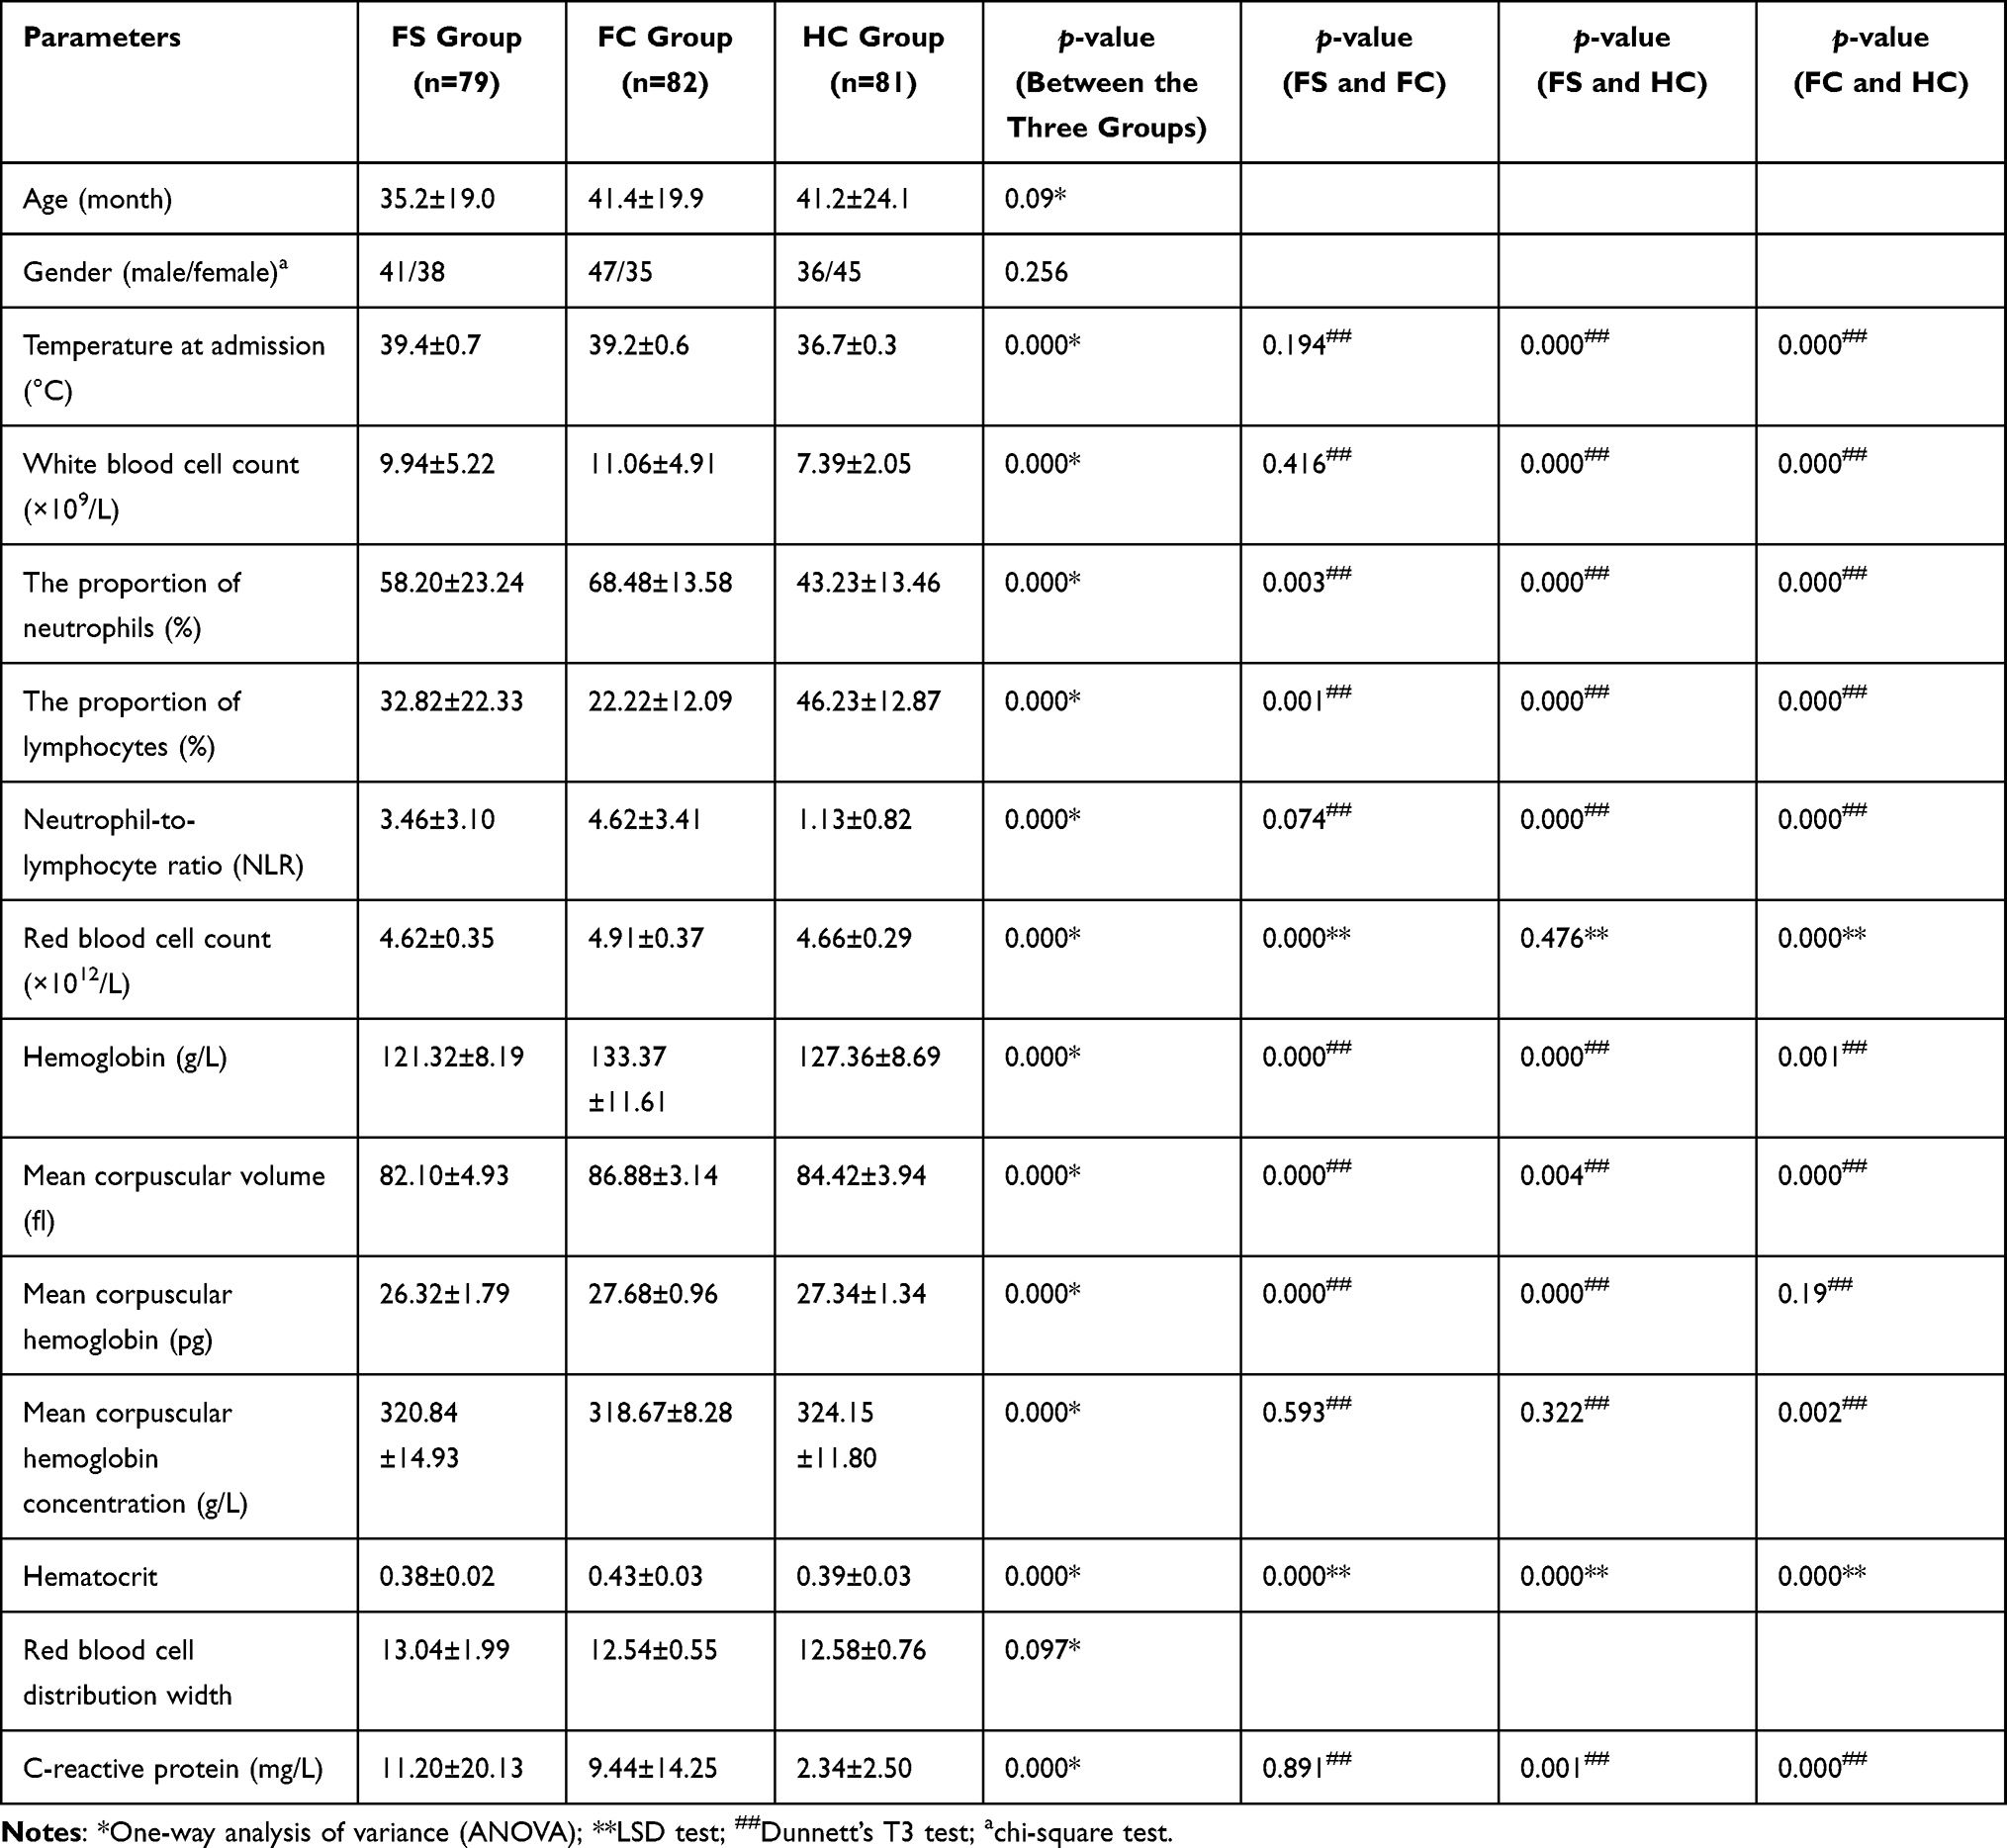 |
Table 2 Comparison of Other Peripheral Blood Cell Analyses Among the Three Groups |
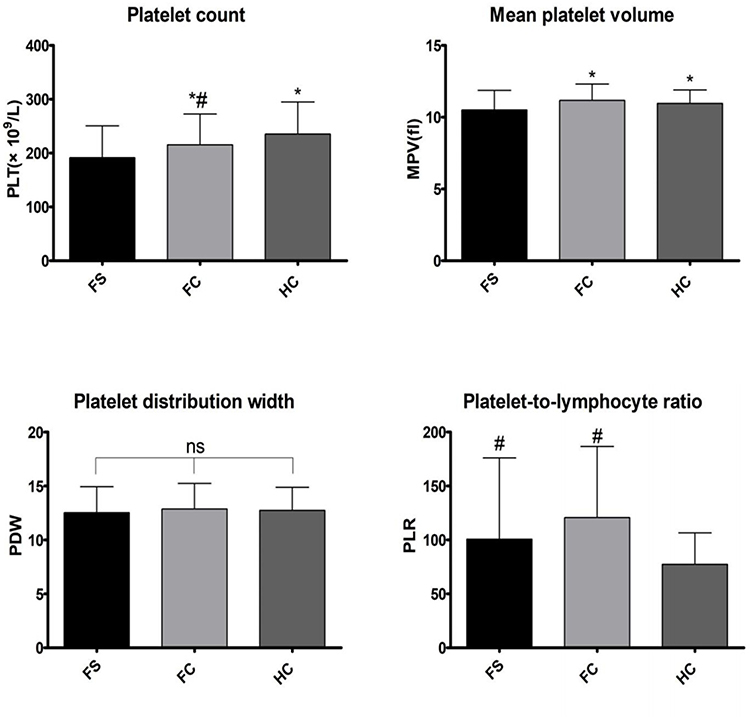 |
Figure 1 Comparison of platelet-related parameters (*Compared with FS group, P<0.05; #Compared with HC group, P<0.05; ns indicates no statistical significance). |
The Results of the Simple Febrile and Complex Febrile Seizures Groups
The PLT count of the CFS group was significantly lower compared with the SFS group (P < 0.05). The PDW of the CFS group was larger than in the SFS group (P < 0.05)(see Table 3 and Figure 2). There was no significant difference in other clinical data and laboratory results between the two groups (P > 0.05) (see Table 4).
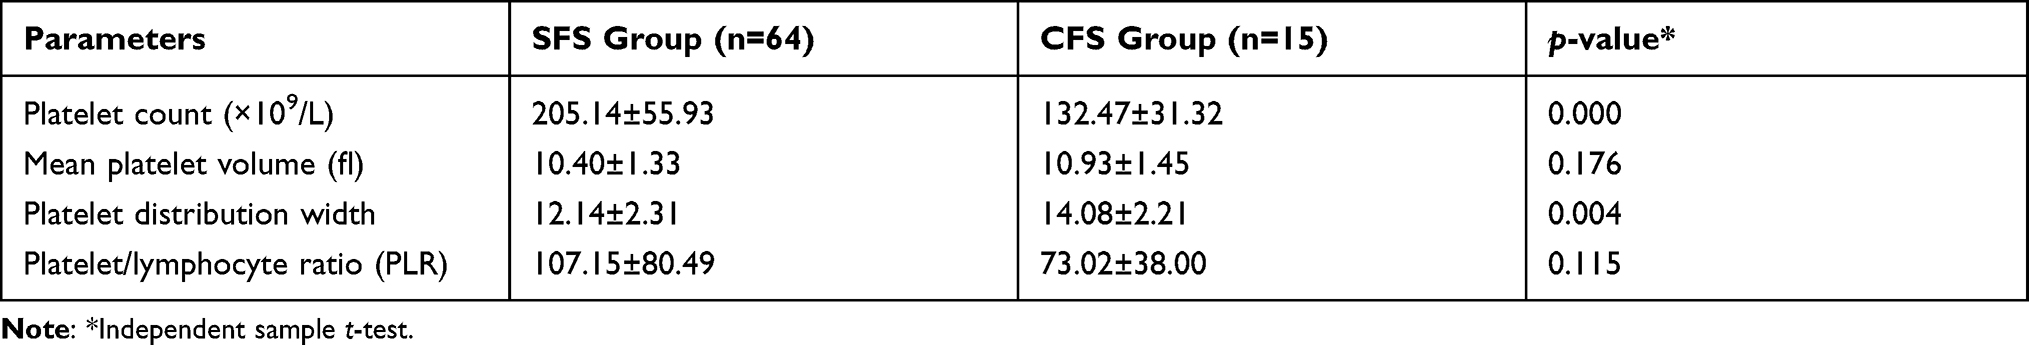 |
Table 3 Comparison of Platelet-Related Parameters Between SFS and CFS Groups |
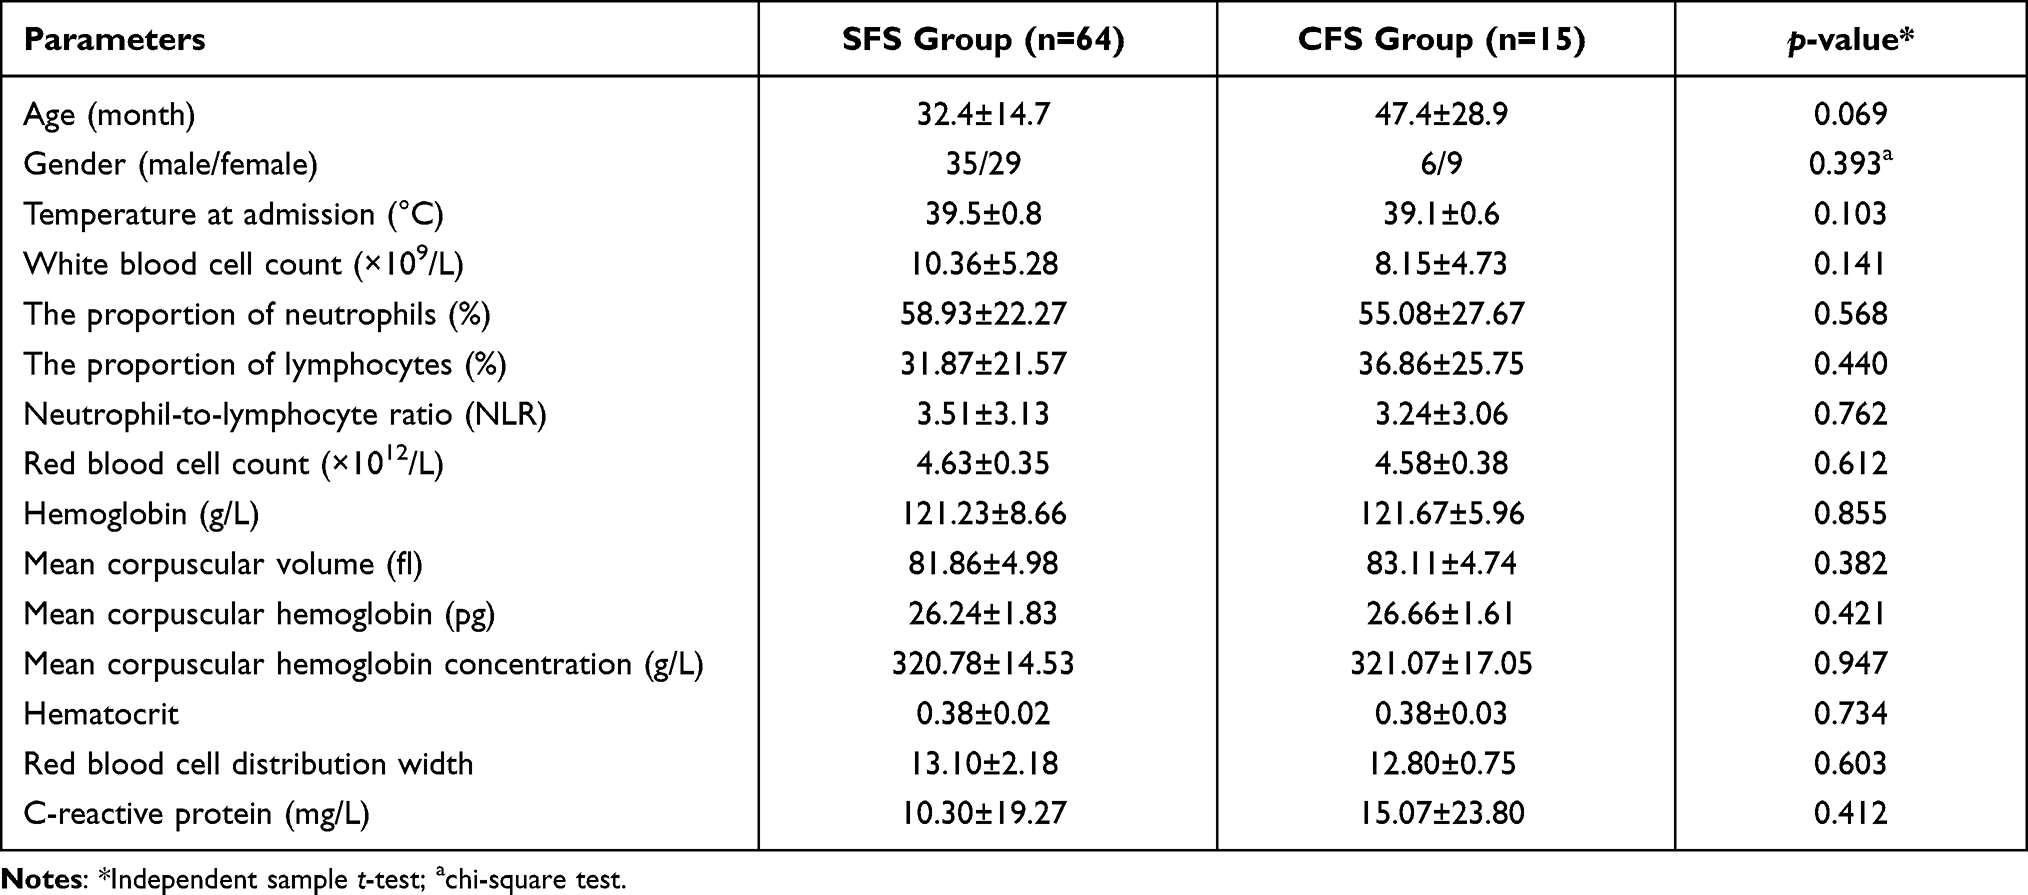 |
Table 4 Comparison of Other Peripheral Blood Cell Analysis Between SFS and CFS Groups |
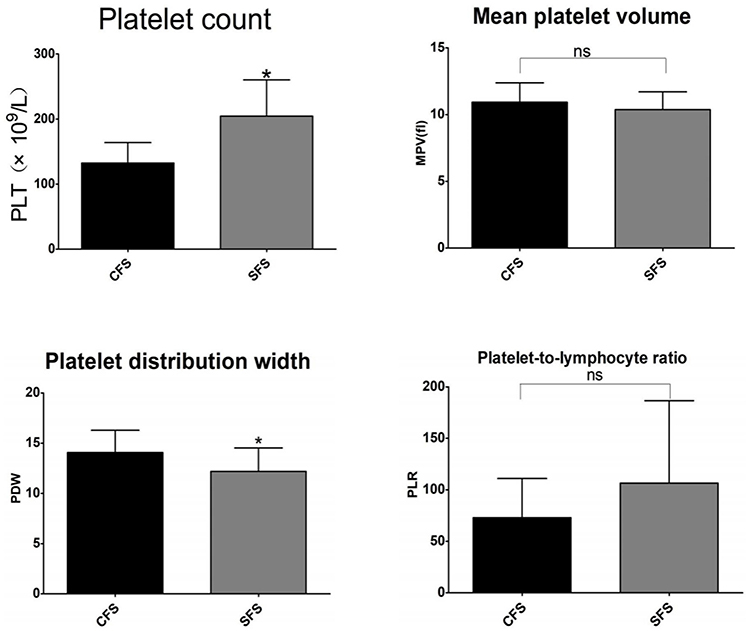 |
Figure 2 Comparison of platelet-related parameters between SFS and CFS groups (*Compared with CFS group, P<0.05; ns indicates no statistical significance). |
Results of the Comparison Between the Recurrent and Non-Recurrent Groups
All causes of FS were tracked up to December 2020; 28 children who had more than two recurrences of FS were included in the recurrent group. Recurrence occurred in 21 patients (32.81%) in the SFS group and 7 patients (46.67%) in the CFS group. There was no significant difference in recurrence rate between the two groups (χ2 = 1.019, P > 0.05). The recurrence rate of our study subjects was consistent with previous research data (30–50%).2 The PLT and PLR in the recurrence group were lower than in the non-recurrence group (P < 0.05) (see Table 5 and Figure 3); the red-blood-cell (RBC) count and hemoglobin in the recurrence group were lower than in the non-recurrence group (P < 0.05); there were no significant differences in other indicators (P > 0.05) (see Table 6).
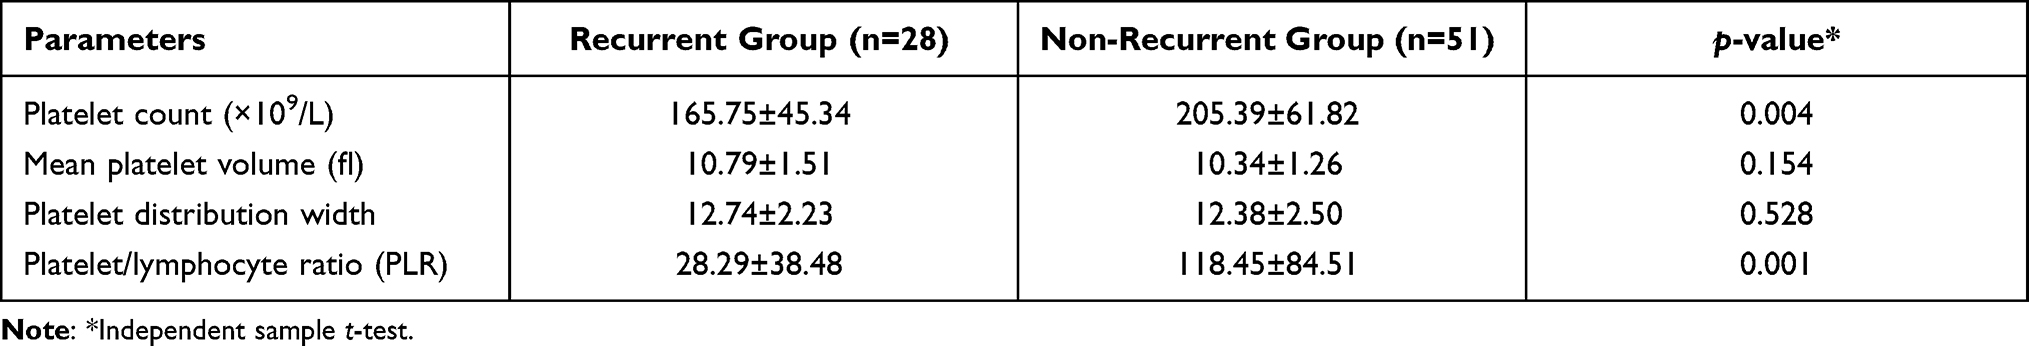 |
Table 5 Comparison of Platelet-Related Parameters Between the Recurrent and Non-Recurrent Groups |
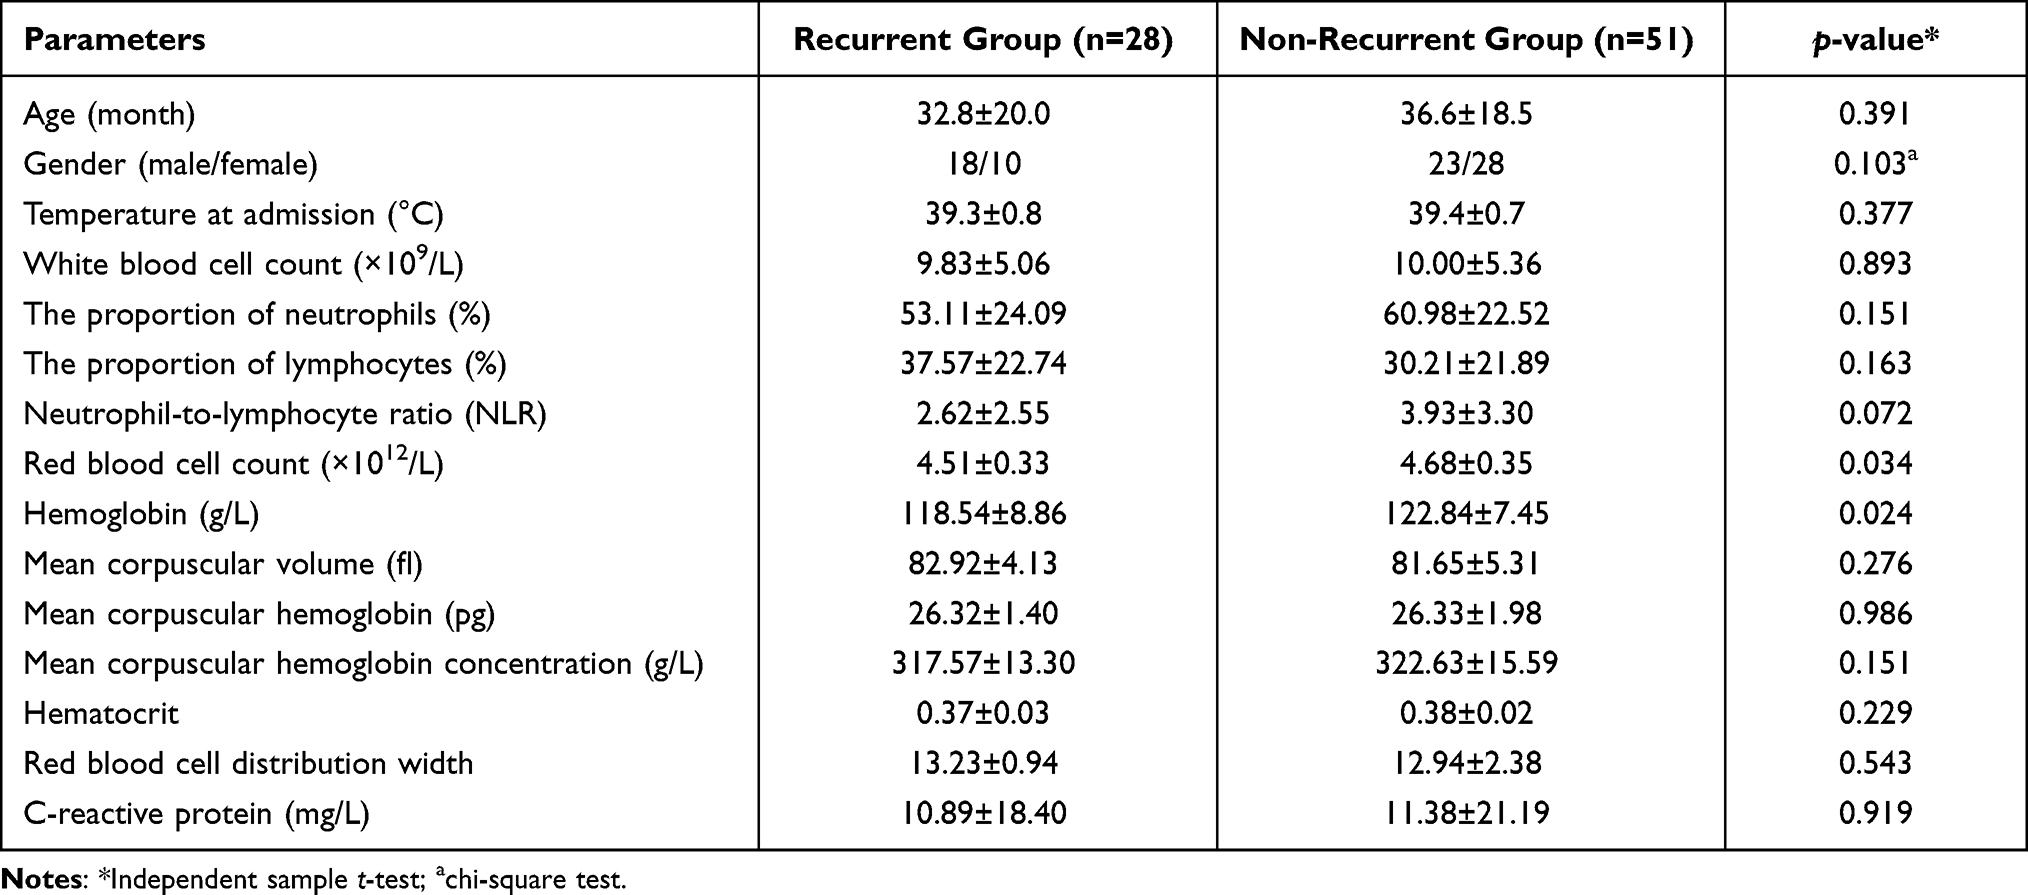 |
Table 6 Comparison of Other Peripheral Blood Cell Analysis Between the Recurrent and Non-Recurrent Groups |
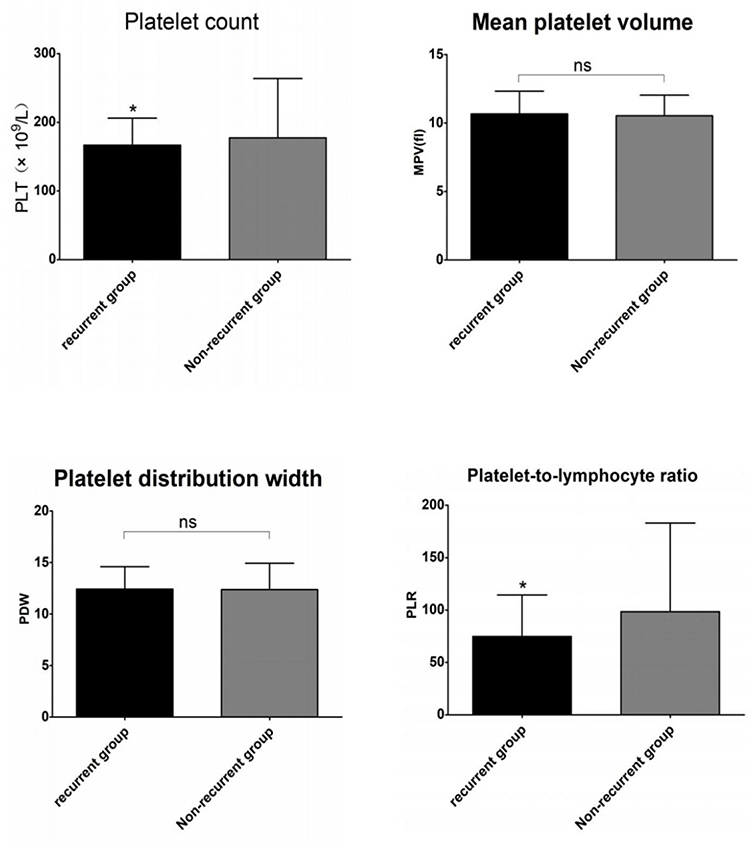 |
Figure 3 Comparison of platelet-related parameters between the recurrent and non-recurrent groups (*Compared with non-recurrent groups, P<0.05; ns indicates no statistical significance). |
Regression Analysis
Linear regression analysis showed that the MCH, PLT count, and MPV were closely linked to FSs. Subsequent binary logistic analysis revealed that the MPV was the most important protective factor associated with FSs in children included in this study (odds ratio [OR] = 0.435; 95% confidence interval [CI]: 0.316–0.600; P = 0.000)] (see Table 7).
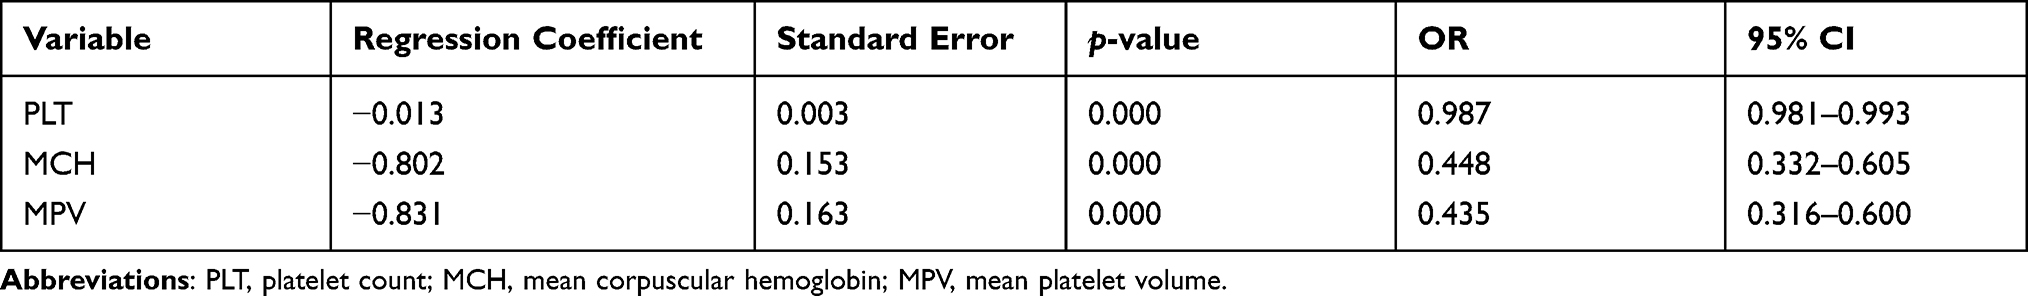 |
Table 7 Logistic Analysis of Risk Factors for Febrile Convulsion |
Discussion
At present, growing evidence suggests that there is an association between FSs and inflammation.13–15 Inflammation is the immune defense response that occurs when an organism is infected by external pathogenic microorganisms or stimulated by injury. This process involves many subtypes of immune system cells, including macrophages, neutrophils, lymphocytes, eosinophils, and monocytes. Immune system activation is significant in patients with FSs. During infection, immune cells, such as macrophages and lymphocytes, are stimulated to secrete pro-inflammatory cytokines, such as IL-1β, TNF-α, and IL-6.16–18
Complete blood cell analysis and CRP were detected in children with FSs, in children with a fever but with no seizure episodes of the same age (FC group), and in the HC group. The correlation between various indicators and the causes of FS were compared. The primary conclusions of this study are that the MCH, PLT count, and MPV had significant negative effects on the occurrence of FS. The MPV was the most important protective factor associated with FSs in children.
In this study, white blood cell (WBC) count, neutrophil ratio, NLR, PLR, and CRP in the FS and FC groups were significantly higher than those in the HC group. However, there was no statistical difference between the FS and FC groups. Similarly, Romanowska4 and Liu et al5 found no differences in WBC count between FS and FC groups. However, their data showed that the CRP level in the FS group was lower than in the FC group. The neutrophil ratio and count were also higher in the FS group compared with the FC group. Our different results may have been related to the sample detection time in the FS group. All the children in the FS group who were included in this study were hospitalized patients, and the sample testing time was between 30 minutes and 24 hours after a seizure (minimum 30 minutes, maximum 24 hours, median 87 minutes), and between 30 minutes and 24 hours after a fever (minimum 30 minutes, maximum 24 hours, median 105 minutes). The blood-sampling time of some patients was longer compared with those in Liu’s study group (within two hours after a seizure). However, Romanowska’s report did not provide the blood collection time for the FS group. WBC count, neutrophils, and CRP are all markers of an inflammatory response, among which CRP is an acute-phase protein released from hepatocytes under the stimulation of inflammatory mediators such as IL-6 and IL-8.19 Generally, IL-6 increases rapidly following an inflammatory response. PCT increases after two hours while CRP increases rapidly after six hours,20 and its rise to a peak is sometimes later than the appearance of clinical manifestations. We hypothesized that since a child’s body temperature rises rapidly to a peak during an FS, the inflammatory response will be shorter. The time of detection in Romanowska and Liu’s study was close to the time of onset, and WBC and CRP levels had not yet reached their peak. In febrile children without seizures, the sample testing time was between 30 minutes and three days after a fever (minimum 30 minutes, maximum three days, median 1.94 days). A longer inflammatory response resulted in a time increase in WBC and CRP, resulting in a lower CRP in the FS group in their study. These factors may be related to the inflammatory response caused by a fever but are not factors affecting the sensitivity of FSs. Differences in neutrophil and lymphocyte ratios between the FS and FC groups may have been related to different infectious pathogens. FSs are primarily the result of a virus,21 so there were more cases with increased lymphatic proportion.
Recent studies suggested that NLR and PLR are two new parameters that can be used to reflect infection and as markers of an inflammatory response, and as indicators of disease activity. Liu5 and Romanowska et al4 showed that NLR was significantly higher in children with FSs compared with a control group. However, when Liu used a receiver operating characteristic curve to analyze the diagnostic value of NLR, the results showed that the area under the curve was below 0.7 between the FS and the control group and between the SFS and CFS groups, indicating limited diagnostic value. In the present study, the NLR of the FS and FC groups was higher than the HC group, and there was no difference between the FS and FC groups. This difference may be related to the detection time of samples in the FS group and the primary disease of selected children in the FC group. The differences in the test conditions of relevant samples were previously analyzed. Kubota et al8 posited that there was no difference in NLR between SFS and CFS, which is consistent with the results in the current study. There was also no difference between the recurrent and non-recurrent groups in this study. Therefore, we believe that this is more indicative of the sensitivity of NLR as a test indicator in relation to the body’s inflammatory response and that the role of NLR in FS requires further investigation.
The PLR is the ratio of the PLT count divided by the absolute lymphocyte count as a potential indicator of inflammation. Like NLR, the PLR can also be used as an indicator for the differential diagnosis or prognostic prediction of various diseases. However, current studies have primarily focused on cancer and autoimmune diseases in this regard.22,23 Yu9 provided a preliminary note on the relationship between PLR and FSs, suggesting that the PLR levels in both SFS and CFS groups were higher than those in a febrile-without-seizures group. However, no differences were observed between the SFS and CFS groups, and no comparison was made with healthy children. In the present study, the PLR values of the FS and FC groups were significantly higher than those of the control group, reflecting the systemic inflammatory response in the active phase of the disease. The lack of significant differences between the FS and FC groups may have been due to similar reasons as those ascribed to NLR. Multi-center large-sample and multi-primary disease spectrum studies should be conducted to investigate this further. The PLR value showed no difference between the SFS and CFS groups, which was consistent with the study of Yu. However, we found significant differences in PLR values between the recurrent and the non-recurrent groups. The PLR values of the recurrent group were significantly lower than those of the non-recurrent group, which may have been related to the significantly lower PLT count of the recurrent group compared with the non-recurrent group. Therefore, low PLR levels may be responsible for an increased risk of FS.
In this study, PLT count and MPV in the FS group were significantly lower than in the FC and HC groups. There were significant differences in PLT count between the SFS and CFS groups and between the recurrent and non-recurrent groups. A 2017 study, published in Cell, highlighted platelets as the “mechanical scavengers” of the human body.24 In the presence of an infection, platelets secrete chemokines that act as inflammatory mediators and participate in the inflammatory response. At the inflammation or infection site, platelets actively search for invading bacteria and form platelet–bacterial aggregates that promote the activation of neutrophils, which can engulf the trapped bacteria. Therefore, the PLT count can also be used as an indicator for measuring the severity of infection.24
In our study, we found that although the PLT count of the FS group was essentially within the normal reference range, it was significantly lower compared with the control group,which was similar to the previous studies of some scholars.4,5 The lower the PLT count, the more likely the chances of complex and recurrent FS occurring. This may be related to infection leading to platelet activation and aggregation and releasing large amounts of inflammatory mediators. These factors may coexist during seizures, regardless of whether the causes of platelet activation are systemic inflammation, oxidative stress, or hypoxemia.25–27 The cascade reaction of platelet aggregation is triggered, leading to the release of its chemical mediators and endothelial damage and the release of a large number of inflammatory cytokines, such as IL-1 and IL-6.28,29 This activation may consume platelets, or macrophages may phagocytize more platelets, resulting in a decrease in peripheral blood PLT count. Many clinical studies have found a relationship between platelet activation and disease.29–32 Additionally, inhibiting platelet activation can improve the inflammatory response. Accordingly, we believe that PLT count is a sensitivity indicator in the diagnosis of FS and can be used to determine the onset of different types of FSs.
Mean platelet volume (MPV) reflects the size of platelets and the generation rate of platelets in bone marrow and is one of the indicators of platelet activation.33 MPV and PLT count are two major indicators for evaluating platelet activation and infection severity.34,35 A few studies have reviewed the relationship between MPV and FSs with inconsistent results. For example, according to research conducted by Liu et al, the FS group’s MPV was higher than a control group, and the MPV of an SFS group was higher than in a CFS group.5 Ozaydin also found that the MPV of an SFS group was higher than in a CFS group when comparing these two groups.36 However, Nikkhah et al found no differences between an SFS and a CFS group in their study.37 In the present study, the MPV of the FS group was lower than that of the FC and HC groups, but there was no difference between the SFS and CFS groups or between the recurrent and non-recurrent groups. Therefore, we hypothesized that the risk of FS may be related to platelet activation. Platelet count and MPV have been closely linked to the pathogenesis of FS. Platelet count may also be an actual predictor of different types of FSs, although the underlying mechanisms require additional study.
In this retrospective study, we also observed differences in PDW between the SFS and CFS groups. The PDW of the CFS group was significantly larger than in the SFS group, suggesting that PDW may be a simple and effective laboratory indicator for inducing different types of FS. PDW reflects the variation of platelet volume in the blood. The higher the PDW, the more heterogeneous the platelet volume will be. Current studies on PDW have included malignant tumors and cardiovascular, respiratory, and hematological diseases.38–41 Few studies of PDW in neurological disorders and no relevant studies were retrieved in patients with epilepsy and FSs. Because PDW changes are time-dependent, the difference in the time between blood sampling and sample analysis may yield different results. In addition, the intravascular use of different anticoagulants can also affect the platelet index.42 Therefore, to establish whether PDW can be used to determine the types of FS, many large samples and studies are needed in the future following the exclusion of selected influencing factors.
We also found that hemoglobin, MCV, MCH, and hematocrit in the FS group were significantly lower than in the FC and HC groups. Only the RBC count was lower in the FS group than in the FC group, and no difference was found between the FS and HC groups. Recent studies reported that iron deficiency might be a risk factor for FS, and iron deficiency anemia has also been linked to an increased risk of FS in children.43 Hemoglobin contains iron, which plays an important role in transporting oxygen to tissue such as those that make up the brain. Iron deficiency can reduce the metabolism of some neurotransmitters, which may alter the epilepsy threshold in children.44–46 This study showed no difference in the number of anemia cases among the groups, which was consistent with a study conducted in Korea in 2019.47 Anemia occurred in eight patients in both the FS and non-FS groups (8/79 in the FS group and 8/163 in the non-FS group; χ2 = 2.347, P > 0.05). The anemia diagnostic criteria herein refer to Pediatrics (9th ed.)48 as follows: <90 g/L (1–4 months), <100 g/L (4–6 months), Hb < 110 g/L, HCT < 0.33 (6–59 months); Hb < 115 g/L, HCT < 0.34 (5–11 years); Hb < 120 g/L, HCT < 0.36 (12–14 years). There was also no difference in the incidence of anemia between the SFS and CFS groups or between the recurrent and non-recurrent groups (χ2 was 0.527 and 2.848, respectively, P > 0.05). However, the hemoglobin, MCV, MCH, and hematocrit in the FS group were significantly lower than those in the FC and HC groups. Logistic analysis showed that mean erythrocyte hemoglobin volume had a significant negative correlation with the occurrence of FS and functioned as a protective factor for FS. Accordingly, we speculated that a child’s body might be in a period of reduced iron storage, but the iron for red blood cells to synthesize hemoglobin had not yet been reduced. Therefore, the amount of circulating hemoglobin was still normal and had not reached the period of iron deficiency anemia.
In conclusion, the PLT count and MPV are closely related to the incidence of FSs, and platelet and PDW might be two simple and effective laboratory markers to distinguish different types of FSs. Low PLR levels may be used to predict the risk of FS recurrence.
Ethics Approval and Consent to Participate
The study was conducted in accordance with the Declaration of Helsinki (as was revised in 2013). The study was approved by Ethics Committee of the Affiliated Wuxi No.2 People’s Hospital of Nanjing Medical University. This paper is a retrospective analysis of the previous test results, and we have obtained the written informed consent of the parents of the children when they underwent the previous blood routine and CRP test for blood collection.
Acknowledgments
We are particularly grateful to all the people who have given us help on our article.
Funding
There is no funding to report.
Disclosure
The authors declare that they have no competing interests.
References
1. Steering Committee on Quality Improvement and Management, Subcommittee on Febrile Seizures American Academy of Pediatrics. Febrile seizures: clinical practice guideline for the long-term management of the child with simple febrile seizures. Pediatrics. 2008;121(6):1281–1286. doi:10.1542/peds.2008-0939
2. Oluwabusi T, Sood SK. Update on the management of simple febrile seizures: emphasis on minimal intervention. Curr Opin Pediatr. 2012;24(2):259–265. doi:10.1097/MOP.0b013e3283506765
3. Capovilla G, Mastrangelo M, Romeo A, Vigevano F. Recommendations for the management of “febrile seizures”: Ad Hoc Task Force of LICE guidelines Commission. Epilepsia. 2009;50(Suppl 1):2–6. doi:10.1111/j.1528-1167.2008.01963.x
4. Gontko-Romanowska K, Żaba Z, Panieński P, et al. The assessment of laboratory parameters in children with fever and febrile seizures. Brain Behav. 2017;7(7):e00720. doi:10.1002/brb3.720
5. Liu Z, Li X, Zhang M, et al. The role of mean platelet volume/platelet count ratio and neutrophil to lymphocyte ratio on the risk of febrile seizure. Sci Rep. 2018;8(1):15123. doi:10.1038/s41598-018-33373-3
6. Goksugur SB, Kabakus N, Bekdas M, Demircioglu F. Neutrophil-to-lymphocyte ratio and red blood cell distribution width is a practical predictor for differentiation of febrile seizure types. Eur Rev Med Pharmacol Sci. 2014;18(22):3380–3385.
7. Yigit Y, Yilmaz S, Akdogan A, Halhalli HC, Ozbek AE, Gencer EG. The role of neutrophil-lymphocyte ratio and red blood cell distribution width in the classification of febrile seizures. Eur Rev Med Pharmacol Sci. 2017;21(3):554–559.
8. Kubota J, Hirano D, Suzuki T, Kakegawa D, Ito A. The role of inflammatory markers and calculated osmotic pressure in the classification of febrile seizures. Eur Rev Med Pharmacol Sci. 2020;24(21):11187–11191.
9. Yu J. Value of neutrophil/lymphocyte ratio in febrile convulsions in children. China Pract Med. 2016;11(13):64–65.
10. Liu YY, Li H. Detection of neutrophil-lymphocyte ratio and red blood cell volume distribution width in children with febrile convulsion and its clinical value. Hainan Med J. 2020;31(4):463–466.
11. Ponomarev ED. Fresh evidence for platelets as neuronal and innate immune cells: their role in the activation, differentiation, and deactivation of Th1, Th17, and Tregs during tissue inflammation. Front Immunol. 2018;9:406. doi:10.3389/fimmu.2018.00406
12. Subcommittee on Febrile Seizures; American Academy of Pediatrics. Neurodiagnostic evaluation of the child with a simple febrile seizure. Pediatrics. 2011;127(2):389–394. doi:10.1542/peds.2010-3318
13. Kwon A, Kwak BO, Kim K, et al. Cytokine levels in febrile seizure patients: a systematic review and meta-analysis. Seizure. 2018;59:5–10. doi:10.1016/j.seizure.2018.04.023
14. Virta M, Hurme M, Helminen M. Increased plasma levels of pro- and anti-inflammatory cytokines in patients with febrile seizures. Epilepsia. 2002;43(8):920–923. doi:10.1046/j.1528-1157.2002.02002.x
15. Chou IC, Lin WD, Wang CH, Tsai CH, Li TC, Tsai FJ. Interleukin (IL)-1beta, IL-1 receptor antagonist, IL-6, IL-8, IL-10, and tumor necrosis factor alpha gene polymorphisms in patients with febrile seizures. J Clin Lab Anal. 2010;24(3):154–159. doi:10.1002/jcla.20374
16. Yuhas Y, Shulman L, Weizman A, Kaminsky E, Vanichkin A, Ashkenazi S. Involvement of tumor necrosis factor alpha and interleukin-1beta in enhancement of pentylenetetrazole-induced seizures caused by Shigella dysenteriae. Infect Immun. 1999;67(3):1455–1460. doi:10.1128/IAI.67.3.1455-1460.1999
17. Watkins LR, Goehler LE, Relton J, Brewer MT, Maier SF. Mechanisms of tumor necrosis factor-alpha (TNF-alpha) hyperalgesia. Brain Res. 1995;692(1–2):244–250. doi:10.1016/0006-8993(95)00715-3
18. Muñoz-Fernández MA, Fresno M. The role of tumour necrosis factor, interleukin 6, interferon-gamma and inducible nitric oxide synthase in the development and pathology of the nervous system. Prog Neurobiol. 1998;56(3):307–340.
19. Gabay C, Kushner I. Acute-phase proteins and other systemic responses to inflammation [published correction appears in N Engl J Med 1999 Apr 29;340(17):1376]. N Engl J Med. 1999;340(6):448–454. doi:10.1056/NEJM199902113400607
20. Reinhart K, Meisner M, Brunkhorst FM. Markers for sepsis diagnosis: What is useful? Crit Care Clin. 2006;22(3):503–519. doi:10.1016/j.ccc.2006.03.003
21. Leung AK, Hon KL, Leung TN. Febrile seizures: an overview. Drugs Context. 2018;7:212536. doi:10.7573/dic.212536
22. Stojkovic Lalosevic M, Pavlovic Markovic A, Stankovic S, et al. Combined diagnostic efficacy of Neutrophil-to-Lymphocyte Ratio (NLR), Platelet-to-Lymphocyte Ratio (PLR), and Mean Platelet Volume (MPV) as biomarkers of systemic inflammation in the diagnosis of colorectal cancer. Dis Markers. 2019;2019:6036979. doi:10.1155/2019/6036979
23. Qin B, Ma N, Tang Q, et al. Neutrophil to lymphocyte ratio (NLR) and platelet to lymphocyte ratio (PLR) were useful markers in assessment of inflammatory response and disease activity in SLE patients. Mod Rheumatol. 2016;26(3):372–376. doi:10.3109/14397595.2015.1091136
24. Gaertner F, Ahmad Z, Rosenberger G, et al. Migrating platelets are mechano-scavengers that collect and bundle bacteria. Cell. 2017;171(6):1368–1382.e23. doi:10.1016/j.cell.2017.11.001
25. Wedzicha JA, Syndercombe-Court D, Tan KC. Increased platelet aggregate formation in patients with chronic airflow obstruction and hypoxaemia. Thorax. 1991;46(7):504–507. doi:10.1136/thx.46.7.504
26. Shen D, Wang Y. Effects of hypoxia on platelet activation in pilots. Aviat Space Environ Med. 1994;65(7):646–648.
27. Malerba M, Clini E, Malagola M, Avanzi GC. Platelet activation as a novel mechanism of atherothrombotic risk in chronic obstructive pulmonary disease. Expert Rev Hematol. 2013;6(4):475–483. doi:10.1586/17474086.2013.814835
28. Humbert M, Monti G, Brenot F, et al. Increased interleukin-1 and interleukin-6 serum concentrations in severe primary pulmonary hypertension. Am J Respir Crit Care Med. 1995;151(5):1628–1631. doi:10.1164/ajrccm.151.5.7735624
29. Jasiewicz M, Knapp M, Waszkiewicz E, et al. Enhanced IL-6 trans-signaling in pulmonary arterial hypertension and its potential role in disease-related systemic damage. Cytokine. 2015;76(2):187–192. doi:10.1016/j.cyto.2015.06.018
30. Rubenstein DA, Yin W. Platelet-activation mechanisms and vascular remodeling. Compr Physiol. 2018;8(3):1117–1156.
31. Haybar H, Khodadi E, Zibara K, Saki N. Platelet activation polymorphisms in ischemia. Cardiovasc Hematol Disord Drug Targets. 2018;18(2):153–161. doi:10.2174/1871529X18666180326121239
32. Suzuki-Inoue K. Platelets and cancer-associated thrombosis: focusing on the platelet activation receptor CLEC-2 and podoplanin. Blood. 2019;134(22):1912–1918. doi:10.1182/blood.2019001388
33. Merolla M, Nardi MA, Hu L, et al. platelet size is an excellent surrogate for increased platelet activity. J Am Coll Cardiol. 2011;57(14):E1600–E1600. doi:10.1016/S0735-1097(11)61600-8
34. Kamath S, Blann AD, Lip GY. Platelet activation: assessment and quantification. Eur Heart J. 2001;22(17):1561–1571. doi:10.1053/euhj.2000.2515
35. Gasparyan AY, Ayvazyan L, Mikhailidis DP, Kitas GD. Mean platelet volume: a link between thrombosis and inflammation? Curr Pharm Des. 2011;17(1):47–58. doi:10.2174/138161211795049804
36. Ozaydin E, Arhan E, Cetinkaya B, et al. Differences in iron deficiency anemia and mean platelet volume between children with simple and complex febrile seizures. Seizure. 2012;21(3):211–214. doi:10.1016/j.seizure.2011.12.014
37. Nikkhah A, Salehiomran MR, Asefi SS. Differences in mean platelet volume and platelet count between children with simple and complex febrile seizures. Iran J Child Neurol. 2017;11(2):44–47.
38. Siddeek RAT, Gupta A, Gupta S, et al. Evaluation of platelet distribution width as novel biomarker in gall bladder cancer. J Carcinog. 2020;19(1):5. doi:10.4103/jcar.JCar_12_20
39. Hlapčić I, Somborac-Bačura A, Popović-Grle S, et al. Platelet indices in stable chronic obstructive pulmonary disease - association with inflammatory markers, comorbidities and therapy. Biochem Med. 2020;30(1):010701. doi:10.11613/BM.2020.010701
40. Yu J, Wang L, Peng Y, et al. Dynamic monitoring of Erythrocyte Distribution Width (RDW) and Platelet Distribution Width (PDW) in treatment of acute myocardial infarction. Med Sci Monit. 2017;23:5899–5906. doi:10.12659/MSM.904916
41. Zhang JQ, Hou XH, Hong Q, et al. Diagnostic value of MPV, PDW, PAIg and their combination for Megakaryocyte dysmaturity in children with acute immune thrombocytopenic purpura. Zhongguo Shi Yan Xue Ye Xue Za Zhi. 2019;27(6):1949–1954.
42. Vagdatli E, Gounari E, Lazaridou E, Katsibourlia E, Tsikopoulou F, Labrianou I. Platelet distribution width: a simple, practical and specific marker of activation of coagulation. Hippokratia. 2010;14(1):28–32.
43. Aziz KT, Ahmed N, Nagi AG. Iron deficiency anaemia as risk factor for simple febrile seizures: a Case control study. J Ayub Med Coll Abbottabad. 2017;29(2):316–319.
44. Lozoff B, Beard J, Connor J, Barbara F, Georgieff M, Schallert T. Long-lasting neural and behavioral effects of iron deficiency in infancy. Nutr Rev. 2006;64(5 Pt 2):S34–S91.
45. Beard J. Iron deficiency alters brain development and functioning. J Nutr. 2003;133(5Suppl 1):1468S–1472S. doi:10.1093/jn/133.5.1468S
46. Batra J, Seth PK. Effect of iron deficiency on developing rat brain. Indian J Clin Biochem. 2002;17(2):108–114. doi:10.1007/BF02867982
47. Jang HN, Yoon HS, Lee EH. Prospective case control study of iron deficiency and the risk of febrile seizures in children in South Korea. BMC Pediatr. 2019;19(1):309. doi:10.1186/s12887-019-1675-4
48. Wang WP, Sun K, Chang LW. Pediatrics.
 © 2021 The Author(s). This work is published and licensed by Dove Medical Press Limited. The
full terms of this license are available at https://www.dovepress.com/terms
and incorporate the Creative Commons Attribution
- Non Commercial (unported, 3.0) License.
By accessing the work you hereby accept the Terms. Non-commercial uses of the work are permitted
without any further permission from Dove Medical Press Limited, provided the work is properly
attributed. For permission for commercial use of this work, please see paragraphs 4.2 and 5 of our Terms.
© 2021 The Author(s). This work is published and licensed by Dove Medical Press Limited. The
full terms of this license are available at https://www.dovepress.com/terms
and incorporate the Creative Commons Attribution
- Non Commercial (unported, 3.0) License.
By accessing the work you hereby accept the Terms. Non-commercial uses of the work are permitted
without any further permission from Dove Medical Press Limited, provided the work is properly
attributed. For permission for commercial use of this work, please see paragraphs 4.2 and 5 of our Terms.