")
Back to Journals » International Journal of General Medicine » Volume 17
The Potential of FOXP3 in Predicting Survival and Treatment Response in Breast Cancer
Authors Liu L , Xiao W, Zhang C, Fan P, Zeng J, Yi J
Received 11 December 2023
Accepted for publication 25 March 2024
Published 28 March 2024 Volume 2024:17 Pages 1233—1251
DOI https://doi.org/10.2147/IJGM.S454421
Checked for plagiarism Yes
Review by Single anonymous peer review
Peer reviewer comments 2
Editor who approved publication: Dr Scott Fraser
Luyao Liu,1 Wang Xiao,2 Chaojie Zhang,1 Peizhi Fan,1 Jie Zeng,1 Jianing Yi1
1Department of Breast and Thyroid Surgery, Hunan Provincial People’s Hospital, The First Affiliated Hospital of Hunan Normal University, Changsha, People’s Republic of China; 2Department of General Surgery, The Second Xiangya Hospital, Central South University, Changsha, People’s Republic of China
Correspondence: Jianing Yi; Jie Zeng, Department of Breast and Thyroid Surgery, Hunan Provincial People’s Hospital, The First Affiliated Hospital of Hunan Normal University, 61 Jiefang West Road, Changsha, Hunan, 410005, People’s Republic of China, Tel +8613007436234 ; +8613974837749, Email [email protected]; [email protected]
Background: Breast cancer (BC) continues to pose a substantial challenge to global health, necessitating an enhanced understanding of its fundamental mechanisms. Among its various pathological classifications, breast invasive carcinoma (BRCA) is the most prevalent. The role of the transcription factor forkhead box P3 (FOXP3), associated with regulatory T cells, in BRCA’s diagnosis and prognosis remains insufficiently explored, despite its recognized importance.
Methods: We examined the mRNA expression profile of FOXP3 in BRCA patients, assessing its correlation with disease detection, patient survival, immune checkpoint alterations, and response to anticancer drugs.
Results: Our analysis revealed significantly elevated FOXP3 mRNA levels in BRCA patients, with a 95.7% accuracy for BRCA detection based on the area under the curve. High FOXP3 mRNA levels were positively correlated with overall survival and showed significant associations with CTLA4, CD274, PDCD1, TMB, and immune cell infiltration status. Furthermore, FOXP3 mRNA expression was linked to the efficacy of anticancer drugs and the tumor inflammation signature.
Discussion: These findings suggest that FOXP3 serves as a promising biomarker for BRCA, offering valuable insights into its diagnosis and prognosis. The correlation between FOXP3 expression and immune checkpoint alterations, along with its predictive value for treatment response, underscores its potential in guiding therapeutic strategies.
Conclusion: FOXP3 stands out as an influential factor in BRCA, highlighting its diagnostic accuracy and prognostic value. Its association with immune responses and treatment efficacy opens new avenues for research and clinical applications, positioning FOXP3 as a vital target for further investigation in BRCA management.
Keywords: breast cancer, FOXP3, regulatory T cells, immune checkpoint alterations, anticancer drugs response, immune cell infiltration
Introduction
BRCA burden is rising rapidly and varies widely from country to country. The incidence and mortality of BRCA in China and South Korea have increased rapidly, whereas those in the United States have declined.1 In 2020, new cases of BRCA exceeded cases of lung malignancy (2.2 million), reaching 2.26 million and making it the most prevalent cancer in the world.2
Implementing strategies such as improving healthcare access, increasing health awareness, and employing efficient prevention measures are critical in containing the escalating burden of BRCA. In recent years, BRCA treatment has made great progress through the unremitting efforts of medical and pharmaceutical researchers.3,4 However, the pathogenesis of BRCA, especially metastatic BRCA, still needs to be unraveled, and the lack of biomarkers for efficient treatment and diagnosis must be addressed.5,6
The tumor microenvironment (TME) is an intricate system, consisting of stromal, immune, and cancer cells. It has a critical function in the onset and advancement of tumors. Cells linked with the immune system can impact the progression of tumors by altering the TME. Regulatory T cells (Treg cells), which are suppressive cells tied to the immune system, are minimally present in healthy individuals, primarily to prevent the overactivity of immune cells leading to autoimmune diseases. Studies have shown an inverse relationship between the count of Treg cells and tumor prognosis. Their existence is favorable to the expansion, proliferation, encroachment, and metastasis of tumor cells.7
FOXP3, a transcription factor specifically associated with CD4+ CD25+ Treg cells, participates in Treg cell differentiation. FOXP3 controls the regulation of gene transcription related to cancer occurrence, invasion, metastasis, differentiation, and angiogenesis.8–11 Beyond its direct implications, the expression of FOXP3 is regulated by tumor suppressor genes and epigenetic mechanisms. Epigenetics refers to a mechanism that regulates gene expression by altering chromatin structure without changing the DNA sequence, and has garnered significant interest for its potential role in modulating FOXP3 expression.12 Consequently, a strong link between FOXP3 and BRCA exists. Research has also detected increased levels of FOXP3 and other regulatory T cell-related molecules in BRCA tissues compared to normal tissues, which are linked to BRCA patients’ prognoses.13,14 Merlo et al reported that about 53% of 187 BRCA subjects expressed FOXP3, and suggested that FOXP3 could be used as a predictor of poor prognosis in BRCA.15 Understanding the diverse cis-regulatory elements at the FOXP3 locus and how they undergo epigenetic modifications across different CD4+ T cell subsets is crucial. This not only enhances our comprehension of Treg cell biology but also offers hope for therapeutic interventions exploiting the suppressive capabilities of Tregs.7,16 Therefore, the goal of this study was to scrutinize the mutation and expression of FOXP3 in subjects with BRCA, utilizing the gene expression or alteration data accessible online. This is to ascertain the prognostic and diagnostic significance of FOXP3 in BRCA.
Materials and Methods
Utilization of Tumour Immune Estimation Resource (TIMER) Database
The TIMER2 v2.0 database (http://timer.cistrome.org/)17 was harnessed to explore the expression pattern of FOXP3 in tumor tissues and their neighboring normal tissues. The correlation between the infiltration status of immune cells and the expression of FOXP3 was also analyzed.
Acquisition of Ribonucleic Acid (RNA)-Sequencing (Seq) Data of FOXP3 in Human BRCA
We procured expression data related to 1226 tumor tissues and 113 adjacent non-tumor tissues from The Cancer Genome Atlas (TCGA) (https://portal.gdc.cancer.gov/), focusing on the RNA-Seq data of FOXP3 in BRCA. The selected samples encompassed mRNA data of FOXP3 and relevant clinical details, such as T stage, progesterone receptor (PR) status.
Immunohistochemistry (IHC)
A total of 10 samples of paraffin-embedded of BRCA patients who received surgical intervention were provided by Hunan Provincial People’s Hospital/The First Affiliated Hospital of Hunan Normal University. Tumor and adjacent non-tumor tissue samples were prepared into paraffin sections (4µm) and incubated at 4°C overnight with primary rabbit monoclonal antibodies targeting FOXP3 at a dilution ratio of 1:200 (Santa Cruz Biotechnology, Santa Cruz, USA). Following this, sections were introduced to horseradish peroxidase-conjugated goat anti-rabbit antibody (1:400, Abcam, USA) for a period of 60 minutes at ambient temperature. Subsequently, the sections were stained with the 3,3-diaminobenzidine reagent, followed by a mild counterstain application with hematoxylin.
The Kaplan–Meier Plotter Analysis
The prognostic implications of FOXP3 gene expression in patients with breast cancer (BRCA) were evaluated utilizing the Kaplan-Meier plotter (www.kmplot.com).18,19 We examined survival outcomes for patients, encompassing progression-free survival (PFS), post-progression survival (PPS), distant metastasis-free survival (DMFS), and overall survival (OS). Patients were stratified into two groups based on FOXP3 expression data: those with high expression and those with low expression.
Nomogram Construction for BRCA Survival Prediction
A nomogram was established using clinicopathological prognostic indices to predict the 1-, 3-, and 5-year overall survival (OS) probabilities of BRCA patients. The accuracy of the nomogram’s predicted OS probabilities was evaluated against the observed actual probabilities using a calibration curve.
Alterations in FOXP3 Genetics and Immune Checkpoints in Patients with BRCA
FOXP3 and immune checkpoint expression levels were analyzed using the cBioPortal (www.cbioportal.org) with a breast-invasive carcinoma dataset.18,19 The Cancer Genome Atlas (TCGA)-related tumor data, including gene amplification, missense mutations, truncating mutations, and deep deletions, were extracted for BRCA. The “Mutations” module in cBioPortal provided information on the mutated sites of FOXP3, displayed as either a 3D structure or a schematic representation of the protein’s structure.
STRINGS Analysis
The STRING database (www.string-db.org), an online platform for protein-protein interaction (PPI) analysis, was utilized in this study to examine the potential role of FOXP3 in breast cancer.20 By investigating the PPI network associated with FOXP3, we aimed to gain insights into its functional implications in BRCA.
GeneMANIA Analysis Implementation
GeneMANIA (www.genemania.org), an internet-based tool devised for gene function examination,21 was utilized in this study. We employed GeneMANIA to discern the top 50 genes having the most significant interactions with FOXP3. This data was subsequently used to establish a gene-gene interaction (GGI) network, which further elucidated the functional correlations of FOXP3 in the context of breast cancer.
Chemical-Gene Interaction
To explore the chemical-gene interactions involving FOXP3, we used the Comparative Toxicogenomics Database (CTD). By constructing an interaction network between FOXP3 and various chemicals, we sought to identify specific chemicals that could potentially modulate FOXP3 gene expression levels, either by increasing or decreasing its expression.
Utilization of Receiver Operating Characteristic (ROC) Plotter for Evaluating Drug Sensitivity
To gauge the effect of FOXP3 expression on possible treatment options with anticancer drugs, we made use of the ROC plotter (http://www.rocplot.org/). This open-access database holds transcriptomic information that assists in predicting drug responses and validating biomarkers. Analyses were performed on samples demonstrating both a pathological complete response and a pathological response to FOXP3.
Analysis of Functional Enrichment
The 50 most relevant genes discerned from GeneMANIA were subjected to additional analysis to ascertain their positive or negative correlation with FOXP3. Classification of these genes was achieved through Gene Ontology (GO) enrichment analysis, based on cellular components, biological processes, and molecular functions. The R package ggplot2 was utilized to execute the Kyoto Encyclopedia of Genes and Genomes (KEGG) pathway analysis. Moreover, using the R package with method=“ssGSEA” as the parameter, gene set variation analysis was performed. The connection between pathway scores and specific genes was ascertained using Spearman correlation.
Statistical Analyses
The data were statistically analyzed utilizing R software (www.r-project.org). Visualization of clinical and gene expression data was achieved using the ggplot2 package in R.22 To establish the cut-off values for FOXP3, BRCA1, BRCA2, and ERBB2, ROC curve analysis was deployed. Furthermore, the interrelation between 24 immune cells was ascertained using Spearman correlation, and this was represented as a lollipop chart.23,24 In instances where quantitative variables did not follow a normal distribution, Spearman correlation analysis was employed. A p-value of less than 0.05 was deemed to carry statistical significance.
Results
Analysis of Gene Expression Data
We examined the levels of FOXP3 expression in different cancer types from TCGA utilizing TIMER2. The findings indicated a surge in FOXP3 transcription within BRCA (Figure 1A). A summary of the relationship between FOXP3 expression and clinical characteristics in BRCA patients is presented in Table 1. When comparing FOXP3 expression in BRCA tissues (n = 1093) and neighboring normal tissues (n = 112), a significantly elevated level was observed in BRCA tissues, as revealed by unpaired data analysis (Figure 1B). However, BRCA patients with T4 stage showed lower FOXP3 expression than those with T1/T2 stage (p-adjusted <0.05) (Figure 1C). Estrogen receptor (ER) or PR positive values were associated with lower FOXP3 expression, while negative values demonstrated the opposite trend (p-adjusted <0.001) (Figure 1D and E). Interestingly, Basal and HER2 subtypes displayed higher FOXP3 expression levels compared to Luminal A/B subtypes (p-adjusted <0.01) (Figure 1F).
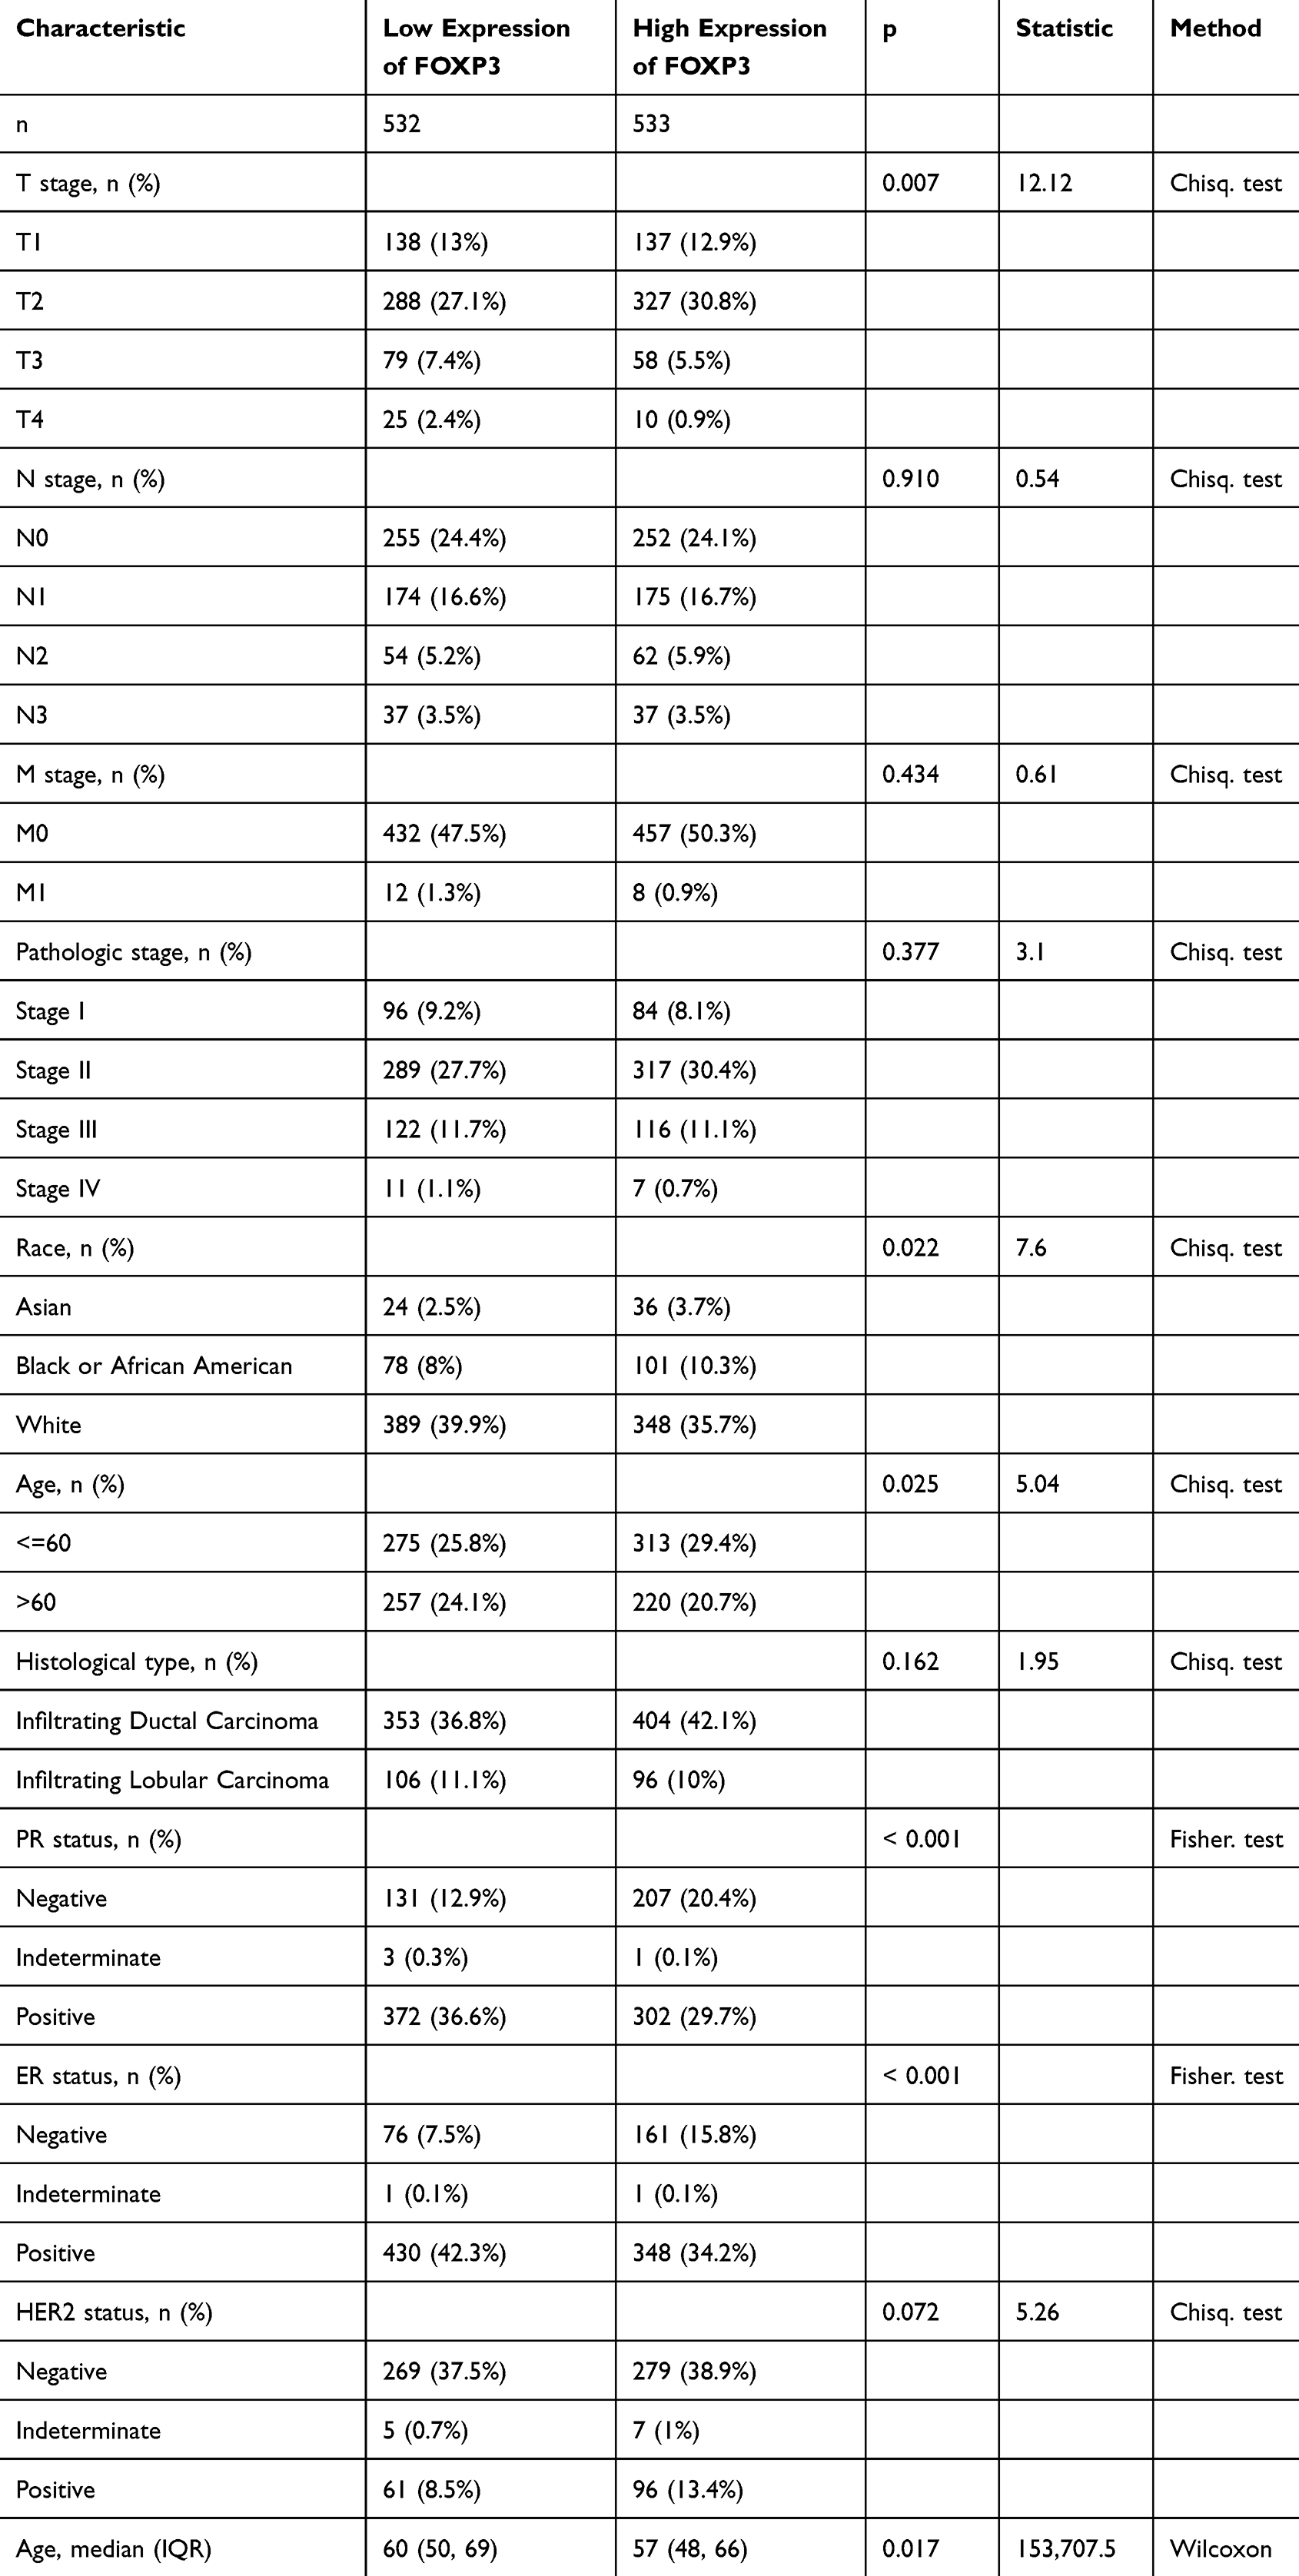 |
Table 1 Correlation Between FOXP3 Expression and the Clinicopathological Features of the BRCA Cases |
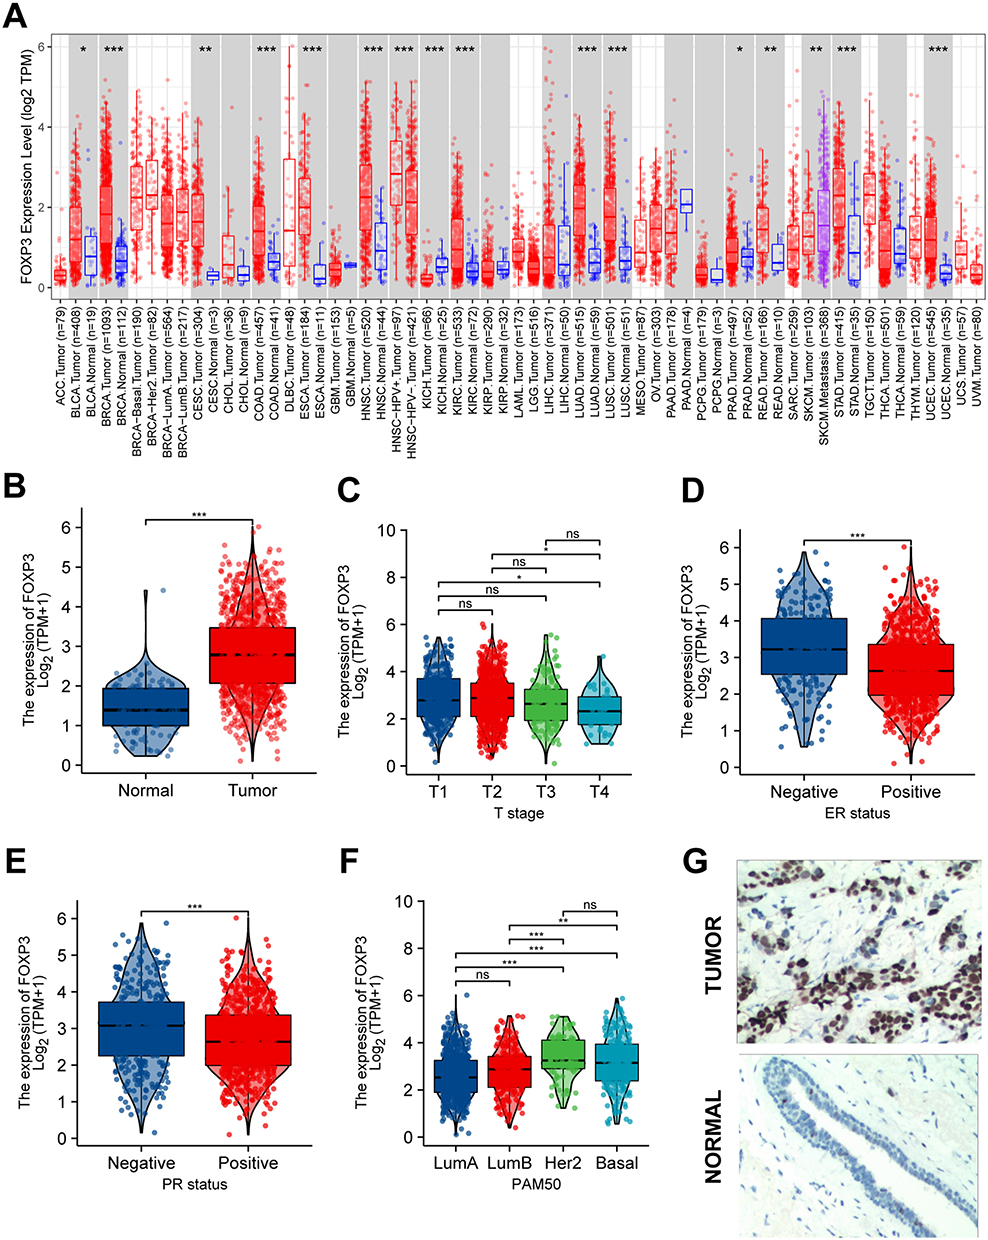 |
Figure 1 FOXP3 Expression Levels, Clinical Characteristics and Immunohistochemistry. (A) The transcription levels of FOXP3 in different types of cancers (TIME). (B) The mRNA expression levels of FOXP3 BRCA and normal samples from TCGA. (C) FOXP3 mRNA expression was significantly lower in BRCA patients with T4 than BRCA patients with T1/T2. (D and E) Compared with that in BRCA patients with ER or PR negative, FOXP3 mRNA expression was significantly lower in BRCA patients with ER or PR positive. (F) The expression level of FOXP3 is significantly higher in Basal, Her2 than in LumA/B. (G) The Expression of FOXP3 in BRCA (IHC). (ns, no significance, *P < 0.05, **P < 0.01, ***P < 0.001). |
IHC was utilized to probe the expression of FOXP3 protein in BRCA tissues and their corresponding adjacent normal tissues. The findings suggested an escalation in FOXP3 protein levels within BRCA tissues when juxtaposed with adjacent normal tissues (Figure 1G).
FOXP3 Kaplan-Meier Survival Analysis
The correlation between FOXP3 mRNA expression and survival rates in BRCA patients was evaluated using Kaplan-Meier plots (Figure 2A). It was found that an elevation in FOXP3 mRNA expression significantly corresponded to better OS in patients with breast cancer. Nonetheless, no significant correlation was discerned between FOXP3 mRNA expression and DMFS. In the context of BRCA patients, an augmented expression of FOXP3 was linked to extended recurrence-free survival (RFS), while a diminished expression of the gene was associated with PPS.
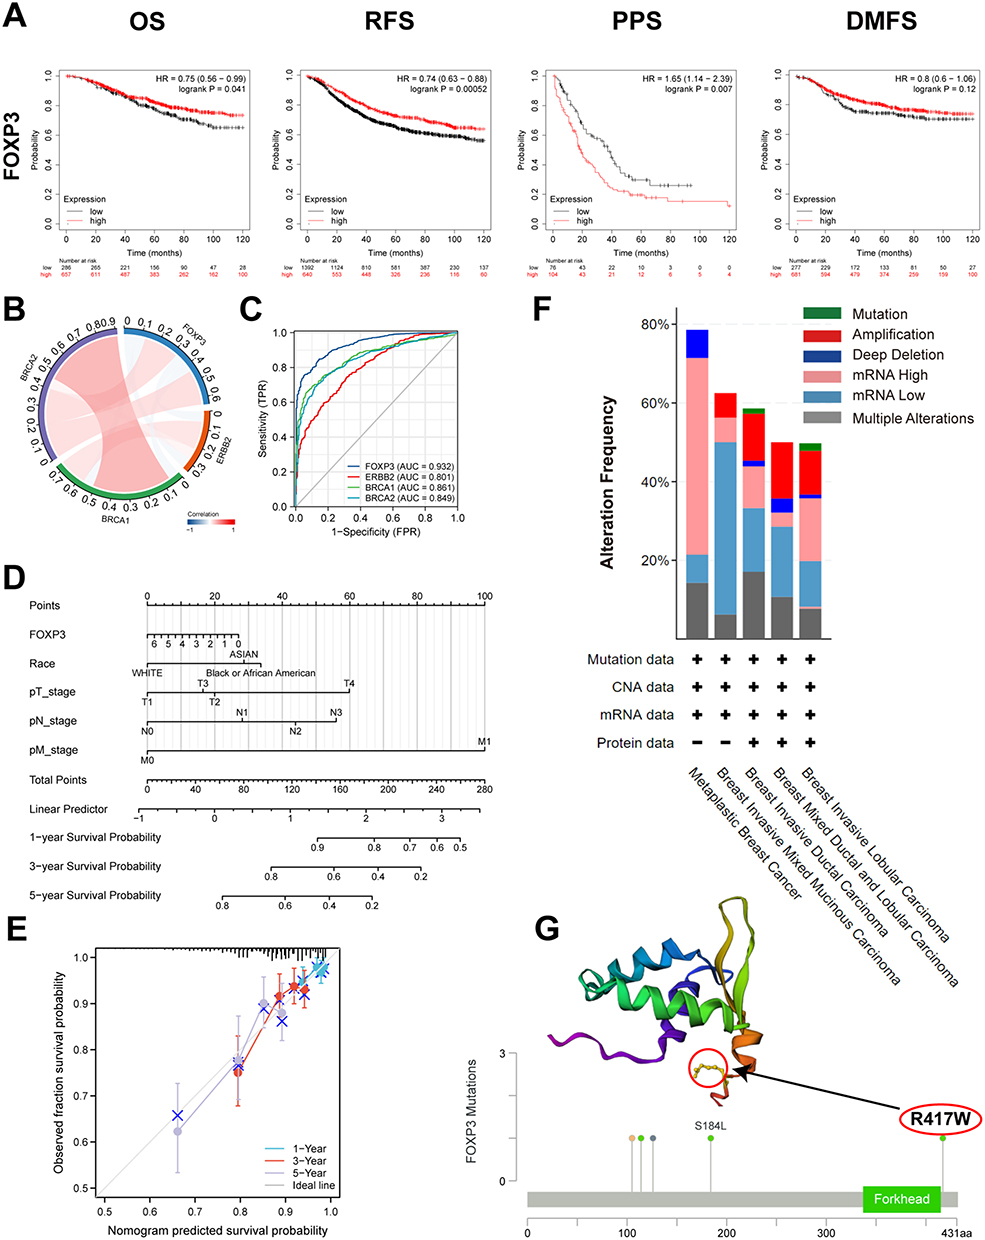 |
Figure 2 FOXP3 Prognostic Value, Relevance of FOXP3 and Important Genes, Diagnostic Value, Mutation Analysis and Prognostic Model in BRCA. (A) overall survival (OS), progression-free survival (PFS), post-progression survival (PPS) and distant metastasis-free survival (DMFS). (B) Correction between different FOXP3 and Important Genes. (C) ROC curve analysis was performed to evaluate the diagnostic power of the FOXP3 and Important Genes. (D) Nomogram for predicting the 1-, 3-, and 5-year overall survival rates. (E) Calibration for nomogram. (F) Summary of alterations in different expressed FOXP3 in BRCA. (G) mutation site (R417W) in the 3D structure of FOXP3 are displayed. |
Co-Expression of FOXP3
The TCGA-BRCA cohort was employed to scrutinize the potential correlation and mutual exclusivity among FOXP3 genes. The analysis unveiled significant co-expression associations between FOXP3 and ERBB2/BRCA2, ERBB2 and BRCA1/BRCA2, and BRCA1 and BRCA2 (p < 0.05). Conversely, the data did not demonstrate a significant co-expression relationship between FOXP3 and BRCA1 (p > 0.05) (Figure 2B).
FOXP3 as a Prospective Biomarker
An analysis of the ROC curve was conducted to evaluate the potential of FOXP3 to differentiate between normal samples and breast-invasive malignant samples, juxtaposing it with control markers BRCA2, BRCA1, and ERBB2. The resulting data revealed the following values: BRCA1 (AUC: 0.861, Accuracy: 0.973), ERBB2 (AUC: 0.801, Accuracy: 0.900), BRCA2 (AUC: 0.849, Accuracy: 0.957), and FOXP3 (AUC: 0.932, Accuracy: 0.957) (Figure 2C). This suggests that FOXP3 may function as a reliable biomarker to distinguish between normal and breast-invasive cancerous tissues.
FOXP3 in Prognostic Modeling
A nomogram, derived from the data gathered via Cox regression analysis, was constructed utilizing the “Regression modeling strategies” package in R software to evaluate the prognosis of subjects with BRCA. The model integrated five variables related to prognosis, which included FOXP3 expression, race, along with the T, N, and M stages. The aggregate of individual points assigned to these variables was considered as the total points. The probability of survival over 1, 3, and 5 years for BRCA subjects was calculated by drawing a direct line from the “total points” axis to the “outcome” axis. The prediction outcomes of the OS nomogram-related calibration curve were consistent with the observed results for all subjects (Figure 2D and E).
Genetic Alteration of FOXP3 and Immune Checkpoint
To analyze the extent of FOXP3 mutations in breast invasive carcinoma, we investigated the genome and copy number variations. We analyzed the FOXP3 gene-related OncoPrint map of BRCA subjects in the TCGA dataset (Figure 2F). The FOXP3 domain was examined to identify genomic alterations and their locations. In a single BRCA subject, the R417W alteration was observed within the domain and further analyzed by visualizing its impact on the 3D structure of the FOXP3 protein (Figure 2G). Genomic-level investigation suggested that immune checkpoint alterations could be influenced by FOXP3 in breast invasive carcinoma. A comprehensive visualization of the FOXP3 genomic landscape and immune checkpoint alterations in breast invasive carcinoma was conducted, encompassing amplification, mRNA expression, structural variants, truncations, deep deletions, missense, and splice mutations (Figure 3A). Representative immune checkpoints associated with FOXP3 were analyzed separately in greater detail (Table 2). Utilizing a two-gene correlation map, it was found that FOXP3 exhibited strong positive correlations with CD274, PDCD1, and CTLA4 (Figure 3B). The resulting data supports the role of FOXP3 as an immune checkpoint co-regulator in BRCA.
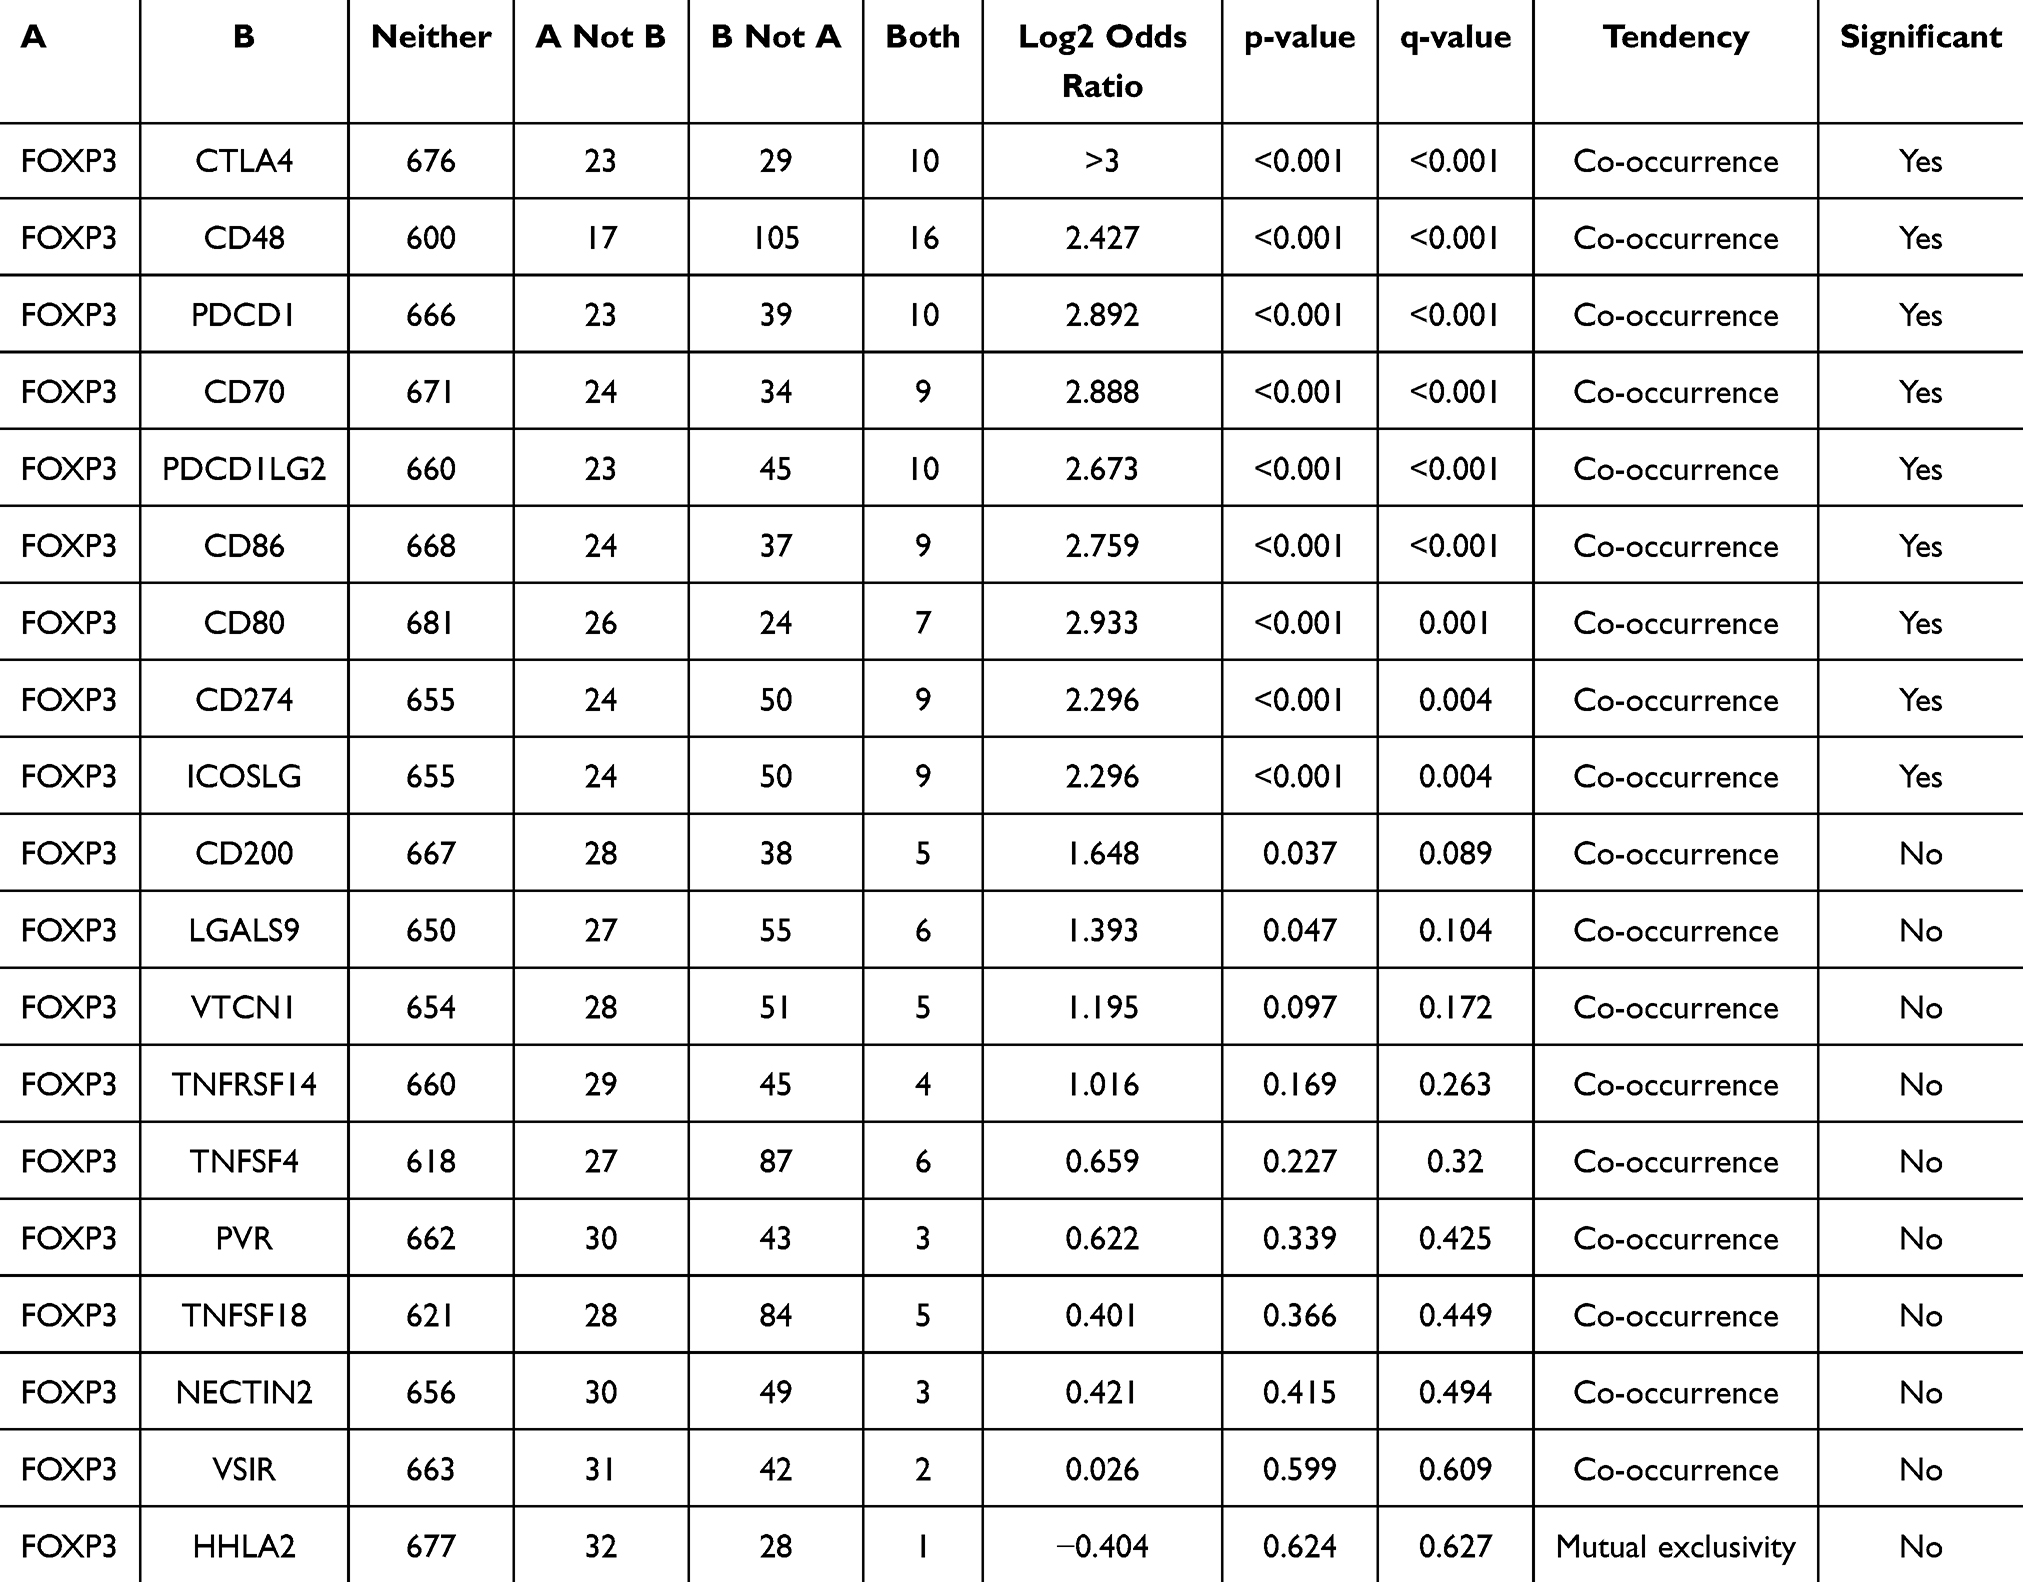 |
Table 2 Mutual-Exclusivity Analysis Between FOXP3 and Multiple-Immune Checkpoints in BRCA |
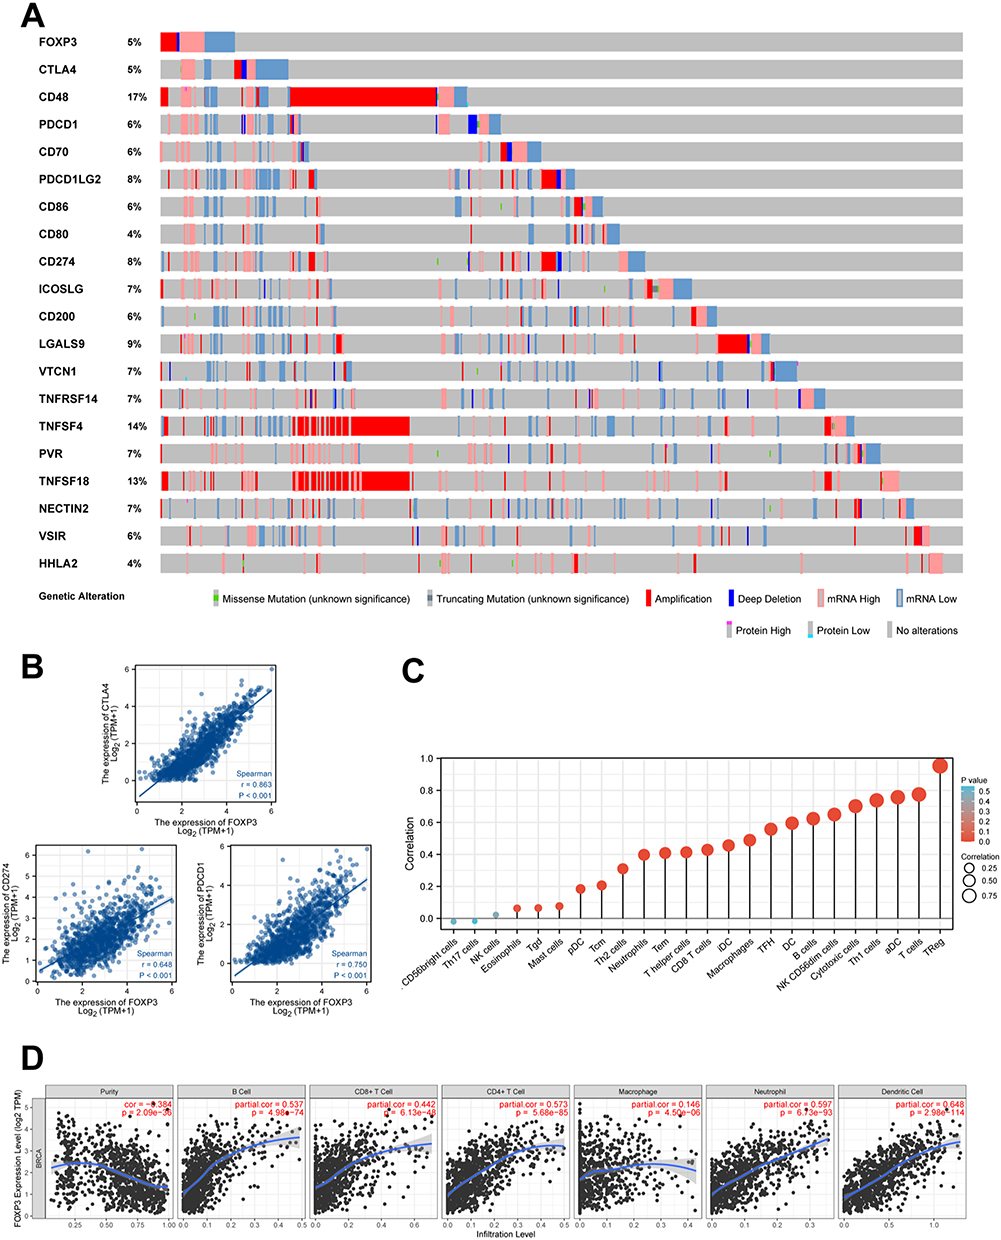 |
Figure 3 FOXP3 and Immune Checkpoints Mutation Analysis, The Relationship Between the Expression of FOXP3 and Immune Checkpoints Genes as well as Immune Infiltration in BRCA. (A) Landscape of FOXP3 and immune checkpoint alteration in BRCA. (B) FOXP3 has a significant positive correlation with PDCD1, CD274, CTLA4. (C) Lollipop chart about correlation between 24 immune cell and the expression of FOXP3 in BRCA. (D) The correlation between the abundance of immune cell and the expression of FOXP3 in BRCA. |
Immune Infiltration of FOXP3
To visualize and elucidate the infiltration status of immune cells associated with FOXP3 in BRCA, we generated four Lollipop charts using 24 immune cells (Figure 3C). The charts showed increased infiltration levels of immune cells in relation to FOXP3 expression. We further scrutinized this correlation using the TIMER2 database, which connected FOXP3 expression with the extent of immune cell infiltration. Our conclusions propose that FOXP3 is involved in mediating immune cell infiltration and the subsequent inflammatory response. The resulting data highlighted a positive association between FOXP3 expression and the infiltration levels of numerous immune cells, such as CD4+ T cells, CD8+ T cells, macrophages, B cells, neutrophils, and dendritic cells (Figure 3D).
PPI and Neighbour Gene Network of FOXP3
We employed STRING to scrutinize potential interactions and establish the PPI network of FOXP3 at different transcriptional stages. The PPI network includes FOXP3 and ten proteins closely linked to it (Figure 4A). Using these FOXP3-associated proteins, we created a GGI network and referenced the GeneMANIA database to explore their specific roles (Figure 4B). The central hub of FOXP3 is encircled by 50 nodes, each representing genes that exhibit robust links with FOXP3 based on shared protein domains, physical associations, colocalization, co-expression, prediction, genetic interactions, and pathways. NFATC2 is connected to FOXP3 through physical and genetic interactions. Both NFATC2 and CTLA4 have a pathway relationship with FOXP3, while CTLA4 shares colocalization with FOXP3. Additionally, GATAD2B, HDAC9, IKZF3, RORC, MKI67, SIVA1, SFTPC, TBR1, and FOXP3 demonstrate physical interaction. Comprehensive functional analysis suggests that these genes have a significant correlation with lymphocyte differentiation. Moreover, they are linked to regulatory roles concerning the differentiation of T cells, regulatory T cells, lymphocytes, leukocytes, and the modulation of hemopoiesis.
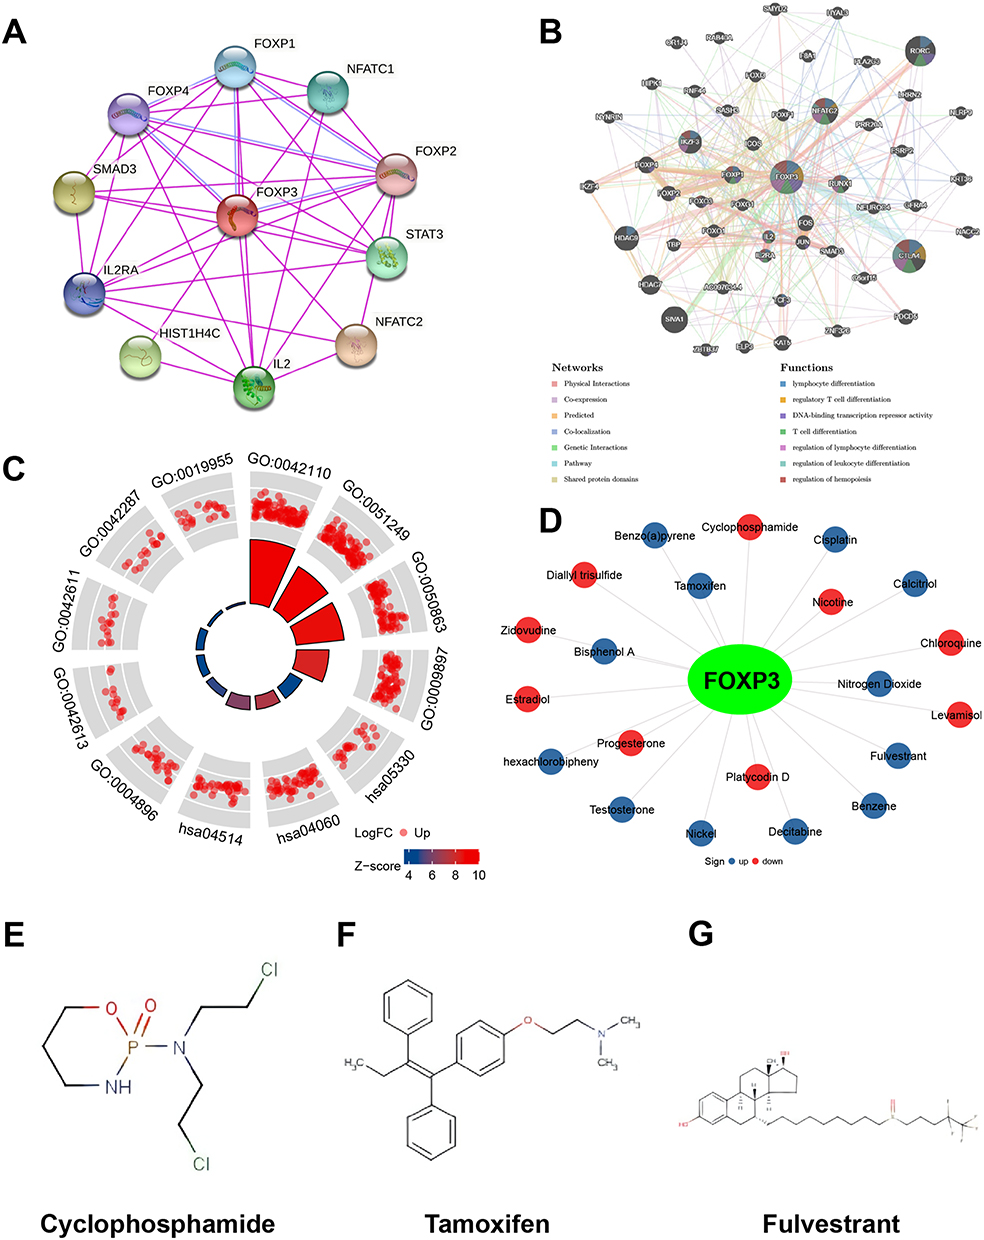 |
Figure 4 PPI Network, Neighbor Gene Network, The Functions of FOXP3, and Chemical-Gene Interaction. (A) Protein-protein interaction network of expressed FOXP3. (B) Gene-gene interaction network of expressed FOXP3. (C) The functions of FOXP3 and genes significantly associated with FOXP3 alterations were predicted by the analysis of GO and KEGG. (D) Chemical-gene interaction of FOXP3. Chemical structural (E) Cyclophosphamide, (F) Tamoxifen, (G) Fulvestrant. |
FOXP3 Functional Enrichment Analysis
We employed the “ClusterProfiler” package in R software to conduct pathway enrichment analysis and functional annotation for FOXP3, derived from the 50 nodes representing genes that exhibit a strong association with FOXP3. The top 12 items emerging from GO and KEGG enrichment analyses encompass cytokine receptor activity, interaction between cytokines, regulation of T cell and lymphocyte activation, activation of T cells, the plasma membrane’s external side, MHC class I and II protein complex, binding of cytokines, MHC protein binding, rejection of allografts, and cell adhesion molecules (Figure 4C) (Table 3).
 |
Table 3 The GO and KEGG Function Enrichment Analysis of FOXP3 and Neighbor Genes in BRCA |
Chemical-Gene Interactions
To explore the interactions between FOXP3 and chemicals used for cancer treatment, we utilized the CTD and visualized the results. A total of 21 chemicals affected FOXP3 expression (Figure 4D). The chemical in the red circle decreased FOXP3 expression levels, while the chemical in the blue circle increased FOXP3 expression levels. We also examined drugs such as cyclophosphamide (Figure 4E), tamoxifen (Figure 4F), and fulvestrant (Figure 4G).
Responsiveness to Chemotherapy and Targeted Therapy in Relation to FOXP3 Expression: ROC Plotter Analysis
We conducted a ROC plotter analysis to evaluate the correlation between FOXP3 expression and patient response to various therapies, as well as to measure the potential of FOXP3 as a predictor for effective treatment in BRCA. We contrasted FOXP3 expression in patients who responded and those who did not respond to treatments such as tamoxifen, aromatase inhibitors, trastuzumab, taxane, anthracycline, and the combination of fluorouracil, epirubicin, and cyclophosphamide (FEC) in BRCA samples. According to the 5-year RFS data, FOXP3’s sensitivity in predicting tamoxifen treatment efficacy for estrogen receptor (ER)-positive BRCA patients was not notably high (AUC = 0.552, p = 0.26) (Figure 5A). In contrast, based on the 5-year RFS data, FOXP3 demonstrated sensitivity in predicting the treatment effect of aromatase inhibitors for ER-positive BRCA patients (AUC = 0.807, p = 2.6E-03) (Figure 5B). Regarding the pathological complete response (pCR) of HER2-positive BRCA, FOXP3 could predict trastuzumab treatment efficacy (AUC = 0.638, p = 1.6E-02) (Figure 5C). For luminal-B BRCA pCR, FOXP3 was sensitive in predicting the treatment effects of FEC (AUC = 0.832, p = 7.6E-07) (Figure 5D), taxane (AUC = 0.737, p = 1.2E-05) (Figure 5E), and anthracycline (AUC = 0.706, p = 2E-04) (Figure 5F). Furthermore, based on the pCR of luminal-A BRCA, FOXP3 could predict the treatment effect of FEC (AUC = 0.836, p = 4.3E-05) (Figure 5G). In HER2-positive and ER-negative BRCA pCR, FOXP3 could accurately predict the treatment effects of anthracycline (AUC = 0.733, p = 1.3E-06) (Figure 5H), FEC (AUC = 0.952, p < 0.001) (Figure 5I), and taxane (AUC = 0.682, p = 1.4E-03) (Figure 5J). Lastly, for triple-negative BRCA pCR, FOXP3 could predict the treatment effect of anthracycline (AUC = 0.603, p = 3.4E-02) (Figure 5K), but not that of FEC (AUC = 0.603, p = 3.4E-02) (Figure 5L).
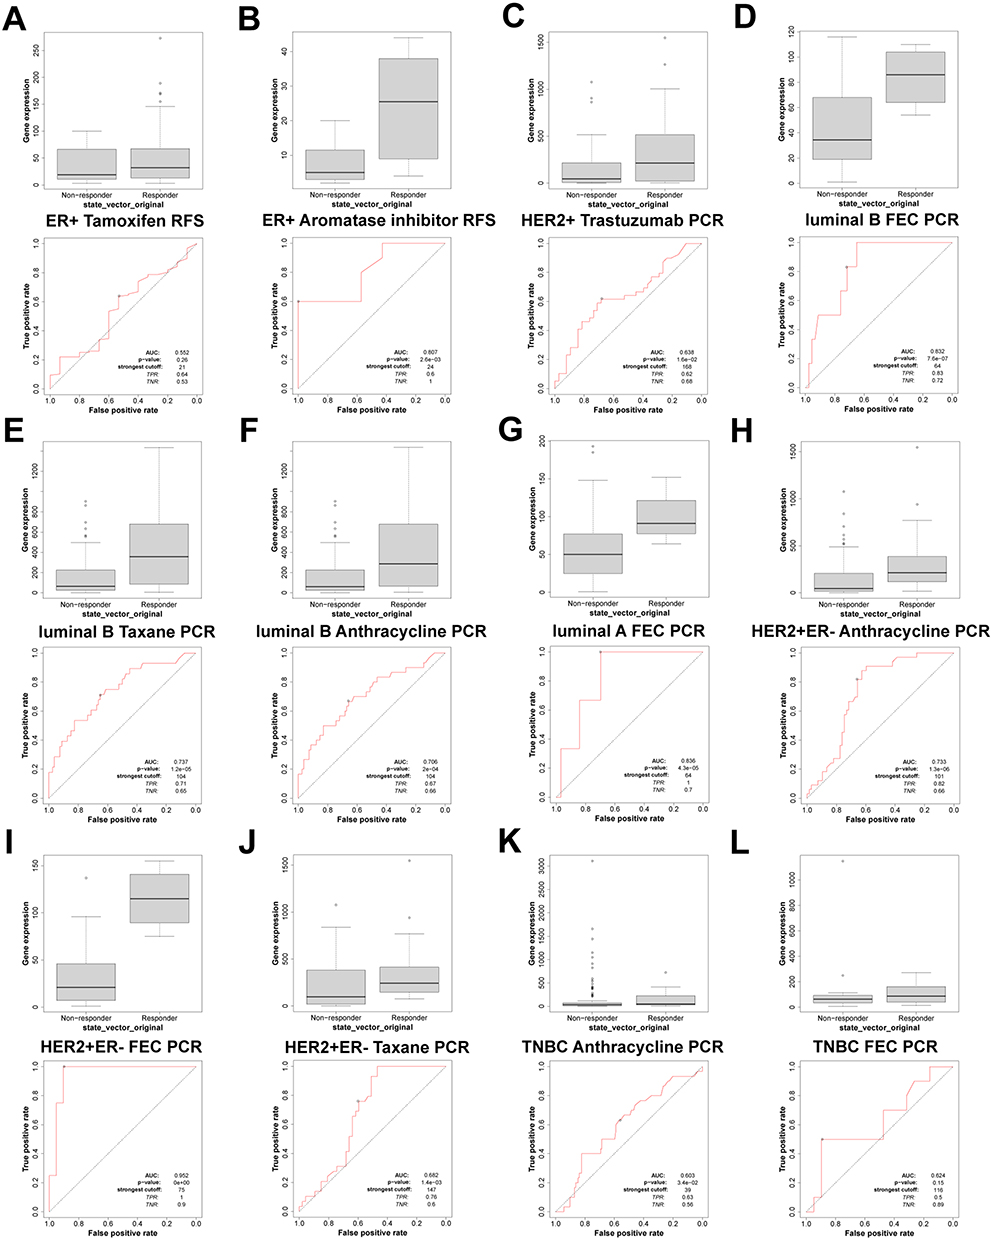 |
Figure 5 FOXP3 expression in groups of responder and non-responder BRCA patients treated using the online platform ROC plot. (A and B) RFS of ER+ BRCA patients, (C) PCR of HER2+ BRCA patients, (D–F) PCR of Luminal B BRCA patients, (G) PCR of Luminal A BRCA patients, (H–J) PCR of HER2+ and ER- BRCA patients, (K and L) PCR of TNBC BRCA patients. |
Correlation Between Gene Expression and Pathway Scores
To explore the connection between FOXP3 and various biological pathways, we carried out an analysis correlating gene expression with pathway scores. Such information can assist in comprehending the potential involvement of FOXP3 within these pathways. The pathways under examination encompassed the PI3K/AKT/mTOR pathway, genes up-regulated due to reactive oxygen species, anti-inflammatory signaling pathway of interleukin-10, cellular reaction to hypoxia, markers for epithelial-mesenchymal transition, extracellular matrix (ECM)-related genes, DNA replication, P53 pathway, tumor inflammation signature, tumor proliferation signature, G2M checkpoint, MYC targets, formation of collagen, degradation of ECM, angiogenesis, apoptosis, inflammatory response, ferroptosis, and TGFB (Figure 6A–T). The results reflected a strong positive correlation between FOXP3 expression and the tumor inflammation signature (p <0.001), implying that FOXP3 may play a significant role in regulating inflammation within the tumor microenvironment, potentially impacting cancer progression and therapy response.
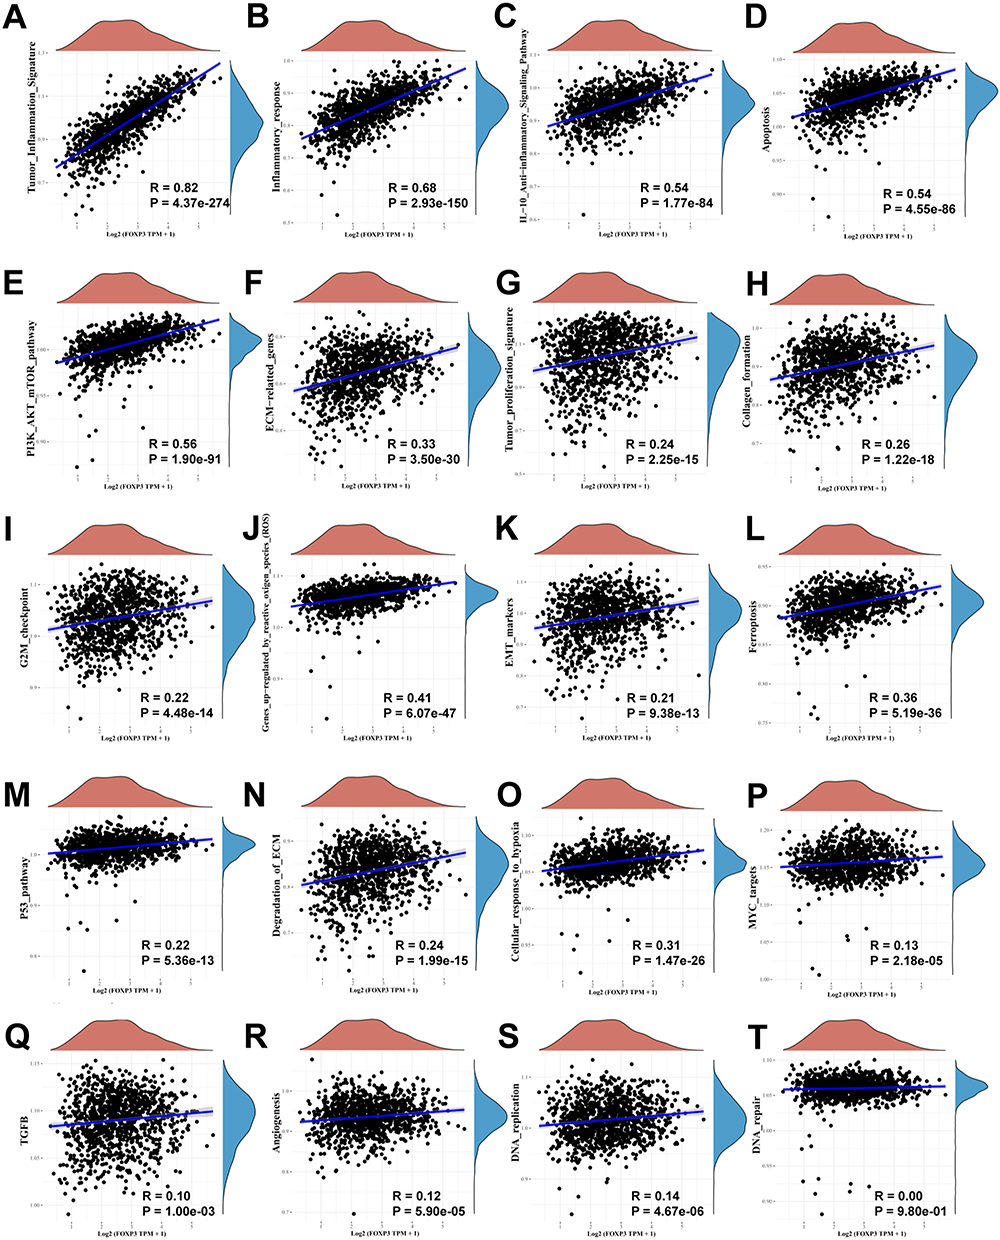 |
Figure 6 The correlations between FOXP3 and pathway score was analysed with Spearman. The abscissa represents the distribution of the gene expression, and the ordinate represents the distribution of the pathway score. The density curve on the right represents the trend in distribution of pathway immune score, the upper density curve represents the trend in distribution of the gene expression. (A) Tumor inflammation signature, (B) Inflammatory response, (C) IL-10 anti-inflammatory signaling pathway, (D) Apoptosis, (E) PI3K/AKT/mTOR pathway, (F) ECM related genes, (G) Tumor proliferation signature, (H) Collagen formation, (I) G2M checkpoint, (J) Genes up-regulation by reactive oxygen species (ROS), (K) EMT markers, (L) Ferroptosis, (M) P53 pathway, (N) Degradation of ECM, (O) Cellular response to hypoxia, (P) MYC targets, (Q) TGFB, (R) Angiogenesis, (S) DNA replication, (T) DNA repair. |
Discussion
FOXP3 has been identified as a contributing factor in the onset and advancement of a range of malignant neoplasms, such as those affecting the liver,25 melanoma,26 bladder, kidney cancers,27 non-small cell lung cancer,18 oral,28 prostate,29 colorectal30 and thyroid cancers,11 by regulating immune-related genes. However, a lack of comprehensive bioinformatics investigations on the expression and function of FOXP3 proteins in BRCA has hindered the complete understanding of FOXP3’s role in the development, progression, and prognosis of certain malignancies. For the first time, we utilized bioinformatics techniques in this investigation to scrutinize the gene expression and variations of FOXP3 in BRCA. Additionally, we assessed its biological role, molecular processes, and the influence it has on prognosis and immune infiltration among BRCA patients.
FOXP3 plays a vital role in the regulation of the maturation and immunological function of Treg cells in cancer resistance.31 Evidence suggests that it can stifle the expansion of the MCF-7 breast cancer cell line and incite cell apoptosis.32 Additionally, FOXP3 is essential for suppressing oncogenes in BRCA with favorable prognosis.32–34 In our investigation, database analysis and IHC revealed higher levels of FOXP3 mRNA in BRCA tissues compared to normal tissues, irrespective of histological type, tumor stage, and race. Our Kaplan-Meier survival analysis revealed a complex role for FOXP3 in BRCA prognosis. We discovered a significant correlation between the surge in FOXP3 mRNA expression and improved OS among breast cancer patients. However, we found no substantial link between FOXP3 mRNA expression and DMFS. Furthermore, our investigation revealed that an augment in FOXP3 expression correlated with an extended RFS, while a decrease in gene expression was associated with a longer PPS. These observations imply that FOXP3’s influence on BRCA prognosis is intricate and deserves a more in-depth exploration, given that FOXP3 may have varying effects on PFS and PPS among BRCA patients.
FOXP3 is an essential regulator of the development and immune function of Treg cells, which have been implicated in cancer progression. Previous studies have shown that FOXP3 can suppress oncogenes in BRCA and is associated with a favorable prognosis. Our research additionally uncovered a high frequency of FOXP3 gene mutations across diverse histological classifications of BRCA. Common occurrences included deletions, functionally impactful somatic mutations, and a decrease in the expression of the FOXP3 gene. The observed association between FOXP3 mutations and HER-2/ERBB2 overexpression highlights the potential role of FOXP3 as an X-linked BRCA suppressor gene and a critical regulatory factor of the HER-2/ERBB2 oncogene.32
In our research, we showcased the intricate role of FOXP3 in BRCA, indicating its potential utility as both a diagnostic biomarker and an immunomodulatory influence. Our analysis of the ROC curve revealed that FOXP3 presented a notably elevated AUC value for identifying BRCA, boasting a detection accuracy rate of 95.7%. We also observed strong associations between FOXP3 expression and immune checkpoint alterations in invasive BRCA and immune cell infiltration, further supporting its role as an immunomodulatory factor.
FOXP3 protein plays a crucial role in regulating immune function.35,36 Our study’s genomic analysis highlighted a strong association between FOXP3 and alterations in numerous immune checkpoints in invasive BRCA. Notably, this association was concurrent but not mutually exclusive.
In our study, we discovered a potent positive linkage between FOXP3 and PDCD1, CD274, and CTLA4 within the context of BRCA. FOXP3 was also involved in the infiltration of immune cells and the subsequent inflammatory reaction. More specifically, we found a significant association between FOXP3 expression and the presence of infiltrating B cells, neutrophils, dendritic cells, macrophages, CD4+ T cells and CD8+ T cells. As stated in a study by West et al37 patients with BRCA possessing FOXP3+ tumor-infiltrating lymphocytes (TILs) exhibited improved survival rates. These findings further endorse the potential function of FOXP3 as an influential factor in the immunomodulation of invasive BRCA.
Former research has indicated a correlation between FOXP3 and multiple genes or proteins. These include genes associated with the glucocorticoid-induced tumor necrosis factor receptor family,38 CTLA4 and CD25,39 transforming growth factor-β,40 nuclear factor-activated T cells40 and the Runt-related transcription factor 1.41 In the course of our study, we scrutinized the association between FOXP3 and its adjacent genes or proteins, identifying 50 major genes related to FOXP3. Further investigation revealed that these genes primarily play roles in regulating lymphocyte function and differentiation.
Our investigation further substantiated that the quantification of FOXP3 mRNA expression could act as a prognosticator for the reactivity of BRCA cells to anticancer therapeutics. Intriguingly, FOXP3 exhibits sensitivity in forecasting the therapeutic impact of aromatase inhibitors on patients diagnosed with ER-positive BRCA, as evidenced by RFS rates. Drawing a parallel, Ladoire et al42 disclosed that the presence of FOXP3 in BRCA independently correlates with enhanced OS in patients undergoing anthracycline-based chemotherapy.
Regarding the pCR of BRCA, FOXP3 is sensitive in predicting the treatment effects of trastuzumab, FEC, taxane, and anthracycline. Patients who achieved pCR after neoadjuvant treatment exhibited significantly higher FOXP3 expression compared to those who did not achieve pCR after treatment with these drugs. Horlock et al43 documented that the count of circulating Th17 cells is diminished in subjects with HER2-positive breast cancer. The alteration in the Treg: Th17 ratio seems to typify the oncogenic state, with trastuzumab therapy further destabilizing this equilibrium. Thereby, trastuzumab could potentially exert a therapeutic influence by modulating the cellular immune system’s responsiveness in patients afflicted with breast cancer.
Increased infiltration of CD4+, CD8+, and FOXP3+ TILs was associated with pCR in triple-negative breast cancer (TNBC) patients receiving neoadjuvant anthracycline or anthracycline + taxane therapy.44 Furthermore, patients with high FOXP3+ and CD8+ TIL infiltration after neoadjuvant paclitaxel followed by FEC experienced elevated pCR rates.45
However, to fully harness the potential of FOXP3 in breast cancer and translate these findings into clinical practice, further experimental and clinical research is necessary. Future studies should investigate the molecular mechanisms, immunoregulatory functions, and interactions with anti-cancer drugs of FOXP3 in breast cancer, with the aim of providing more effective treatment strategies and personalized therapeutic options for breast cancer patients. In summary, our research emphasizes the significance of FOXP3 in the realm of breast cancer studies and constructs a foundation for subsequent explorations into its prospective clinical utilization.
Conclusions
Our study elucidates the pivotal role of FOXP3 in breast cancer, highlighting its potential as a diagnostic biomarker and immunoregulatory factor. The strong associations with immune checkpoint changes, immune cell infiltration, and anticancer drug responses emphasize the importance of FOXP3 in breast cancer management. Further understanding of FOXP3’s molecular mechanisms may contribute to improved tumor detection, treatment strategies, and patient outcomes.
Abbreviation
ACC, Adrenocortical carcinoma; BC, Breast cancer; BLCA, Bladder Urothelial Carcinoma; BRCA, Breast invasive carcinoma; CHOL, Cholangiocarcinoma; COAD, Colon adenocarcinoma; CTD, Comparative Toxicogenomics Database; DLBC, diffuse large B-cell lymphoma; DMFS, Distant metastasis-free survival; ECM, Extracellular matrix; ER, Estrogen receptor; ESCA, Esophageal carcinoma; FOXP3, Forkhead box P3; GBM, Glioblastoma multiforme; GGI, Gene-gene interaction; GO, Gene Ontology; HNSC, Head and neck squamous cell carcinoma; LAML, Acute Myeloid Leukemia; IDC, Infiltrating Ductal Carcinoma; IHC, Immunohistochemistry; ILC, Infiltrating Lobular Carcinoma; KEGG, Kyoto Encyclopedia of Genes and Genomes; KICH, Kidney chromophobe; KIRC, Kidney renal clear cell carcinoma; KIRP, Kidney renal papillary cell carcinoma; LIHC, Liver hepatocellular carcinoma; LUAD, Lung adenocarcinoma; LUSC, Lung squamous cell carcinoma; OS, Overall survival; OV, Ovarian serous cystadenocarcinoma; PAAD, Pancreatic adenocarcinoma; pCR, Pathological complete response; PFS, Progression-free survival; PPI, Protein-protein interaction; PPS, Post-progression survival; PR, Progesterone receptor; READ, Rectum adenocarcinoma; RFS, Recurrence-free survival; ROC, Receiver Operating Characteristic; SKCM, Skin Cutaneous Melanoma; STAD, Stomach adenocarcinoma; THCA, Thyroid carcinoma; UCEC, Uterine Corpus Endometrial Carcinoma; TCGA, The Cancer Genome Atlas; THYM, Thymoma; TILs, Tumor-infiltrating lymphocytes; TGCT, Testicular germ cell tumors; TIMER, Tumour Immune Estimation Resource; TME, The tumor microenvironment; TNBC, Triple-negative breast cancer.
Data Sharing Statement
The datasets used and/or analyzed during the current study are available from the corresponding author (Jianing Yi) on reasonable request.
Ethics Approval and Consent to Participate
The study has been authorized by the Medical Ethics Committee of Hunan Provincial People’s Hospital/The First Affiliated Hospital of Hunan Normal University (IRB Approval NO.2024-038) and practiced in accordance with the research principles described in the Helsinki Declaration.
Acknowledgments
We thank Bullet Edits Limited for the linguistic editing and proofreading of the manuscript.
Funding
This study was funded by The Scientific Research Programme of Hunan Provincial Health Commission (B202304016524); The Scientific Research Fund of Hunan Provincial Education Department (22B0081, 23B0091).
Disclosure
The authors declare that they have no competing interests in this work.
References
1. Lei S, Zheng R, Zhang S, et al. Global patterns of breast cancer incidence and mortality: a population-based cancer registry data analysis from 2000 to 2020. Cancer Commun. 2021;41(11):1183–1194. doi:10.1002/cac2.12207
2. Sung H, Ferlay J, Siegel RL, et al. Global cancer statistics 2020: GLOBOCAN estimates of incidence and mortality worldwide for 36 cancers in 185 countries. CA Cancer J Clin. 2021;71(3):209–249. doi:10.3322/caac.21660
3. Perez EA, Barrios C, Eiermann W, et al. Trastuzumab emtansine with or without pertuzumab versus trastuzumab plus taxane for human epidermal growth factor receptor 2-positive, advanced breast cancer: primary results from the phase III MARIANNE Study. J Clin Oncol. 2017;35(2):141–148. doi:10.1200/JCO.2016.67.4887
4. Yi J, Chen S, Yi P, et al. Pyrotinib sensitizes 5-fluorouracil-resistant HER2(+) breast cancer cells to 5-fluorouracil. Oncol Res. 2020;28(5):519–531. doi:10.3727/096504020X15960154585410
5. Zeng J, Yi J, Tan S, et al. GPI: an indicator for immune infiltrates and prognosis of human breast cancer from a comprehensive analysis. Front Endocrinol. 2022;13:995972. doi:10.3389/fendo.2022.995972
6. Yi J, Tan S, Zeng Y, et al. Comprehensive analysis of prognostic and immune infiltrates for FOXPs transcription factors in human breast cancer. Sci Rep. 2022;12(1):8896. doi:10.1038/s41598-022-12954-3
7. Beyer M, Schultze JL. Regulatory T cells in cancer. Blood. 2006;108(3):804–811. doi:10.1182/blood-2006-02-002774
8. Jackson BC, Carpenter C, Nebert DW, Vasiliou V. Update of human and mouse forkhead box (FOX) gene families. Hum Genomics. 2010;4(5):345–352. doi:10.1186/1479-7364-4-5-345
9. Wing JB, Tanaka A, Sakaguchi S. Human FOXP3(+) regulatory T cell heterogeneity and function in autoimmunity and cancer. Immunity. 2019;50(2):302–316. doi:10.1016/j.immuni.2019.01.020
10. Carvalho MI, Pires I, Prada J, Gregório H, Lobo L, Queiroga FL. Intratumoral FoxP3 expression is associated with angiogenesis and prognosis in malignant canine mammary tumors. Vet Immunol Immunopathol. 2016;178:1–9. doi:10.1016/j.vetimm.2016.06.006
11. Gong Z, Jia H, Xue L, et al. The emerging role of transcription factor FOXP3 in thyroid cancer. Rev Endocr Metab Disord. 2022;23(3):421–429. doi:10.1007/s11154-021-09684-8
12. Lal G, Bromberg JS. Epigenetic mechanisms of regulation of Foxp3 expression. Blood. 2009;114(18):3727–3735. doi:10.1182/blood-2009-05-219584
13. Ohara M, Yamaguchi Y, Matsuura K, Murakami S, Arihiro K, Okada M. Possible involvement of regulatory T cells in tumor onset and progression in primary breast cancer. Cancer Immunol Immunother. 2009;58(3):441–447. doi:10.1007/s00262-008-0570-x
14. Jørgensen N, Hviid T, Nielsen LB, et al. Tumour-infiltrating CD4-, CD8- and FOXP3-positive immune cells as predictive markers of mortality in BRCA1- and BRCA2-associated breast cancer. Br J Cancer. 2021;125(10):1388–1398. doi:10.1038/s41416-021-01514-7
15. Liu C, Han J, Li X, et al. FOXP3 inhibits the metastasis of breast cancer by downregulating the expression of MTA1. Front Oncol. 2021;11:656190. doi:10.3389/fonc.2021.656190
16. Attias M, Al-Aubodah T, Piccirillo CA. Mechanisms of human FoxP3(+) T(reg) cell development and function in health and disease. Clin Exp Immunol. 2019;197(1):36–51. doi:10.1111/cei.13290
17. Li T, Fan J, Wang B, et al. TIMER: a web server for comprehensive analysis of tumor-infiltrating immune cells. Cancer Res. 2017;77(21):e108–e110. doi:10.1158/0008-5472.CAN-17-0307
18. Győrffy B, Surowiak P, Budczies J, Lánczky A, Chellappan SP. Online survival analysis software to assess the prognostic value of biomarkers using transcriptomic data in non-small-cell lung cancer. PLoS One. 2013;8(12):e82241. doi:10.1371/journal.pone.0082241
19. Nagy Á, Lánczky A, Menyhárt O, Győrffy B. Validation of miRNA prognostic power in hepatocellular carcinoma using expression data of independent datasets. Sci Rep. 2018;8(1):9227. doi:10.1038/s41598-018-27521-y
20. Szklarczyk D, Gable AL, Lyon D, et al. STRING v11: protein-protein association networks with increased coverage, supporting functional discovery in genome-wide experimental datasets. Nucleic Acids Res. 2019;47(D1):D607–D613. doi:10.1093/nar/gky1131
21. Warde-Farley D, Donaldson SL, Comes O, et al. The GeneMANIA prediction server: biological network integration for gene prioritization and predicting gene function. Nucleic Acids Res. 2010;38(Web Server issue):W214–W220. doi:10.1093/nar/gkq537
22. Yu G, Wang LG, Han Y, He QY. clusterProfiler: an R package for comparing biological themes among gene clusters. OMICS. 2012;16(5):284–287. doi:10.1089/omi.2011.0118
23. Hnzelmann S, Castelo R, Guinney J. GSVA: gene set variation analysis for microarray and RNA-Seq data. BMC Bioinformatics. 2013;14(1):7. doi:10.1186/1471-2105-14-7
24. Gabriela B, Mlecnik B, Tosolini M, et al. Spatiotemporal dynamics of intratumoral immune cells reveal the immune landscape in human cancer. Immunity. 2013;39(4):782–795. doi:10.1016/j.immuni.2013.10.003
25. Pinato DJ, Murray SM, Forner A, et al. Trans-arterial chemoembolization as a loco-regional inducer of immunogenic cell death in hepatocellular carcinoma: implications for immunotherapy. J Immunother Cancer. 2021;9(9):e003311. doi:10.1136/jitc-2021-003311
26. Somasundaram R, Connelly T, Choi R, et al. Tumor-infiltrating mast cells are associated with resistance to anti-PD-1 therapy. Nat Commun. 2021;12(1):346. doi:10.1038/s41467-020-20600-7
27. Masuda T, Tanaka N, Takamatsu K, et al. Unique characteristics of tertiary lymphoid structures in kidney clear cell carcinoma: prognostic outcome and comparison with bladder cancer. J Immunother Cancer. 2022;10(3):1.
28. Lequerica-Fernández P, Suárez-Canto J, Rodriguez-Santamarta T, et al. Prognostic relevance of CD4(+), CD8(+) and FOXP3(+) TILs in oral squamous cell carcinoma and correlations with PD-L1 and cancer stem cell markers. Biomedicines. 2021;9(6):1.
29. Kaur HB, Vidotto T, Mendes AA, et al. Association between pathogenic germline mutations in BRCA2 and ATM and tumor-infiltrating lymphocytes in primary prostate cancer. Cancer Immunol Immunother. 2022;71(4):943–951. doi:10.1007/s00262-021-03050-y
30. Laissue P. The forkhead-box family of transcription factors: key molecular players in colorectal cancer pathogenesis. Mol Cancer. 2019;18(1):5. doi:10.1186/s12943-019-0938-x
31. Lu L, Barbi J, Pan F. The regulation of immune tolerance by FOXP3. Nat Rev Immunol. 2017;17(11):703–717.
32. Zuo T, Wang L, Morrison C, et al. FOXP3 is an X-linked breast cancer suppressor gene and an important repressor of the HER-2/ErbB2 oncogene. Cell. 2007;129(7):1275–1286. doi:10.1016/j.cell.2007.04.034
33. Zuo T, Liu R, Zhang H, et al. FOXP3 is a novel transcriptional repressor for the breast cancer oncogene SKP2. J Clin Invest. 2007;117(12):3765–3773. doi:10.1172/JCI32538
34. Merlo A, Casalini P, Carcangiu ML, et al. FOXP3 expression and overall survival in breast cancer. J Clin Oncol. 2009;27(11):1746–1752. doi:10.1200/JCO.2008.17.9036
35. Wang D, Huang S, Yuan X, et al. The regulation of the Treg/Th17 balance by mesenchymal stem cells in human systemic lupus erythematosus. Cell Mol Immunol. 2017;14(5):423–431. doi:10.1038/cmi.2015.89
36. Du R, Zhao H, Yan F, Li H. IL-17+Foxp3+ T cells: an intermediate differentiation stage between Th17 cells and regulatory T cells. J Leukoc Biol. 2014;96(1):39–48. doi:10.1189/jlb.1RU0114-010RR
37. West NR, Kost SE, Martin SD, et al. Tumour-infiltrating FOXP3(+) lymphocytes are associated with cytotoxic immune responses and good clinical outcome in oestrogen receptor-negative breast cancer. Br J Cancer. 2013;108(1):155–162. doi:10.1038/bjc.2012.524
38. McHugh RS, Whitters MJ, Piccirillo CA, et al. CD4(+)CD25(+) immunoregulatory T cells: gene expression analysis reveals a functional role for the glucocorticoid-induced TNF receptor. Immunity. 2002;16(2):311–323. doi:10.1016/S1074-7613(02)00280-7
39. Chen X, Du Y, Lin X, Qian Y, Zhou T, Huang Z. CD4+CD25+ regulatory T cells in tumor immunity. Int Immunopharmacol. 2016;34:244–249. doi:10.1016/j.intimp.2016.03.009
40. Pandiyan P, Zheng L, Ishihara S, Reed J, Lenardo MJ. CD4+CD25+Foxp3+ regulatory T cells induce cytokine deprivation-mediated apoptosis of effector CD4+ T cells. Nat Immunol. 2007;8(12):1353–1362. doi:10.1038/ni1536
41. Recouvreux MS, Grasso EN, Echeverria PC, et al. RUNX1 and FOXP3 interplay regulates expression of breast cancer related genes. Oncotarget. 2016;7(6):6552–6565. doi:10.18632/oncotarget.6771
42. Liu Y, Zheng P. FOXP3 and breast cancer: implications for therapy and diagnosis. Pharmacogenomics. 2007;8(11):1485–1487. doi:10.2217/14622416.8.11.1485
43. Horlock C, Stott B, Dyson PJ, et al. The effects of trastuzumab on the CD4+CD25+FoxP3+ and CD4+IL17A+ T-cell axis in patients with breast cancer. Br J Cancer. 2009;100(7):1061–1067. doi:10.1038/sj.bjc.6604963
44. Seo AN, Lee HJ, Kim EJ, et al. Tumour-infiltrating CD8+ lymphocytes as an independent predictive factor for pathological complete response to primary systemic therapy in breast cancer. Br J Cancer. 2013;109(10):2705–2713. doi:10.1038/bjc.2013.634
45. Oda N, Shimazu K, Naoi Y, et al. Intratumoral regulatory T cells as an independent predictive factor for pathological complete response to neoadjuvant paclitaxel followed by 5-FU/epirubicin/cyclophosphamide in breast cancer patients. Breast Cancer Res Treat. 2012;136(1):107–116. doi:10.1007/s10549-012-2245-8
 © 2024 The Author(s). This work is published and licensed by Dove Medical Press Limited. The full terms of this license are available at https://www.dovepress.com/terms.php and incorporate the Creative Commons Attribution - Non Commercial (unported, v3.0) License.
By accessing the work you hereby accept the Terms. Non-commercial uses of the work are permitted without any further permission from Dove Medical Press Limited, provided the work is properly attributed. For permission for commercial use of this work, please see paragraphs 4.2 and 5 of our Terms.
© 2024 The Author(s). This work is published and licensed by Dove Medical Press Limited. The full terms of this license are available at https://www.dovepress.com/terms.php and incorporate the Creative Commons Attribution - Non Commercial (unported, v3.0) License.
By accessing the work you hereby accept the Terms. Non-commercial uses of the work are permitted without any further permission from Dove Medical Press Limited, provided the work is properly attributed. For permission for commercial use of this work, please see paragraphs 4.2 and 5 of our Terms.