")
Back to Journals » International Journal of General Medicine » Volume 14
The Platelet–Lymphocyte Ratio Associated with Depression in Diabetes Patients in the US National Health and Nutrition Examination Survey
Received 18 August 2021
Accepted for publication 19 October 2021
Published 8 November 2021 Volume 2021:14 Pages 7825—7832
DOI https://doi.org/10.2147/IJGM.S334883
Checked for plagiarism Yes
Review by Single anonymous peer review
Peer reviewer comments 3
Editor who approved publication: Dr Scott Fraser
Depu Zhou, Jie Wang, Xiaokun Li
Department of Endocrinology, Yanbian University Hospital, Yanji City, Jilin Province, People’s Republic of China
Correspondence: Xiaokun Li Email [email protected]
Background: This study investigated patients with diabetes mellitus (DM) and the role of the platelet–lymphocyte ratio (PLR) in comorbid clinically relevant depression (CRD) in these individuals, so as to determine the association between PLR and depression.
Material and Methods: All data used in this research is originally from the United States National Health and Nutrition Examination Survey (NHANES). CRD in DM patients was screened via a Patient Health Questionnaire-9 (PHQ-9). PLR was calculated by platelet and lymphocyte counts. The associations between PLR and CRD in DM patients were determined using multivariable logistic regression models, weighted generalized additive models, and receiver operating characteristic curve (ROC). The second outcome was the relationship between suicide tendency and PLR.
Results: We selected 3537 DM patients from 2009 to 2016 in database. PLR was statistically significantly associated with risk of CRD in diabetic patients (p trend< 0.05 in non-adjusted and adjusted model) and had a predictive value (AUC = 0.559). We also found a U-shaped association between PLR and CRD in patients with DM. The break point was 69.2. To the right of 69.2, the OR (95% CI) was 1.00 (1.00, 1.01). To the left of it, the OR (95% CI) was 0.97 (0.95, 1.00). We have found that PLR is not related to suicidal tendencies.
Conclusion: PLR is an independent risk factor for CRD in DM patients, and the relationship between them is nonlinear. When PLR was around 69.2, patients with diabetes had the lowest risk of depression. Further research is needed to clarify the nonlinear relationship between PLR and depression in DM patients.
Keywords: diabetes mellitus, the platelet–lymphocyte ratio, depression, NHANES
Background
Diabetes mellitus (DM) has emerged as a global public health problem with a growing incidence rate. According to the report of the International Diabetes Federation Diabetes Atlas, 463 million people aged 20–79 years have diabetes. DM is defined as a mood disorder with several symptoms that can interfere with cognition, emotions, and behaviors.1 DM patients are also susceptible to depression, and it has been previously confirmed that the comorbidity rate of depression and DM is extremely high. In this regard, depression was prevalent in patients with type 1 DM (12%) and type 2 DM (19.1%),2 and the influence of comorbid depression and DM appears to be adverse. Depression is associated with an increased risk of diabetes-related complications due to poor self-control and low treatment adherence.3 DM patients with depression also have worse quality of life; they experience disability-related work loss, increased health-care utilization, and a high risk of mortality.3–5 For these reasons, it is essential to diagnose depression in DM patients.
Several screening questionnaires are available in the medical field, including SDS and PHQ-9;6 however, most of them are designed for use in primary hospitals to diagnose patients with less complex medical diseases and are not readily adaptable by untrained endocrinologists. In DM patients, depression is difficult to diagnose because the two diseases share overlapping features.7 Lower extremity pain induced by diabetic neuropathy might also appear as a symptom of depression.8 Lustman also reported that psychiatric disorders would increase the tendency to complain of diabetes symptoms, which is another type of correlation between the two conditions.8 Yet, the function of early biomarkers in diagnosing depression in DM patients requires further investigation.
Inflammation response plays an important role in the pathogenesis of diabetes and depression.9–12 Some of the most common behaviors that are associated with DM and depression are irregular diet, insomnia and lack of exercises, which lead to chronic stress. Chronic stress caused by diabetes or depression would activate the hypothalamus pituitary adrenal axis and the sympathetic nervous system, inducing immune system dysfunction and eventually increasing pro-inflammation cytokines. High levels of cytokines induce insulin resistance and interferes with the function of pancreatic cells.13 Increased cytokines in the central nervous system will down regulated neurotransmitter levels, impair synaptic plasticity, and disturb the neuroendocrine function of patients with depression.14 Given the potential link between depression and DM, inflammation can be used as a predictive biomarker for diagnosing patients who are depressed and have DM.
Platelets and lymphocytes can released proinflammatory cytokines which are involved in the development and progress of inflammatory diseases. The platelet lymphocyte ratio (PLR) was calculated by combining the ratio of both. This is a novel hematologic inflammatory parameter which was relatively cheap, easy to obtain and more stable than using platelet or lymphocytes alone. This method has been used to predict prognosis and morbidity in malignancies, cardiovascular and autoimmune diseases.15–20 Some recent studies were reported that PLR was significantly higher in type 2 diabetic patients and mood disorder patients compared to health control.21,22 We have notices that there are no studies that apply PLR in patients with depression and DM has been conducted. Therefore, investigating the usage of PLR in DM patients with depression is worthwhile.
Materials and Methods
Data Source
The data were obtained from a freely accessible database, the US National Health and Nutrition Examination Survey (NHANES), which is a cross-sectional program designed to monitor health and nutrition status of a national sample of adults and children in the US. Since 1999, the survey has collected data continuously in two-year cycles, combining interviews and physical exams. The survey examines a representative sample of 5000 individuals who are located in counties across the country. This survey result is used to measure prevalence and risk factors of major diseases.
Ethics Statement
The protocols for the conduct of NHANES was approved by National Center for Health Statistics Research Ethics Review Board and written informed consent was obtained. The protocols for this study were approved by the research ethics board at Yanbian University Hospital. The NHANES data is open to the public after anonymization. This allows researchers to process data in a format suitable for their analysis. In this research, we agree to abide by data usage restrictions to ensure that information is only used for statistical analysis, and all experiments are conducted in accordance with relevant guidelines and regulations.
Population Selection Criteria
Patients with diagnosed diabetes were defined by answers to questions in the diabetes questionnaire: “Doctor told you have diabetes”, “Taking insulin now?” and “Take diabetic pills to lower blood sugar”. The Patient Health Questionnaire (PHQ-9) was included in NHANES from 2005 and it was used to identify depression patient from then.
The PHQ-9 score ranges from 0 to 27 in this database. According to previous research, patients with PHQ-9 scores ≥ 10 are defined to have clinically relevant depression (CRD).23 We excluded the participants who lacked platelet or lymphocyte count data, had >5% missing data and were diagnosed with hematological or malignant diseases.
Data Extraction
As discussed in our previous article,19 we extracted data from the database using structure query language (SQL). Age, sex, race, education, and marital status were all included as variables, and for diabetes-related variables, diabetes family history and insulin usage are involved. The enrolled comorbidities included stroke, chronic heart failure (CHF), coronary artery disease (CAD), and diabetic retinopathy (DR). The other variables we selected included high-sensitivity C-reactive protein (hs-CRP), systolic blood pressure (SBP), diastolic blood pressure (DBP), C-reactive protein (CRP), body mass index (BMI), PLR, cholesterol, PHQ-9 score, glucose, HbA1c, and waist circumference.
Statistical Analyses
After selecting 3537 diabetic patients from 2009 to 2016, they were divided into three subgroups according to PLR value. Patients with PLR < 101.7 were defined as a mild group, those with 101.8–127.25 were defined as a moderate group, and others were considered a severe group. Mean ± standard deviation or interquartile range (IQR) were used for continuous variables and frequencies for categorical data. We used Kruskal–Wallis test to compare differences among different groups for continuous variables. For categorical variables, we used χ2 or Fisher’s exact tests.
A multivariate logistic regression model was used to analyze the relationship between PLR and CRD or suicidal tendency in DM patients. According to PLR value, all diabetic patients were divided into tertiles, and the first of each group was selected as a reference group. The statistical analysis results were presented by odds ratios (ORs) with 95% confidence intervals (CIs). The confounders’ age, sex, and race were adjusted in Model I. The confounders’ age, stroke, sex, race, marital status, waist circumference, coronary heart disease, HBA1C, education, BMI, chronic heart failure were adjusted in Model II. To evaluate the performance of PLR in predating diabetic patients with or without depression, a PLR-specific receiver operating characteristic (ROC) curve was established. The area under the curve (AUC) was used to evaluate PLR performance in distinguishing depression in diabetic patients.
A weighted generalized additive model was built to find the relationship between depression in diabetic patients and PLR. Subsequently, we used the penalized spline method to draw a smooth curve fit. The break points were found through a recursive algorithm, and a weighted two-piecewise linear regression model was established.
We used R software to calculate the statistical analyses and considered p < 0.05 as statistically significant.
Results
Subject Characteristics
We enrolled 3537 patients and divided them into three groups according to the value of PLR. Table 1 summarizes each group’s general characteristics. Overall, diabetic patients with a high level of PLR tended to be unmarried, young, female, minority ethnicities, obese, hyperlipidemia, having a high level of system inflammation without a history of CHF and HF.
 |
Table 1 Characteristics of the Enrolled Patients According to PLR |
PLR and CRD in DM Patients
The relationship between PLR and depression prevalence in diabetic patients is demonstrated in Table 2. The OR (95% CI) of PLR about diabetic patients with depression was 1.01 (1.00, 1.01) for an unadjusted model. The same result was found in models I and II. To further research the association between PLR and depression, we divided the patients into three groups. According to tertiles, the ORs (95% CI) for the second (101.8–127.25) and the third (127.35–221.65) groups were 1.16 (0.90, 1.49) and 1.55 (1.22, 1.97), respectively, compared to the first group (14.8–101.7). In model I, the ORs (95% CI) of CRD in DM patients for the second (101.8–127.25) and the third (127.35–221.65) groups were 1.13 (0.88, 1.46) and 1.51 (1.18, 1.93), compared to the first group (14.8–101.7), respectively. In model II, the ORs (95% CI) for the second (101.8–127.25) and the third (127.35–221.65) groups were 1.13 (0.87, 1.48) and 1.47 (1.13, 1.92) compared to the reference group (9.25–101.5), respectively. Quartile analyses provided a similar result. The fourth (136.2–221.65) group had the highest OR (95% CI) of 1.71 (1.29, 2.25) for the unadjusted model. The ORs (95% CI) of the third (113.7–136.15) and the second (95.2–113.65) groups were 1.37 (1.03, 1.83) and 1.14 (0.85, 1.54) for unadjusted model. To evaluate the performance of PLR in predating diabetic patients with or without depression, we performed ROC curve (Figure 1) and evaluated the value of AUC as 0.559.
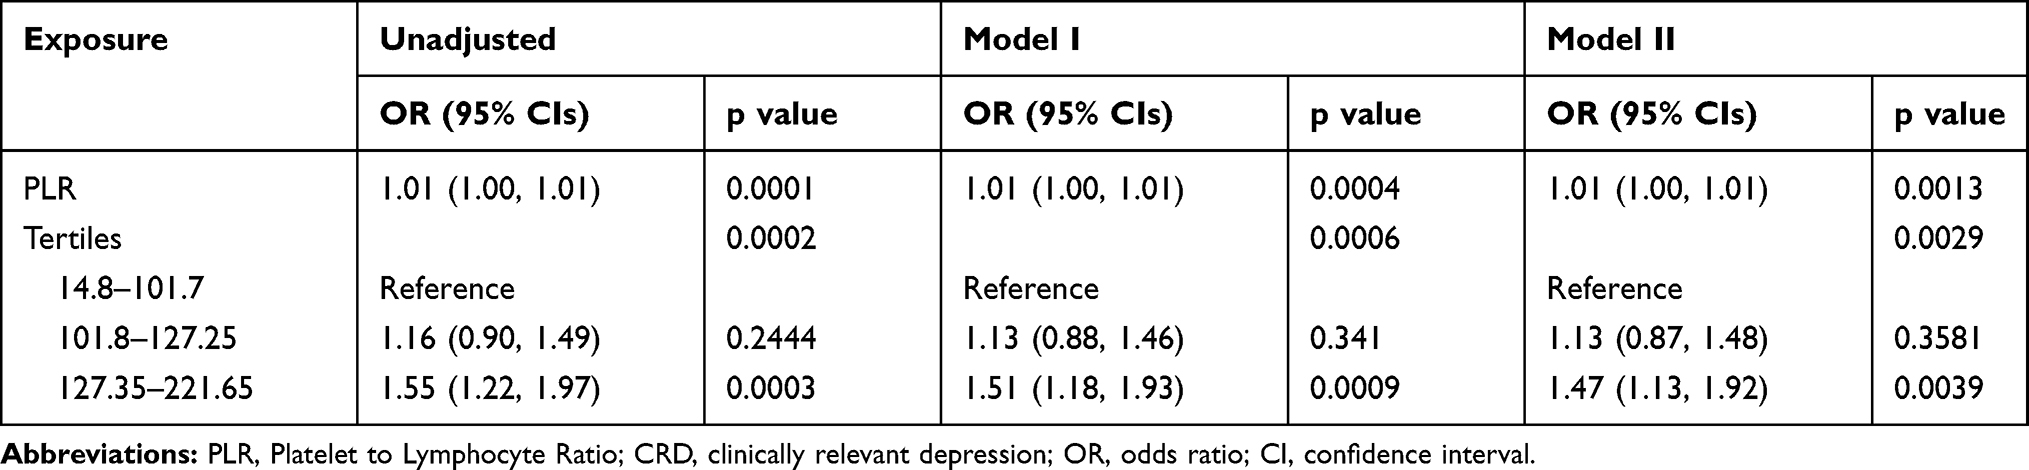 |
Table 2 Associations of PLR with CRD in Diabetes Patients |
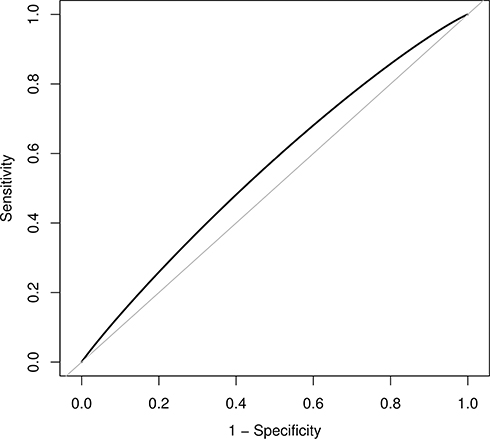 |
Figure 1 Performance of PLR levels in prediction of CRD in diabetes. AUC = 0.559. |
PLR and Suicide Tendency in Diabetes Patients
The relationship between PLR and suicide tendency in depression diabetic patients is shown in Table 3. The OR (95% CI) of PLR about suicide tendency was 1.000 (0.995, 1.006) in unadjusted model, 1.000 (0.994, 1.005) in model I and 0.998 (0.992, 1.005) in model II. This result confirmed that no significant relationship was found between PLR and suicide tendency in diabetic patients; even when they were divided into three groups, the relationship was statistically non-significant.
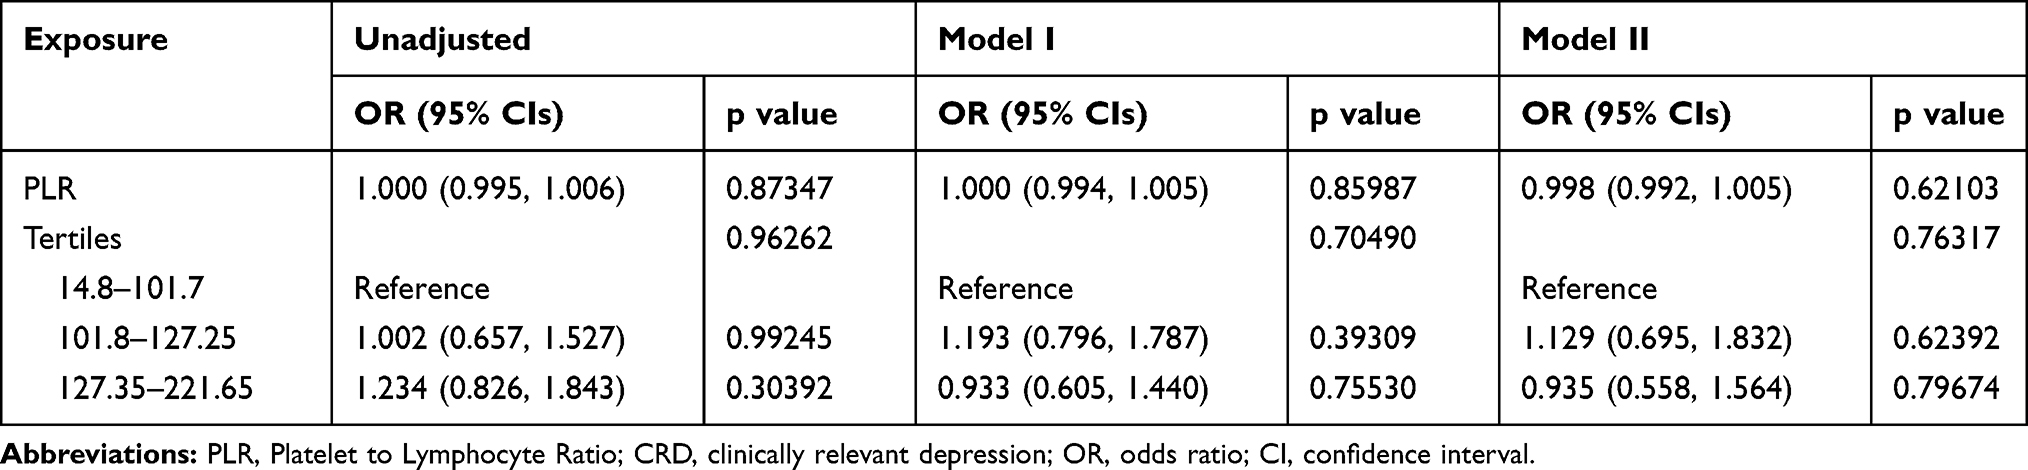 |
Table 3 Associations of PLR with Suicidal Tendency |
Nonlinear Association Between PLR and Depression in Diabetics
For more investigation, the smooth curve fit was performed, resulting in a U-shaped line (Figure 2). The curve suggested that a relationship between PLR and the risk of CRD in DM patients appeared to be nonlinear. We then established a two-piecewise linear regression model (Table 4). We found that the break points was 69.2, and when PLR value was higher than 69.2, the OR (95% CI) was 1.00 (1.00, 1.01). Meanwhile, when the value was lower than 69.2, the OR (95% CI) was 0.97 (0.95, 1.00).
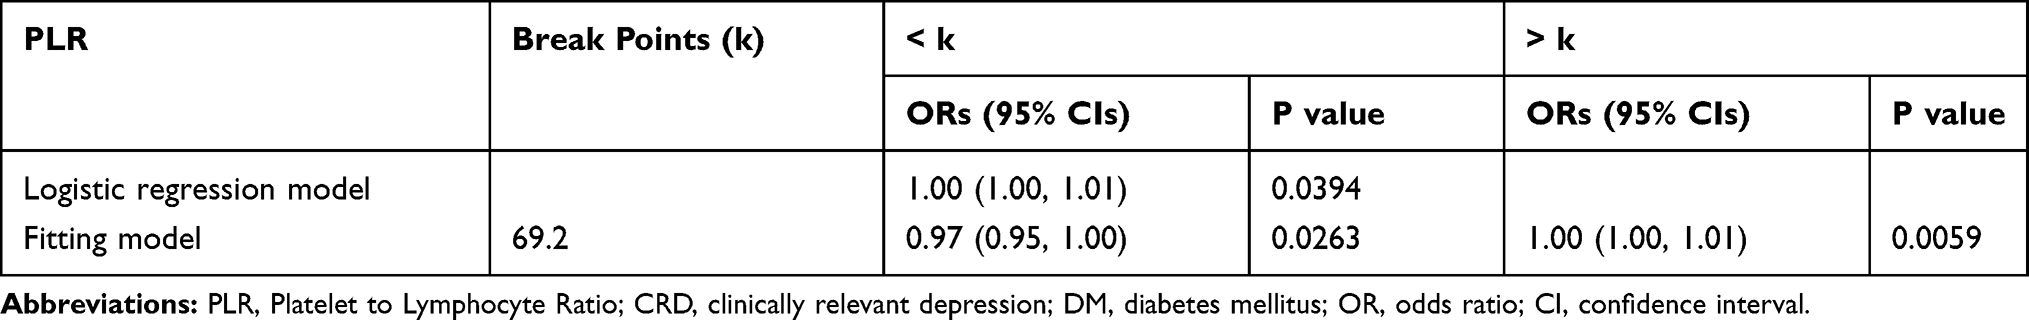 |
Table 4 Non-Linear Association Between PLR with CRD in DM Patients |
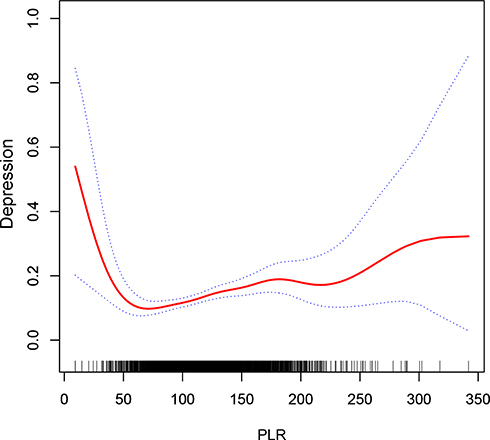 |
Figure 2 Relationship of PLR with CRD in patients with diabetes mellitus. Dashed lines are 95% confidence intervals. |
Discussion
We investigated the association between PLR and depression in diabetic patients in a cohort of the United States population. PLR was considered an independent risk factor for CRD in DM patients. The prevalence of depression in diabetic patients manifested a nonlinear correlation with PLR, and a nonlinear relationship was observed with increasing PLR value. When the value of PLR was around 69.2, the risk of CRD was the lowest. The risks increased in patients with PLR values that were higher or lower PLR than 69.2. We have also explored the relation between PLR and suicidal tendencies, and found no direct association between both.
High value of PLR had been used to predict poor state and to do the prognosis of malignancies, mental disorders and cardiovascular diseases.24–26 Ozdin and colleagues reported that PLR values were higher in patients with bipolar disorder and schizophrenia than patients in controls.27 Higher values of PLR were also found in patients who had major depression with psychotic features.28 While low value of PLR also helped predicting and delimitating the prognosis value of some diseases. Önalan et al found that hypothyroidism patients had lower PLR than individuals with subclinical hypothyroidism.29 PLR was negative associated with the duration of alcohol use in patients with a history of substance abuse.30 Those studies partly supported our conclusion that high and low values of PLR all increased risk of depression in diabetes patients.
As mentioned above, inflammation play a key role in the pathogenesis of diabetes and depression. Inflammation activation is often followed by high cortisol levels that may suppress the inflammation and production of lymphocytes.31 Zorrilla et al found that depressed patients had decreased proliferative responses to lymphocytes.32 Reduced lymphocyte counts caused by stress-induced immune dysfunction indicated poor state of health and psychological pressure. Since platelets act as a modulator in the immune system. The uptake and release of serotonin by platelets is an immune modulator for immunocytes.33–35 It has been verified that serotonin reduced the proliferation of lymphocytes, decreased the production of proinflammatory cytokines, and increase the levels of anti-inflammatory cytokines.36 In contrast, elevated and activated platelets might initiate, maintain and modulate inflammatory responses in depressed patients.11 Dietrich-Muszalska et al reported that activation of platelets resulting in aggregation of blood platelets induced by inflammation mediators in patients with mental disease was higher than controls.37 Considering the features of platelets and lymphocytes together, we proposed a hypothesis. We regard PLR as a marker indicating the stable state of the immune system. Low PLR values are assumed to represent low capacity of immunoregulation in platelets or/and high levels of pro-inflammation factors caused by lymphocytosis. Conversely, high PLR values suggest that hyperactivation of platelets or/and lymphopenia resulting from stress system activation leads to abnormal immunologic functions. The results in susceptibility to depression. The hypothesis may partly explain why odds of depression followed a U-shaped curve with respect to PLR.
The AUC of PLR was less accurate (AUC = 0.559) and only had a weak predictive ability for depression in DM patients. This might be partly due to the nonlinear relationship between both. In addition, the association between neutrophil to lymphocyte ratio (NLR) and depression in DM patients has been already discussed in previous studies.38 We also found a nonlinear relationship between NLR and depression in DM. Even though using NLR and PLR independently can be helpful to predict depression, combination of both is plausible. Hirahara et al combined NLR and PLR into a single NLR-PLR score.39 They found that the NLR-PLR score was more effective to predict and do the prognostic of advanced gastric cancer.
We identified an association between PLR and depression morbidity in diabetic patients. Nevertheless, there are some limitations in our study. First, the single database may introduce bias. Second, the biological mechanisms of the relationship between PLR and depression in diabetes remain to be studied. Also, we only measured PLR, so other inflammatory mediators were not considered. Various processes in the inflammatory response with different inflammatory mediators were not addressed in this research.
Conclusion
PLR is an independence risk factor for CRD in DM patients, and the relationship between them is nonlinear. The lowest risk of CRD in diabetic patients was found in patients with PLR around 69.2. We have found no relation between PLR and suicidal tendencies. Nevertheless, the mechanism of PLR nonlinear shaped associated with depression requires further research.
Data Sharing Statement
All the data used to support this study are available from the corresponding author upon request.
Funding
There are no funding supporting this article.
Disclosure
The authors declare that there is no conflict of interest.
References
1. Battle DE. Diagnostic and statistical manual of mental disorders (DSM). CoDAS. 2013;25(2):191–192.
2. Roy T, Lloyd CE. Epidemiology of depression and diabetes: a systematic review. J Affect Disord. 2012;142:S8–S21. doi:10.1016/S0165-0327(12)70004-6
3. Goldney RD, Phillips PJ, Fisher LJ, Wilson DH. Diabetes, depression, and quality of life: a population study. Diabetes Care. 2004;27(5):1066–1070. doi:10.2337/diacare.27.5.1066
4. Egede LE. Diabetes, major depression, and functional disability among US adults. Diabetes Care. 2004;27(2):421–428. doi:10.2337/diacare.27.2.421
5. Egede LE, Zheng D, Simpson K. Comorbid depression is associated with increased health care use and expenditures in individuals with diabetes. Diabetes Care. 2002;25(3):464–470. doi:10.2337/diacare.25.3.464
6. Kroenke K, Spitzer RL, Williams JB. The PHQ-9: validity of a brief depression severity measure. J Gen Intern Med. 2001;16(9):606–613. doi:10.1046/j.1525-1497.2001.016009606.x
7. Gilbody S, Richards D, Brealey S, Hewitt C. Screening for depression in medical settings with the Patient Health Questionnaire (PHQ): a diagnostic meta-analysis. J Gen Intern Med. 2007;22(11):1596–1602. doi:10.1007/s11606-007-0333-y
8. Lustman PJ, Clouse RE, Carney RM. Depression and the reporting of diabetes symptoms. Int J Psychiatry Med. 1988;18(4):295–303. doi:10.2190/LW52-JFKM-JCHV-J67X
9. Crook M. Type 2 diabetes mellitus: a disease of the innate immune system? An update. Diabet Med. 2004;21(3):203–207. doi:10.1046/j.1464-5491.2003.01030.x
10. Wang X, Bao W, Liu J, et al. Inflammatory markers and risk of type 2 diabetes: a systematic review and meta-analysis. Diabetes Care. 2013;36(1):166–175. doi:10.2337/dc12-0702
11. Raison CL, Capuron L, Miller AH. Cytokines sing the blues: inflammation and the pathogenesis of depression. Trends Immunol. 2006;27(1):24–31.
12. Moulton CD, Pickup JC, Ismail K. The link between depression and diabetes: the search for shared mechanisms. Lancet Diabetes Endocrinol. 2015;3(6):461–471. doi:10.1016/S2213-8587(15)00134-5
13. Lontchi-Yimagou E, Sobngwi E, Matsha TE, Kengne AP. Diabetes mellitus and inflammation. Curr Diab Rep. 2013;13(3):435–444. doi:10.1007/s11892-013-0375-y
14. Najjar S, Pearlman DM, Alper K, Najjar A, Devinsky O. Neuroinflammation and psychiatric illness. J Neuroinflammation. 2013;10:43.
15. Kara M, Uysal S, Altinisik U, Cevizci S, Guclu O, Derekoy FS. The pre-treatment neutrophil-to-lymphocyte ratio, platelet-to-lymphocyte ratio, and red cell distribution width predict prognosis in patients with laryngeal carcinoma. Eur Arch Oto-Rhino-L. 2017;274(1):535–542. doi:10.1007/s00405-016-4250-8
16. Zhang J, Zhang HY, Li J, Shao XY, Zhang CX. The elevated NLR, PLR and PLT may predict the prognosis of patients with colorectal cancer: a systematic review and meta-analysis. Oncotarget. 2017;8(40):68837–68846. doi:10.18632/oncotarget.18575
17. Alan S, Tuna S, Turkoglu EB. The relation of neutrophil-to-lymphocyte ratio, platelet-to-lymphocyte ratio, and mean platelet volume with the presence and severity of Behcet’s syndrome. Kaohsiung J Med Sci. 2015;31(12):626–631. doi:10.1016/j.kjms.2015.10.010
18. Varim C, Varim P, Acar BA, et al. Usefulness of the platelet-to-lymphocyte ratio in predicting the severity of carotid artery stenosis in patients undergoing carotid angiography. Kaohsiung J Med Sci. 2016;32(2):86–90. doi:10.1016/j.kjms.2015.12.007
19. Uslu AU, Kucuk A, Sahin A, et al. Two new inflammatory markers associated with disease activity score-28 in patients with rheumatoid arthritis: neutrophil-lymphocyte ratio and platelet-lymphocyte ratio. Int J Rheum Dis. 2015;18(7):731–735. doi:10.1111/1756-185X.12582
20. Kurtul A, Yarlioglues M, Murat SN, et al. Usefulness of the platelet-to-lymphocyte ratio in predicting angiographic reflow after primary percutaneous coronary intervention in patients with acute ST-segment elevation myocardial infarction. Am J Cardiol. 2014;114(3):342–347. doi:10.1016/j.amjcard.2014.04.045
21. Atak B, Aktas G, Duman TT, Erkus E, Kocak MZ, Savli H. Diabetes control could through platelet-to-lymphocyte ratio in hemograms. Rev Assoc Med Bras. 2019;65(1):38–42. doi:10.1590/1806-9282.65.1.38
22. Mazza MG, Lucchi S, Tringali AGM, Rossetti A, Botti ER, Clerici M. Neutrophil/lymphocyte ratio and platelet/lymphocyte ratio in mood disorders: a meta-analysis. Prog Neuropsychopharmacol Biol Psychiatry. 2018;84(Pt A):229–236. doi:10.1016/j.pnpbp.2018.03.012
23. Manea L, Gilbody S, McMillan D. Optimal cut-off score for diagnosing depression with the Patient Health Questionnaire (PHQ-9): a meta-analysis. CMAJ. 2012;184(3):E191–6. doi:10.1503/cmaj.110829
24. Krenn-Pilko S, Langsenlehner U, Thurner EM, et al. The elevated preoperative platelet-to-lymphocyte ratio predicts poor prognosis in breast cancer patients. Br J Cancer. 2014;110(10):2524–2530. doi:10.1038/bjc.2014.163
25. Inaoka K, Kanda M, Uda H, et al. Clinical utility of the platelet-lymphocyte ratio as a predictor of postoperative complications after radical gastrectomy for clinical T2–4 gastric cancer. World J Gastroenterol. 2017;23(14):2519–2526. doi:10.3748/wjg.v23.i14.2519
26. Ozyurt G, Binici NC. The neutrophil-lymphocyte ratio and platelet-lymphocyte ratio in adolescent obsessive-compulsive disorder: does comorbid anxiety disorder affect inflammatory response? Psychiatry Res. 2019;272:311–315. doi:10.1016/j.psychres.2018.12.131
27. Ozdin S, Sarisoy G, Boke O. A comparison of the neutrophil-lymphocyte, platelet-lymphocyte and monocyte-lymphocyte ratios in schizophrenia and bipolar disorder patients - a retrospective file review. Nord J Psychiatry. 2017;71(7):509–512.
28. Kayhan F, Gunduz S, Ersoy SA, Kandeger A, Annagur BB. Relationships of neutrophil-lymphocyte and platelet-lymphocyte ratios with the severity of major depression. Psychiatry Res. 2017;247:332–335. doi:10.1016/j.psychres.2016.11.016
29. Önalan E, Donder E. Neutrophil and platelet to lymphocyte ratio in patients with hypothyroid Hashimoto’s thyroiditis. Acta Biomed. 2020;91(2):310–314.
30. Orum MH, Kara MZ. Platelet to lymphocyte ratio (PLR) in alcohol use disorder. J Immunoassay Immunochem. 2020;41(2):184–194. doi:10.1080/15321819.2019.1705853
31. Shankaran V, Ikeda H, Bruce AT, et al. Pillars article: iFNγ and lymphocytes prevent primary tumour development and shape tumour immunogenicity. J Immunol. 2018;201(3):827–831.
32. Zorrilla EP, Luborsky L, McKay JR, et al. The relationship of depression and stressors to immunological assays: a meta-analytic review. Brain Behav Immun. 2001;15(3):199–226. doi:10.1006/brbi.2000.0597
33. Bakken AM, Staeffler A, Jørgensen HA, Holmsen H. Glycerophospholipid molecular species in platelets and brain tissues - are platelets a good model for neurons? Platelets. 2006;17(7):484–492. doi:10.1080/09537100600759196
34. Berk M, Plein H, Belsham B. The specificity of platelet glutamate receptor supersensitivity in psychotic disorders. Life Sci. 2000;66(25):2427–2432. doi:10.1016/S0024-3205(00)80002-8
35. Dietrich-Muszalska A, Olas B, Rabe-Jablonska J. Oxidative stress in blood platelets from schizophrenic patients. Platelets. 2005;16(7):386–391. doi:10.1080/09537100500128872
36. Owens MJ, Nemeroff CB. Role of serotonin in the pathophysiology of depression: focus on the serotonin transporter. Clin Chem. 1994;40(2):288–295. doi:10.1093/clinchem/40.2.288
37. Dietrich-Muszalska A, Olas B. The changes of aggregability of blood platelets in schizophrenia. World J Biol Psychiatry. 2009;10(2):171–176. doi:10.1080/15622970701557993
38. Wang J, Zhou D, Li X. The association between neutrophil-to-lymphocyte ratio and diabetic depression in U.S. adults with diabetes: findings from the 2009–2016 National Health and Nutrition Examination Survey (NHANES). Biomed Res Int. 2020;2020:8297628.
39. Hirahara T, Arigami T, Yanagita S, et al. Combined neutrophil-lymphocyte ratio and platelet-lymphocyte ratio predicts chemotherapy response and prognosis in patients with advanced gastric cancer. BMC Cancer. 2019;19(1):672. doi:10.1186/s12885-019-5903-y
 © 2021 The Author(s). This work is published and licensed by Dove Medical Press Limited. The full terms of this license are available at https://www.dovepress.com/terms.php and incorporate the Creative Commons Attribution - Non Commercial (unported, v3.0) License.
By accessing the work you hereby accept the Terms. Non-commercial uses of the work are permitted without any further permission from Dove Medical Press Limited, provided the work is properly attributed. For permission for commercial use of this work, please see paragraphs 4.2 and 5 of our Terms.
© 2021 The Author(s). This work is published and licensed by Dove Medical Press Limited. The full terms of this license are available at https://www.dovepress.com/terms.php and incorporate the Creative Commons Attribution - Non Commercial (unported, v3.0) License.
By accessing the work you hereby accept the Terms. Non-commercial uses of the work are permitted without any further permission from Dove Medical Press Limited, provided the work is properly attributed. For permission for commercial use of this work, please see paragraphs 4.2 and 5 of our Terms.