")
Back to Journals » International Journal of General Medicine » Volume 15
The p53 Pathway Related Genes Predict the Prognosis of Colon Cancer
Authors Feng J
Received 4 November 2021
Accepted for publication 22 December 2021
Published 6 January 2022 Volume 2022:15 Pages 169—177
DOI https://doi.org/10.2147/IJGM.S346280
Checked for plagiarism Yes
Review by Single anonymous peer review
Peer reviewer comments 4
Editor who approved publication: Dr Scott Fraser
Jinggao Feng
Department of Gastrointestinal and Anorectal Surgery, The Central Hospital of Yongzhou, Yongzhou City, Hunan Province, 425100, People’s Republic of China
Correspondence: Jinggao Feng Email [email protected]
Background: Colon cancer is a common gastrointestinal malignancy. This study aimed to explore the relationship between p53 pathway-related genes and prognosis of colon cancer.
Methods: The mRNA datasets of colon cancer and adjacent tissues were downloaded from The Cancer Genome Atlas (TCGA) database, and the differential expression of genes in two groups was analyzed. Then, P53 pathway-related genes were intersected with differentially expressed genes (DEGs) to obtain P53 pathway-related differentially expressed genes. Then, overall survival (OS), disease-specific survival (DSS), and progression-free survival (PFS) in clusters were compared by consistent cluster analysis. Univariate and multivariate Cox regression analysis of DEGs was performed to obtain survival-related DEGs. Risk scores were calculated for each sample based on survival-related DEGs, and patients were divided into high/low risk scores. Prognostic differences, tumor immune cell infiltration levels, and immune pathway activation status were compared between the two groups.
Results: We identified 28 DEGs and two clusters. There are significant differences in PFS between the two clusters (P=0.011), and no significant difference between OS and DSS. We obtained 3 DEGs (CDKN2A, BAK1, BTG1) that were significantly related to PFS, and CDKN2A was considered an independent prognostic factor. PFS showed statistically significant difference between high/low risk score groups (P=0.015). There were significant differences in immune cell infiltration level and immune pathway activity between two groups.
Conclusion: The p53 pathway-related genes are significantly related to PFS in colon cancer patients and play an important role in regulating the tumor immune microenvironment.
Keywords: colon cancer, p53, prognosis
Background
Colon cancer is one of the most common malignancies around the world. In 2020, more than 570,000 deaths and 1.1 million new cases were confirmed worldwide (http://gco.iarc.fr/). At present, the mainstream treatments for colon cancer include surgical resection, chemotherapy and radiotherapy, immunotherapy and targeted therapy. Because patients with early colon cancer have no symptoms and the risk groups are not taken seriously, most colon cancer patients are already at an advanced stage when they are diagnosed.1 Therefore, the discovery of more new therapeutic targets is essential for the treatment of colon cancer.
p53 is a tumor suppressor gene. Mutations of p53 gene have been found in more than 50% of human tumor tissues.2 It has been proven to play an important role in the process of colon adenoma canceration.3 The protein encoded by the p53 gene is a transcription factor, which is mainly distributed in the cell nucleus and can specifically bind to DNA to control the initiation of the cell cycle.4 The normal biological function of p53 is like a “genome guardian”. In the G1 phase, DNA damage is checked and the integrity of the genome is monitored, if there is DNA damage, the p53 protein prevents DNA replication to provide enough time for DNA repair, if the repair fails, p53 Protein triggers apoptosis.5 After the mutation of p53 gene, the tumor suppressor gene is transformed into an oncogene. Due to the changes in the spatial conformation of the encoded protein, the regulation of cell growth, apoptosis and DNA repair is lost, leading to the occurrence of cancer. The overexpression of p53 gene is associated with a higher recurrence rate and survival rate of colon cancer patients after surgery has been widely confirmed.6–8 In addition, the overexpression of p53 gene is also related to the clinicopathological features and chemotherapy efficacy of colon cancer.9–13 In recent years, the cell signal transduction pathway mediated by p53 gene has been gradually recognized.
Given the important position of p53 gene in the occurrence and prognosis of colon cancer, it is necessary to further clarify the relationship between p53 pathway-related genes and the prognosis of colon cancer. However, no relevant literature has been reported yet. This study aims to clarify the expression levels of p53 pathway-related genes in normal colon tissues and colon cancer tissues, analyze the prognostic value of these genes, and explore the correlation between p53 pathway-related genes and the tumor immune microenvironment.
Methods
Data Acquisition and Preparation
This study used samples clinicopathological and prognostic information from The Cancer Genome Atlas (TCGA) dataset, which was downloaded from an open-access resource website (https://www.cbioportal.org/).14 After removing invalid values and duplicate values from the data, obtain clinicopathological and prognostic information of 540 samples, including sex, age, stage, overall survival and status, disease-specific survival and status, progression-free survival and status. The mRNA data is downloaded in the TCGA database (https://www.cancer.gov/). After data sorting, 41 normal colon tissue mRNA data and 480 colon cancer tissue mRNA data are obtained. 200 p53 pathway-related genes were acquired from an open-access resource website (http://www.gsea-msigdb.org/gsea/msigdb/search.jsp), contributed by Arthur Liberzon (MSigDB team).
Statistical Analysis
The statistical analysis of this study was completed by R version 3.6.3 (http://www.r-project.org). P <0.05 on both sides is considered statistically significant. Through the “limma” package, the differentially expressed p53 pathway-related genes in normal colon tissues and colon cancer tissues that satisfy |log2FC| ≥ 1 and FDR<0.05 are screened out. A consistent cluster analysis was performed on 540 patients to explore the relationship between differentially expressed genes (DEGs) and colon cancer subtypes. The clustering variable (K) is set to 2~10, and the variable with the lowest correlation between the groups and the highest correlation within the group is selected and the corresponding cluster is obtained. The Kaplan-Meier method is used to compare overall survival (OS), disease-specific survival (DSS) and progression-free survival (PFS) between clusters and draw the corresponding survival curve. Carry out univariate and multivariate Cox regression analysis on DEGs and draw forest plots to obtain DEGs related to survival. The risk score of each patient was obtained by multiplying the expression of DEGs related to the survival of each patient by the corresponding regression coefficient and adding them. According to the median risk score, patients were divided into a low-risk score group and a high-risk score group. Based on survival-related DEGs, use the “prcomp” function and the “Rtsne” package to evaluate whether patients with different risks are well divided into two clusters through principal component analysis (PCA) and t-distributed Stochastic Neighbor Embedding (t-SNE), and used the Kaplan-Meier method to compare the survival differences between the two clusters. Match each patient’s risk score with clinicopathological information, perform univariate and multivariate Cox regression analysis and display it through a forest plot. Through the “limma” package, select DEGs in the high/low risk scoring group, and then uses the “clusterProfiler” package to analyze DEGs’ gene ontology(GO) enrichment analysis and Kyoto Encyclopedia of Genes and Genome(KEGG) pathway analysis.15 The “gsva” package is used to perform single-sample gene set enrichment analysis (ssGSEA) to calculate the proportion of infiltrating immune cells and evaluate the activity of immune-related pathways.
Results
We identified a total of 28 DEGs, including 6 up-regulated genes (SERPINB5, TNFSF9, DDIT4, CDKN2A, KLK8, TRIB3) and 22 down-regulated genes (TPRKB, FAM162A, HMOX1, SERTAD3, HDAC3, ZBTB16, KLF4, RXRA, TXNIP, BMP2, FAS, FUCA1, MXD1, BAK1, BTG1, NHLH2, CTSD, RETSAT, PTPRE, TGFA, PMM1, EPHX1). We found that when K=2, 480 samples can be well divided into two clusters according to the above DEGs (Figure 1A). There was a significant difference in PFS between the two clusters (P=0.011) (Figure 1B). There was no significant difference in OS and DSS between the two clusters (P=0.180; P=0.120, respectively) (Figure 1C and D), but it was different from cluster 1. In comparison, cluster 2 has better OS and DSS. The correlation between clusters and clinical characteristics including gender (Male or Female), age (<65 or ≥65 years), stage (Stage I–IV) and survival status (Censored or Progression) is shown in the heatmap, except for survival status, we found almost no difference in clinical characteristics between the two clusters (Figure 1E).
 |
Figure 1 Tumor classification based on p53 pathway related genes. (A) According to consistent cluster analysis (k=2), 480 colon patients were divided into two clusters; (B) Kaplan-Meier PFS curve of two clusters; (C) Kaplan-Meier OS curve of two clusters; (D) two clusters The Kaplan-Meier DSS curve; (E) Is a heat map based on two clusters, clinicopathological characteristics and PFS status. Abbreviations: PFS, progression free survival; OS, overall survival; DSS, disease free survival. |
By matching the DEGs with the patient’s PFS and status, and through univariate COX regression analysis, we obtained three survival-related DEGs (CDKN2A (HR = 1.0005, 95% CI: 1.0002–1.0009, P=0.0040), BAK1 (HR = 1.0000, 95% CI: 1.0000–1.0000, P=0.0143), BTG1 (HR = 1.0001, 95% CI: 1.0000–1.0001, P=0.0284), Figure 2A), the above survival-related DEGs were subjected to multivariate COX regression analysis, We found that the differential expression of CDKN2A gene has a significant effect on PFS (P=0.0281, Figure 2B). By calculating the risk score of each patient, the patients were divided into low-risk groups and high-risk groups. Both PCA and t-SNE showed that patients with different risks were well divided into two clusters (Figure 2D and E). As the risk score increases, the survival time of patients is relatively reduced, and the number of patients progressing increases (Figure 2C). There is a significant difference in PFS between the low-risk group and the high-risk group (P=0.015, Figure 2F). The univariate Cox regression analysis after matching the clinicopathological information with the risk score showed that the risk score is a significant indicator for predicting PFS of colon cancer ((HR = 1.6195, 95% CI: 1.0940–2.3975, P=0.016), Figure 3A) The multivariate COX regression analysis after adjusting for other confounding factors also showed that risk score is an independent prognostic factor for predicting PFS in colon cancer ((HR = 1.7008, 95% CI: 1.1479–2.5201, P=0.008), Figure 3B). In addition, based on the heatmap of the high/low risk score group and clinicopathological information, we only found that the patient’s survival status was significantly unevenly distributed between the high risk score group and the low risk score group (Figure 3C). Through GO analysis and KEGG enrichment analysis, we believe that DEGs in the high/low risk score group are mainly related to the neutrophil-mediated immunity pathway, chemokine signaling pathway, Rap1 signaling pathway and MAPK signaling pathway (Figure 4A and B).
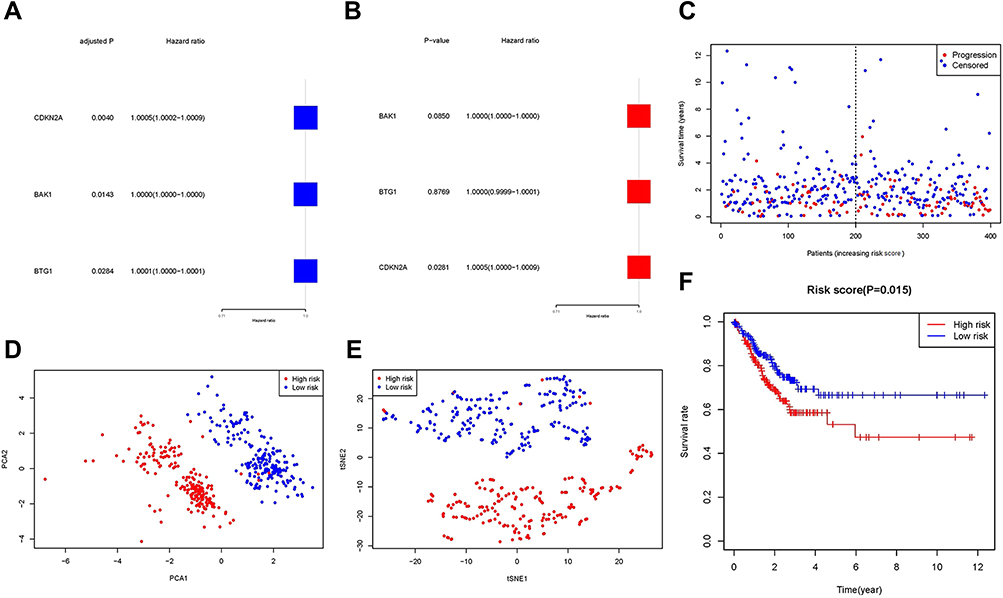 |
Figure 2 Construction of risk characteristics based on differentially expressed p53 pathway-related genes. (A and B) Univariate and multivariate Cox regression analysis based on differentially expressed p53 pathway-related genes; (C) PFS status of each patient (low-risk population: the left side of the dotted line; high-risk population: the right side of the dotted line); (D and E) Based on each PCA chart and tSNE chart of patient risk score; (F) Kaplan-Meier curve of PFS of high-risk group and low-risk group. Abbreviations: PFS, progression free survival; PCA, principal component analysis; tSNE, t-distributed Stochastic Neighbor Embedding. |
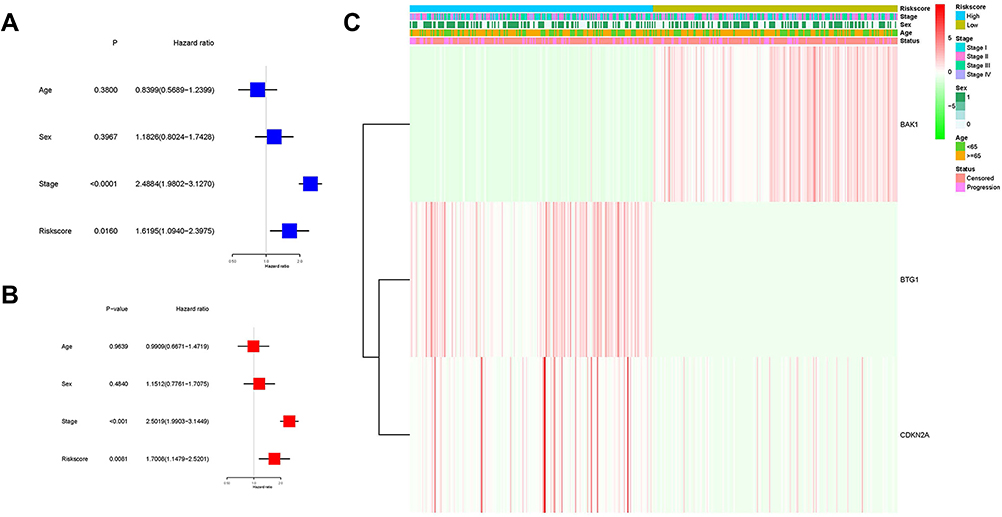 |
Figure 3 Univariate and multivariate Cox regression analysis of risk score. (A and B) Univariate and multivariate Cox regression analysis of risk score; (C) Heatmap based on risk score group, clinicopathological characteristics and PFS status. |
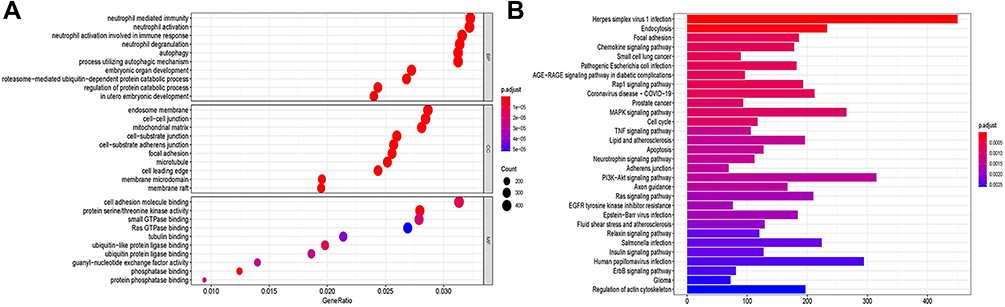 |
Figure 4 Functional analysis of DEGs between two risk groups. (A) GO enriched bubble chart (the larger the bubble, the more enriched genes, the darker the red, the more obvious the difference); (B) The bar chart of the KEGG pathway (the longer the bar indicates the more enriched genes, and the darker the red Indicates that the difference is more obvious). Abbreviations: DEGs, differentially expressed genes; GO, gene ontology; KEGG, Kyoto Encyclopedia of Genes and Genome. |
Based on functional analysis, we further compared the enrichment scores of 16 immune cells and the activity analysis of 13 immune-related pathways between the high and low risk score groups through ssGSEA. Immune cells with lower levels of infiltration in the high-risk group include activate dendritic cells (aDCs), B-cells, dendritic cells (DCs), immature dendritic cells (iDCs), Macrophages, Mast-cells, plasmacytoid dendritic cells (pDCs), and T helper (Th) cells (Tfh, Th1), tumor-infiltrating lymphocytes (TIL), and higher levels of infiltrating immune cells include Neutrophils, natural killer (NK) cells, T helper cells, and regulatory T (Treg) cells (Figure 5A). Except for human leukocyte antigen (HLA) pathway, major histocompatibility complex class 1 (MHC-class-1) pathway, parainflammation pathway, type-1 Interferon lambdas (IFN) response pathway, the activity of other immune pathways in the high-risk group is lower than that in the low-risk group (Figure 5B).
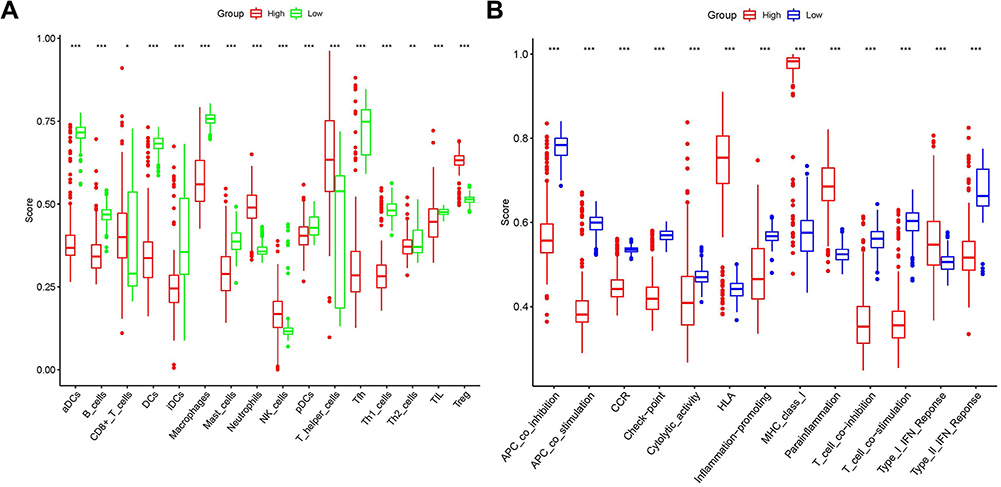 |
Figure 5 Comparison of the level of immune cell infiltration and the enrichment score of immune pathways between the two risk groups. (A) Comparison of 16 types of immune cells between the low-risk (green box) and high-risk (red box) groups; (B) Enrichment score of 13 immune-related pathways between the low-risk (blue box) and high-risk (red box) groups. *P<0.05, **P<0.01, ***P<0.001. |
Discussion
In this study, we first screened the differentially expressed p53 pathway-related genes in normal colon tissue and colon cancer tissue and obtained two clusters through consistent cluster analysis of DEGs. We found that there are significant differences in PFS between the two clusters. Unfortunately, The difference in OS and DSS between the two clusters is not significant, and there is no significant difference in clinicopathological information between the two clusters. To further explore the impact of these DEGs on PFS, three prognostic genes (CDKN2A, BAK1, BTG1) were obtained through univariate COX regression analysis, and one independent prognostic gene (CDKN2A) was obtained by multivariate COX regression analysis of the above three genes. The risk score of each patient was calculated based on 3 prognostic-related DEGs, and the patients were divided into high/low risk score groups based on the median risk score. There were significant differences in PFS between the high/low risk score groups. In addition, after matching the patient’s risk score group with gender, age and stage, univariate and multivariate COX regression analysis, we found that the risk score group can be used as an independent prognostic factor for PFS in colon cancer patients. The distribution of gender, age, and tumor stage between the high/low risk score groups was uniform. Functional analysis showed that DEGs between high/low risk groups were related to neutrophil-mediated immune-related pathways, chemokine signaling pathways, Rap1 signaling pathways, and MAPK signaling pathways. Comparing the level of infiltrating immune cells and the activity of immune-related pathways between the high/low risk groups, we did not find a general rule.
The p53-mediated cell signal transduction pathway plays an important role in mediating the normal life activities of cells. At the same time, the p53 gene is the gene with the highest correlation with human tumors so far, and its correlation with colon cancer has been widely studied and reported.2,3,16 However, in colon cancer, the relationship between p53 pathway-related genes and patient prognosis is still unclear. In our study, we identified 3 (CDKN2A, BAK1, BTG1) genes that are significantly related to PFS, and we believe that CDKN2A gene is an independent prognostic factor for PFS. The CDKN2A gene is also known as the multiple tumor suppressor gene. In 1993, Serrano et al discovered the Cyclin-dependent kinase inhibitor 2A (CDKN2A) gene when they used the yeast two-hybrid protein correlation screening method to study proteins that interact with cyclin dependent kinase 4 (CDK4).17 Early studies have shown that point mutations, deletions and methylation of CDKN2A gene may be related to cell senescence and cancer progression.18 In recent years, the close relationship between the expression level of CDKN2A gene and the occurrence and prognosis of gastrointestinal tumors has been reported successively,19,20 which are similar to our findings. CDKN2A gene β transcription product p14ARF can activate the p53 response, which is manifested by increased levels of MDM2 and p21CIP1 and cell cycle arrest in G1 and G2/M phases. In contrast, p53 gene negatively regulates p14ARF expression.21 BRI1-associated receptor kinase 1 (BAK1) is considered to be a gene that promotes apoptosis. Research by Shi et al showed that in bladder cancer, the down-regulation of BAK1 mediated by miR-125b may contribute to the progression of bladder cancer and resistance to treatment.22 In addition, in breast cancer, miR-125b-mediated down-regulation of BAK1 inhibits paclitaxel-induced apoptosis and leads to drug resistance. Restoring the expression of BAK1 can overcome miR-125-mediated paclitaxel resistance.23 The down-regulation of BAK1 is also associated with the occurrence of cervical cancer and non-small cell lung cancer.24,25 Regarding colon cancer, the latest research clarifies that miR-410 inhibits the expression of BAK1 and inhibits the pathway of cell apoptosis, leading to the occurrence of colorectal cancer.26 Our research further validates the previous research. p53 gene can induce the expression of BAK1, but the specific regulatory mechanism is still unclear.27 B-cell translocation gene 1 (BTG1), as an anti-proliferative gene, was first reported in B-cell chronic lymphocytic leukemia.28 However, Kamalakaran et al found that the high expression of BTG1 can promote the angiogenesis of breast cancer tumors.29 On the other hand, BTG1 is believed to inhibit breast cancer cell growth by inducing cell cycle arrest and apoptosis, and can reduce the possibility of metastasis.30,31 Therefore, the BTG1 gene may have different effects on different tissues. With further research, the relationship between down-regulation of BTG1 and the occurrence or prognosis of gastric cancer, bladder cancer, and kidney cancer has been gradually recognized.32–34 The latest meta-analysis proves that the BTG1 gene can be used as an important biomarker for solid tumors.35 At present, many studies have confirmed that the low expression of the BTG1 gene promotes the occurrence and invasion of colon cancer through a variety of ways and affects the prognosis of patients.36–40 It is a pity that there is no research on the regulatory relationship between the BTG1 gene and the p53 gene.
Until now, many mechanisms affect tumor progression and prognosis, and there may be interactions and coexistence among various mechanisms. The deletion or mutation of p53 gene not only promotes the malignant transformation of cells by changing the control of the cell cycle, but also promotes tumor growth by inhibiting the components of the immune system in the tumor microenvironment.41 GO analysis of DEGs in the high/low risk score group suggests that the immune response mediated by neutrophils may play a key role in the p53 gene-related pathway. In the immune cell enrichment analysis, we found that the neutrophil infiltration level of the high-risk group was significantly higher than that of the low-risk group. However, early studies have shown that in the early stages of tumor development, neutrophils can produce reactive oxygen species (ROS), and ROS-induced apoptosis signals can kill tumor cells.42 But Uribe-Querol et al believe that when ROS produced by neutrophils is not enough to kill tumor cells, it will promote tumor proliferation through genotoxicity and DNA damage.43 Therefore, neutrophils may play a double-edged sword in the process of tumorigenesis. The current mainstream view is that the deletion or mutation of p53 gene can lead to the decrease of MHC-I expression, resulting in a decrease in the activity of NK cells and a decrease in the level of Treg cell infiltration in the tumor microenvironment, leading to a poor prognosis.44 In addition, type I interferon can promote the tumor suppressor function of p53, and promote the infiltration of NK cells, macrophages and cytotoxic T cells in the tumor microenvironment, and enhance the killing of tumor cells.45,46 In this study, the opposite result was obtained. We believe that there are three possible reasons. First, there are differences in the immune infiltration components and the activity of immune pathways between the recurring tumor and the primary tumor. Second, the level of immune cells and the activation of immune pathways in the tumor microenvironment are the result of a comprehensive influence of multiple factors, and the immune system has complex internal controls. Third, although the level of immune cell infiltration is high, the activity of immune cells decreases or the tumor produces immune escape. This intricate immune microenvironment is also one of the important reasons for tumor proliferation, metastasis and recurrence, and further research is imminent.
Our research shows that three p53 pathway-related genes are significantly related to PFS in patients with colon cancer, and CDKN2A has been identified as an independent prognostic factor. In addition, we found that DEGs in the high/low risk score group were significantly related to the infiltrating cells of the tumor immune microenvironment and the activity of immune pathways. However, this research still has shortcomings. First, our data comes from public open-source databases, and the data may have a certain offset. Second, limited by the availability of data, all factors related to the prognosis of colon cancer have not been included in the study, such as tumor grade, nerve/vascular invasion, tumor location, etc. Third, there is no verification of the results.
Conclusion
p53 pathway-related genes play an important role in regulating the immune microenvironment of colon cancer and are significantly related to PFS in colon cancer patients.
Availability of Supporting Data
TCGA database belong to public databases. The patients involved in the database have obtained ethical approval. Users can download relevant data for free for research and publish relevant articles. This study was based on open source data, so there were no ethical issues.
Ethical Approval and Consent to Participate
The Ethics Committee of The Central Hospital of Yongzhou reviewed the study and deemed ethics approval was not necessary.
Consent for Publication
The author agrees to publish.
Acknowledgments
The author acknowledges TCGA database for providing their platforms and contributors for uploading their meaningful datasets.
Author Contributions
The author made a significant contribution to the work reported, whether that is in the conception, study design, execution, acquisition of data, analysis and interpretation, or in all these areas; took part in drafting, revising or critically reviewing the article; gave final approval of the version to be published; has agreed on the journal to which the article has been submitted; and agree to be accountable for all aspects of the work.
Funding
No funding was received.
Disclosure
The author reports no conflicts of interest in this work.
References
1. Okada T, Odagaki T, Lopez-Kostner F, et al. Colorectal cancer risk factors in asymptomatic Chilean population: a survey of international collaboration between Japan and Chile. Eur J Cancer Prev. 2020;29(2):127–133. doi:10.1097/CEJ.0000000000000531
2. Horvat A, Tadijan A, Vlašić I, Slade N. p53/p73 protein network in colorectal cancer and other human malignancies. Cancers. 2021;13(12):2885. doi:10.3390/cancers13122885
3. Güllülü Ö, Hehlgans S, Rödel C, Fokas E, Rödel F. Tumor suppressor protein p53 and inhibitor of apoptosis proteins in colorectal cancer-A promising signaling network for therapeutic interventions. Cancers. 2021;13(4):624. doi:10.3390/cancers13040624
4. Slattery ML, Mullany LE, Wolff RK, Sakoda LC, Samowitz WS, Herrick JS. The p53-signaling pathway and colorectal cancer: interactions between downstream p53 target genes and miRNAs. Genomics. 2019;111(4):762–771. doi:10.1016/j.ygeno.2018.05.006
5. Yang B, Stambrook PJ, Markowitz SD. Wild-type p53 demonstrates functional dominance in a human colon carcinoma cell line in which it induces reversible growth arrest. Clin Cancer Res. 1996;2(10):1639–1647.
6. Mohammed AA, Arif SH, Pity IS. P53 expression and micro-vessel density in relation with 5-year survival in patients with colorectal cancer. Ann Med Surg. 2020;57:311–314. doi:10.1016/j.amsu.2020.08.006
7. Wu Y, Li Y, Zhao X, et al. Combined detection of the expression of Nm23-H1 and p53 is correlated with survival rates of patients with stage II and III colorectal cancer. Oncol Lett. 2017;13(1):129–136. doi:10.3892/ol.2016.5425
8. Wang P, Liang J, Wang Z, Hou H, Shi L, Zhou Z. The prognostic value of p53 positive in colorectal cancer: a retrospective cohort study. Tumour Biol. 2017;39(5):1010428317703651. doi:10.1177/1010428317703651
9. Cao DZ, Ou XL, Yu T. The association of p53 expression levels with clinicopathological features and prognosis of patients with colon cancer following surgery. Oncol Lett. 2017;13(5):3538–3546. doi:10.3892/ol.2017.5929
10. Ji L, Wei Y, Jiang T, Wang S. Correlation of Nrf2, NQO1, MRP1, cmyc and p53 in colorectal cancer and their relationships to clinicopathologic features and survival. Int J Clin Exp Pathol. 2014;7(3):1124–1131.
11. Zhang K, Meng Y, Cao X, et al. Genetic variants in p53 signaling pathway genes predict chemotherapy efficacy in colorectal cancer. Cancer Med. 2019;8(7):3428–3436. doi:10.1002/cam4.2215
12. Oh HJ, Bae JM, Wen X, et al. p53 expression status is associated with cancer-specific survival in stage III and high-risk stage II colorectal cancer patients treated with oxaliplatin-based adjuvant chemotherapy. Br J Cancer. 2019;120(8):797–805. doi:10.1038/s41416-019-0429-2
13. Terranova-Barberio M, Pecori B, Roca MS, et al. Synergistic antitumor interaction between valproic acid, capecitabine and radiotherapy in colorectal cancer: critical role of p53. J Exp Clin Cancer Res. 2017;36(1):177. doi:10.1186/s13046-017-0647-5
14. Hoadley KA, Yau C, Hinoue T, et al. Cell-of-origin patterns dominate the molecular classification of 10,000 tumors from 33 types of cancer. Cell. 2018;173(2):291–304 e6. doi:10.1016/j.cell.2018.03.022
15. Yu G, Wang LG, Han Y, He QY. ClusterProfiler: an R package for comparing biological themes among gene clusters. OMICS. 2012;16(5):284–287. doi:10.1089/omi.2011.0118
16. Liebl MC, Hofmann TG. The role of p53 signaling in colorectal cancer. Cancers. 2021;13(9):2125. doi:10.3390/cancers13092125
17. Serrano M, Hannon GJ, Beach D. A new regulatory motif in cell-cycle control causing specific inhibition of cyclin D/CDK4. Nature. 1993;366(6456):704–707. doi:10.1038/366704a0
18. Liggett WH
19. Han J, Zhang X, Yang Y, Feng L, Wang GY, Zhang N. Screening and identification of differentially expressed genes expressed among left and right colon adenocarcinoma. Biomed Res Int. 2020;2020:8465068. doi:10.1155/2020/8465068
20. Vaseghi Maghvan P, Rezaei-Tavirani M, Zali H, et al. Network analysis of common genes related to esophageal, gastric, and colon cancers. Gastroenterol Hepatol Bed Bench. 2017;10(4):295–302.
21. Stott FJ, Bates S, James MC, et al. The alternative product from the human CDKN2A locus, p14(ARF), participates in a regulatory feedback loop with p53 and MDM2. EMBO J. 1998;17(17):5001–5014. doi:10.1093/emboj/17.17.5001
22. Shi XB, Xue L, Yang J, et al. An androgen-regulated miRNA suppresses Bak1 expression and induces androgen-independent growth of prostate cancer cells. Proc Natl Acad Sci U S A. 2007;104(50):19983–19988. doi:10.1073/pnas.0706641104
23. Zhou M, Liu Z, Zhao Y, et al. MicroRNA-125b confers the resistance of breast cancer cells to paclitaxel through suppression of pro-apoptotic Bcl-2 antagonist killer 1 (Bak1) expression. J Biol Chem. 2010;285(28):21496–21507. doi:10.1074/jbc.M109.083337
24. Wang YD, Cai N, Wu XL, Cao HZ, Xie LL, Zheng PS. OCT4 promotes tumorigenesis and inhibits apoptosis of cervical cancer cells by miR-125b/BAK1 pathway. Cell Death Dis. 2013;4(8):e760. doi:10.1038/cddis.2013.272
25. Gu XY, Wang J, Luo YZ, et al. Down-regulation of miR-150 induces cell proliferation inhibition and apoptosis in non-small-cell lung cancer by targeting BAK1 in vitro. Tumour Biol. 2014;35(6):5287–5293. doi:10.1007/s13277-014-1688-4
26. Liu C, Zhang A, Cheng L, Gao Y. miR‑410 regulates apoptosis by targeting Bak1 in human colorectal cancer cells. Mol Med Rep. 2016;14(1):467–473. doi:10.3892/mmr.2016.5271
27. Cosse JP, Ronvaux M, Ninane N, Raes MJ, Michiels C. Hypoxia-induced decrease in p53 protein level and increase in c-jun DNA binding activity results in cancer cell resistance to etoposide. Neoplasia. 2009;11(10):976–986. doi:10.1593/neo.09632
28. Rouault JP, Rimokh R, Tessa C, et al. BTG1, a member of a new family of antiproliferative genes. EMBO J. 1992;11(4):1663–1670. doi:10.1002/j.1460-2075.1992.tb05213.x
29. Kamalakaran S, Varadan V, Giercksky Russnes HE, et al. DNA methylation patterns in luminal breast cancers differ from non-luminal subtypes and can identify relapse risk independent of other clinical variables. Mol Oncol. 2011;5(1):77–92. doi:10.1016/j.molonc.2010.11.002
30. Zhu R, Zou ST, Wan JM, Li W, Li XL, Zhu W. BTG1 inhibits breast cancer cell growth through induction of cell cycle arrest and apoptosis. Oncol Rep. 2013;30(5):2137–2144. doi:10.3892/or.2013.2697
31. Li W, Zou ST, Zhu R, Wan JM, Xu Y, Wu HR. B‑cell translocation 1 gene inhibits cellular metastasis‑associated behavior in breast cancer. Mol Med Rep. 2014;9(6):2374–2380. doi:10.3892/mmr.2014.2118
32. Kanda M, Oya H, Nomoto S, et al. Diversity of clinical implication of B-cell translocation gene 1 expression by histopathologic and anatomic subtypes of gastric cancer. Dig Dis Sci. 2015;60(5):1256–1264. doi:10.1007/s10620-014-3477-8
33. Lu K, Liu C, Tao T, et al. MicroRNA-19a regulates proliferation and apoptosis of castration-resistant prostate cancer cells by targeting BTG1. FEBS Lett. 2015;589(13):1485–1490. doi:10.1016/j.febslet.2015.04.037
34. Sun G, Liu Q, Cheng Y, Hu W. B cell translocation gene 1 reduces the biological outcome of kidney cancer through induction of cell proliferation, cell cycle arrest, cell apoptosis and cell metastasis. Int J Mol Med. 2015;35(3):777–783. doi:10.3892/ijmm.2014.2058
35. Chen XQ, Meng FQ, Xiong H, Wang YL, Tang WH, Zou YM. Identification of BTG1 status in solid cancer for future researches using a system review and meta-analysis. Curr Med Sci. 2020;40(1):85–94. doi:10.1007/s11596-020-2150-z
36. He C, Yu T, Shi Y, et al. MicroRNA 301A promotes intestinal inflammation and colitis-associated cancer development by inhibiting BTG1. Gastroenterology. 2017;152(6):1434–48.e15. doi:10.1053/j.gastro.2017.01.049
37. Zhao S, Chen SR, Yang XF, et al. BTG1 might be employed as a biomarker for carcinogenesis and a target for gene therapy in colorectal cancers. Oncotarget. 2017;8(5):7502–7520. doi:10.18632/oncotarget.10649
38. Weng W, Liu N, Toiyama Y, et al. Novel evidence for a PIWI-interacting RNA (piRNA) as an oncogenic mediator of disease progression, and a potential prognostic biomarker in colorectal cancer. Mol Cancer. 2018;17(1):16. doi:10.1186/s12943-018-0767-3
39. Su C, Huang DP, Liu JW, Liu WY, Cao YO. miR-27a-3p regulates proliferation and apoptosis of colon cancer cells by potentially targeting BTG1. Oncol Lett. 2019;18(3):2825–2834. doi:10.3892/ol.2019.10629
40. Zhao S, Xue H, Hao CL, Jiang HM, Zheng HC. BTG1 overexpression might promote invasion and metastasis of colorectal cancer via decreasing adhesion and inducing epithelial-mesenchymal transition. Front Oncol. 2020;10:598192. doi:10.3389/fonc.2020.598192
41. Gun SY, Lee SWL, Sieow JL, Wong SC. Targeting immune cells for cancer therapy. Redox Biol. 2019;25:101174.
42. Liou GY, Storz P. Reactive oxygen species in cancer. Free Radic Res. 2010;44(5):2137–2144. doi:10.3109/10715761003667554
43. Uribe-Querol E, Rosales C. Neutrophils in cancer: two sides of the same coin. J Immunol Res. 2015;2015:983698. doi:10.1155/2015/983698
44. Sabapathy K, Nam SY. Defective MHC class I antigen surface expression promotes cellular survival through elevated ER stress and modulation of p53 function. Cell Death Differ. 2008;15(9):1364–1374. doi:10.1038/cdd.2008.55
45. Blagih J, Buck MD, Vousden KH, Lennon-Duménil A-M. p53, cancer and the immune response. J Cell Sci. 2020;133(5). doi:10.1242/jcs.237453
46. Ghosh M, Saha S, Bettke J, et al. Mutant p53 suppresses innate immune signaling to promote tumorigenesis. Cancer Cell. 2021;39(4):494–508 e5. doi:10.1016/j.ccell.2021.01.003
 © 2022 The Author(s). This work is published and licensed by Dove Medical Press Limited. The full terms of this license are available at https://www.dovepress.com/terms.php and incorporate the Creative Commons Attribution - Non Commercial (unported, v3.0) License.
By accessing the work you hereby accept the Terms. Non-commercial uses of the work are permitted without any further permission from Dove Medical Press Limited, provided the work is properly attributed. For permission for commercial use of this work, please see paragraphs 4.2 and 5 of our Terms.
© 2022 The Author(s). This work is published and licensed by Dove Medical Press Limited. The full terms of this license are available at https://www.dovepress.com/terms.php and incorporate the Creative Commons Attribution - Non Commercial (unported, v3.0) License.
By accessing the work you hereby accept the Terms. Non-commercial uses of the work are permitted without any further permission from Dove Medical Press Limited, provided the work is properly attributed. For permission for commercial use of this work, please see paragraphs 4.2 and 5 of our Terms.