Back to Journals » Psychology Research and Behavior Management » Volume 16
The Nonlinear Relationship Between Body Mass Index (BMI) and Perceived Depression in the Chinese Population
Authors Li C, Li X, Li Y, Niu X
Received 4 March 2023
Accepted for publication 1 June 2023
Published 9 June 2023 Volume 2023:16 Pages 2103—2124
DOI https://doi.org/10.2147/PRBM.S411112
Checked for plagiarism Yes
Review by Single anonymous peer review
Peer reviewer comments 3
Editor who approved publication: Professor Mei-Chun Cheung
Chao Li,1 Xiang Li,1 Yuming Li,1 Xiaoru Niu2
1Business School, Shandong University, Weihai, People’s Republic of China; 2School of Mechanical, Electrical & Information Engineering, Shandong University, Weihai, People’s Republic of China
Correspondence: Chao Li; Xiaoru Niu, Shandong University, No. 180 Wenhuaxi Road, Weihai, 264209, People’s Republic of China, Tel +86 631 5694065, Email [email protected]; [email protected]
Purpose: Existing studies on the association between BMI and depression report conflicting results with some demonstrating a positive relationship, while others a negative link or insignificant correlation. Very limited research on the nonlinear relationship between BMI and depression has yet to clarify the reliability and robustness of the potential nonlinearity and whether a more complex association exists. This paper aims to systematically investigate the nonlinear relationship between the two factors applying rigorous statistical methods, as well as explore the heterogeneity of their association.
Materials and Methods: A large-scale nationally representative dataset, Chinese General Social Survey, is used to empirically analyze the nonlinear relationship between BMI and perceived depression. Various statistical tests are employed to check the robustness of the nonlinearity.
Results: Results indicate that there is a U-shaped relationship between BMI and perceived depression, with the turning point (25.718) very close to while slightly larger than the upper limit of the range of healthy weight (18.500 ≤ BMI < 25.000) defined by World Health Organization. Both very high and low BMIs are associated with increased risk for depressive disorders. Furthermore, perceived depression is higher at almost all BMI levels among individuals who are older, female, lower educated, unmarried, in rural areas, belonging to ethnic minorities, non-Communist Party of China members, as well as those with lower income and uncovered by social security. In addition, these subgroups have smaller inflection points and their self-rated depression is more sensitive to BMI.
Conclusion: This paper confirms a significant U-shaped trend in the association between BMI and depression. Therefore, it is important to account for the variations in this relationship across different BMI categories when using BMI to predict depression risk. Besides, this study clarifies the management goals for achieving an appropriate BMI from a mental health perspective and identifies vulnerable subgroups at higher risk of depression.
Keywords: body mass index, self-rated depression, mental health, biopsychosocial model, Chinese population
Introduction
According to the World Health Organization, depression is a prevalent mental disorder affecting 5% of adults worldwide.1 Depression is linked with a host of diseases, including obesity, diabetes and cardiovascular illness.2,3 In particular, there is a correlation between obesity and depression, and it is found that obesity increases the risk of depression.4,5 This may be attributed to shared risk factors such as less-healthy eating habits, physical inactivity, disrupted sleeping patterns and substance abuse.6 However, the exact relationship between Body Mass Index (BMI) and depression is still unclear, which is a research gap this paper aims to fill.
On the one hand, some studies demonstrate a significant positive association between BMI and depression,7,8 finding that obese persons are at greater risk of depression for many reasons including physical inactivity, poorer quality of life and social prejudice.9 On the other hand, however, some studies find that high levels of BMI help to reduce the risk of depression,10 because a larger BMI means a higher reserve of muscle and skeletal mass, which helps to reduce depressive symptoms.11 In addition, some studies also find that the relationship between BMI and depression is not clear and there is no sufficient evidence to suggest a significant association between the two factors.12 This implies that the relationship between BMI and depression could be nonlinear, as suggested by a few papers exploring this connection.2,13–17 Nonetheless, due to data limitations, existing research suffers from the problem of inadequate observations to cover a wide range of populations and a lack of rigorous statistical checks.
Depression is one of the leading causes of disability worldwide and is a major contributor to the overall global burden of disease.1 Hence, it is important to clarify the relationship between BMI and depression in order to better understand the mechanism of depression from the perspective of body fatness. In view of this, this paper systematically explores the nonlinear relationship between BMI and perceived depression using a large-scale nationally representative dataset from Chinese General Social Survey (CGSS). Additionally, this study examines the robustness of the nonlinearity using various statistical techniques. Furthermore, this paper investigates the heterogeneity of the nonlinear relationship between BMI and perceived depression in multiple aspects.
Compared with the existing literature, the main contributions of this paper are stated as follows. First, this study deepens our understanding of the relationship between BMI and depression. Previous studies find either a positive, negative, or insignificant association between them.2,7,8,10,12–17 However, existing discussions on a nonlinear relationship fail to clarify what kind of nonlinearity it is, whether it is robust, and whether a more complex association exists. In this paper, the nonlinear relationship between BMI and perceived depression is systematically analyzed applying rigorous statistical methods. Second, this paper further extends the literature concerning the heterogeneity in the relationship between BMI and depression by revealing how the U-shaped relationship varies across different factors such as age, gender, education, marital status, region, race, political identity, income, and social security. Therefore, this research enhances our comprehension of the nonlinear relationship by assessing the differences between various subgroups in terms of the trend in the association between BMI and depression as well as the magnitude of the turning point.
Literature Review
Factors Impacting Depression
Research indicates that depression is affected by both personal and external factors, and existing literature has examined the factors influencing depression in the following aspects. First, demographic factors are found to have a major influence on depression. In particular, gender is an important factor.18 For example, chronic stress has more negative implications for women’s well-being compared to men,19 which suggests that women are more susceptible to depression than men under negative circumstances.20 Moreover, age is a robust predictor of depression risk,21 with numerous studies concentrating on depression in the elderly,22,23 where research suggests a positive association between depression and age.24 Further research delves into the area of subjective age and reveals that higher subjective age also poses a higher risk of depressive emotions.25,26
Second, in addition to demographic factors, human capital elements such as education and migration also have a significant effect on depression as studies have shown that education is positively associated with health literacy,27–29 thereby reducing the risk of depression.30 Furthermore, migrants and non-migrants experience different levels of quality of life which affects their self-rated depression.31–34 This risk is further compounded among children in the migrant population, because children in immigrant families may experience additional stressors related to their parents’ migration experience, such as separation from family members, changes in social networks, and exposure to discrimination.35,36 Third, social contextual factors also can impact depression. Economic gaps between urban and rural areas in developing countries are identified as an important contributor to disparity in people’s mental health.23,37 Additionally, a growing number of studies suggest that social problems brought about by urbanization, such as increased income inequality, contribute to higher prevalence of depression among urban dwellers.22,38,39 Religion and ethnicity can impact mental health, with religious beliefs potentially reducing depressive symptoms and religious conflicts increasing the risk of depression,40,41 while ethnic minorities may experience higher rates of depression due to limited access to medical resources.42–45
Fourth, work factors have a profound influence on mental health, particularly in terms of personal income, which determines standard of living and access to health care. Poorer income is associated with a higher risk of depression,46,47 as well as a prolonged accumulation of depressive symptoms preventing individuals from improving their economic status,48,49 consequently reducing the quality of employment and heightening the possibility of depression.50,51 In addition, social security can help to alleviate depression by providing people with more resources to cope with it.52–54 Fifth, family is integral to an individual’s life and significantly affects mental wellbeing,55,56 with the size of the family and the number of children within it tend to have a negative correlation with depression.57,58 However, larger families can also have lower quality of parental care, and consequently damage mental health.55,59,60 Besides, marriage status is an important factor influencing depressive symptoms, with unmarried people more susceptible to negative emotions.58
Body Mass Index and Its Effects
BMI is an internationally accepted measure to assess body fatness and is widely accepted as a reliable indicator of excess weight.61 Research demonstrates that being both underweight and overweight increases the possibility of illness, with both extremes of BMI being related to worse physical and mental health. To some degree, BMI reflects the amount of visceral fat and is thus used to predict many diseases, such as diabetes.62,63 Studies have shown that BMI levels correlate with body fatness as well as future health risks, and the widespread and longstanding application of BMI contributes to its utility at the population level.63
Existing research reveals that a high BMI is harmful to health because of the following reasons. On the one hand, large BMI is associated to a higher stroke risk and accelerates bone ageing.64,65 Additionally, fat accumulation signified by a high BMI can result in ventricular diastolic dysfunction, even leading to heart failure as well as ischemic and hypertensive heart disease.65–67 On the other hand, a combination of diabetes and large BMI often produces complex and severe complications,68 and even increases the risk of cancer.69,70 Moreover, high BMI is also linked with adverse outcomes in the next generation, as maternal high BMI has been shown to increase the risk of fetal malformations.71 Recent studies also suggest that large BMI is a major risk factor for hospitalization and mortality among patients with coronavirus disease (COVID-19).72,73 Consequently, it is clear that a high BMI carries an array of health problems.
At the same time, a low BMI also have an adverse effect on people’s health. Low BMI is known to disturb immune system, resulting in a series of health issues such as malnutrition, aortic stiffness, constipation and so on.74–76 Among these, malnutrition is the most common health problem associated with low BMI.77 When individuals lack adequate nutrition to maintain physical function, it can lead to a variety of health complications, including impaired cognitive development and increased mortality.78,79 Furthermore, it is found that severely small BMI might increase the risk of illness such as Parkinson’s disease, amyotrophic lateral sclerosis, chronic obstructive pulmonary disease, cardiovascular disease, as well as the comorbidities associated with them.75,80,81
Possible Relationship Between Body Mass Index and Depression
Due to the close relationship between physical and mental health, some studies have explored the relationship between extreme body mass indexes and mental health. However, existing literature on the association between BMI and depression mostly considers their linear relationship. For example, some studies use Structural Equation Modeling (SEM) to analyze the linear association between BMI and depression,8,82,83 detecting the bidirectional effects between the two factors.84 Moreover, descriptive analysis and Chi-square tests are used to demonstrate the strong association between high BMI and depressive symptoms, as well as the gender differences therein,7 which may be attributed to shared risk factors like reduced physical activity.85 Latent growth models are also employed to analyze the heterogeneous relationships between BMI and depression in terms of gender and socioeconomic factors,86 revealing that overweight men are at an increased risk of depression, while this association is not significant in women.87 Furthermore, multinomial logistic regression shows that depression is significantly and positively related to BMI.88
Although very limited studies have paid attention to the nonlinear relationship between BMI and depression,13,16 it still deserves further in-depth research. For instance, some studies fail to use samples with all BMI levels and neglect underweight individuals (BMI less than 18.5) or limit the analysis to certain cohorts such as students, middle-aged people or older adults.13–15 Moreover, studies on the nonlinearity largely rely on descriptive statistical methods and analysis of variance,2,13,16,17 failing to clarify the type and robustness of the nonlinear relationship between BMI and depressive symptoms. Based on a large-scale nationally representative dataset, this paper aims to investigate the nonlinearity between BMI and depression using a variety of rigorous statistical methods. Additionally, this research further explores the heterogeneity of the nonlinear association in various aspects, given the variations in the relationship between BMI and depression among different cohorts.89,90
Theoretical Framework, Materials and Methods
Theoretical Framework
As discussed in the literature review, results of the existing studies on the relationship between BMI and depression are still inconsistent, which could be attributed to the complexity of the relationship that involving multiple factors. The biopsychosocial model provides a systematic framework to understand the complex relationship between BMI and depression. This framework proposed by George Engel in 1977 is a generic model that emphasizes the importance of biophysical, psychological, and social factors in mental health.91 Unlike the traditional biomedical model that solely focuses on biological processes, the biopsychosocial model posits that these three aspects are interrelated and interact in a systematic and dynamic manner. This model has been widely accepted and used in various fields of health research and practice.92–94
First, biophysical factors such as age, gender, and physical health status, are an important component of the biopsychosocial model.92–94 For example, both very high and very low BMI are associated with a series of diseases,65,67,78,79 and this impact process may vary by age and gender.89 Second, psychological factors are also important in the biopsychosocial model. For example, stress and thinking patterns are examples of psychological factors that can influence health outcomes.95,96 Finally, social factors are an essential component of the biopsychosocial model. Social insurance, race, religious beliefs, and economic income are all examples of social factors that can influence mental health outcomes.93,97 For instance, individuals with lower income may have limited access to healthy food opportunities for physical activity, which can contribute to a higher BMI and further impact mental health.98 Based on this, we draw the following research framework for the study as shown in Figure 1.
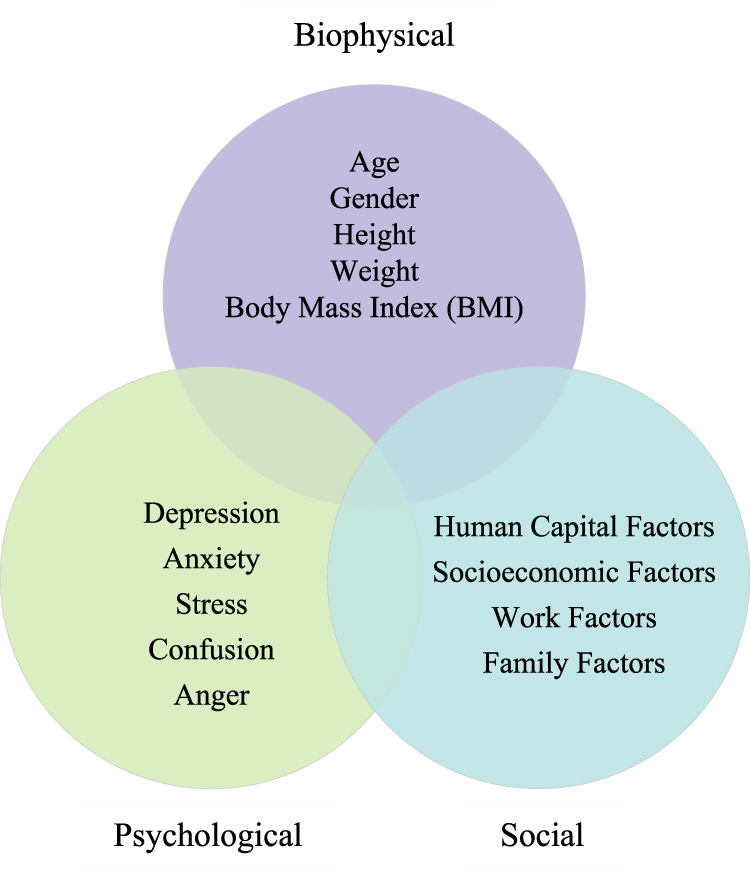 |
Figure 1 The biopsychosocial model. |
The biopsychosocial model, as depicted in Figure 1, offers a holistic perspective that emphasizes the interrelatedness of biological, psychological, and social factors in mental health.93,94 Within this theoretical framework, this study aims to examine the relationship between the biophysical factor of Body Mass Index (BMI) and the psychological factor of perceived depression. The biopsychosocial model highlights the need for a systematic exploration of this relationship that takes into account not only biophysical and psychological factors but also other relevant factors, particularly social factors impacting mental health. Thus, under this framework, we control the relevant variables comprehensively, including age, gender, and social elements in various aspects such as human capital factors, socioeconomic factors, work factors, and family factors. Based on this, we systematically investigate the complexity of the relationship between BMI and perceived depression. Furthermore, we explore the variations in the nonlinear relationship between BMI and depression across individuals with different biophysical, psychological, and social characteristics.
Data Sampling
Data used in this research are the Chinese General Social Survey (CGSS) from 2017 to 2018, which is one of the most important national, comprehensive and large-scale academic survey projects in China. CGSS systematically and comprehensively collects information on a wide range of aspects of individuals older than 18 years, such as health, employment, income, consumption, education, attitudes and family backgrounds. CGSS is carried out by the Chinese Social Survey Network (CSSN) organized by the National Survey Research Center at Renmin University of China (NSRC). The sampling of CGSS is based on the multi-stage stratified design to ensure national representativeness. CGSS uses Computer Aided Personal Interviewing, and has a set of strict quality control procedures, which cover pre-fieldwork, in-fieldwork, and after-fieldwork states. Data and details of CGSS can be accessed through its website (http://cgss.ruc.edu.cn/English/Home.htm).
The CGSS data have the following advantages in this study. First, this dataset covers adults of all ages, genders, education backgrounds, and income levels, and has a large sample size, which allows us to comprehensively examine the complex relationship between BMI and perceived depression. Second, CGSS investigates respondents’ self-rated depression, height, weight, and comprehensive factors affecting depression, facilitating the construction of various variables needed in this study.
Measures
Dependent Variables
The dependent variable in this study is the self-rated depression of the respondents, denoted as “Perceived depression”. This variable is derived from a question in the CGSS core module: “To what extent do you feel depressed?” Answers to this question are based on the adjectival scale from 1 to 5, including “1-not depressed”, “2-mildly depressed”, “3-moderately depressed”, “4-very depressed” and “5-severely depressed”, respectively. In order to address the potential measurement error due to different respondents’ varied understandings of the options provided, a dummy variable “Whether depressed” corresponding to above question is also constructed. “Whether depressed” is assigned a value of 1 when the respondent answers moderately, very or severely depressed, and 0 otherwise.
Explanatory Variables
The main explanatory variables of this paper are Body Mass Index (BMI) and its quadratic term. As discussed in the literature review, BMI is a reliable indicator of body fatness for most people, which is widely used to screen for weight categories that may lead to health problems. It is defined as a person’s weight in kilograms divided by the square of her/his height in meters (kg/m2). BMI provides the most useful population-level measure of overweight and obesity as it is the same for different sexes and for all ages of adults.99–101
Control Variables
Based on the literature concerning factors influencing people’s perceived depression,18,21,23,29,31,40,47,57,58 this paper controls as comprehensively as possible for six categories of control variables that affect depression, including demographic characteristics, human capital characteristics, social characteristics, working characteristics, family characteristics, as well as regional and time fixed effects. (1) Demographic characteristics include age, quadratic term of age and gender. (2) Human capital characteristics include education level and whether the respondent is a migrant. (3) Social characteristics include whether living in urban, whether belonging to ethnic minorities, whether being religious believer and whether being Communist Party of China (CPC) members. (4) Working characteristics include income, whether having pension and whether having medical insurance. (5) Family characteristics include whether married, family size, number of children and number of housing assets. (6) Regional and time characteristics control provincial and year dummies. Descriptive statistics for above variables are shown in Table 1.
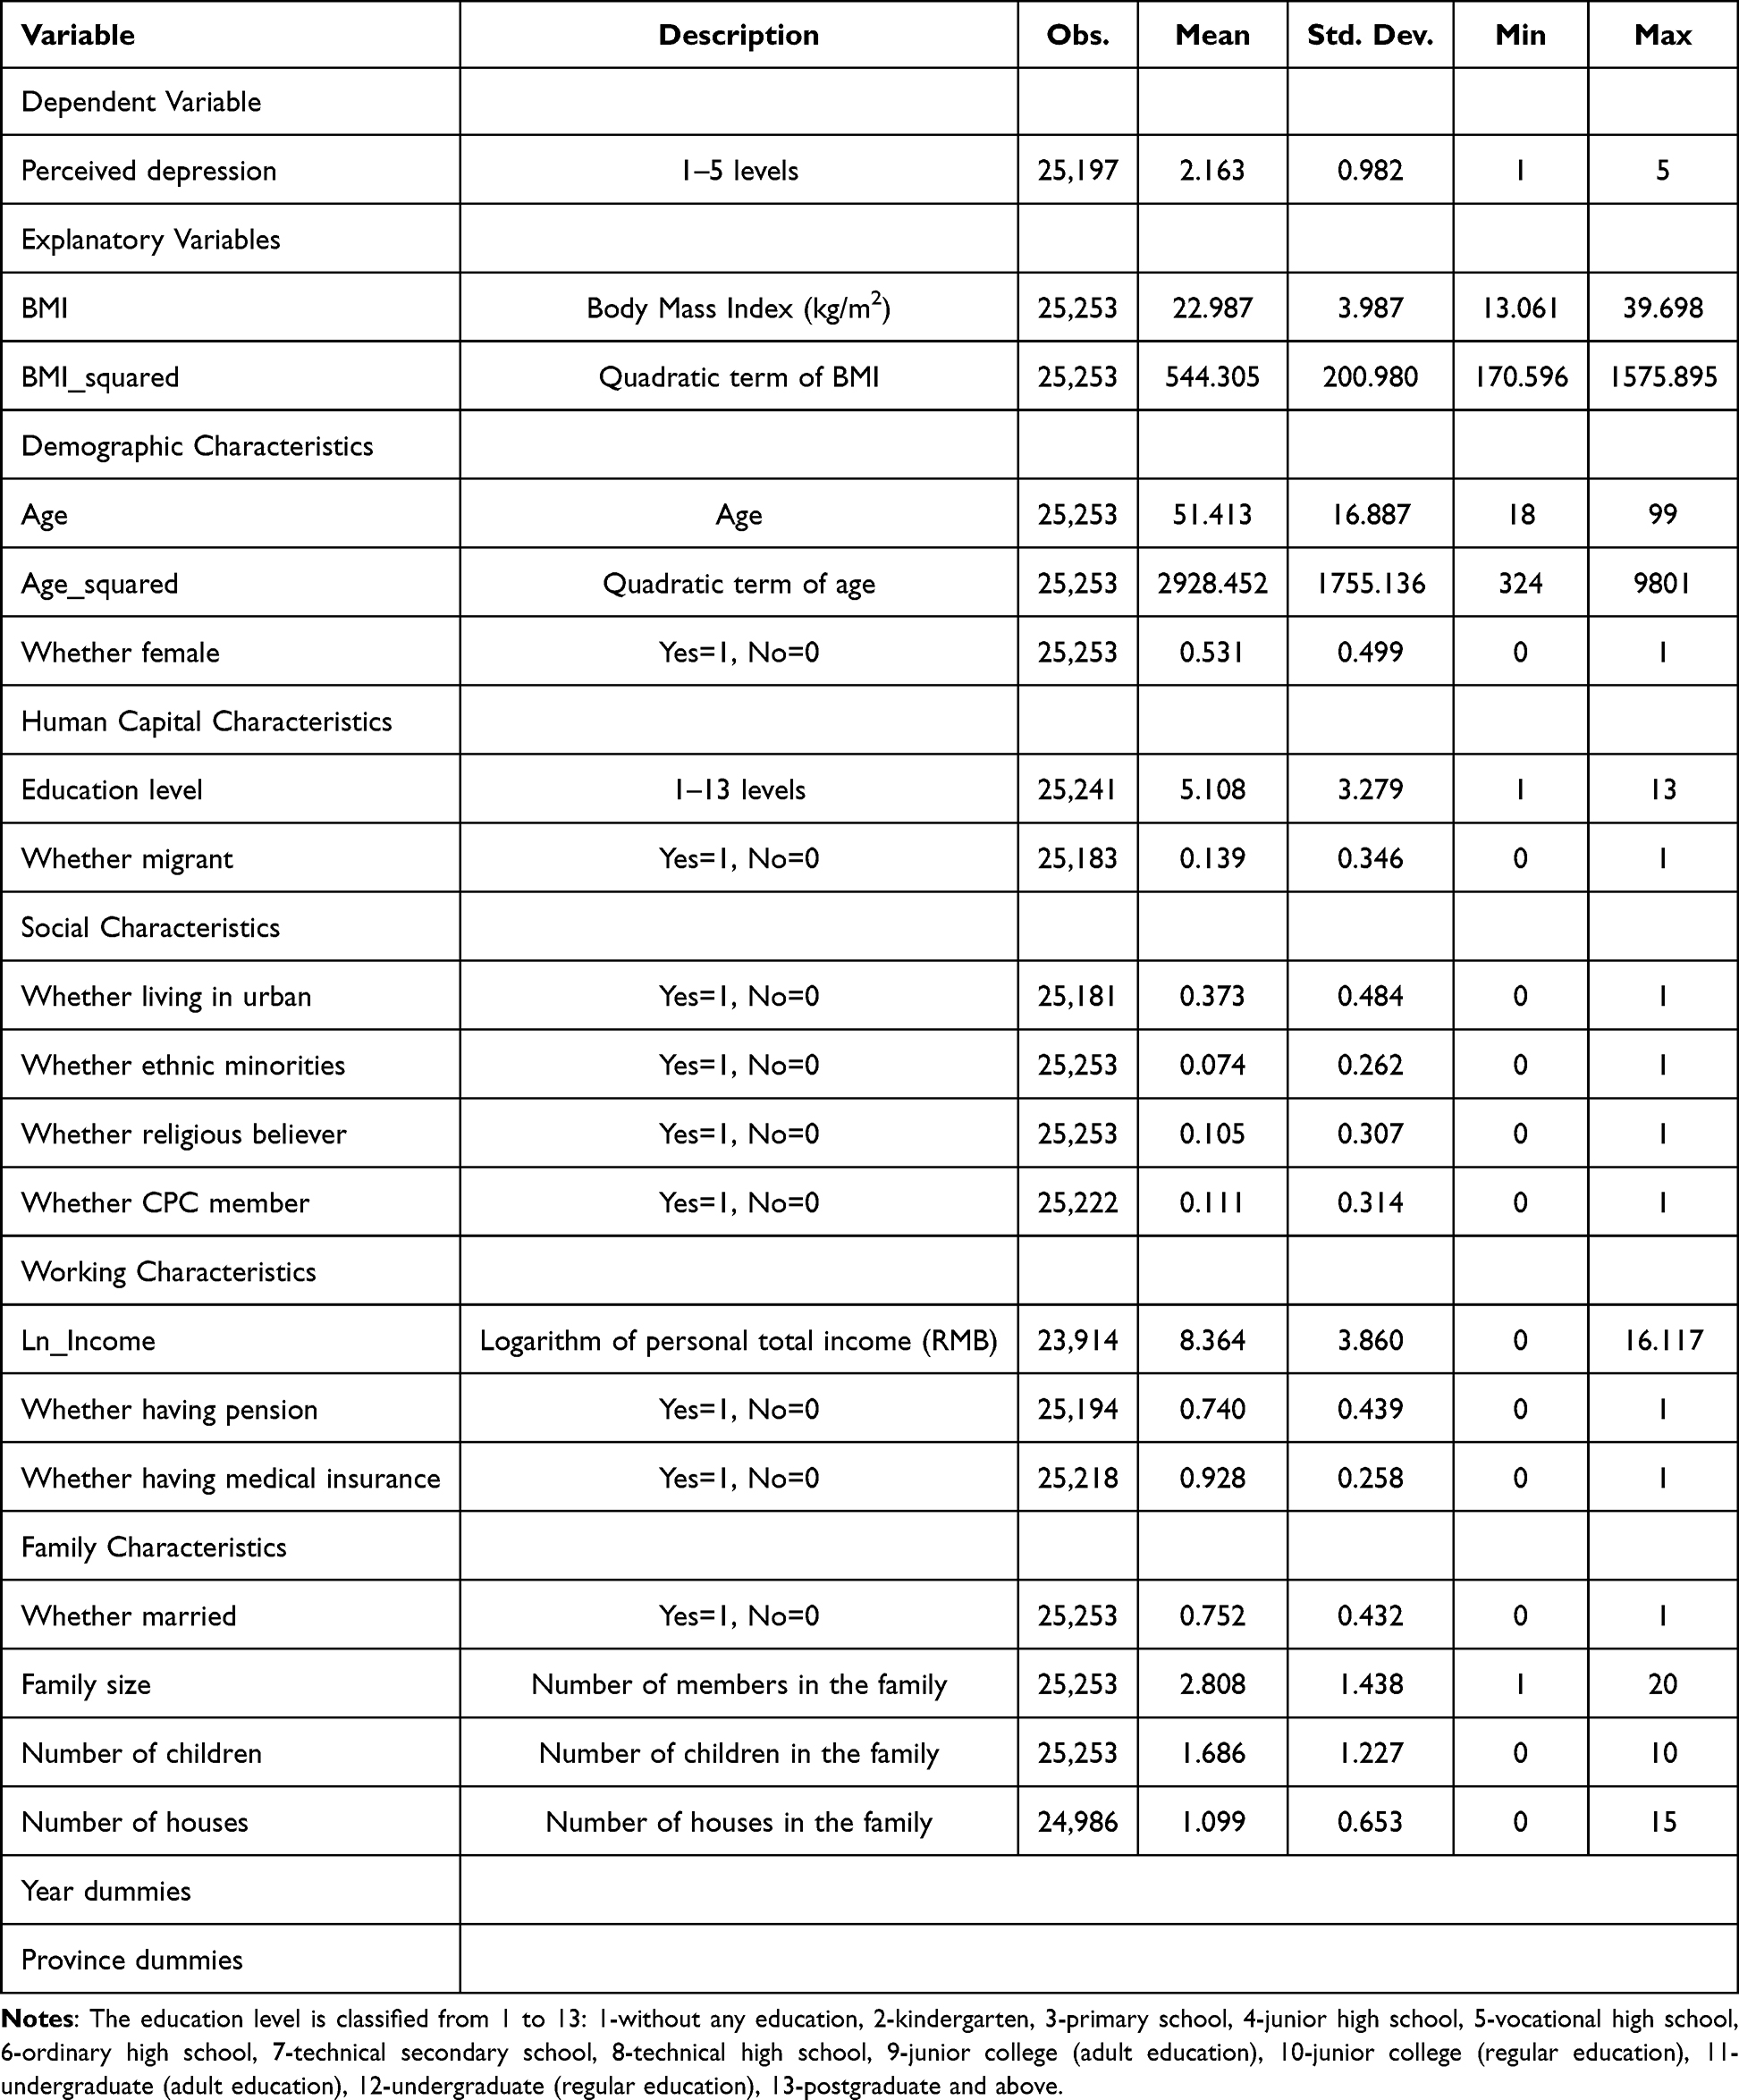 |
Table 1 Descriptive Statistics |
A preliminary statistical analysis of the relationship between BMI and perceived depression is performed, as illustrated in Figure 2. It is indicated that when individuals have a low BMI, the degree of predicted perceived depression drops as BMI increases. However, when BMI reaches 25.719, perceived depression begins to rise with BMI increasing. This result suggests that the relationship between BMI and depression is not likely to be linear, implying a nonlinearity between them, prompting a more rigorous investigation into their relationship in the following sections of this paper.
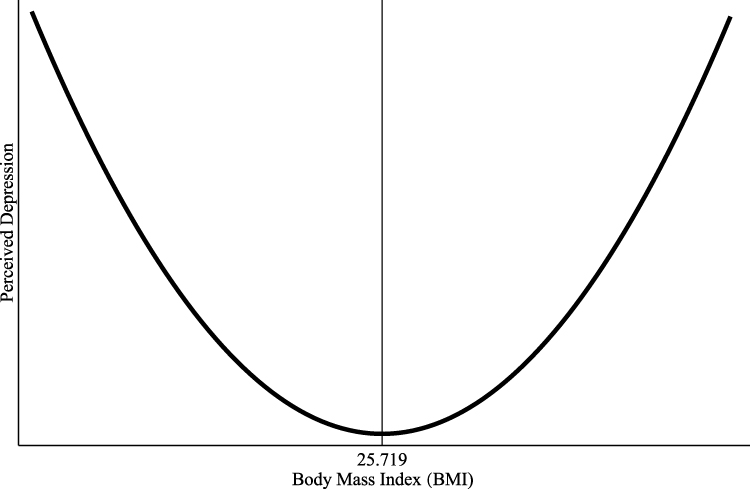 |
Figure 2 Relationship between Body Mass Index and perceived depression. |
Methods and Research Design
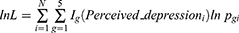
This paper employs nationally representative cross-sectional data from China to conduct non-comparative statistical analysis. The analysis is based on the following model. Since the explanatory variable in this paper, perceived depression, is an ordinal indicator rather than a continuous one, the Ordered Probit model is used for benchmark regression. Specifically, individuals are divided into five groups based on their perceived depression. Groups g=1 to 5 represent Perceived_depressioni =1, Perceived_depressioni =2, Perceived_depressioni =3, Perceived_depressioni =4 and Perceived_depressioni =5, respectively. The probability  of a given observation
  in group
  is
is

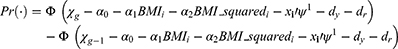
Among them, perceived depressioni refers to the respondents’ self-rated depression level. The main explanatory variables, BMIi and BMI_squaredi, represent people’s BMI and its quadratic term, respectively.  and dr denote the vector of control variables, year dummy variables and province dummy variables, respectively. In expression (1),
  is
is  and
and  is
is  .
.  is the standard normal cumulative distribution function in equation (2). Accordingly, the log-likelihood of the maximum likelihood estimation (MLE) is
where  and
and  is the sample size. Based on this,
  ,
,  and
and  are estimated by
  .
.
In addition, various methods are used for robustness testing in this paper. To tackle the problem of measurement error in perceived depression, we construct a dummy variable “Whether depressed” to measure depression. Since the dependent variable “Whether depressed” is a dummy with a value of 0 or 1, the Probit model is constructed for the estimation as follows.

In expression (4), S is the set of all observations such that Whether_depressedi=1. In Equation (5),  is the standard normal cumulative distribution function. Based on this,
  ,
,  and
and  are estimated by
  .
.
Furthermore, to test whether the U-shaped relationship between BMI and perceived depression depends on this assumption and model choice, the Ordered Logit model is applied by using Equation (6) to estimate the  function:
Meanwhile, to further test the robustness of the findings, we also conduct a robustness check using the following linear Ordinary Least Square (OLS) model:

Results
Benchmark Analysis
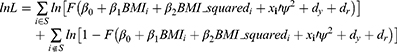
Benchmark estimation results of the Ordered Probit model are presented in Table 2. Column (1) does not include any control variables, where the coefficients of BMI and its quadratic term are both significant. The estimated coefficient of BMI is significantly negative, while that of BMI’s squared term is significantly positive, indicating a nonlinear relationship between BMI and self-rated depression. Furthermore, when the demographic characteristics, human capital characteristics, social characteristics, working characteristics, family characteristics as well as regional and time fixed effects are sequentially controlled for in columns (2)-(6), the estimated coefficients of BMI and its quadratic term remain significant at the 1% level, meaning a very robust nonlinear association. Moreover, with adding different types of control variables, the coefficient of BMI basically stabilizes at around −0.1, and that of BMI squared remains constant at 0.002. These results further demonstrate that the nonlinear relationship between BMI and perceived depression is very robust and can hardly be disturbed by other factors.
 |
Table 2 Benchmark Statistical Results |
Specifically, according to the results in column (6) of Table 2, the estimated coefficient of BMI is −0.086 and that of BMI’s quadratic term is 0.002 after controlling all the characteristics in six aspects. This indicates that when individuals have a low BMI, the degree of perceived depression drops as BMI increases. However, when BMI reaches 25.719 (=0.0858498/(0.001669*2)), perceived depression begins to rise with BMI increasing. According to World Health Organization standards, 18.500 ≤ BMI < 25.000 is classified as healthy weight and 25.000 ≤ BMI < 30.000 is overweight. Therefore, when the upper limit of healthy weight is exceeded, a further increase in BMI leads to an increased depression. As a result, the relationship between BMI and perceived depression is U-shaped, with a negative association in the beginning followed by a positive link.
Furthermore, the marginal effects of BMI on perceived depression are presented in Figure 3. The figure clearly illustrates that when BMI is lower than 25.719, an increase in BMI has a positive association with the probability of being not depressed and mildly depressed. On the contrary, it has a negative connection with the likelihood of self-rating moderately depressed, very depressed and severely depressed. After BMI exceeds the inflection point of 25.719, the relationship between BMI and the possibility of being not depressed and mildly depressed become negative, while its association with the probability of self-rating moderately depressed, very depressed and severely depressed are positive. These results obviously demonstrate that the relationship between BMI and perceived depression is not simply linear, but exhibits a U-shaped relationship.
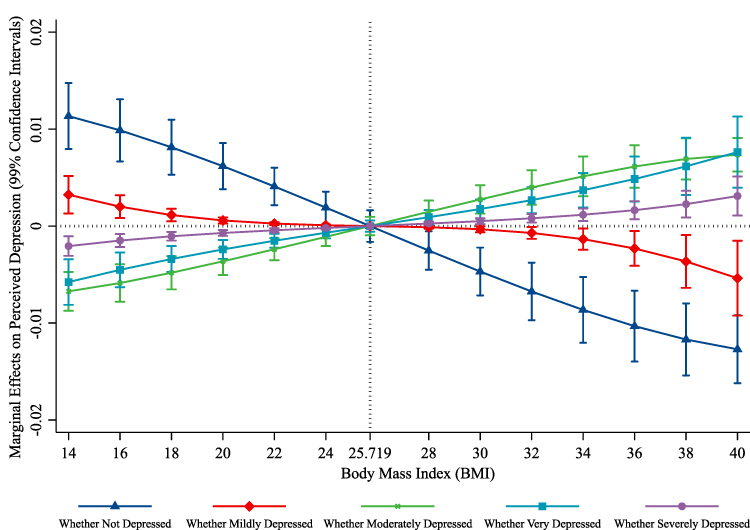 |
Figure 3 Marginal relationship between body mass index and perceived depression. Five lines in this figure depict the marginal associations between Body Mass Index and the probabilities of being “Not Depressed”, “Mildly Depressed”, “Moderately Depressed”, “Very Depressed” and “Severely Depressed”, respectively. |
Robustness Checks
Additionally, to check the reliability of the nonlinear association between BMI and perceived depression found in the benchmark analysis, robustness tests are conducted from multiple aspects, such as tackling the problem of measurement error in perceived depression, dealing with outliers of BMI, testing the robustness of the U-shaped curve, and applying different statistical models for estimation.
Robustness Checks: Dealing with Measurement Error in Perceived Depression
CGSS uses a 5-point adjectival scale to measure self-rated depression, but this ordinal index may suffer from measurement error problems because respondents might have varied understandings of the depression levels represented by the given options. For example, respondents may have trouble distinguishing the difference between very depressed and severely depressed. Two actually similar depression levels could be reported as “very depressed” by one respondent and “severely depressed” by another. To address this problem, a dummy variable measuring the degree of depression is constructed, denoted as “Whether depressed”. When the respondent answers moderately depressed, very depressed or severely depressed, “Whether depressed” is assigned a value of 1, and 0 otherwise. Through this approach, the problem of measurement error is largely avoided. This is because although two individuals may not be able to consistently differentiate between very depressed and severely depressed, their judgment criterion of whether they are depressed or not is similar. The results in column (1) of Table 3 reveal a significantly negative estimated coefficient for BMI and a positive coefficient for the quadratic BMI when the dummy variable is used to measure perceived depression. In columns (2)-(6), when demographic characteristics, human capital characteristics, social characteristics, working characteristics, family characteristics, as well as regional and time fixed effects are sequentially included, the estimated coefficients of both BMI and its quadratic term remain significant at the 1% level. This further confirms the U-shaped relationship between BMI and perceived depression, and indicates that this nonlinearity is not affected by the potential measurement error of perceived depression.
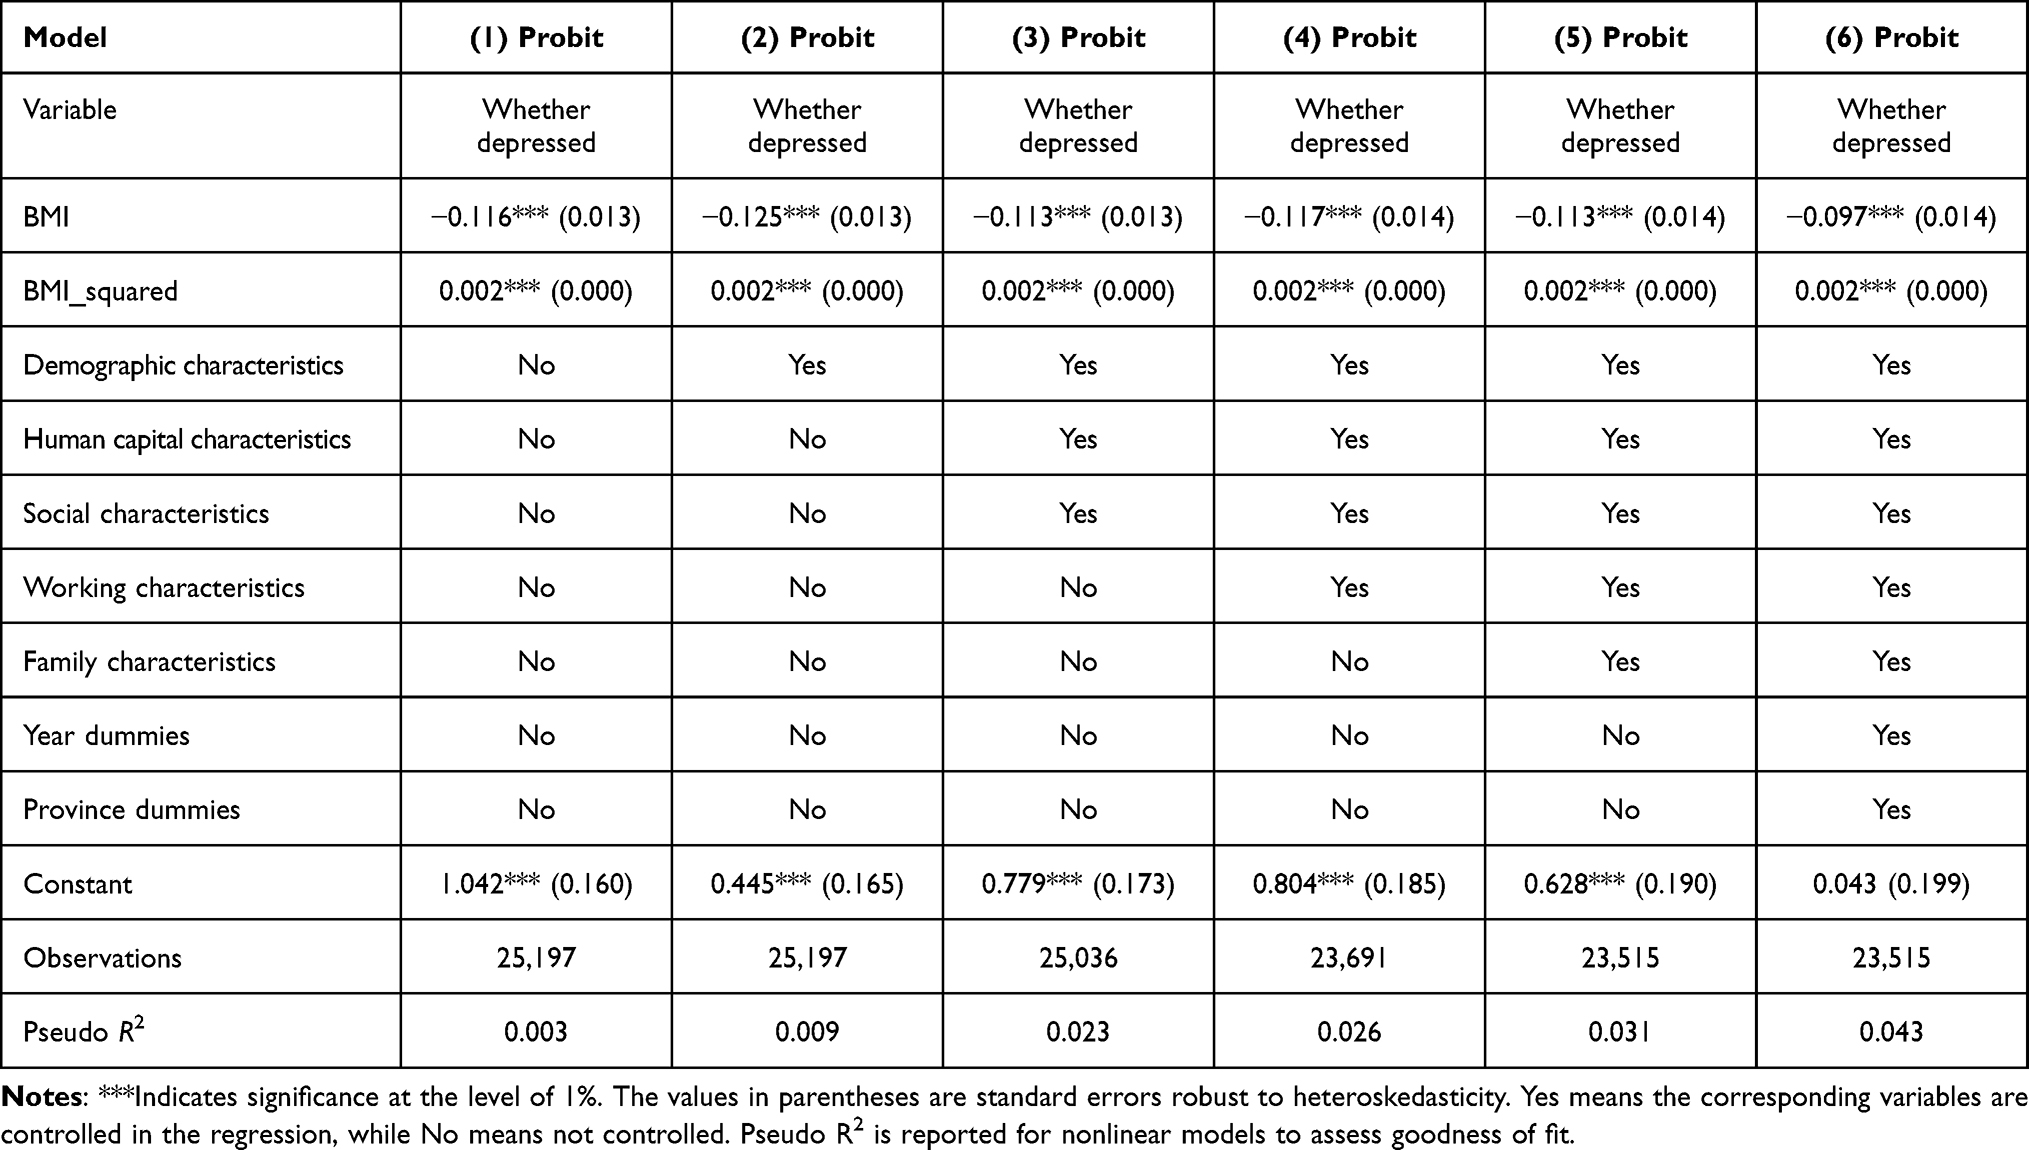 |
Table 3 Robustness Checks: Dealing with Measurement Error in Perceived Depression |
Robustness Checks: Dealing with Outliers of BMI
During the process of questionnaire survey, respondents may misreport their height or weight because of various reasons such as misunderstanding, resulting in outliers in BMI. Such outliers may cause the model to fail to accurately estimate the relationship BMI and depression. To address this issue, this paper tests the nonlinear relationship between BMI and perceived depression based on dealing with outliers with three methods. First, we winsorize the BMI index by setting extreme outliers equal to a specified percentile of the data. Specifically, we rank the BMI data from smallest to largest and then replace the 3% highest and 3% lowest values by the next value counting inwards from the extremes, constructing a new index, denoted as BMI_win_03. Similarly, 5% of the highest and lowest values are replaced to obtain a new BMI index, referred to as BMI_win_05. Results of the regression analysis applying the two winsorized BMI indexes are shown in columns (1)-(2) of Table 4. It is indicated that the coefficients of BMI and its quadratic term remain significant after the outliers are winsorized, respectively.
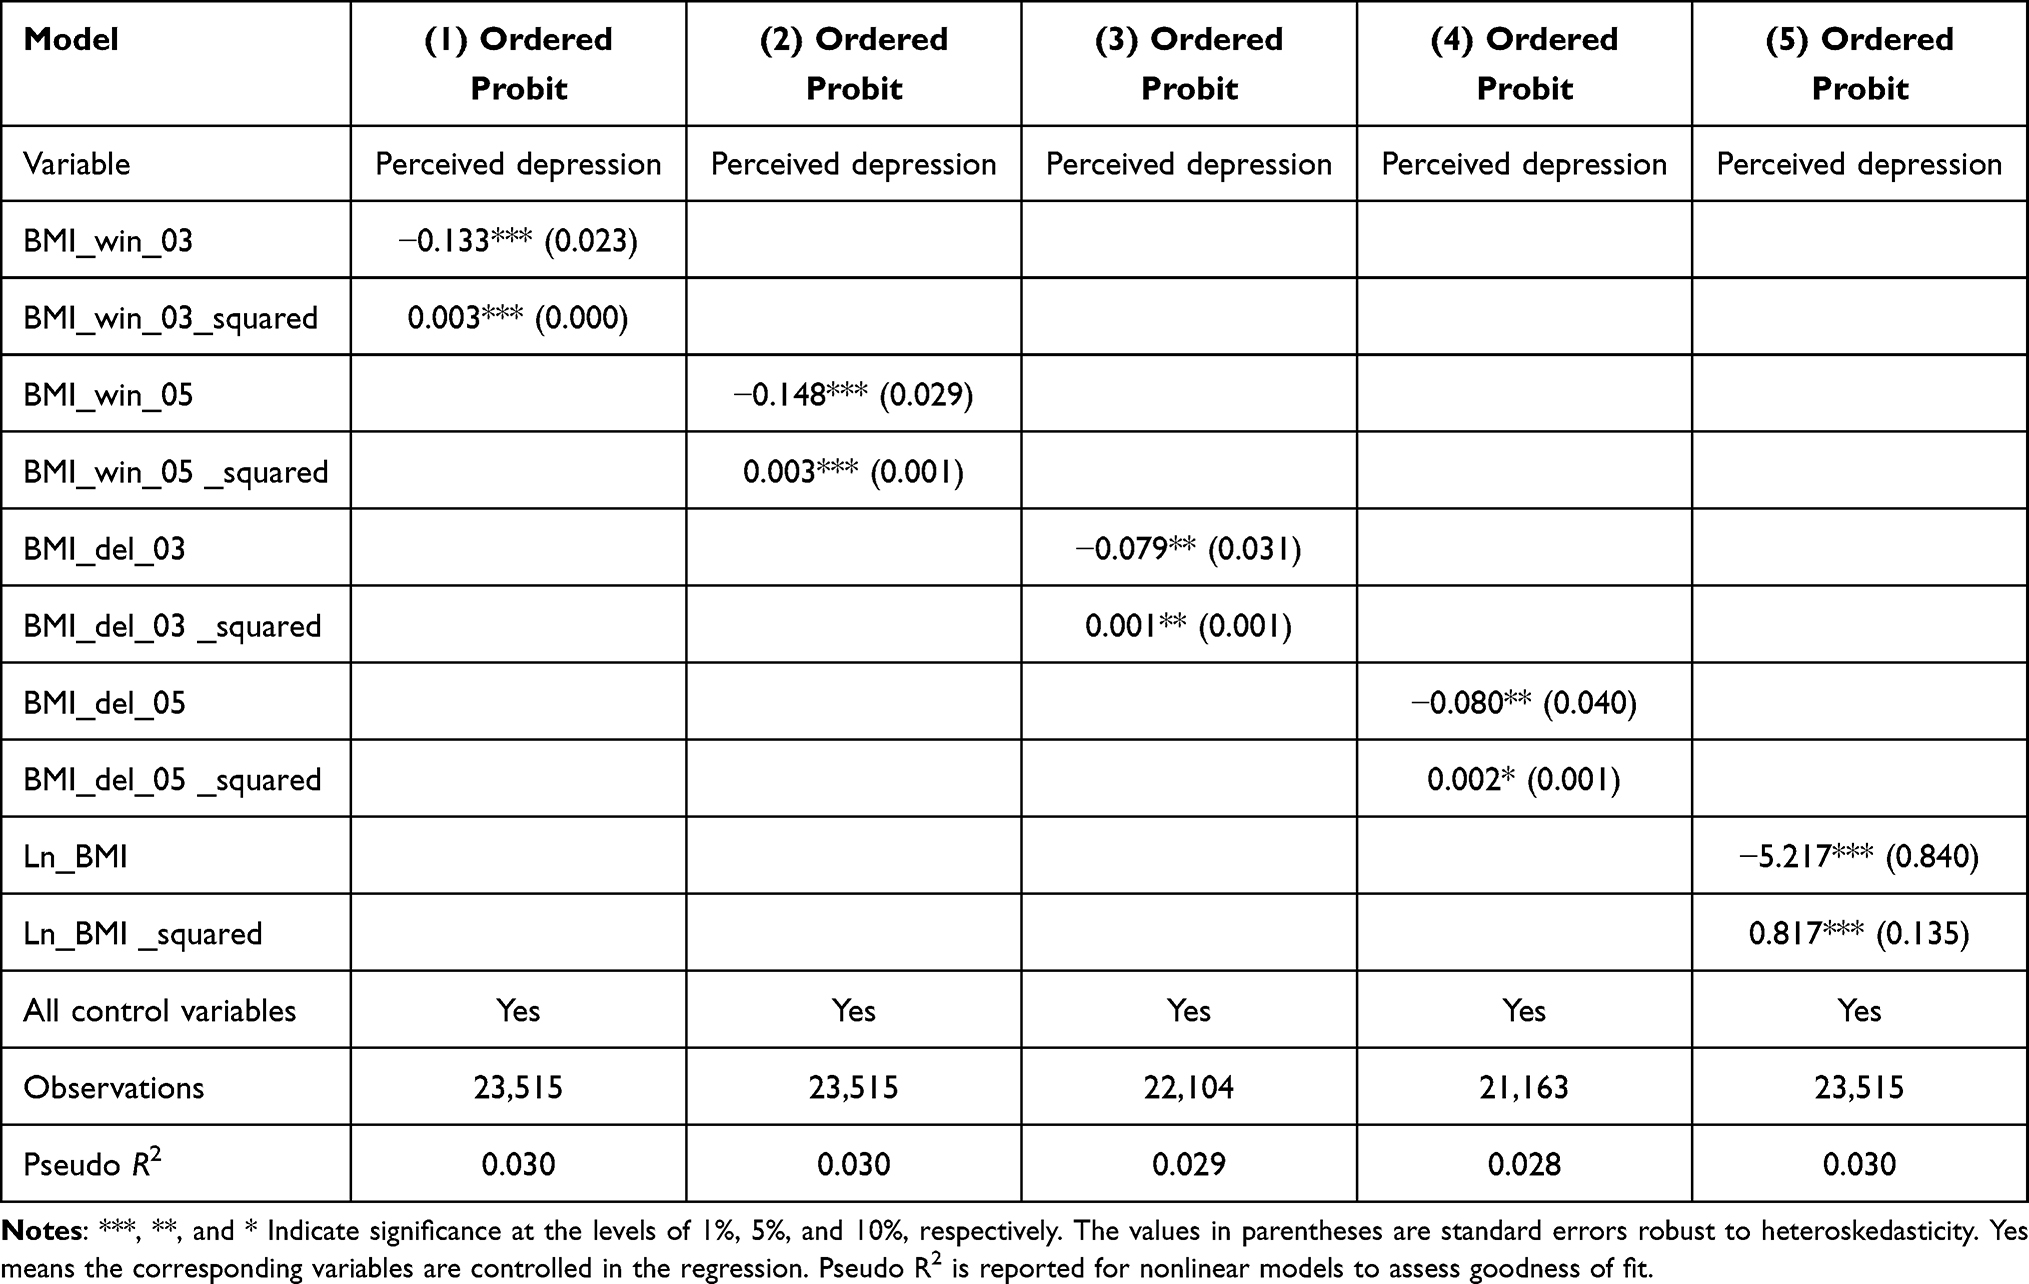 |
Table 4 Robustness Checks: Dealing with Outliers of BMI |
Second, we also perform the robustness checks by removing the outliers. Specifically, 3% or 5% of the maximum and minimum BMI observations are deleted from the data to obtain BMI_del_03 and BMI_del_05, respectively. Regression results using the new BMI measures are shown in columns (3)-(4) of Table 4, indicating that the estimated coefficients of BMI and its squared term are still significant. Third, taking logarithmic transformation can reduce the range of variables and thus limit the impact of outlying values on model fitting. We take the logarithm of the BMI index and obtain ln_BMI, reducing the range of variables and thus limit the impact of outlying values on model fitting. Column (5) of Table 4 reveals that the estimated coefficients of both ln_BMI and ln_BMI_squared are significant at a 1% level. All these robustness checks demonstrate that the nonlinear relationship between BMI and perceived depression is not disturbed by outliers, regardless of which method is employed to address this problem.
Robustness Checks: Testing the Robustness of the U-Shaped Relationship
Next, we further check whether the nonlinearity between BMI and perceived depression is truly a U-shaped relationship in the following two ways. First, to answer the question of whether the nonlinear relationship between BMI and depression is second-order or higher-order with more than one turning point, a cubic term of BMI is added to the model to test for a higher-order relationship. The results in columns (1)-(2) of Table 5 indicate that, regardless of whether perceived depression is measured by a 5-point Likert scale or a dummy variable with values of 0 and 1, the estimated coefficients for BMI, its quadratic, and cubic terms are all insignificant. This reveals that there are strong multicollinearities among the three variables, resulting in high standard errors of the estimation. Therefore, the cubic term of BMI should not be further added to the regression, suggesting that there is only one turning point between BMI and depression.
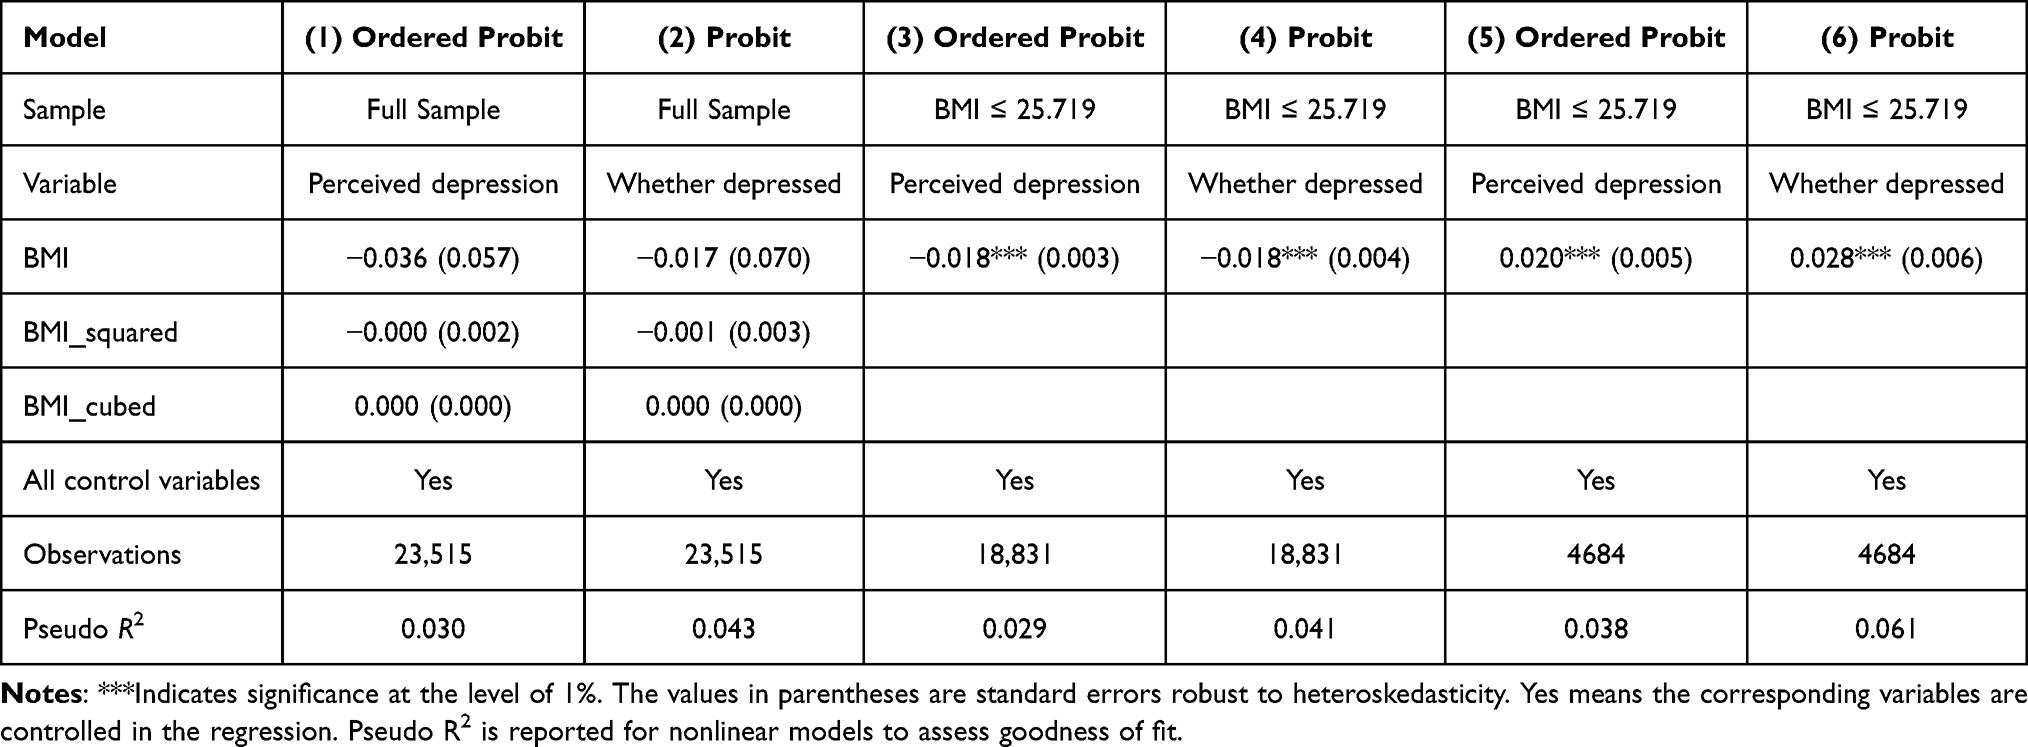 |
Table 5 Robustness Checks: Testing the Robustness of the U-Shaped Relationship |
Second, following existing literature,102 to further examine whether the relationship between BMI and perceived depression is truly a U-shaped relationship, this paper tests samples on both sides of the inflection point (BMI = 25.719) separately. Specifically, with BMI as the explanatory variable and depression as the dependent variable, we conduct regressions on two subsamples of BMI ≤ 25.719 and BMI > 25.719, respectively. If the estimated coefficient of BMI on the left side of the turning point is significantly negative while positive on the right side, then this would be evidence that the relationship between BMI and depression is indeed U-shaped. Columns (3)-(4) of Table 5 indicate that the estimated coefficient of BMI is significantly negative at the 1% level on the left side of the inflection point (25.719), with either indicator used to measure perceived depression. In contrast, results from columns (5)-(6) suggest that the estimated coefficient of BMI is significantly positive at the 1% level on the right side of the turning point. These results further confirm that the relationship between BMI and perceived depression is not a higher-order pattern with more than one turning point, but instead a U-shaped relationship, characterized by a negative correlation initially followed by a positive association.
Robustness Checks: Using Other Statistical Models
In the benchmark regression, the Ordered Probit model is used to estimate the relationship between BMI and depression. To exclude the impact of model selection on regression results, the Ordered Logit model and linear Ordinary Least Square (OLS) model are applied in this paper.
Table 6 demonstrates the results of the regression using above Ordered Logit model. Column (1) presents that the estimated coefficients of both BMI and its quadratic term are significant at the 1% level without incorporating any control variables, where the signs of the coefficients are consistent with those in the benchmark regressions. Columns (2)-(6) indicate that the significance of these results remains the same when six types of control variables are added. Table 7 shows the results of the regressions using OLS model. Columns (1)-(6) reveal that the estimated coefficients for BMI and its squared term remain significant at the 1% level, regardless of whether control variables are included or not. This provides further evidence that the U-shaped relationship between BMI and perceived depression is very robust and does not depend on a specific statistical model for estimation.
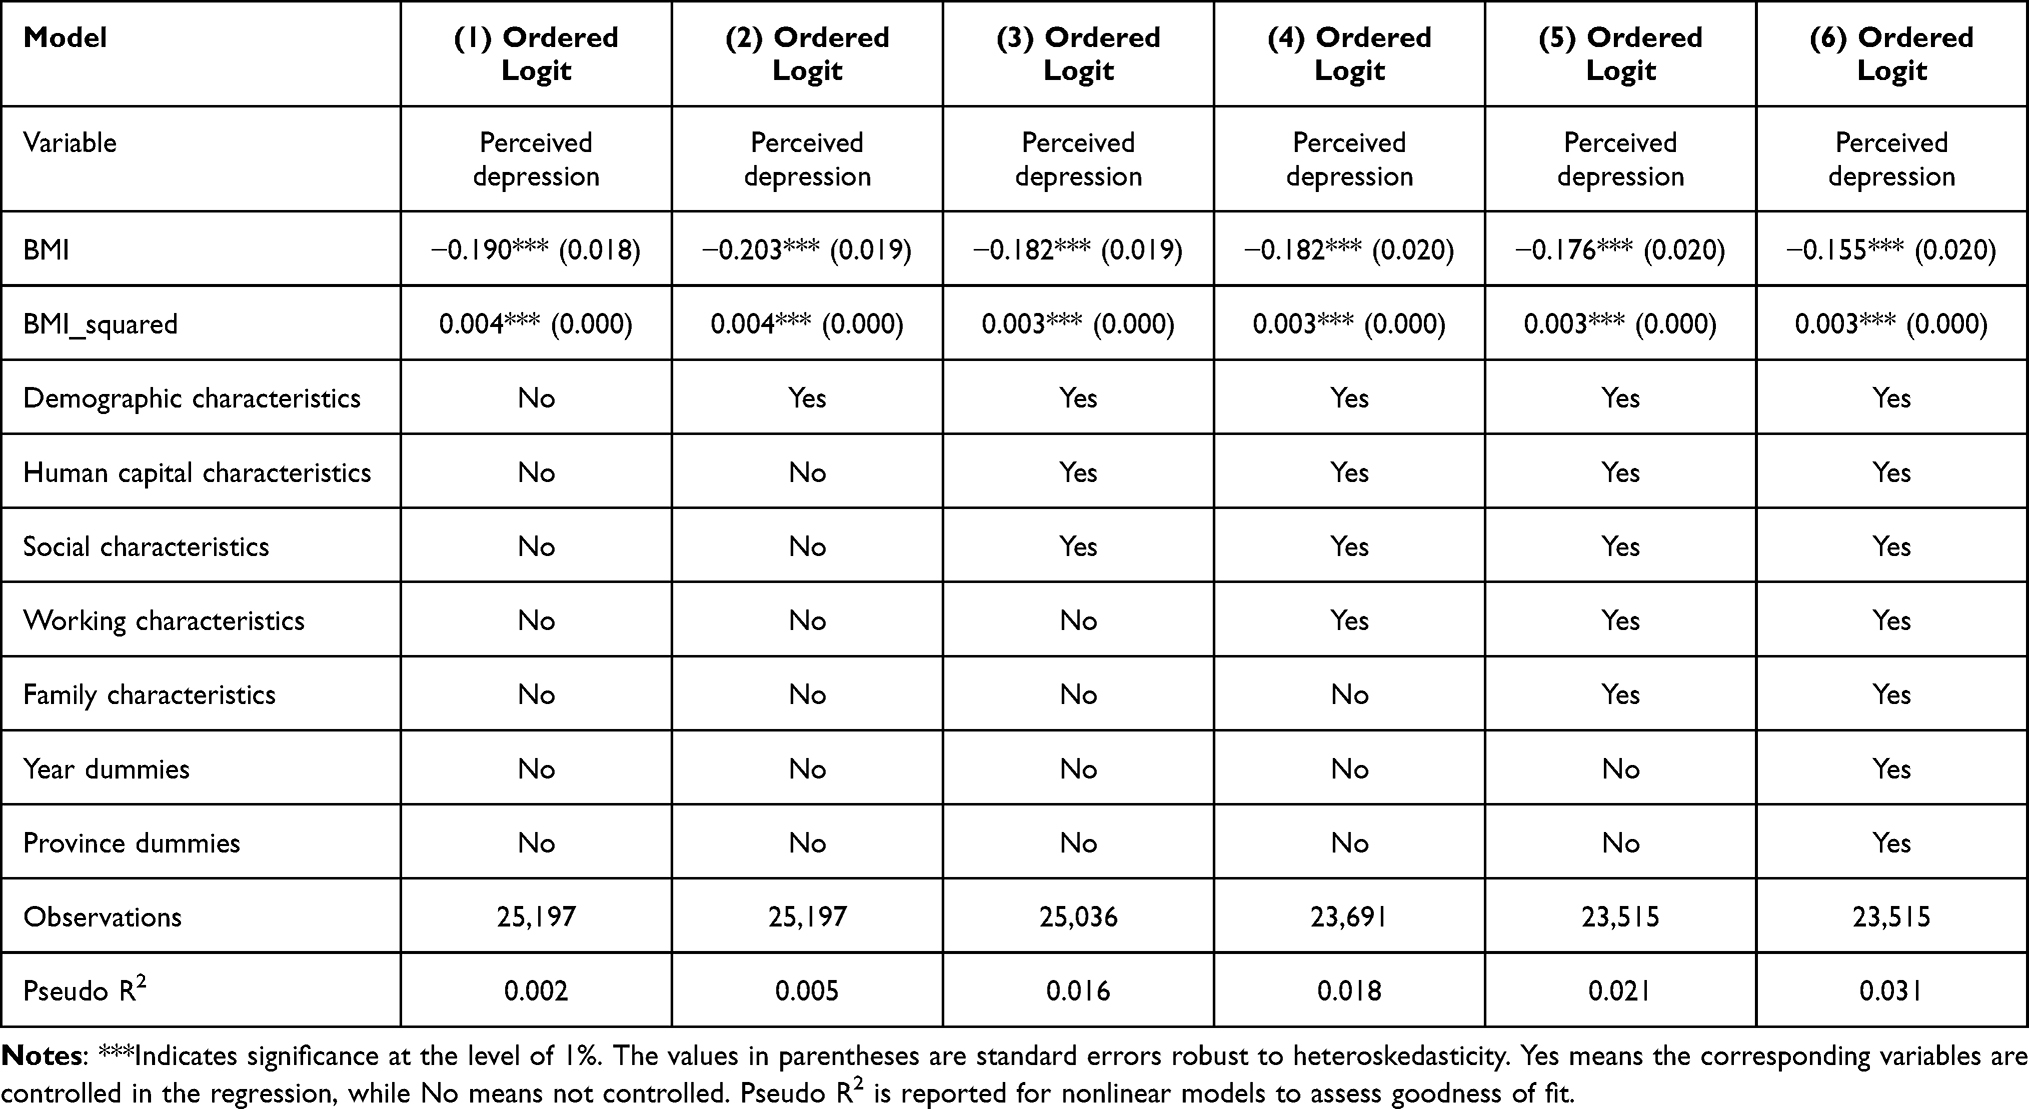 |
Table 6 Robustness Checks: Using Ordered Logit Model |
 |
Table 7 Robustness Checks: Using OLS Model |
Heterogeneity Analysis
This paper further examines the heterogeneity of the nonlinear relationship between BMI and perceived depression in several aspects and the results are shown in Figure 4. First, in terms of age, the older cohort aged 45 years and above generally has higher levels of perceived depression than their counterparts. This implies that older individuals are more likely to suffer from mental health problems, consistent with the established literature.22–24 In addition, the inflection point of the U-shaped relationship between BMI and perceived depression is significantly larger in the older group (26.829) than that in the younger group (23.380), potentially due to the fact that younger people are more concerned about their outward appearance and obesity, thus making their mental health more sensitive to BMI. In terms of gender heterogeneity, findings suggest that women have higher perceived depression, which is consistent with the existing literature.19 Moreover, the U-shaped relationship’s turning point is larger in men (27.265) than in women (25.872), implying that females have more anxiety about BMI than males. With regards to education, those with a bachelor degree or higher have lower perceived depression, and this finding is supported by the literature.30 The reason for this may be that better education comes with a higher level of health literacy, which are associated with better mental health.28,29,103
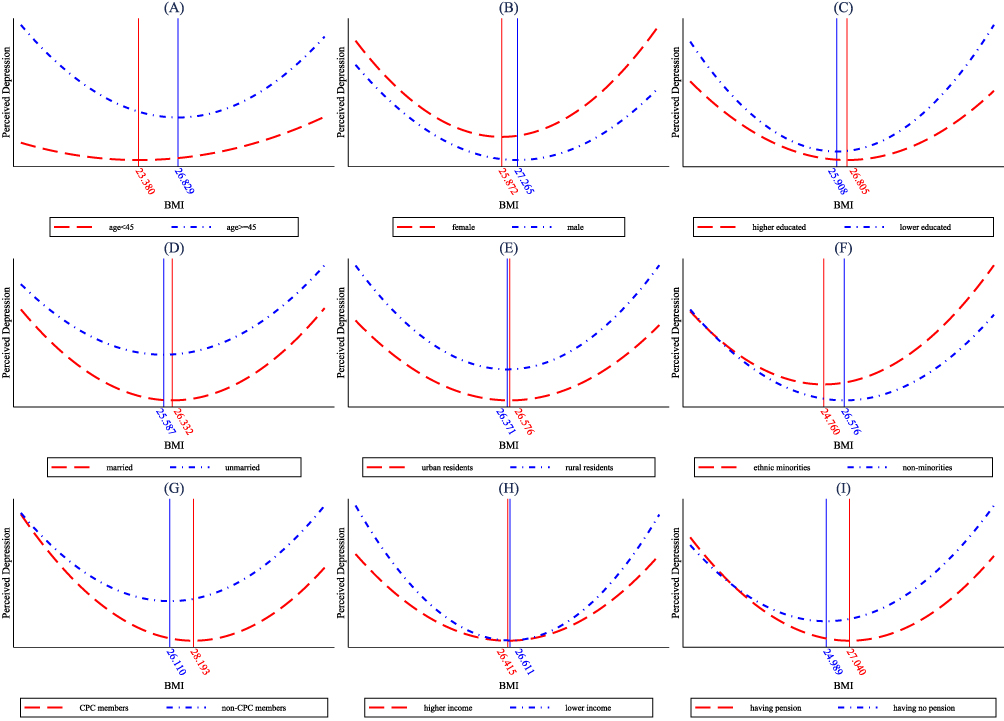 |
Figure 4 Heterogeneities in the nonlinear relationship between body mass index and perceived depression. (A) Age heterogeneity: relationship between BMI and perceived depression among individuals under 45 years old and those with 45 years or older. (B) Gender heterogeneity: relationship between BMI and perceived depression among females and males. (C) Education heterogeneity: relationship between BMI and perceived depression among individuals with higher education level (having bachelor’s degree and above) and those with lower education level (having no bachelor’s degree and above). (D) Marital status heterogeneity: relationship between BMI and perceived depression among married and unmarried individuals. (E) Regional heterogeneity: relationship between BMI and perceived depression among urban and rural residents. (F) Ethnicity heterogeneity: relationship between BMI and perceived depression among ethnic minorities and non-minorities. (G) Political identity heterogeneity: relationship between BMI and perceived depression among CPC members and non-CPC individuals. (H) Labor income heterogeneity: relationship between BMI and perceived depression among individuals with labor income below the median and their counterparts. (I) Social security heterogeneity: relationship between BMI and perceived depression among individuals having pension and those without pension. Abbreviations: BMI, Body Mass Index; CPC, Communist Party of China. |
Furthermore, the findings suggest that the unmarried population shows higher perceived depression than the married subgroup. This is in line with existing literature that married people have less chance for depression than those categorized as single, widowed, separated or divorced, because marriage provides social support - including emotional, financial, and instrumental support.58 Meanwhile, the inflection point of the U-shaped relationship between BMI and perceived depression is lower in unmarried individuals. This may be because married individuals, who do not need to compete in the marriage market, care less about BMI, whereas the unmarried population has higher anxiety when it comes to obesity. Moreover, the findings suggest that rural residents have significantly higher perceived depression than those in urban areas when considering regional heterogeneity. This may be attributed to the fact that in developing countries such as China, residents in rural areas have lower income and living standards than their counterparts, making them more prone to developing depression.46 In the CGSS data used in this paper, the per capita annual income of urban residents (RMB 85,641.02) is approximately twice as large as that of rural residents (RMB 36,288.82). However, the difference between the inflection points in the urban and rural subsamples is not very significant. With regard to race heterogeneity, the analysis indicates that ethnic minorities experience higher levels of depression, which is in accordance with the existing literature. One possible explanation for this could be their poorer access to mental health resources.42,43
Political identity heterogeneity is found to have an impact on self-rated depression, Communist Party of China (CPC) members generally have lower levels of depression levels than non-party members. This may be because CPC members typically have more political and social capital, which reduces their risk of depression.104 Another possible explanation is that they tend to receive better education, and higher levels of education can lower their risk of depression.30 This can be supported by the CGSS data, where party members averagely have significantly higher education levels (7.65) compared to non-party members (4.79). When it comes to income heterogeneity, the lower income subgroup whose income is below the median generally suffers higher perceived depression than their counterparts, as indicated by the existing literature.44 In addition, the inflection points of the U-shaped curve between BMI and perceived depression are very close for both groups. Regarding social security, individuals without pension insurance have higher perceived depression. Moreover, the turning point of the U-shaped curve (27.040) is larger for those with pension insurance. This is probably because social security helps people to better cope with health risks, thus alleviating mental health problems associated with high or low BMI levels.50
Discussion
The goal of this paper is to systematically investigate the nonlinear relationship between BMI and perceived depression by applying a large-scale and nationally representative dataset, which comprises respondents with different socio-demographic backgrounds. Existing literature mainly examines the linear relationship between BMI and depression, but the results are contradictory. Some studies indicate a positive association between the two factors, suggesting a greater BMI leading to an increase in depression.7,8,88 Other research reports a negative correlation, implying that larger BMI is linked to reduced depression levels.105 Additionally, there also exist studies finding an insignificant correlation,12 indicating that the relationship between them may not be simply linear. This paper clarifies the association between BMI and perceived depression and confirms a nonlinear U-shaped relationship based on rigorous statistical tests on a large-scale representative dataset.
Very limited existing studies consider the nonlinear relationship between BMI and depression, while most of them focusing only on certain subgroups such as underweight individuals,13 students,14 or the elderly.15 Although these studies all find some evidence of a nonlinear relationship between BMI and depression, limited samples can hardly suffice to answer questions such as whether the relationship is nonlinear for the entire population and if there exists a more complex nonlinear relationship with multiple inflection points. In comparison, this paper uses a large-scale and nationally representative sample, covering the whole adult population over the age of 18. This facilitates a more systematic and in-depth exploration of the true relationship between BMI and depressive disorders. Results of this paper confirm that there is a U-shaped relationship between BMI and self-rated depression in the entire adult population.
Furthermore, there is a lack of systematic studies rigorously testing the reliability of the nonlinear relationship between BMI and perceived depression. Most research in this area relies on descriptive statistical methods and analysis of variance.2,13,16,17 This leads to the discussion about this nonlinear relationship failing to clarify the type of the nonlinearity, whether it is reliable, and whether there exists a more complex association. In this study, we examine the robustness of the nonlinear relationship between BMI and depression employing various statistical methods, including dealing with measurement error in perceived depression, addressing outliers of BMI, testing the reliability of the U-shaped, and applying different statistical models. All these tests support the conclusion of this study that there is a U-shaped nonlinear relationship between BMI and self-rated depression. Besides, results verify that the relationship between BMI and self-rated depression is not a higher-order relationship with more than one turning point, but instead a U-shaped relationship, characterized by a negative correlation initially followed by a positive association. On this basis, the inflection point of the U-shaped curve (25.719) is calculated, which is slightly above the upper boundary of the range of healthy weight (18.500 ≤ BMI <25.000) defined by the World Health Organization.
Additionally, this study also analyzes the heterogeneity of the U-shaped relationship between BMI and perceived depression from multiple perspectives. Existing literature reveals variations in BMI and perceived depression among individuals with different genders, ages, income levels, and ethnicities.13,16,17 Findings of the heterogeneity analysis of this study in these aspects can be supported by above existing literature. Moreover, this paper examines the heterogeneity of the nonlinear relationship between BMI and perceived depression from additional perspectives and compares differences in the turning point across subgroups. The results indicate that individuals who are older, female, with lower education levels, unmarried, living in rural areas, belonging to ethnic minorities, non-Communist Party of China members, having lower income, and uncovered by pension insurance tend to have higher perceived depression at almost all BMI levels. Meanwhile, these subgroups have smaller inflection points and their self-rated depression is more sensitive to BMI.
Implication
This study has important practical implications for a more objective understanding of the relationship between BMI and depression, as well as for improving mental health. From a clinical perspective, healthcare providers play a vital role in assessing mental health of patients with high or low BMI. First, this study implies that when using BMI to predict the risk of depression, variations in their relationship should be taken into account across different BMI categories. Traditionally, overweight is considered as a major risk factor for depression.7,8,81 However, the results of this study also highlight the importance of paying attention to the underweight population, which may also suffer from a higher level of depression. Therefore, healthcare providers should consider screening for depression in patients with BMI values outside the healthy weight range defined by the World Health Organization.
Second, healthcare providers should pay special attention to vulnerable subgroups, including those who are older, female, with lower education levels, unmarried, living in rural areas, belonging to ethnic minorities, non-Communist Party of China members, having lower income, and uncover by social security. Since these subgroups have a higher risk of depression and their self-rated depression is more sensitive to BMI, healthcare providers should be aware of these risk factors and incorporate them into their evaluation of patients. Third, collaborative care models involving primary care and mental health professionals can help improve the detection and management of depression in individuals with high or low BMI values. A multidisciplinary approach can help address the complex interplay between BMI and depression and provide more comprehensive care to vulnerable subgroups. For example, a patient with a high/low BMI and depression may benefit from a combination of weight management strategies and therapy or medication for their depression.
From a health education perspective, promoting healthy weight management should be a priority. This research demonstrates that the risk of depression is lowest around the inflection point of the U-shaped curve (25.719), which helps to clarify the management goal of appropriate BMI from a mental health perspective, suggesting that being around the upper limit of the range of healthy weight (18.500 ≤ BMI <25.000) is beneficial to achieve the lowest perceived depression on average. Health educators should help individuals understand the benefits of maintaining a healthy weight and how it can reduce their risk of depression. Second, this study finds that both very high and very low BMI are associated with high risk of depression, and so health educators should also work to dispel myths and misconceptions about weight and depression. For example, it is important to emphasize that being thin does not automatically make someone happier, and instead, a balanced, healthy lifestyle that includes regular physical activity, healthy eating habits, and stress management is crucial for mental health.
Third, the research findings suggest that certain subgroups are more vulnerable to depression risk factors, such as lower education, lower income, belonging to ethnic minorities and so on. Therefore, health educators should raise awareness of these risk factors among people and encourage them to seek help if they experience depressive symptoms. Moreover, health education programs can also provide information on resources for individuals who may need support, such as mental health services or community organizations.
Limitation
This study has the following shortcomings, including the fact that although the indicator of perceived depression in this paper is also widely used in the existing literature,106–110 it may not be the most effective measure of depression. To enhance the study’s findings, it would be beneficial to incorporate other depression indexes based on more reliable scales, as this would enable a more comprehensive understanding of depression within the context of the study, leading to more accurate and reliable conclusions. Second, the use of cross-sectional data in this study limits our ability to establish causality and explore the dynamic relationship between BMI and perceived depression over time. While the CGSS dataset offers a large sample size and national representativeness, panel data would allow for a better control of individual fixed effects and enable the investigation of the longitudinal effects of BMI on depression. Third, the study’s findings are limited by the fact that while the estimates are statistically significant, Pseudo R2 are quite small, suggesting that the predictors included in the analysis may not fully capture the complexity of the relationship between the variables. It is possible that additional variables or more sophisticated modeling techniques could increase the explanatory power of the model.
Future Research Direction
To better understand the relationship between BMI and depression, future research should focus on addressing the limitations of previous studies. First, researchers could explore the use of other depression indexes based on better scales to improve the reliability of results. Objective measures such as clinical diagnoses or validated scales like the Patient Health Questionnaire or the Beck Depression Inventory could be utilized to provide more comprehensive and accurate data on depression. In addition, researchers could use Online Photovoice (OPV) as an important method. OPV would provide opportunities for participants to express their experiences with as little manipulation as possible, compared to traditional quantitative methods,111–113 thus providing a more nuanced and personal understanding of the relationship between BMI and depression, especially in the Chinese context.
Second, future studies should consider utilizing panel data to better control for individual fixed effects and explore the dynamic characteristics of the relationship between BMI and depression over time. Longitudinal studies can provide more accurate and detailed insights into how changes in BMI and depression are interrelated and how they may influence each other over time, which would allow researchers to gain a more in-depth understanding of the relationship between BMI and depression. Third, future research could focus on incorporating more control variables into the analysis as more data become available. This could involve identifying potential confounding variables that could influence the relationship between the variables of interest, and including them in the analysis to better isolate the effects of the predictors under investigation. Such an approach may help to increase the accuracy and robustness of the model, providing a more comprehensive understanding of the relationship between BMI and perceived depression.
Conclusion
This study empirically analyzes the relationship between BMI and perceived depression using data from Chinese General Social Survey (CGSS). To examine the nonlinear relationship between the two factors, BMI and its squared term are both included in the regression analysis. The results indicate that, first, the estimated coefficients of both BMI and its quadratic term are significant, and the estimated coefficient of BMI is significantly negative while that of BMI’s squared term is positive. This implies a nonlinear U-shaped relationship between BMI and perceived depression.
Second, the inflection point (25.719) of the U-shaped association is very close to while slightly higher than the upper limit of the range of healthy weight (18.500≤BMI<25.000) classified by the World Health Organization. This demonstrates that, on the left side of the turning point, depression drops with BMI increasing, meaning that a very small BMI can be associated with more depressive disorders. Roughly after exceeding the healthy weight limit, further rises in BMI increase the level of perceived depression. Therefore, both too large and too small BMI are associated with depressive symptoms. Third, the U-shaped relationship between BMI and perceived depression is very robust when dealing with measurement error in perceived depression, addressing outliers of BMI, testing the reliability of the U-shaped curve, and applying a variety of statistical models. Fourth, results of the heterogeneity analysis indicate that perceived depression is higher at almost all BMI levels among individuals who are older, female, lower educated, unmarried, in rural areas, belonging to ethnic minorities and non-Communist Party of China members, as well as those with lower income and uncovered by social security. Besides, these subgroups have smaller turning points and their self-rated depression is more sensitive to BMI.
Data Sharing Statement
The data that support the findings of this study are available from Chinese General Social Survey (CGSS, http://cgss.ruc.edu.cn/English/Home.htm). Restrictions apply to the availability of these data, which were used under license for this study. Data are available from the corresponding authors Chao Li and Xiaoru Niu with the permission of CGSS.
Informed Consent Statement
The survey program of Chinese General Social Survey (CGSS) was organized by Renmin University of China. CGSS was in accordance with the ethical standards of the Ethics Committee of Renmin University of China. Informed consent was assigned and obtained from all individual participants. All procedures conducted in this study were approved by the Institutional Review Board of Business School, Shandong University and were in line with the 1964 Helsinki declaration and its later amendments or comparable ethical standards.
Author Contributions
All authors made a significant contribution to the work reported, whether that is in the conception, study design, execution, acquisition of data, analysis and interpretation, or in all these areas; took part in drafting, revising or critically reviewing the article; gave final approval of the version to be published; have agreed on the journal to which the article has been submitted; and agree to be accountable for all aspects of the work.
Funding
This research was funded by the Humanities and Social Science Research Project of the Ministry of Education of China (grant number 19YJC790055 & 22YJC840012); the Project of the Natural Science Foundation of China (grant number 71973081 & 72073082); the Project of the Natural Science Foundation of Shandong Province, China (grant number ZR2020QG038); the Project of the Social Science Foundation of Shandong Province, China (grant number 19DJJJ08 & 21DRKJ03); the Key R&D Projects (Soft Science) of Shandong Province, China (grant number 2021RZB05024), and the Research Project of Humanities and Social Sciences of Shandong University (grant number IFWF2029).
Disclosure
The authors report no conflicts of interest in this work.
References
1. World Health Organization. Introduction to depression; 2021. Available from: https://www.who.int/news-room/fact-sheets/detail/depression.
2. De Wit LM, Van Straten A, Van Herten M, Penninx BW, Cuijpers P. Depression and body mass index, a U-shaped association. BMC Public Health. 2009;9(1):1–6. doi:10.1186/1471-2458-9-14
3. World Health Organization. Introduction to obesity and overweight; 2021. Available from: https://www.who.int/news-room/fact-sheets/detail/obesity-and-overweight.
4. Luppino FS, de Wit LM, Bouvy PF, et al. Overweight, obesity, and depression. Arch Gen Psychiatry. 2010;67(3):220. doi:10.1001/archgenpsychiatry.2010.2
5. Cao B, Xu J, Li R, Teopiz KM, McIntyre RS, Chen H. Interventions targeting comorbid depression and overweight/obesity: a systematic review. J Affect Disord. 2022;314:222–232. doi:10.1016/j.jad.2022.07.027
6. Plackett B. The vicious cycle of depression and obesity. Nature. 2022;608(7924):42–43. doi:10.1038/d41586-022-02207-8
7. Badillo N, Khatib M, Kahar P, Khanna D. Correlation between body mass index and depression/depression-like symptoms among different genders and races. Cureus. 2022;14(2):21841. doi:10.7759/cureus.21841
8. Dragan A, Akhtar-Danesh N. Relation between body mass index and depression: a structural equation modeling approach. BMC Med Res Methodol. 2007;7(1):17. doi:10.1186/1471-2288-7-17
9. Mannan M, Mamun A, Doi S, Clavarino A. Is there a bi-directional relationship between depression and obesity among adult men and women? Systematic review and bias-adjusted meta analysis. Asian J Psychiatr. 2016;21:51–66. doi:10.1016/j.ajp.2015.12.008
10. Magnusson PKE, Rasmussen F, Lawlor DA, Tynelius P, Gunnell D. Association of body mass index with suicide mortality: a prospective cohort study of more than one million men. Am J Epidemiol. 2005;163(1):1–8. doi:10.1093/aje/kwj002
11. Yu M, Shi Y, Gu L, Wang W. “Jolly fat” or “sad fat”: a systematic review and meta-analysis of the association between obesity and depression among community-dwelling older adults. Aging Ment Health. 2020;26(1):13–25. doi:10.1080/13607863.2020.1857687
12. Delahanty LM, Meigs JB, Hayden D, Williamson DA, Nathan DM. Psychological and behavioral correlates of baseline BMI in the Diabetes Prevention Program (DPP). Diabetes Care. 2002;25(11):1992–1998. doi:10.2337/diacare.25.11.1992
13. Johnston E, Johnson S, McLeod P, Johnston M. The relation of body mass index to depressive symptoms. Can J Public Health. 2004;95(3):179–183. doi:10.1007/bf03403643
14. Kim T, Kim JJ, Kim MY, Kim SK, Roh S, Seo JS. A U-shaped association between body mass index and psychological distress on the multiphasic personality inventory: retrospective cross-sectional analysis of 19-year-old men in Korea. J Korean Med Sci. 2015;30(6):793. doi:10.3346/jkms.2015.30.6.793
15. Noh J-W, Kwon YD, Park J, Kim J. Body mass index and depressive symptoms in middle aged and older adults. BMC Public Health. 2015;15(1):310. doi:10.1186/s12889-015-1663-z
16. Carpenter KM, Hasin DS, Allison DB, Faith MS. Relationships between obesity and DSM-IV major depressive disorder, suicide ideation, and suicide attempts: results from a general population study. Am J Public Health. 2000;90(2):251–257. doi:10.2105/ajph.90.2.251
17. McCrea RL, Berger YG, King MB. Body mass index and common mental disorders: exploring the shape of the association and its moderation by age, gender and education. Int J Obes. 2011;36(3):414–421. doi:10.1038/ijo.2011.65
18. Seo BK, Kim JH. Intergenerational coresidence and life satisfaction in old age: the moderating role of homeownership. Appl Res Qual Life. 2022;17(5):3199–3216. doi:10.1007/s11482-022-10062-y
19. Karamihalev S, Brivio E, Flachskamm C, Stoffel R, Schmidt MV, Chen A. Social dominance mediates behavioral adaptation to chronic stress in a sex-specific manner. Elife. 2020;9. doi:10.7554/elife.58723
20. Han LKM, Dinga R, Hahn T, et al. Brain aging in major depressive disorder: results from the ENIGMA major depressive disorder working group. Mol Psychiatry. 2020;26(9):5124–5139. doi:10.1038/s41380-020-0754-0
21. Salk RH, Hyde JS, Abramson LY. Gender differences in depression in representative national samples: meta-analyses of diagnoses and symptoms. Psychol Bull. 2017;143(8):783–822. doi:10.1037/bul0000102
22. Purtle J, Nelson KL, Yang Y, Langellier B, Stankov I, Diez Roux AV. Urban–rural differences in older adult depression: a systematic review and meta-analysis of comparative studies. Am J Prev Med. 2019;56(4):603–613. doi:10.1016/j.amepre.2018.11.008
23. Zhang N, Nazroo J, Vanhoutte B. The relationship between rural to urban migration in China and risk of depression in later life: an investigation of life course effects. Soc Sci Med. 2021;270:113637. doi:10.1016/j.socscimed.2020.113637
24. Lorenzo EC, Kuchel GA, Kuo CL, Moffitt TE, Diniz BS. Major depression and the biological hallmarks of aging. Ageing Res Rev. 2022;83:101805. doi:10.1016/j.arr.2022.101805
25. Segel-Karpas D, Palgi Y, Shrira A. The reciprocal relationship between depression and physical morbidity: the role of subjective age. Health Psychol. 2017;36(9):848–851. doi:10.1037/hea0000542
26. Mitina M, Young S, Zhavoronkov A. Psychological aging, depression, and well-being. Aging. 2020;12(18):18765. doi:10.18632/aging.103880
27. Aoki T, Inoue M. Association between health literacy and patient experience of primary care attributes: a cross-sectional study in Japan. PLoS One. 2017;12(9):0184565. doi:10.1371/journal.pone.0184565
28. Zajacova A, Lawrence EM. The relationship between education and health: reducing disparities through a contextual approach. Annu Rev Pub Health. 2018;39(1):273–289. doi:10.1146/annurev-publhealth-031816-044628
29. Raghupathi V, Raghupathi W. The influence of education on health: an empirical assessment of OECD countries for the period 1995–2015. Arch Public Health. 2020;78(1):1–18. doi:10.1186/s13690-020-00402-5
30. Patria B. The longitudinal effects of education on depression: finding from the Indonesian national survey. Front Public Health. 2022;10:1017995. doi:10.3389/fpubh.2022.1017995
31. Khaled SM, Gray R. Depression in migrant workers and nationals of Qatar: an exploratory cross-cultural study. Int J Soc Psychiatry. 2019;65(5):354–367. doi:10.1177/0020764019850589
32. Zlotnick C, Manor-Lavon I, Leahy-Warren P. Relationship between social support and postpartum depression in migrant and non-migrant first-time mothers. J Clin Nurs. 2022;00:1–11. doi:10.1111/jocn.16297
33. Garabiles MR, Lao CK, Xiong Y, Hall BJ. Exploring comorbidity between anxiety and depression among migrant Filipino domestic workers: a network approach. J Affect Disord. 2019;250:85–93. doi:10.1016/j.jad.2019.02.062
34. Chen L, Qu L. From stressful experiences to depression in Chinese migrant children: the roles of stress mindset and coping. Front Psychol. 2021;12:601732. doi:10.3389/fpsyg.2021.601732
35. Erulkar A, Medhin G. Factors associated with depression among young female migrants in Ethiopia. BMC Women's Health. 2022;22(1):432. doi:10.1186/s12905-022-02017-0
36. Li C, Zhang X, Cheng X. Perceived discrimination, integration, depression and behavioral problems among Chinese migrant children: examining the moderating role of migration pattern in the rural-urban dual system. Health Soc Care Community. 2022;30(5):2961–2972. doi:10.1111/hsc.13740
37. Liu D, Xi J, Hall BJ, et al. Attitudes toward aging, social support and depression among older adults: difference by urban and rural areas in China. J Affect Disord. 2020;274:85–92. doi:10.1016/j.jad.2020.05.052
38. Fu Q. Bringing urban governance back in: neighborhood conflicts and depression. Soc Sci Med. 2018;196:1–9. doi:10.1016/j.socscimed.2017.10.035
39. Kang C, Zheng Y, Yang L, et al. Prevalence, risk factors and clinical correlates of suicidal ideation in adolescent patients with depression in a large sample of Chinese. J Affect Disord. 2021;290:272–278. doi:10.1016/j.jad.2021.04.073
40. Curran E, Rosato M, Cooper J, Mc Garrigle CA, Leavey G. Symptom profiles of late-life anxiety and depression: the influence of migration, religion and loneliness. Depress Anxiety. 2019;36(9):824–833. doi:10.1002/da.22893
41. Braam AW, Koenig HG. Religion, spirituality and depression in prospective studies: a systematic review. J Affect Disord. 2019;257:428–438. doi:10.1016/j.jad.2019.06.063
42. Cummings JR, Ji X, Lally C, Druss BG. Racial and ethnic differences in minimally adequate depression care among medicaid-enrolled youth. J Am Acad Child Psychiatry. 2019;58(1):128–138. doi:10.1016/j.jaac.2018.04.025
43. Mansour R, Tsamakis K, Rizos E, et al. Late-life depression in people from ethnic minority backgrounds: differences in presentation and management. J Affect Disord. 2020;264:340–347. doi:10.1016/j.jad.2019.12.031
44. Marr NC, Van Liew C, Carovich TF, Cecchini GA, McKinley LE, Cronan TA. The effects of racial/ethnic minority status on sleep, mood disturbance, and depression in people with fibromyalgia. Psychol Res Behav Manag. 2020;13:343–353. doi:10.2147/prbm.s242699
45. Shakeel N, Sletner L, Falk RS, et al. Prevalence of postpartum depressive symptoms in a multiethnic population and the role of ethnicity and integration. J Affect Disord. 2018;241:49–58. doi:10.1016/j.jad.2018.07.056
46. Ridley M, Rao G, Schilbach F, Patel V. Poverty, depression, and anxiety: causal evidence and mechanisms. Science. 2020;370(6522):1289. doi:10.1126/science.aay0214
47. Naviganuntana Y, Kerdcharoen N, Rawdaree P. Factors associated with depressive symptoms in elderly individuals living in urban communities. Psychol Res Behav Manag. 2022;15:855–864. doi:10.2147/prbm.s348782
48. Mossakowski KN. The influence of past unemployment duration on symptoms of depression among young women and men in the United States. Am J Public Health. 2009;99(10):1826–1832. doi:10.2105/ajph.2008.152561
49. López-López JA, Kwong AS, Washbrook E, et al. Trajectories of depressive symptoms and adult educational and employment outcomes. BJPsych Open. 2020;6(1):6. doi:10.1192/bjo.2019.90
50. Pieters J, Klasen S. Randomization for women’s economic empowerment? Lessons and limitations of randomized experiments. World Dev. 2020;127:104820. doi:10.1016/j.worlddev.2019.104820
51. Martínez PG, Blanco C, Wall MM, Liu S-M, Olfson M. Sex differences on the relation between major depressive disorder and labor market outcomes: a national prospective study. J Psychiatr Res. 2020;124:144–150. doi:10.1016/j.jpsychires.2020.02.031
52. Chen X, Wang T, Busch SH. Does money relieve depression? Evidence from social pension expansions in China. Soc Sci Med. 2019;220:411–420. doi:10.1016/j.socscimed.2018.12.004
53. Zhou M, Sun X, Huang L. Does social pension expansion relieve depression and decrease medical costs? Evidence from the rural elderly in China. Int J Public Health. 2022;67:1604296. doi:10.3389/ijph.2022.1604296
54. Sun J, Lyu S, Li C, Coyte PC. The contribution of urban and rural resident basic medical insurance to income-related inequality in depression among middle-aged and older adults: evidence from China. J Affect Disord. 2021;293:168–175. doi:10.1016/j.jad.2021.06.027
55. Smith MV, Mazure CM. Mental health and wealth: depression, gender, poverty, and parenting. Annu Rev Clin Psychol. 2021;17(1):181–205. doi:10.1146/annurev-clinpsy-071219-022710
56. Seo BK, Hwang IH, Sun Y, Chen J. Homeownership, depression, and life satisfaction in China: the gender and urban-rural disparities. Int J Env Res Public Health. 2022;19(22):14833. doi:10.3390/ijerph192214833
57. Wang H, Chen M, Xin T, Tang K. Number of children and the prevalence of later-life major depression and insomnia in women and men: findings from a cross-sectional study of 0.5 million Chinese adults. BMC Psychiatry. 2020;20(1):1–10. doi:10.1186/s12888-020-02681-2
58. Grundy E, van den Broek T, Keenan K. Number of children, partnership status, and later-life depression in Eastern and Western Europe. J Gerontol B Psychol. 2017;74(2):353–363. doi:10.1093/geronb/gbx050
59. Tirumalaraju V, Suchting R, Evans J, et al. Risk of depression in the adolescent and adult offspring of mothers with perinatal depression. JAMA Netw Open. 2020;3(6):208783. doi:10.1001/jamanetworkopen.2020.8783
60. Khazanov GK, Ruscio AM. Is low positive emotionality a specific risk factor for depression? A meta-analysis of longitudinal studies. Psychol Bull. 2016;142(9):991–1015. doi:10.1037/bul0000059
61. Thomas DM, Bredlau C, Bosy-Westphal A, et al. Relationships between body roundness with body fat and visceral adipose tissue emerging from a new geometrical model. Obesity. 2013;21(11):2264–2271. doi:10.1002/oby.20408
62. Aggarwal R, Bibbins-domingo K, Chiu N, Wadhera R, Yeh RW, Kazi D. Reducing diabetes disparities: diabetes screening in Asian Americans should begin at a lower body mass index threshold. Circulation. 2021;143(Suppl_1). doi:10.1161/circ.143.suppl_1.p064
63. Wei L, Xue W, Shi Z. Comparisons of visceral adiposity index, body shape index, body mass index and waist circumference and their associations with diabetes mellitus in adults. Nutrients. 2019;11(7):1580. doi:10.3390/nu11071580
64. Tomlinson D, Erskine R, Morse C, Onambélé G. Body fat percentage, body mass index, fat mass index and the ageing bone: their singular and combined roles linked to physical activity and diet. Nutrients. 2019;11(1):195. doi:10.3390/nu11010195
65. Xiang H, Yang R, Tu J, Guan X, Tao X. Health impacts of high BMI in China: terrible present and future. Int J Env Res Public Health. 2022;19(23):16173. doi:10.3390/ijerph192316173
66. Pandey A, LaMonte M, Klein L, et al. Relationship between physical activity, body mass index, and risk of heart failure. J Am Coll Cardiol. 2017;69(9):1129–1142. doi:10.1016/j.jacc.2016.11.081
67. Segar MW, Khan MS, Patel KV, et al. Prevalence and prognostic implications of diabetes with cardiomyopathy in community-dwelling adults. J Am Coll Cardiol. 2021;78(16):1587–1598. doi:10.1016/j.jacc.2021.08.020
68. Tomic D, Shaw JE, Magliano DJ. The burden and risks of emerging complications of diabetes mellitus. Nat Rev Endocrinol. 2022;18(9):525–539. doi:10.1038/s41574-022-00690-7
69. Pearson-Stuttard J, Zhou B, Kontis V, Bentham J, Gunter MJ, Ezzati M. Retracted: worldwide burden of cancer attributable to diabetes and high body mass index: a comparative risk assessment. Lancet Diabetes Endo. 2018;6(2):95–104. doi:10.1016/s2213-8587(17)30366-2
70. Sjöholm K, Carlsson LMS, Svensson P-A, et al. Association of bariatric surgery with cancer incidence in patients with obesity and diabetes: long-term results from the Swedish obese subjects study. Diabetes Care. 2021;45(2):444–450. doi:10.2337/dc21-1335
71. Li G, Xing Y, Wang G, et al. Differential effect of pre-pregnancy low BMI on fetal macrosomia: a population-based cohort study. BMC Med. 2021;19(1):175. doi:10.1186/s12916-021-02046-w
72. Bhasin A, Nam H, Yeh C, Lee J, Liebovitz D, Achenbach C. Is BMI higher in younger patients with COVID-19? Association between BMI and COVID-19 hospitalization by age. Obesity. 2020;28(10):1811–1814. doi:10.1002/oby.22947
73. Pranata R, Lim MA, Yonas E, et al. Body mass index and outcome in patients with COVID-19: a dose–response meta-analysis. Diabetes Metab. 2021;47(2):101178. doi:10.1016/j.diabet.2020.07.005
74. Lontchi-Yimagou E, Dasgupta R, Anoop S, et al. An atypical form of diabetes among individuals with low BMI. Diabetes Care. 2022;45(6):1428–1437. doi:10.2337/dc21-1957
75. Wada H, Ikeda A, Maruyama K, et al. Low BMI and weight loss aggravate COPD mortality in men, findings from a large prospective cohort: the JACC study. Sci Rep. 2021;11(1):1–9. doi:10.1038/s41598-020-79860-4
76. Chen Y, Zheng H, Zhang G, Chen F, Chen L, Yang Z. High oscillospira abundance indicates constipation and low BMI in the Guangdong gut microbiome project. Sci Rep. 2020;10(1):9364. doi:10.1038/s41598-020-66369-z
77. World Health Organization. Introduction to malnutrition; 2021. Available from; https://www.who.int/news-room/fact-sheets/detail/malnutrition.
78. Van Beekum M, Berger J, Van Geystelen J, et al. The associations between stunting and wasting at 12 months of age and developmental milestones delays in a cohort of Cambodian children. Sci Rep. 2022;12(1):17859. doi:10.1038/s41598-022-22861-2
79. Djoumessi YF. The impact of malnutrition on infant mortality and life expectancy in Africa. Nutrition. 2022;111760:103–104. doi:10.1016/j.nut.2022.111760
80. Jeong S, Han K, Kim D, Rhee SY, Jang W, Shin DW. Body mass index, diabetes, and the risk of Parkinson’s disease. Mov Disord. 2019;35(2):236–244. doi:10.1002/mds.27922
81. Nakken O, Meyer HE, Stigum H, Holmøy T. High BMI is associated with low ALS risk. Neurology. 2019;93(5):424–432. doi:10.1212/wnl.0000000000007861
82. Mac Giollabhui N, Swistun D, Murray S, et al. Executive dysfunction in depression in adolescence: the role of inflammation and higher body mass. Psychol Med. 2019;50(4):683–691. doi:10.1017/s0033291719000564
83. Khidri FF, Riaz H, Bhatti U, et al. Physical activity, dietary habits and factors associated with depression among medical students of Sindh, Pakistan, during the COVID-19 pandemic. Psychol Res Behav Manag. 2022;15:1311–1323. doi:10.2147/prbm.s364540
84. Oddy WH, Allen KL, Trapp GSA, et al. Dietary patterns, body mass index and inflammation: pathways to depression and mental health problems in adolescents. Brain Behav Immun. 2018;69:428–439. doi:10.1016/j.bbi.2018.01.002
85. Patsalos O, Keeler J, Schmidt U, Penninx BWJH, Young AH, Himmerich H. Diet, obesity, and depression: a systematic review. J Pers Med. 2021;11(3):176. doi:10.3390/jpm11030176
86. Patalay P, Hardman CA. Comorbidity, codevelopment, and temporal associations between body mass index and internalizing symptoms from early childhood to adolescence. JAMA Psychiatry. 2019;76(7):721. doi:10.1001/jamapsychiatry.2019.0169
87. Xie F, Jiang L, Liu Y, et al. Gender differences in the associations between body mass index, depression, anxiety, and stress among endocrinologists in China. BMC. 2023;11:116. doi:10.1186/s40359-023-01150-1
88. Eik-Nes TT, Tokatlian A, Raman J, Spirou D, Kvaløy K. Depression, anxiety, and psychosocial stressors across BMI classes: a Norwegian population study-the HUNT study. Front Endocrinol. 2022;13:886148. doi:10.3389/fendo.2022.886148
89. He K, Pang T, Huang H. The relationship between depressive symptoms and BMI: 2005–2018 NHANES data. J Affect Disord. 2022;313:151–157. doi:10.1016/j.jad.2022.06.046
90. Hu JQ, Ji YX, Dai N, Lin C, Chai Y. The correlation of body mass index with clinical factors in patients with first-episode depression. Front Psychiatry. 2022;13. doi:10.3389/fpsyt.2022.938152
91. Engel GL. The need for a new medical model: a challenge for biomedicine. Science. 1977;196(4286):129–136. doi:10.1126/science.847460
92. Gagliese L, Gauthier LR, Narain N, Freedman T. Pain, aging and dementia: towards a biopsychosocial model. Prog Neuropsychopharmacol. 2018;87:207–215. doi:10.1016/j.pnpbp.2017.09.022
93. Buckner JD, Morris PE, Abarno CN, Glover NI, Lewis EM. Biopsychosocial model social anxiety and substance use revised. Curr Psychiatry Rep. 2021;23(6):35. doi:10.1007/s11920-021-01249-5
94. Rodgers RF, Slater A, Gordon CS, McLean SA, Jarman HK, Paxton SJ. A biopsychosocial model of social media use and body image concerns, disordered eating, and muscle-building behaviors among adolescent girls and boys. J Youth Adolesc. 2020;49(2):99–409. doi:10.1007/s10964-019-01190-0
95. Daluiso-King G, Hebron C. Is the biopsychosocial model in musculoskeletal physiotherapy adequate? An evolutionary concept analysis. Physiother Theory Pract. 2020;38(3):373–389. doi:10.1080/09593985.2020.1765440
96. Nürnberger P, von Lewinski D, Rothenhäusler H-B, et al. A biopsychosocial model of severe fear of COVID-19. PLoS One. 2022;17(2):0264357. doi:10.1371/journal.pone.0264357
97. Wade DT, Halligan PW. The biopsychosocial model of illness: a model whose time has come. Clin Rehabil. 2017;31(8):995–1004. doi:10.1177/0269215517709890
98. Robinson E, Jones A, Marty L. The role of health-based food choice motives in explaining the relationship between lower socioeconomic position and higher BMI in UK and US adults. Int J Obes. 2022;46(10):1818–1824. doi:10.1038/s41366-022-01190-4
99. Cole TJ, Faith MS, Pietrobelli A, Heo M. What is the best measure of adiposity change in growing children: BMI, BMI%, BMI z-score or BMI centile? Eur J Clin Nutr. 2005;59(3):419–425. doi:10.1038/sj.ejcn.1602090
100. Ying Y, Gujju V, Hallum G, et al. The impact of BMI on the response to immunotherapy in lung cancer. J Clin Oncol. 2022;40(16_suppl):21003. doi:10.1200/jco.2022.40.16_suppl.e21003
101. Comes A, Wong AW, Fisher JH, et al. Association of BMI and change in weight with mortality in patients with fibrotic interstitial lung disease. Chest. 2022;161(5):1320–1329. doi:10.1016/j.chest.2021.11.008
102. Haans RFJ, Pieters C, Z-L H. Thinking about U: theorizing and testing U- and inverted U-shaped relationships in strategy research. Strateg Manag J. 2015;37(7):1177–1195. doi:10.1002/smj.2399
103. von Hippel PT, Lynch JL. Why are educated adults slim—causation or selection? Soc Sci Med. 2014;105:131–139. doi:10.1016/j.socscimed.2014.01.004
104. Cao W, Li L, Zhou X, Zhou C. Social capital and depression: evidence from urban elderly in China. Aging Ment Health. 2014;19(5):418–429. doi:10.1080/13607863.2014.948805
105. Kress AM, Peterson MR, Hartzell MC. Association between obesity and depressive symptoms among U.S. military active duty service personnel 2002. J Psychosom Res. 2006;60(3):263–271. doi:10.1016/j.jpsychores.2005.08.011
106. Sun Z, Li J. The effects of performance of public sector health system on quality of life in China: evidence from the CGSS 2015. Int J Env Res Public Health. 2020;17:1–16. doi:10.3390/ijerph17082896
107. Whiston A, Igou ER, Fortune DG. Emotion networks across self-reported depression levels during the COVID-19 pandemic. Cogn Emot. 2021;36:31–48. doi:10.1080/02699931.2021.1993147
108. Xu Q, Sun W. Does financial inclusion promote investment and affect residents’ happiness? —evidence from China. Front Psychol. 2022;13:1–10. doi:10.3389/fpsyg.2022.988312
109. Xu Z, Ge R. The impact of energy consumption revolution on farmers’ happiness: an empirical analysis from China. Front Public Health. 2022;10:1–10. doi:10.3389/fpubh.2022.778002
110. Zhang A, Zhang Y, Tao Y. Does retirement make people happier? Evidence from China. Front Public Health. 2022;10:1–13. doi:10.3389/fpubh.2022.874500
111. Armiya’u AY, Yildirim M, Muhammad A, Tanhan A, Young JS. Mental health facilitators and barriers during COVID-19 in Nigeria. J Asian Afr Stud. 2022;002190962211113. doi:10.1177/00219096221111354
112. Doyumğaç İ, Tanhan A, Kıymaz MS. Understanding the most important facilitators and barriers for online education during COVID-19 through online photovoice methodology. Learn Teach. 2021;10(1):166–190. doi:10.5430/ijhe.v10n1p166
113. Tanhan A, Strack RW. Online photovoice to explore and advocate for Muslim biopsychosocial spiritual wellbeing and issues: ecological systems theory and ally development. Curr Psychol. 2020;39(6):2010–2025. doi:10.1007/s12144-020-00692-6
 © 2023 The Author(s). This work is published and licensed by Dove Medical Press Limited. The
full terms of this license are available at https://www.dovepress.com/terms
and incorporate the Creative Commons Attribution
- Non Commercial (unported, 3.0) License.
By accessing the work you hereby accept the Terms. Non-commercial uses of the work are permitted
without any further permission from Dove Medical Press Limited, provided the work is properly
attributed. For permission for commercial use of this work, please see paragraphs 4.2 and 5 of our Terms.
© 2023 The Author(s). This work is published and licensed by Dove Medical Press Limited. The
full terms of this license are available at https://www.dovepress.com/terms
and incorporate the Creative Commons Attribution
- Non Commercial (unported, 3.0) License.
By accessing the work you hereby accept the Terms. Non-commercial uses of the work are permitted
without any further permission from Dove Medical Press Limited, provided the work is properly
attributed. For permission for commercial use of this work, please see paragraphs 4.2 and 5 of our Terms.