")
Back to Journals » Neuropsychiatric Disease and Treatment » Volume 19
The Neural Correlates of the Recognition of Emotional Intensity Deficits in Major Depression: An ERP Study
Authors Li M, Zhang J, Jiang C, Wang J, Sun R, Jin S, Zhang N, Zhou Z
Received 19 October 2022
Accepted for publication 31 December 2022
Published 12 January 2023 Volume 2023:19 Pages 117—131
DOI https://doi.org/10.2147/NDT.S393264
Checked for plagiarism Yes
Review by Single anonymous peer review
Peer reviewer comments 3
Editor who approved publication: Dr Roger Pinder
Miao Li,1,2 Jiazhao Zhang,3 Chenguang Jiang,2,4 Jun Wang,2 Ruhong Sun,5 Shayu Jin,5 Ning Zhang,1,* Zhenhe Zhou2,*
1Department of Psychology, Nanjing Brain Hospital Affiliated to Nanjing Medical University, Nanjing, People’s Republic of China; 2Department of Psychiatry, The Affiliated Wuxi Mental Health Center of Jiangnan University, Wuxi Central Rehabilitation Hospital, Wuxi, People’s Republic of China; 3Grade 2019 Class 6, Basic Medicine College of Jinzhou Medical University, Jinzhou, People’s Republic of China; 4Department of Psychosomatics and Psychiatry, Zhongda Hospital, School of Medicine, Southeast University, Nanjing, People’s Republic of China; 5Department of Psychiatry, Nanjing Medical University Graduate School, Nanjing, People’s Republic of China
*These authors contributed equally to this work
Correspondence: Ning Zhang, Department of Psychology, Nanjing Brain Hospital Affiliated to Nanjing Medical University, Nanjing, People’s Republic of China, Tel +86-13601588630, Email [email protected] Zhenhe Zhou, Department of Psychiatry, The Affiliated Wuxi Mental Health Center of Jiangnan University, Wuxi Central Rehabilitation Hospital, Wuxi, People’s Republic of China, Tel +86-13358118986, Email [email protected]
Purpose: Deficits in facial emotional intensity recognition have been associated with social cognition in patients with major depression. The study examined multiple event-related potential (ERP) components in patients with major depression and investigated the relationships between ERPs, social cognition, and clinical features.
Participants and Methods: Thirty-one patients met DSM-IV diagnosis of depression and 31 healthy participants completed the emotion intensity recognition task (EIRT), while ERPs were recorded. Data on ERP components (P100, N170, P200, and P300) were analyzed.
Results: The behavioral results showed that patients with major depression performed worse on EIRT, including all six categories of emotions (sadness, disgust, happiness, surprise, anger, and fear), compared to healthy participants. The ERP results showed that patients with major depression exhibited higher P100 amplitudes for sad and happy faces than healthy participants; P300 amplitudes induced by sad and surprise faces were also higher than in healthy participants, mainly in the central and temporal lobes. A positive correlation was found between sadness intensity scores and P100 amplitudes in patients with major depression.
Conclusion: Patients with major depression are biased in their identification of facial expressions indicating emotional intensity. Specifically, they have emotional biases in the early and late stages of cognitive processing, mainly in the form of sensitivity to sad stimuli. It may lead to a persistent rumination of sadness that is detrimental to the remission of depression. Additionally, patients with major depression devote different amounts of cognitive resources for different intensities of sad faces during the preconscious stage of cognitive processing. The more intense their perception of sadness, the more cognitive resources they devote. Therefore, the assessment of the intensity of facial expressions is an important research topic, with clinical implications on social cognitive function in patients with major depression.
Keywords: major depression, event-related potentials, emotional intensity recognition, social cognition, emotional tasks
Introduction
Depression is a widespread mental disorder characterized by significant and persistent depressed moods. In most countries, the prevalence of depression varies with the midpoint being approximately 10%. Today, depression remains one of the greatest challenges to public health because of its increasing incidence.1
Cognition is a higher brain function that includes the process of acquiring, encoding, manipulating, extracting, and using sensory input information in the act of cognition, which occurs in attention, memory, perception, and thinking. It includes neurocognition and social cognition. In the human brain, neurocognition is associated with specific pathways or loci that are affected by different disease processes. In cases where cognitive problems are suspected, it may be possible to determine which parts of the brain are involved by testing specific neurocognitive functions.
Social cognition consists of mental processes, psychological mechanisms, and reasoning interpretations of information of a social nature that individuals form perceptions, impressions, judgments, or reasoning interpretations of. It consists of four core components: theory of mind (ToM), emotional cognition, inferential explanations (attributional bias), and social perception.2
In social cognition, the ability to detect a person’s emotional state from their face is a key component. Facial expressions are a vital social stimulus in interpersonal interactions, a specific communication tool, and an emotional regulation tool with adaptive value. It has been found that patients with depression have different characteristics of deficits in emotion recognition. A meta-analysis of 23 studies has shown that MDD participants had lower accuracy in recognizing emotional facial expressions than healthy controls.3 This result is similar to another earlier meta-analysis found by Dalili et al.4 Furthermore, an earlier study has shown that major depressive patients show greater emotional intensity to distinguish between happy and sad emotional faces.5 Another study has demonstrated that people with MDD reported more difficulties with low-intensity positive affective displays than with high-intensity positive affective displays, which means they required more intense positive stimuli to feel pleasure from them.6 However, there is no clear explanation as to why depressed individuals have widespread deficits in facial emotion recognition.
Based on the continuous development of neurophysiology and computer technology, there are a growing number of methods to measure cognitive function, including functional magnetic resonance imaging (fMRI), functional near-infrared spectroscopy (fNIRS), and ERPs. Since the 1960s, ERPs provide an objective and feasible method for the study of human mental activity. It shows the electrophysiological changes in the brain under different stimulation states from the neurophysiological point of view, to study and evaluate human cognitive processes. ERPs are regarded as a critical test for capturing and analyzing brain waves associated with mental activity. It can directly measure neural activity with high temporal resolution and can be measured relatively easily and at a low cost in different populations and task designs.7
In this paper, we adopted the ERP method. Specifically, the current study used four well-studied components of the ERP associated with face processing: P100, N170, P200, and P300. First, the P100 component processes the low-level features of stimuli and reflects the fast and pre-conscious processing of emotions.8 According to a previous study, the patients with major depression had larger P100 amplitudes than healthy controls, suggesting early abnormalities in face processing can occur in depression at the P100 stage.9 Second, the N170 component is a prominent face-specific component that is reliably triggered by faces10 and it can be modulated by emotion processing.11 Several studies have indicated that sad faces elicited a larger N170 amplitude than neutral faces in depression.9,12 Third, the P200 component elicited by emotional input is considered indices of early and automatic detection of stimuli.13 In the Hu’s study, the patients with major depression tended to exhibit larger P200 amplitudes on happy faces compared with healthy controls.14 Jaworska et al found that the depressed individuals showed longer P200 latencies to intensely sad faces compared to the controls.15 Finally, the P300 component represents the endurance of attentional control centered around negative emotion, infusing attentional control at a later stage.16 Several studies have demonstrated that depressed individuals appear to have larger amplitudes of P300 in response to negative stimuli as compared with healthy individuals or positive stimuli.17–20 Hence, these findings provide good electrophysiological evidence that emotional processing biases in depression are not only present at the late cognitive stages of processing as reflected by abnormal P300 to emotional stimuli but also in the early processing stage as reflected by abnormal P100, N170, and P200 as well.
In addition, our study used pictures of facial expressions with different emotional potencies and intensities as research materials. Because for an emotional face to be effectively identified, accuracy (correct or incorrect recognition) is not enough; there must also be sensitivity (the level of emotional intensity necessary for accurate recognition).21 However, most current literature has focused on examining the accuracy of emotion expression recognition, while less emphasis has been placed on the perceived intensity of these emotions. A few experiments studying the “perceived” intensity of facial expressions have found some ambiguous results.22,23 Considering that facial expressions serve as an important nonverbal social cue in social interactions, we should go further to explore the perceived intensity of these stimuli, because either overestimating or underestimating the intensity of emotions shown by others may give rise to incorrect social judgments and inappropriate behaviors. To do this, we applied the emotion intensity recognition task (EIRT) to measure the differing intensities of six basic emotions (sadness, disgust, happiness, surprise, anger, and fear). The task was initially developed by Adolphs et al for patients with brain injury.24 The purpose of this experiment was to investigate whether abnormalities in emotional intensity recognition function occur in patients with major depression compared to healthy controls, in order to help to understand the social cognition characteristics of depression and explain the mechanisms of social functioning deficits in patients, and thus further understand the pathogenesis and underlying mechanisms of the disorder. Therefore, we proposed the following hypotheses: (1) patients with major depression may perform worse in the intensity of assessment of faces compared to healthy controls in the task; (2) patients with major depression may show a higher assessment of neurophysiological indicators of faces during the task (N170, P100, P200, and P300); and (3) there may be some correlation between patients with major depression on behavioral and ERP data in the task.
Materials and Methods
This research was conducted from May 19, 2020, to July 7, 2021, in the affiliated Wuxi Mental Health Center of Jiangnan University, Wuxi Central Rehabilitation Hospital. The protocol of this study was approved by the Ethics Committee of the Wuxi Mental Health Center, and it was conducted according to the Declaration of Helsinki.
Participants
All participants with depression were recruited from among inpatients at Wuxi Mental Health Center. They met the study inclusion criteria: 1) met the depression criteria set forth in the Diagnostic and Statistical Manual of Mental Disorders, Fourth Edition (DSM-IV); 2) 18–65 years of age; 3) no history of neurological illness or any other physical condition that might negatively impact cognitive function; 4) no history of electroconvulsive therapy (ECT) for nearly 6 months; and 5) informed consent for this study. The exclusion criteria were as follows: 1) substance abuse history and 2) significant visual and auditory impairment that would interfere with task performance. Healthy participants were recruited from the local community and underwent an assessment to screen for substance abuse as well as other psychiatric or medical illnesses that might affect cognitive function. Participants with a family history of psychiatric disorders were also excluded.
The participants provided written informed consent to participate in this study.
Clinical Assessments
A semistructured interview based on the Structured Clinical Interview for DSM-IV Disorders (SCID)25 was used to gather sociodemographic and clinical data from all participants. The Hamilton Depression Rating Scale (HDRS; 24 items) was used to assess the severity of depressive symptoms for patients with major depression by an experienced senior psychiatrist.26 The Cronbach’s coefficient of Chinese version was larger than 0.8.27
Measurements
EIRT
In the EIRT task, six categories of basic emotions (sadness, disgust, happiness, surprise, anger, and fear) were selected from a Chinese facial affective picture system.28 Six emotions, with 6 faces for each emotion, and 3 neutral faces made up in a total of 39 facial emotional stimuli. Inclusion criteria of happy faces valence value (3.22 < valence < 8.41); inclusion criteria of sad faces valence value (3.74 < valence < 7.10); inclusion criteria of disgust faces valence value (4.78 < valence < 7.67); inclusion criteria of surprise faces valence value (3.79 < valence < 7.84); inclusion criteria of anger faces valence value (4.17 < valence < 8.33); inclusion criteria of fear faces valence value (4.31 < valence < 8.61); inclusion criteria of neutral faces valence value (5.09 < valence < 6.24). The paradigm consists of six blocks, each named with six emotions. The set of 39 stimuli were presented in random order in each block with no time limit, for 234 trials in total. Six blocks were in a fixed order: sadness, disgust, happiness, surprise, anger, and fear. Stimulus presentation and data acquisition were controlled by E-Prime software version 3.0 (Psychology Software Tools, Pittsburgh, PA). Stimuli were presented on a 19-inch computer monitor with a screen resolution of 1280×1024 pixels (60 Hz refresh rate). Participants were seated in a well-lit room, 60 cm from the computer screen. The task began with five practice trials to help participants become acquainted with the procedure. In addition, the researchers monitored the participants during each block of time of the task. Each trial began with the appearance of a central fixation cross (FC) to require participants to maintain their gaze on the trial. Then, a picture of an emotional face appeared, and the participants were asked to assess the intensity of these facial emotion stimuli according to the emotion name of the block, on a scale from 0 (no emotion at all) to 5 (very strong emotion) by pressing the number keys on the computer. Until the participants made a press response, the emotional faces remained on screen. The intertrial interval (ITI) randomly ranged from 500 to 2000 ms. The interblock interval was 30s for rest. The total task takes approximately 30 min. The participants were asked to respond as quickly and accurately as possible during the task. The procedure of EIRT is sketched in Figure 1. In particular, all our trials started at 9:00 am so as to exclude potential effects from individual cognitive changes during the day.
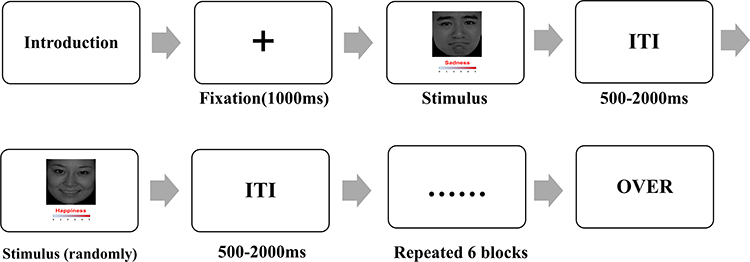 |
Figure 1 Example of the item and user interface of the emotion intensity recognition task. Abbreviation: ITI, inter-trial interval. |
EEG Signal Recording and ERP Analysis
A BioSemi Active Two system was applied to continuously record EEG at a digitized rate of 500 Hz. A custom BrainCap (EasyCap, Herrsching, Germany) containing 64 Ag/AgCl ring electrodes was set up for EEG recording according to the international 10/20 system. A vertical electrooculogram (EOG) was obtained from electrodes placed above and below the left eye. We kept the impedances of all electrodes below 5 kilohms (kΩ). The horizontal EOG was derived from the electrode located beside each eye. As soon as the participants stated that they understood the instructions and were ready to start, the continuous EEG was recorded. The EEG signal was preamplified to enhance the signal-to-noise ratio on the electrodes. The raw EEG data were processed using Brain Vision Analyzer 2.1 (Brain Products GmbH, Munich, Germany) and referenced offline to the average of the left and right mastoids, whereas continuous signals were filtered at 0.01 Hz for high-pass and 30 Hz for low-pass during offline signal analysis. The EEG was epoched from −200 ms to 1000 ms before and after the stimulus marker and the baseline was corrected using the mean from −200 ms to 0 ms. If the voltage steps exceeded 50 microvolts (μV)/ms or a voltage gap of less than 0.50 μV was captured in 100 consecutive ms, the data for a single channel were rejected. In addition, both electric eye artifact elimination and data correction were carried out by the independent component analysis (ICA) statistical procedure.29 According to the outcomes of grand average, ERP components (P100, N170, P200, and P300) were used for analysis. Finally, three regions of interest (central region: C3, C4, Cz; temporal region: T7, T8; occipital region: O1, Oz, O2) were selected for further analysis. The ERP components were analyzed in time-window: P100 (80–130 ms), N170 (130–200 ms), P200 (150–300 ms), and P300 (300–600 ms). The time window and electrode selection for each component were based on previously reported literature and topographical distribution.30–32 We measured the peak amplitude and latency of each ERP component and electrode site and then averaged amplitudes and latencies for each of the three brain regions.
Statistical Analysis
We used the Mann–Whitney U-test and chi-square test for comparisons between groups based on demographic and clinical variables. We performed two levels of analysis in the emotional intensity recognition task. In the first step, we calculated correlation coefficients between each healthy participant and the remaining 30 healthy participants. As such, correlations near 1 indicate that the participant rated the stimulus normally, while those near 0 (or negative) indicate that the participant rated the stimulus very abnormally. Meanwhile, each depressed participant’s rating score of each face was correlated with the average rating score of that face by the healthy group. The purpose was to control for the possibility that different individuals may have different judgments of absolute intensity; thus, the method essentially prevents floor and ceiling effects. Afterward, the Fisher Z transform was applied to each participant’s correlation for each face to compute an average correlation for many faces at once.24,33–35 The Z test was performed on the Z-transformed scores between the two groups. Subsequently, reaction times(RTs) were analyzed using a two-way 2 (group: depression vs HCs) × 6 (type: happiness, sadness, fear, anger, disgust, and surprise) ANOVA. To analyze the EEG and ERP data, we ran a mixed-design ANOVA through a three-way 2 (group: depression vs HCs) × 6 (type: happiness, sadness, fear, anger, disgust, and surprise)×3 (region: central, temporal, and occipital) on the amplitudes and peak latencies of ERP components (P100, N170, P200, and P300). Correlations between behavioral data (RTs, intensity scores), ERP data, and HDRS scores were assessed using the Spearman correlation coefficient for the depression group. When appropriate, the Greenhouse–Geisser procedure was used to correct the degrees of freedom of the F ratio. We conducted Bonferroni corrections as post hoc analyses if needed. All analyses were performed with the Statistical Package for the Social Sciences (SPSS for Windows, Version 26.0). Statistical significance was set at P < 0.05. After significant effects, the effect size was determined using partial η2.
Results
Demographics and Clinical Sample Characteristics
Thirty-one patients with major depression (mean age 38.48 ±11.778, 17 female) and 31 healthy participants (mean age 32.52 ± 5.501, 11 female) took part in our experiment. Among the patients with major depression, 20 patients were diagnosed with first-episode depression and 11 patients with recurrent depression. Comparing patients with healthy participants, there was no significant difference in the male/female ratio (χ2 = 2.345, P = 0.126), age (U = 355.0, P = 0.054), or years of education (U = 351.0, P = 0.077). Among the patients, the mean performance on the HDRS scores was 27.52 (SD = 10.652) (Table 1). Thirty-one patients were treated with antidepressants medications: four with sertraline (mean dose 175.0 ± 28.87 mg/day), eight with escitalopram oxalate (mean dose 18.75 ± 2.31 mg/day), seven with mirtazapine (mean dose 36.43 ± 8.02 mg/day), five with paroxetine (mean dose 32.0 ± 8.37 mg/day), and seven with venlafaxine (mean dose 203.57 ± 26.73 mg/day). For patients, the mean fluoxetine-equivalent dose was 34.13 ± 14.23 mg/day as calculated according to the previous report.36
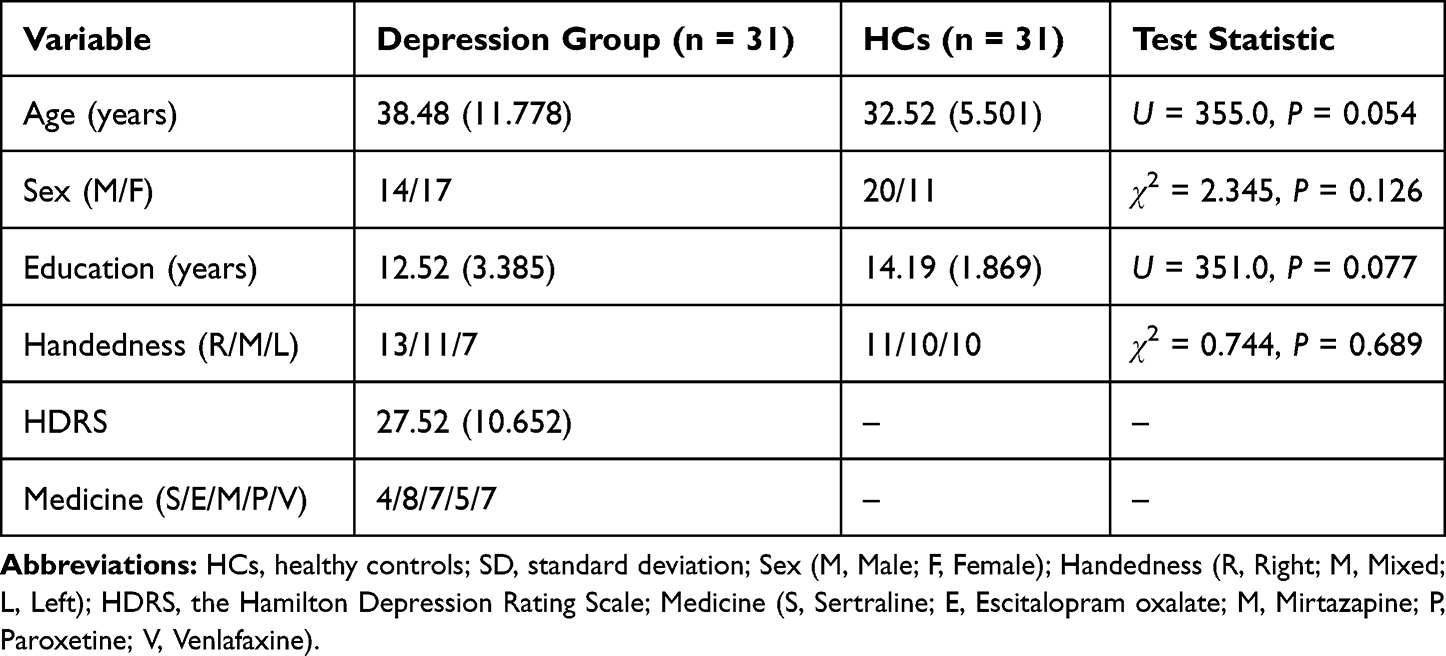 |
Table 1 Demographic Characteristics and Clinical Information of Participants (Mean (SD)) |
Emotion Intensity Recognition Task
The Z test revealed that the Z-transformed scores of six categories of basic emotions (sadness, disgust, happiness, surprise, anger, and fear) were obviously different between depressed participants and healthy controls (all P < 0.05). See Table 2 and Figure 2 for an overview.
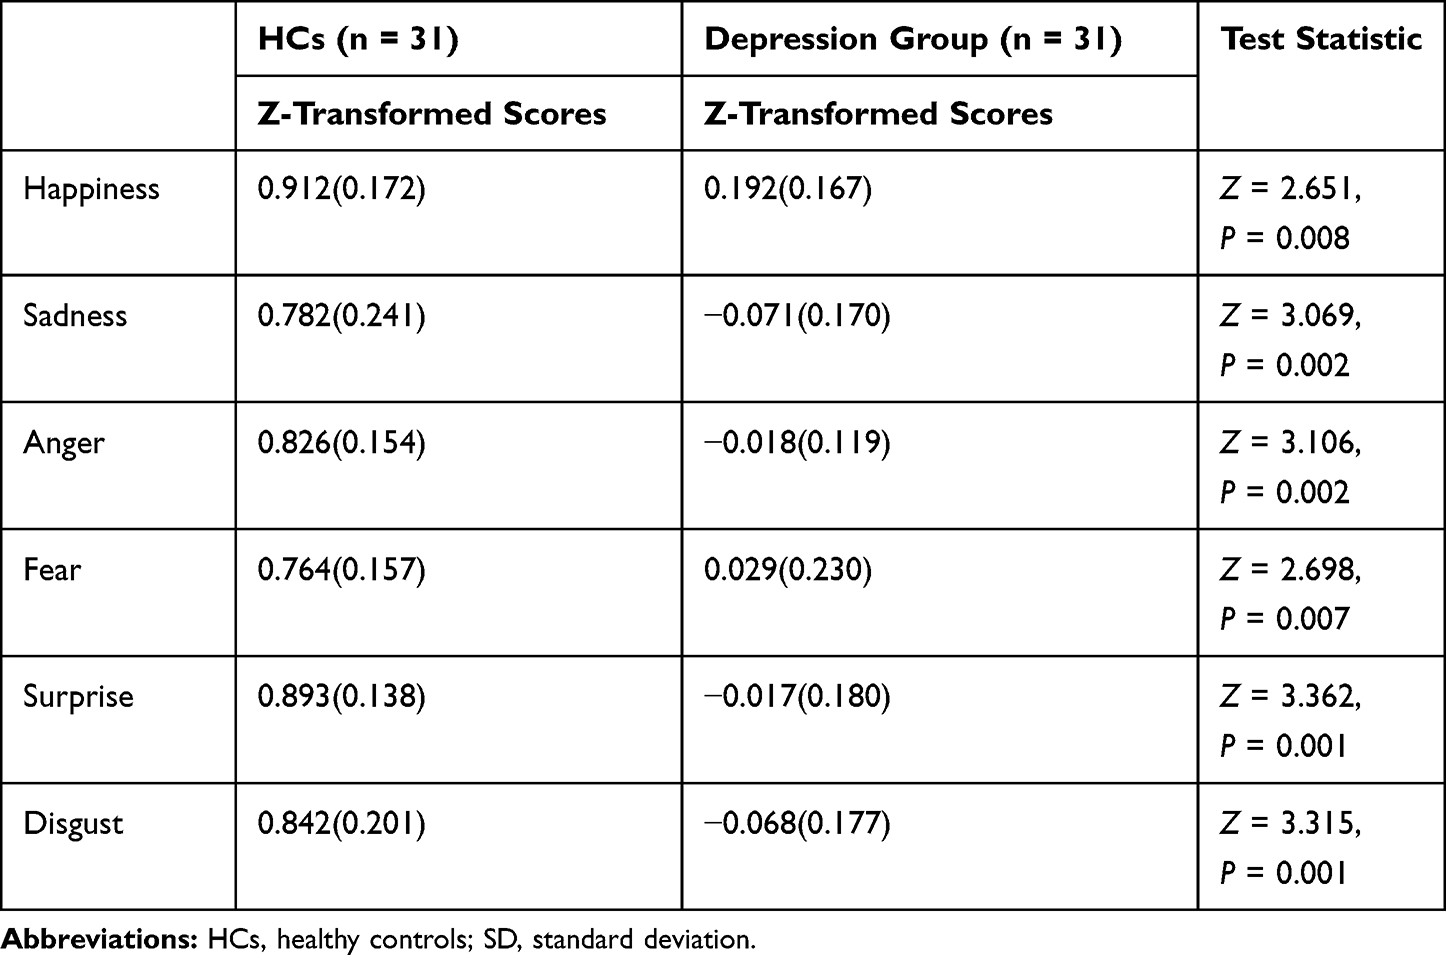 |
Table 2 Z-Transformed Scores of the Healthy Controls and Depression Group (Mean (SD)) |
 |
Figure 2 Z-transformed scores between healthy controls and depression patients in six categories of basic emotions (happiness, sadness, anger, fear, surprise, and disgust). **P < 0.01. Abbreviation: HCs, healthy controls. |
ANOVA of RTs yielded no significant effect of the type of emotion (F1,60 = 0.276, P = 0.601, η2 = 0.005). There was no significant interaction effect between emotion type and participant group (F3,300 = 1.347, P = 0.259, η2 = 0.022) (Figure 3).
 |
Figure 3 Reaction times between healthy controls and depression group in six categories of basic emotions (happiness, sadness, anger, fear, surprise, and disgust). Abbreviation: HCs, healthy controls. |
ERP Results
P100
The ANOVA on P100 amplitude showed a main effect of participant group (F1,60 = 10.309, P = 0.002, η2 = 0.147) and a significant effect of the type of emotion (F4,225 = 3.531, P = 0.010, η2 = 0.056). The interaction between emotion type and participant group was significant (F4,225 = 2.627, P = 0.039, η2 = 0.042). However, there was no interaction effect between emotion type, participant group and region (F7,405 = 1.613, P = 0.133, η2 = 0.026). Pairwise comparison indicated that the P100 amplitude was considerably different in sad faces (F1,60 = 24.054, P < 0.001, η2 = 0.286) and happy faces (F1,60 = 5.023, P = 0.029, η2 = 0.077), with a higher amplitude in the depression group than in the healthy group (Figure 4).
 |
Figure 4 Grand-averaged ERPs waveforms of the P100 components elicited by sad faces (A) at Oz electrode and happy faces (B) at T8 electrode. The grey area indicates the time window that was used to inspect the P100 amplitude. Abbreviation: HCs, healthy controls. |
For P100 latency, there was no significant effect of participant group (F1,60 = 2.803, P = 0.099, η2 = 0.045) and no significant effect of emotion type (F5,300 = 1.383, P = 0.230, η2 = 0.023). The interaction effect between emotion type and participant group was not significant (F5,278 = 0.678, P = 0.629, η2 = 0.011), and the interaction effect between region and participant group was not significant (F1,68 = 0.806, P = 0.388, η2 = 0.013). No interaction effect was found between emotion type, participant group and region (F7,437 = 1537, P = 0.150, η2 = 0.025) over P100 latency (Figure 5A).
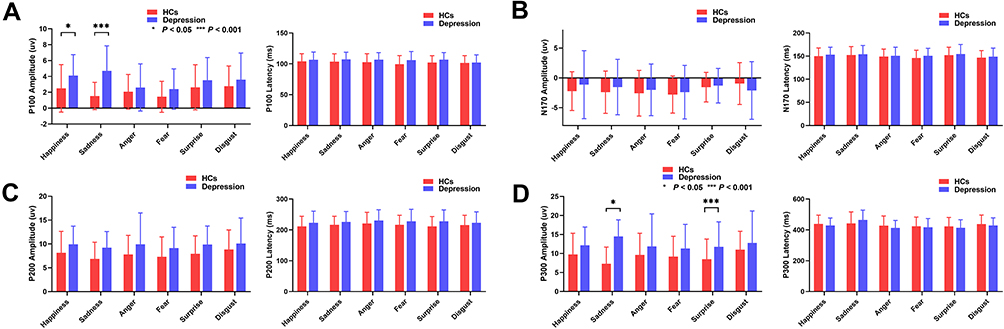 |
Figure 5 Amplitude and Latency of P100 (A), N170 (B), P200 (C), and P300 (D) between healthy controls and depression group in six categories of basic emotions (happiness, sadness, anger, fear, surprise, and disgust). *P < 0.05, ***P < 0.001. Abbreviation: HCs, healthy controls. |
N170
The ANOVA on N170 amplitude showed no main effect of participant group (F1,60 = 0.165, P = 0.686, η2 = 0.003) and no significant effect of emotion type (F4,247 = 1.924, P = 0.105, η2 = 0.031). There was a significant interaction effect between region and participant group (F1,74 = 4.312, P = 0.033, η2 = 0.067). The interaction between emotion type and participant group was not significant (F4,245 = 1.458, P = 0.214, η2 = 0.024). There was also no interaction effect between emotion type, participant group and region (F6,377 = 0.680, P = 0.672, η2 = 0.011) noted over the N170 amplitude. Pairwise comparison indicated that the average N170 amplitude in the occipital lobe (M = −3.606 µV) was higher than that in the temporal lobe (M = −1.165 µV; P = 0.002) and the central lobe (M = −0.475 µV; P < 0.001) in patients with major depression.
For N170 latency, there was no main effect of participant group (F1,60 = 0.553, P = 0.460, η2 = 0.009). A significant effect of emotion type (F5,300 = 2.519, P = 0.030, η2 = 0.040) was found. The interaction effect between emotion type and participant group was not significant (F4,267 = 0.138, P = 0.976, η2 = 0.002), and the interaction effect between region and participant group was not significant (F1,76 = 0.350, P = 0.606, η2 = 0.006). No interaction effect was found between emotion type, participant group and region (F8,450 = 1.121, P = 0.348, η2 = 0.018) over N170 latency (Figure 5B).
P200
The ANOVA on P200 amplitude showed a main effect of participant group (F1,60 = 5.263, P = 0.025, η2 = 0.081). The interaction between emotion type and participant group was not significant (F4,214 = 0.207, P = 0.919, η2 = 0.003). No interaction effect was found between emotion type, participant group and region (F5,319 = 0.519, P = 0.773, η2 = 0.009) over P200 amplitude. A significant interaction effect was found between region and participant group (F1,80= 5.822, P = 0.011, η2 = 0.088). Pairwise comparison indicated that P200 amplitude was considerably higher in patients with major depression in the central lobe (F1,60 = 9.522, P = 0.003, η2 = 0.137) and temporal lobe (F1,60 = 9.401, P = 0.003, η2 = 0.135) than in the healthy group.
For P200 latency, there was no main effect of participant group (F1,60 = 2.259, P = 0.138, η2 = 0.036). The interaction effect between emotion type and participant group was not significant (F5,282 = 0.380, P = 0.852, η2 = 0.006), and the interaction effect between region and participant group was not significant (F1,79 = 1.813, P = 0.180, η2 = 0.029). No interaction effect was found between emotion type, participant group and region (F8,462 = 0.578, P = 0.790, η2 = 0.010) over P200 latency (Figure 5C).
P300
ANOVA of the P300 amplitude showed a main effect of participant group (F1,60 = 7.166, P = 0.010, η2 = 0.107). The interaction effect between region and participant group was significant (F1,88 = 10.066, P = 0.001, η2 = 0.144), and the interaction effect between emotion type and participant group was significant (F3,188 = 3.686, P= 0.012, η2 = 0.058). A significant interaction effect was found between emotion type, participant group and region (F7,437 = 2.160, P = 0.034, η2 = 0.035) over P300 amplitude. Pairwise comparison indicated that P300 amplitude was considerably different in sad faces (F1,60 = 41.980, P < 0.001, η2 = 0.412) and surprise faces (F1,60 = 4.598, P = 0.036, η2 = 0.071), with higher amplitude in patients with major depression compared with the healthy group. Further analysis, of sad faces showed that patients with major depression had considerably higher P300 amplitudes in the central lobe (F1,60 = 67.800, P < 0.001, η2 = 0.531), temporal lobe (F1,60 = 24.457, P < 0.001, η2 = 0.290), and occipital lobe (F1,60 = 14.046, P < 0.001, η2 = 0.190) than healthy controls. For surprise faces, patients with major depression had higher P300 amplitudes in the central lobe (F1,60 = 5.458, P = 0.023, η2 = 0.083) and temporal lobe (F1,60 = 8.276, P = 0.006, η2 = 0.121) than healthy patients (Figure 6).
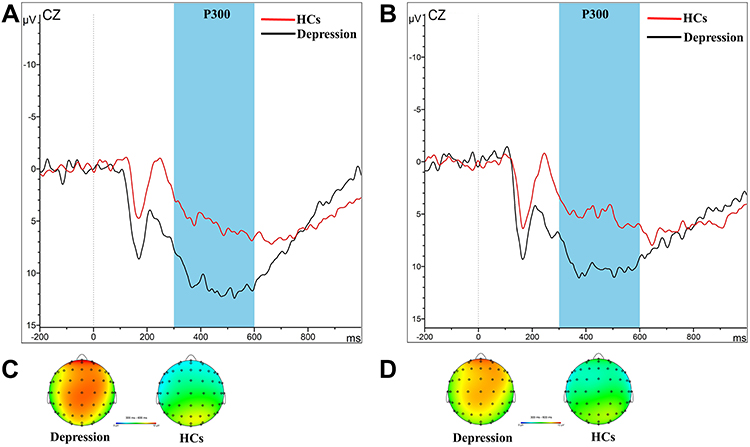 |
Figure 6 Grand-averaged ERP waveforms of the P300 components elicited by sad faces (A) and Surprise faces (B) at Cz electrode in healthy controls and depression group. The grey area indicates the time window that was used to inspect the P300 amplitude. Topographic maps of P300 components between 300 and 600 ms after the onset of sad faces (C) and surprise faces (D) in healthy controls and depression group. Abbreviation: HCs, healthy controls. |
For P300 latency, there was no main effect of participant group (F1,60 = 0.208, P = 0.650, η2 = 0.003). A significant effect of emotion type (F5,300 = 5.089, P < 0.001, η2 = 0.078) was found. The interaction effect between emotion type and participant group was not significant (F5,273 = 1.254, P = 0.286, η2 = 0.020), and the interaction effect between region and participant group was not significant (F2,103 = 0.441, P = 0.615, η2 = 0.007). No interaction effect was found between emotion type, participant group and region (F8,485 = 1.185, P = 0.306, η2 = 0.019) over P300 latency (Figure 5D).
Pharmacotherapy with P100 and P300
Spearman correlation analysis between the fluoxetine-equivalent doses, amplitudes of P100 and P300 for sad faces in the depression group showed that there was no correlation between the fluoxetine-equivalent dose and the amplitudes of P100 and P300 for sad faces in the depression group (all P > 0.05).
Correlations Between Behavioral Data (RTs, Intensity Scores), ERP Data, and HDRS Scores
Spearman correlation analysis between the HDRS scores, behavioral data (RTs, intensity scores), and ERP indexes indicated a negative correlation between RTs and the HDRS scores for surprise faces (r = −0.468, P = 0.008), between N170 amplitudes and HDRS scores for disgust faces (r = −0.449, P = 0.011), as well as between P100 latency and HDRS scores for disgust faces (r = −0.602, P < 0.001). A positive correlation was found between P200 amplitudes (Sadness, Happiness, Surprise, Anger, and Fear) and HDRS scores (all P < 0.05), between P300 amplitudes (Sadness, Happiness, Surprise, and Fear) and HDRS scores (all P < 0.05), as well as between intensity scores and P100 amplitudes for sad faces (r = 0.399, P = 0.026)(Figure 7E).
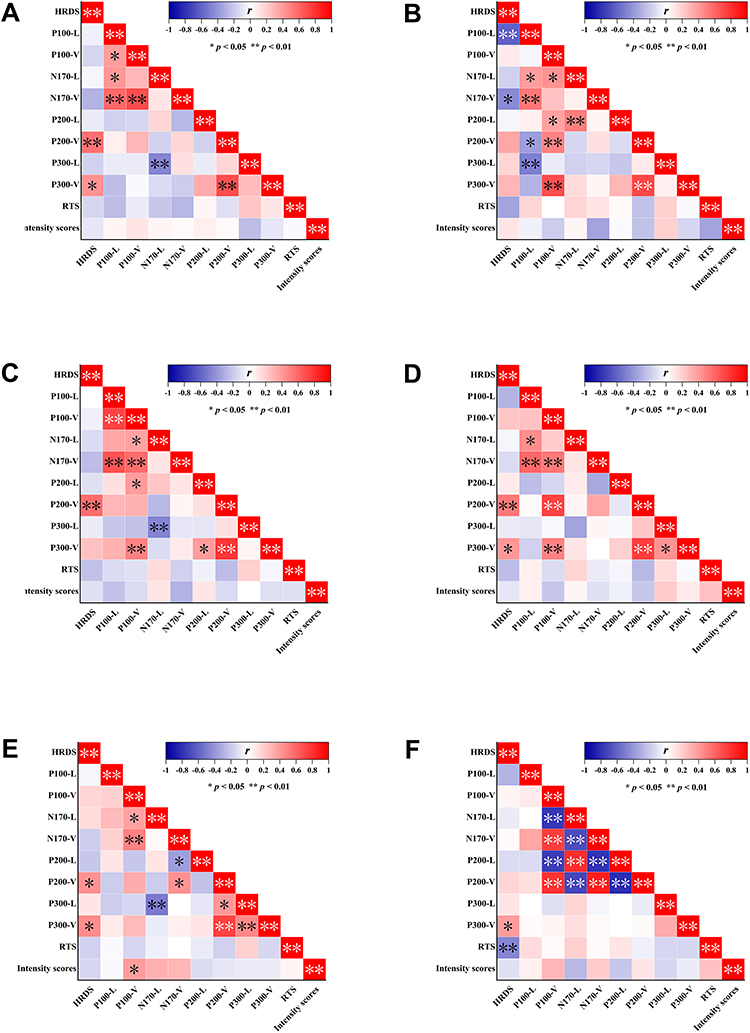 |
Figure 7 Correlations between behavioral data (RTs, intensity scores), ERP data, and HDRS scores in anger faces (A), disgust faces (B), fear faces (C), happy faces (D), sad faces (E), and surprise faces (F). Abbreviation: HDRS, the Hamilton Depression Rating Scale. |
Discussion
Currently, most research reviews examine the accuracy of recognizing emotional expressions but place less emphasis on the intensity of these emotions. This experiment was designed to determine if the detection of emotion intensity differs between the depression group and healthy controls.
We compared a group of 31 patients with depression to a group of 31 healthy controls, using a validated emotion intensity recognition procedure. As a first step, we compared the rating scores provided by the two groups for each emotional category to determine what the biases were regarding the recognition of emotional intensity. As predicted, the results showed that the depression group performed worse than the healthy group for each type of emotion. Despite the fact that our task differed from previous studies investigating biases associated with the detection of emotional intensity in facial expressions of depression, our results were consistent with those from other studies.37–39 It was notable that our experiment differs from others in that we defined emotion types more precisely, expanding to six basic categories of emotions rather than simply dividing them into happy, sad, and neutral emotions. The results can help us gain a more detailed understanding of the dysfunction of emotional cognition in patients with major depression. At the second level of analysis, we did not find a difference in the RTs between the two groups on the task. Previous studies found that sad stimuli are often perceived as “negative” information and may result in longer RTs in clinical depression, suggesting a cognitive deficit.40,41 In contrast, there was no significant difference in RTs between the two groups in our study in response to sad stimuli. This may be related to our small sample size and the different characteristics of patients.
It was worth mentioning that we included ERP measurements in the study. Our analyses focused on four ERP components: P100, N170, P200, and P300.
The P100 component, which peaks between 80 and 130 ms poststimulus42 at occipital sites, is recognized as a marker of early processing of visual stimuli. Many studies confirmed that the presence of negative stimuli is associated with P100 amplitudes, especially sad ones. In the Dai and Feng study, the MDD participants had higher P100 and P200 amplitudes for sad faces than for happy and neutral faces.41 In this study, we found that participants with depression exhibited higher P100 amplitudes for sad faces, which was in line with previous studies on the cognitive processing of emotions.12,43 As per these phenomena, the depression group demonstrated selective attention, which was biased toward negative (Sad) emotions, and perceived sad faces more intensely. Interestingly, when faced with happy stimuli, the depression group displayed higher P100 amplitudes than the healthy controls. Most previous studies had not reported this, and we only observed elevated P100 amplitudes in subclinical patients with major depression when exposed to happy stimuli.44 We believe this is a noteworthy subject that warrants further investigation in subsequent studies. At this stage, there was no difference in P100 amplitudes and latencies in the three brain regions in the face of different emotions.
The N170 component, with negativity peaking at approximately 170 ms after stimulus onset at the occipitotemporal electrodes, is established to be related to the structural encoding of faces.45 For example, Tong found that patients with major depression had a decreased N170 amplitude and a prolonged latency when classifying happy faces compared with healthy individuals.46 However, no differences in the N170 component were found between the two groups in our study. We only found that patients with major depression had higher N170 amplitudes in the occipital lobe than in the temporal lobe and the central lobe. This result validated the classical theory that the amplitude of N170 peaks at the occipital region.47
The P200 component, whose peak occurs between 150 and 300 ms after stimulus onset, is a positive deflection associated with secondary visual processing. It was thought to reflect the initial attentional control ability influenced by external emotional stimuli at the beginning of cognitive attention.48 Researchers also established that P200 was a cerebral biomarker of negativity bias in the cognitive process in patients with major depression. In a study focusing on cross modal audiovisual emotional integration associated with depression, a higher amplitude of P200 was observed with all emotional stimuli in the depression group.31,32 In our study, no differences were found in the P200 component between the two groups in terms of emotion categories. We only found differences in brain regions between the two groups, ie, patients with major depression had higher P200 amplitudes in the central and temporal lobes than the healthy group. This result may suggest that the higher P200 amplitudes in patients with major depression are due to their greater excitation of emotional stimuli.
The P300 component, which begins at approximately 300 ms and lasts for several hundred milliseconds in centro-parietal areas afterward, reflects higher-order stages of emotional processing.49 It occurs in an oddball task when participants are required to evaluate, categorize, and decide on the relevant stimulus (eg, pressing a button), reflecting the reorganization of attention, as well as the updating of working memory and learning processes. Li found that the depression group showed larger P300 amplitudes for sad faces than for neutral faces.50 In another study, the MDD group showed enhanced P300 amplitudes following valid than invalid sad cues, indicating that more attentional resources were allocated to sad emotion.51 Similarly, our study found that the depression group showed larger P300 amplitudes for sad and surprise faces than those in the healthy group. At this stage, there were also differences in P300 amplitudes in three brain regions in the face of different emotions. With regard to the sad emotion, the depression group had higher P300 amplitudes in all three lobes than the healthy group. This finding is consistent with previous studies.14,52 This means that patients with major depression allocated enhanced attention toward sad stimuli in the later stage of attention. With regard to the surprise emotion, the depression group had higher P300 amplitudes in the central and temporal lobes than the healthy group. Surprise is often described as an intense but brief emotion. It has certain peculiarities, such as being either positive or negative. At present, there are basically no studies on ERPs implicating surprise emotions in relation to depression. Further studies will be necessary in the future.
The present study also carried out correlation calculations between the HDRS scores, behavioral data (RTs, intensity scores), and ERP indexes. The results revealed that the depressed participants with lower HDRS scores possessed higher N170 amplitudes and longer P100 latencies for disgust faces, and recognized surprise faces faster. Meanwhile, the depressed participants with higher HDRS scores possessed higher P200 amplitudes for emotional stimuli (except disgust faces) and higher P300 amplitudes for emotional stimuli (Sadness, Happiness, Surprise, and Fear), which may indicate that patients with more severe depression respond more intensely to facial emotional expressions. In addition, it was worth noting that the higher intensity scores of patients with major depression for sad faces, the higher amplitudes of P100. It may suggest that during the pre-conscious stage of cognition, the more intense the face of sadness they perceived, the more cognitive resources they devoted to it. This result has not been found in other literature.
As a final point, all the depressed participants in the current study were medicated. The effects of these medications on participants’ cognitive functions (eg, behavioral responses or brain activity) may be unknown. However, based on previously published literature, it was found that antidepressants have a multifarious effect on the cognitive processes of patients with depression.53 For example, it was possible that drugs that affect the cholinergic system may adversely affect cognitive function (eg, tricyclic antidepressants). Cognitive function was not affected by drugs without anticholinergic effects, such as selective 5-hydroxytryptamine reuptake inhibitors (SSRIs),54 moclobemide,55 asparagine,56 and venlafaxine.57 The depressed participants in our study did not find drug effects on cognitive functions.
Limitation
There are a few limitations of this study. First, due to its small sample, this study’s findings were limited by the lack of significant correlations between certain variables. Second, the larger age range in the participant inclusion criteria (18–65 years) may lead to limitations in the results. For example, older participants may be less adept at using computers, thus affecting the reaction time on the task. Finally, the ERP results cannot reveal the accurate “emotion-cognition” neural circuitry of the brain. Therefore, in future studies, functional imaging studies using different emotional categories might establish the neural circuitry of emotion intensity recognition deficits in depression.
Conclusion
The purpose of this study was to determine the role of facial stimuli at different intensities in patients with depression and healthy participants while correlating the recognition ability of emotional intensity with general cognitive ability. We found that participants with depression were biased in their identification of facial expressions indicating emotional intensity. The behavioral results showed that patients with major depression performed worse on the emotion intensity recognition task, including all six categories of emotions (sadness, disgust, happiness, surprise, anger, and fear), compared to healthy participants. The ERP data also showed that the electrophysiological characteristics of depressed and healthy participants differed during participation in the emotion intensity recognition task, mainly in terms of differences in ERP components (P100 and P300) amplitudes for different emotion types. Among them, P100 amplitudes were enhanced in patients with major depression for sad and happy stimuli; P300 amplitudes were enhanced in patients with major depression for sad and surprise stimuli, mainly concentrated in the central and temporal lobes. Based on these results, we concluded that patients with major depression have emotional biases at the early and late stages of cognitive processing, mainly in the form of sensitivity to sad stimuli, as shown by the higher P100 and P300 amplitudes produced by sad faces. In turn, it may lead to a persistent emotion of sadness that may hinder depression’s remission. Furthermore, we found a positive correlation between P100 amplitudes and different intensities of sad faces in patients with major depression; the more intense the sad faces they perceived, the higher P100 amplitudes. This result indicates that the patients with major depression devote different amounts of cognitive resources for different intensities of sad faces in the preconscious stage of cognition processing; the more intense the sad faces they perceived, the more cognitive resources they devoted. We mentioned earlier that facial expressions of emotion provide critical information to guide our social behavior. Humans use the facial expressions of others as cues to control their behavior, as indicators of how well they are doing at managing the emotions of others, and as indications of people’s attitudes toward them. Therefore, the assessment of the perceived intensity of facial expressions is an important research topic, with important clinical treatment implications on social cognitive function in patients with major depression.
Acknowledgments
We are grateful to everyone who generously participated in this study.
Author Contributions
All authors made a significant contribution to the work reported, whether that is in the conception, study design, execution, acquisition of data, analysis, and interpretation, or in all these areas; took part in drafting, revising, or critically reviewing the article; gave final approval of the version to be published; have agreed on the journal to which the article has been submitted, and agree to be accountable for all aspects of the work.
Funding
This study is supported by the Wuxi Medical and Public Health Technology Innovation Application Project (N20192034).
Disclosure
The authors report no conflicts of interest in this work.
References
1. Zhang M, Chen J, Yin Z, Wang L, Peng L. The association between depression and metabolic syndrome and its components: a bidirectional two-sample Mendelian randomization study. Transl Psychiatry. 2021;11(1):633. doi:10.1038/s41398-021-01759-z
2. Ferrer-Quintero M, Fernandez D, Lopez-Carrilero R, et al. Persons with first episode psychosis have distinct profiles of social cognition and metacognition. NPJ Schizophr. 2021;7(1):61. doi:10.1038/s41537-021-00187-8
3. Krause FC, Linardatos E, Fresco DM, Moore MT. Facial emotion recognition in major depressive disorder: a meta-analytic review. J Affect Disord. 2021;293:320–328. doi:10.1016/j.jad.2021.06.053
4. Dalili MN, Penton-Voak IS, Harmer CJ, Munafo MR. Meta-analysis of emotion recognition deficits in major depressive disorder. Psychol Med. 2015;45(6):1135–1144. doi:10.1017/S0033291714002591
5. LeMoult J, Joormann J, Sherdell L, Wright Y, Gotlib IH. Identification of emotional facial expressions following recovery from depression. J Abnorm Psychol. 2009;118(4):828–833. doi:10.1037/a0016944
6. Light SN, Bieliauskas LA, Taylor SF. Measuring change in anhedonia using the “Happy Faces” task pre- to post-repetitive transcranial magnetic stimulation (rTMS) treatment to left dorsolateral prefrontal cortex in Major Depressive Disorder (MDD): relation to empathic happiness. Transl Psychiatry. 2019;9(1):217. doi:10.1038/s41398-019-0549-8
7. Donoghue T, Voytek B. Automated meta-analysis of the event-related potential (ERP) literature. Sci Rep. 2022;12(1):1867. doi:10.1038/s41598-022-05939-9
8. Herrmann MJ, Ehlis AC, Ellgring H, Fallgatter AJ. Early stages (P100) of face perception in humans as measured with event-related potentials (ERPs). J Neural Transm. 2005;112(8):1073–1081. doi:10.1007/s00702-004-0250-8
9. Zhao Q, Tang Y, Chen S, et al. Early perceptual anomaly of negative facial expression in depression: an event-related potential study. Neurophysiol Clin. 2015;45(6):435–443. doi:10.1016/j.neucli.2015.09.011
10. Iffland B, Klein F, Schindler S, Kley H, Neuner F. ”She finds you abhorrent” - The impact of emotional context information on the cortical processing of neutral faces in depression. Cogn Affect Behav Neurosci. 2021;21(2):426–444. doi:10.3758/s13415-021-00877-x
11. Hinojosa JA, Mercado F, Carretie L. N170 sensitivity to facial expression: a meta-analysis. Neurosci Biobehav Rev. 2015;55:498–509. doi:10.1016/j.neubiorev.2015.06.002
12. Zhang D, He Z, Chen Y, Wei Z. Deficits of unconscious emotional processing in patients with major depression: an ERP study. J Affect Disord. 2016;199:13–20. doi:10.1016/j.jad.2016.03.056
13. Ho HT, Schroger E, Kotz SA. Selective attention modulates early human evoked potentials during emotional face-voice processing. J Cogn Neurosci. 2015;27(4):798–818. doi:10.1162/jocn_a_00734
14. Hu B, Rao J, Li X, et al. Emotion regulating attentional control abnormalities in major depressive disorder: an event-related potential study. Sci Rep. 2017;7(1):13530. doi:10.1038/s41598-017-13626-3
15. Jaworska N, Blier P, Fusee W, Knott V. The temporal electrocortical profile of emotive facial processing in depressed males and females and healthy controls. J Affect Disord. 2012;136(3):1072–1081. doi:10.1016/j.jad.2011.10.047
16. Zhou L, Wang G, Nan C, Wang H, Liu Z, Bai H. Abnormalities in P300 components in depression: an ERP-sLORETA study. Nord J Psychiatry. 2019;73(1):1–8. doi:10.1080/08039488.2018.1478991
17. Kayser J, Bruder GE, Tenke CE, Stewart JE, Quitkin FM. Event-related potentials (ERPs) to hemifield presentations of emotional stimuli: differences between depressed patients and healthy adults in P3 amplitude and asymmetry. Int J Psychophysiol. 2000;36(3):211–236. doi:10.1016/s0167-8760(00)00078-7
18. Bistricky SL, Atchley RA, Ingram R, O’Hare A. Biased processing of sad faces: an ERP marker candidate for depression susceptibility. Cogn Emot. 2014;28(3):470–492. doi:10.1080/02699931.2013.837815
19. Krompinger JW, Simons RF. Electrophysiological indicators of emotion processing biases in depressed undergraduates. Biol Psychol. 2009;81(3):153–163. doi:10.1016/j.biopsycho.2009.03.007
20. Nandrino JL, Dodin V, Martin P, Henniaux M. Emotional information processing in first and recurrent major depressive episodes. J Psychiatr Res. 2004;38(5):475–484. doi:10.1016/j.jpsychires.2004.03.002
21. Rocca CC, Heuvel E, Caetano SC, Lafer B. Facial emotion recognition in bipolar disorder: a critical review. Braz J Psychiatry. 2009;31(2):171–180. doi:10.1590/s1516-44462009000200015
22. Schaefer KL, Baumann J, Rich BA, Luckenbaugh DA, Zarate CA
23. Altamura M, Padalino FA, Stella E, et al. Facial emotion recognition in bipolar disorder and healthy aging. J Nerv Ment Dis. 2016;204(3):188–193. doi:10.1097/NMD.0000000000000453
24. Adolphs R, Tranel D, Damasio H, Damasio A. Impaired recognition of emotion in facial expressions following bilateral damage to the human amygdala. Nature. 1994;372(6507):669–672. doi:10.1038/372669a0
25. First MB. Structured Clinical Interview for DSM-IV Axis I Disorders (SCID-I). Washington, DC: American Psychiatric Press; 1997.
26. Hamilton M. A rating scale for depression. J Neurol Neurosurg Psychiatry. 1960;23:56–62. doi:10.1136/jnnp.23.1.56
27. Sun XY, Li YX, Yu CQ, Li LM. 中文版抑郁量表信效度研究的系统综述 [Reliability and validity of depression scales of Chinese version: a systematic review]. Zhonghua Liu Xing Bing Xue Za Zhi. 2017;38(1):110–116. Chinese. doi:10.3760/cma.j.issn.0254-6450.2017.01.021
28. Gong X, Huang Y-X, Wang Y, Luo Y-J. Revision of the Chinese facial affective picture system. Chin Mental Health J. 2011;25(1):40–46. doi:10.3969/j.issn.1000-6729.2011.01.011
29. Drisdelle B, Aubin M, Jolicoeur P. Dealing with ocular artifacts on lateralized event-related potentials in studies of visual spatial attention and memory: ICA correction versus epoch rejection. Psychophysiology. 2016;54:83–99. doi:10.1111/psyp.12675
30. Perez-Edgar K, Fox NA, Cohn JF, Kovacs M. Behavioral and electrophysiological markers of selective attention in children of parents with a history of depression. Biol Psychiatry. 2006;60(10):1131–1138. doi:10.1016/j.biopsych.2006.02.036
31. Delle-Vigne D, Wang W, Kornreich C, Verbanck P, Campanella S. Emotional facial expression processing in depression: data from behavioral and event-related potential studies. Neurophysiol Clin. 2014;44(2):169–187. doi:10.1016/j.neucli.2014.03.003
32. Lu T, Yang J, Zhang X, et al. Crossmodal audio visual emotional integration in depression: an event-related potential study. Front Psychiatry. 2021;12:694665. doi:10.3389/fpsyt.2021.694665
33. Adolphs R, Tranel D, Hamann S, et al. Recognition of facial emotion in nine individuals with bilateral amygdala damage. Neuropsychologia. 1999;37(10):1111–1117. doi:10.1016/s0028-3932(99)00039-1
34. Yamada M, Ueda K, Namiki C, et al. Social cognition in schizophrenia: similarities and differences of emotional perception from patients with focal frontal lesions. Eur Arch Psychiatry Clin Neurosci. 2009;259(4):227–233. doi:10.1007/s00406-008-0860-5
35. Hamann SB, Stefanacci L, Squire LR, et al. Recognizing facial emotion. Nature. 1996;379(6565):497. doi:10.1038/379497a0
36. Furukawa TA, Cipriani A, Cowen PJ, Leucht S, Egger M, Salanti G. Optimal dose of selective serotonin reuptake inhibitors, venlafaxine, and mirtazapine in major depression: a systematic review and dose-response meta-analysis. Lancet Psychiatry. 2019;6(7):601–609. doi:10.1016/S2215-0366(19)30217-2
37. Yoon KL, Joormann J, Gotlib IH. Judging the intensity of facial expressions of emotion: depression-related biases in the processing of positive affect. J Abnorm Psychol. 2009;118(1):223–228. doi:10.1037/a0014658
38. Munkler P, Rothkirch M, Dalati Y, Schmack K, Sterzer P. Biased recognition of facial affect in patients with major depressive disorder reflects clinical state. PLoS One. 2015;10(6):e0129863. doi:10.1371/journal.pone.0129863
39. Joormann J, Gotlib IH. Is this happiness I see? Biases in the identification of emotional facial expressions in depression and social phobia. J Abnorm Psychol. 2006;115(4):705–714. doi:10.1037/0021-843X.115.4.705
40. Gollan JK, Pane HT, McCloskey MS, Coccaro EF. Identifying differences in biased affective information processing in major depression. Psychiatry Res. 2008;159(1):18–24. doi:10.1016/j.psychres.2007.06.011
41. Dai Q, Feng Z. More excited for negative facial expressions in depression: evidence from an event-related potential study. Clin Neurophysiol. 2012;123(11):2172–2179. doi:10.1016/j.clinph.2012.04.018
42. Hillyard SA, Anllo-Vento L. Event-related brain potentials in the study of visual selective attention. Proc Natl Acad Sci U S A. 1998;95(3):781–787. doi:10.1073/pnas.95.3.781
43. Ruohonen EM, Alhainen V, Astikainen P. Event-related potentials to task-irrelevant sad faces as a state marker of depression. Biol Psychol. 2020;149:107806. doi:10.1016/j.biopsycho.2019.107806
44. Dai Q, Wei J, Shu X, Feng Z. Negativity bias for sad faces in depression: an event-related potential study. Clin Neurophysiol. 2016;127(12):3552–3560. doi:10.1016/j.clinph.2016.10.003
45. Darke H, Sundram S, Cropper SJ, Carter O. Dynamic face processing impairments are associated with cognitive and positive psychotic symptoms across psychiatric disorders. Npj Schizophrenia. 2021;7(1):36. doi:10.1038/s41537-021-00166-z
46. Tong Y, Zhao G, Zhao J, et al. Biases of happy faces in face classification processing of depression in Chinese patients. Neural Plast. 2020;2020:7235734. doi:10.1155/2020/7235734
47. Bentin S, Allison T, Puce A, Perez E, McCarthy G. Electrophysiological studies of face perception in humans. J Cogn Neurosci. 1996;8(6):551–565. doi:10.1162/jocn.1996.8.6.551
48. Thomas SJ, Johnstone SJ, Gonsalvez CJ. Event-related potentials during an emotional Stroop task. Int J Psychophysiol. 2007;63(3):221–231. doi:10.1016/j.ijpsycho.2006.10.002
49. Klumpp H, Shankman SA. Using event-related potentials and startle to evaluate time course in anxiety and depression. Biol Psychiatry. 2018;3(1):10–18. doi:10.1016/j.bpsc.2017.09.004
50. Li X, Li J, Hu B, et al. Attentional bias in MDD: ERP components analysis and classification using a dot-probe task. Comput Methods Programs Biomed. 2018;164:169–179. doi:10.1016/j.cmpb.2018.07.003
51. Ao X, Mo L, Wei Z, Yu W, Zhou F, Zhang D. Negative bias during early attentional engagement in major depressive disorder as examined using a two-stage model: high sensitivity to sad but bluntness to happy cues. Front Hum Neurosci. 2020;14:593010. doi:10.3389/fnhum.2020.593010
52. Xie H, Mo L, Li S, Liang J, Hu X, Zhang D. Aberrant social feedback processing and its impact on memory, social evaluation, and decision-making among individuals with depressive symptoms. J Affect Disord. 2022;300:366–376. doi:10.1016/j.jad.2022.01.020
53. Lechevallier-Michel N, Molimard M, Dartigues JF, Fabrigoule C, Fourrier-Reglat A. Drugs with anticholinergic properties and cognitive performance in the elderly: results from the PAQUID Study. Br J Clin Pharmacol. 2005;59(2):143–151. doi:10.1111/j.1365-2125.2004.02232.x
54. van Laar MW, Volkerts ER, Verbaten MN, Trooster S, van Megen HJ, Kenemans JL. Differential effects of amitriptyline, nefazodone and paroxetine on performance and brain indices of visual selective attention and working memory. Psychopharmacology. 2002;162(4):351–363. doi:10.1007/s00213-002-1116-0
55. Fairweather DB, Kerr JS, Harrison DA, Moon CA, Hindmarch I. A double blind comparison of the effects of fluoxetine and amitriptyline on cognitive function in elderly depressed patients. Hum Psychopharmacol Res Unit. 1993;8(1):41–47. doi:10.1002/hup.470080108
56. Kasper S, McEwen BS. Neurobiological and clinical effects of the antidepressant tianeptine. CNS Drugs. 2008;22(1):15–26. doi:10.2165/00023210-200822010-00002
57. Trick L, Stanley N, Rigney U, Hindmarch I. A double-blind, randomized, 26-week study comparing the cognitive and psychomotor effects and efficacy of 75 mg (37.5 mg b.i.d.) venlafaxine and 75 mg (25 mg mane, 50 mg nocte) dothiepin in elderly patients with moderate major depression being treated in general practice. J Psychopharmacol. 2004;18(2):205–214. doi:10.1177/0269881104042622
 © 2023 The Author(s). This work is published and licensed by Dove Medical Press Limited. The full terms of this license are available at https://www.dovepress.com/terms.php and incorporate the Creative Commons Attribution - Non Commercial (unported, v3.0) License.
By accessing the work you hereby accept the Terms. Non-commercial uses of the work are permitted without any further permission from Dove Medical Press Limited, provided the work is properly attributed. For permission for commercial use of this work, please see paragraphs 4.2 and 5 of our Terms.
© 2023 The Author(s). This work is published and licensed by Dove Medical Press Limited. The full terms of this license are available at https://www.dovepress.com/terms.php and incorporate the Creative Commons Attribution - Non Commercial (unported, v3.0) License.
By accessing the work you hereby accept the Terms. Non-commercial uses of the work are permitted without any further permission from Dove Medical Press Limited, provided the work is properly attributed. For permission for commercial use of this work, please see paragraphs 4.2 and 5 of our Terms.