Back to Journals » Clinical Interventions in Aging » Volume 17
The Muscle Thickness Assessment Using Ultrasonography is a Useful Alternative to Skeletal Muscle Mass by Bioelectrical Impedance Analysis
Authors Isaka M ![]() , Sugimoto K, Akasaka H
, Sugimoto K, Akasaka H ![]() , Yasunobe Y, Takahashi T, Xie K, Onishi Y, Yoshida S, Minami T, Yamamoto K, Kamide K, Rakugi H
, Yasunobe Y, Takahashi T, Xie K, Onishi Y, Yoshida S, Minami T, Yamamoto K, Kamide K, Rakugi H
Received 8 August 2022
Accepted for publication 24 November 2022
Published 15 December 2022 Volume 2022:17 Pages 1851—1861
DOI https://doi.org/10.2147/CIA.S385469
Checked for plagiarism Yes
Review by Single anonymous peer review
Peer reviewer comments 2
Editor who approved publication: Dr Maddalena Illario
Masaaki Isaka,1– 3 Ken Sugimoto,1,4 Hiroshi Akasaka,1 Yukiko Yasunobe,1 Toshimasa Takahashi,1 Keyu Xie,1 Yuri Onishi,1 Shino Yoshida,1 Tomohiro Minami,1 Koichi Yamamoto,1 Kei Kamide,1,2 Hiromi Rakugi1
1Department of Geriatric and General Medicine, Osaka University Graduate School of Medicine, Suita, Osaka, Japan; 2Department of Health Science, Osaka University Graduate School of Medicine, Suita, Osaka, Japan; 3Physical Therapy, Osaka Yukioka College of Health Science, Ibaraki, Osaka, Japan; 4Department of General Geriatric Medicine, Kawasaki Medical School, Okayama, Okayama, Japan
Correspondence: Ken Sugimoto, Department of General Geriatric Medicine, Kawasaki Medical School, 2-6-1, Nakasange, Kita-ku, Okayama, Okayama, 700-8505, Japan, Tel +81 86 225 2111, Fax +81 86 232 8343, Email [email protected]
Purpose: Muscle mass, a key index for the diagnosis of sarcopenia, is currently assessed using the appendicular skeletal muscle mass index (ASMI) by bioelectrical impedance analysis (BIA). Muscle thickness (MT) assessed by ultrasonography (US) may be a better determinant and/or predictor of muscle condition than ASMI. Thus, we compared it to the ASMI determined by the BIA.
Patients and Methods: Our study included 165 ambulatory older adults (84 males, 81 females, mean age: 76.82 years). The ASMI by the BIA method, MT by US, and the distribution of body mass index (BMI) and body fat percentage (BFP) were examined using defined values for men and women. These were used as the basis for examining the association of MT and ASMI with handgrip strength (HGS), leg muscle strength (LMS), gait speed (GS), and echo intensity (EI). We compared HGS, LMS, GS, and EI for high and low ASMI among lower BMI or BFP. The same was also done for MT assessed by US.
Results: MT, as well as ASMI, was strongly associated with HGS and LMS. There was a correlation between MT and GS and EI but not between ASMI and GS and EI. There were significant differences in the prevalence between high ASMI and high MT or low ASMI and low MT in those with lower BMI or BFP. In non-overweight participants, HGS, LMS, GS, and EI were significantly higher in those with high MT than in those with low MT; however, there were no significant differences in them between those with high and low ASMI.
Conclusion: In the non-overweight group, the MT assessment by US showed a stronger relationship to muscle strength and muscle quality than the ASMI assessment by BIA. The MT assessment using US is a useful alternative to BIA-assessed ASMI, especially in non-overweight participants.
Keywords: tibialis anterior muscle, muscle thickness, echo intensity, body type, muscle strength
Introduction
Sarcopenia, defined as low muscle mass and low muscle strength or physical function, has recently attracted attention owing to its poor prognosis. Sarcopenia is not only related to a variety of illnesses but can increase the need for nursing care.1–3 Obesity, particularly visceral obesity, is a pathological condition that leads to metabolic syndrome based on insulin resistance, and both obesity and insulin resistance are risk factors of sarcopenia.4 Sarcopenic obesity, wherein sarcopenia and obesity coexist, increases the risk of cardiovascular disease onset and mortality.4–6
The appendicular skeletal muscle mass index (ASMI) of the extremities measured using dual-energy x-ray absorptiometry (DXA) or bioelectrical impedance analysis (BIA), indirectly and adjusted for the square of height (expressed in kg/m2), is the current method for evaluating major skeletal muscle mass.7 DXA is expensive, has limited portability, needs ample space, and requires radiation exposure. In contrast, BIA is inexpensive, easy to use, and portable. However, a large variety of models have been commercially supplied by different companies, and for most consumer products, the equations estimating skeletal muscle mass are not disclosed. It is, therefore, difficult to use these equations for research purposes. In particular, the BIA equation is often age-dependent, which leads to fundamental difficulty in examining age-related low ASMI.8 As described above, the ASMI measured by DXA or BIA may be inappropriate for routine clinical examination and may not better determine or predict muscle status. The body mass index (BMI) is widely used to determine obesity. The ASMI uses the same adjusting method (height squared) as BMI. Consequently, since the higher the BMI, the higher the ASMI scores, it might be difficult to detect individuals with decreased muscle mass in overweight participants.9,10 Similarly, body fat percentage (BFP) via the BIA method is also an indicator of the degree of obesity and is used for the detection of sarcopenic obesity,11,12 although no reference value for diagnosing it has been established. Therefore, when considering current methods of muscle mass assessment in the diagnosis of sarcopenia or sarcopenic obesity, it is necessary to establish a better and simple method.
Muscle ultrasonography (US) is a non-invasive and direct method for evaluating skeletal muscle mass.13,14 Muscle thickness (MT) and echo intensity (EI), an indicator of muscle quality, are related to muscle strength, physical function, and muscle mass measured using DXA or BIA.15–21
The assessment of muscle quality is gaining increasing attention as a potentially more critical metric than simple muscle mass measurements.22 Previous studies suggest that muscle quality may deteriorate before muscle mass and is independently associated with physical performance and survival.23–25
Fat infiltration of muscle, which represents a muscle quality component, is characterized by EI using grayscale analysis.26–28 The higher numerical value of EI reflects more fat and fibrous tissue in the body.29,30 The majority of reports on muscle US have used the quadriceps femoris muscle (QFM) for measurement purposes,13–21,26,27 but when performing QFM US in practice, it is necessary to expose and image the part above the knee, which makes it difficult to perform QFM US easily in clinical settings. To solve this problem, we previously investigated a method that uses the tibialis anterior muscle (TA) to determine whether US of this easier-to-approach site is useful to diagnose sarcopenia and evaluate muscle quality.31,32
In the present study, we sought to determine whether evaluating the MT of the TA using US provides a better association of muscle mass, muscle strength, physical function, and EI than evaluating ASMI assessed by BIA.
Materials and Methods
Participants
We included ambulatory participants aged 65 years and above who were admitted for non-communicable diseases to the Osaka University Hospital between 2016 and 2020. The participant’s body composition, physical function, and skeletal muscle ultrasonography were assessed. The inclusion criteria were as follows: (1) ability to walk without an assistive device; (2) no history of lower limb trauma or surgery; (3) no neuromuscular disorders that could impede individual muscle strength and/or physical function; and (4) no acute or chronic illnesses. The exclusion criteria were as follows: (1) inability to walk independently; (2) stroke presenting with severe hemiplegia; (3) Parkinson’s disease or syndrome; (4) poorly controlled diabetes mellitus; (5) effort angina, chronic heart failure, or tachyarrhythmia; (6) chronic obstructive pulmonary disease; (7) having an artificial pacemaker, poor vision or blindness, and/or orthopedic surgery history; (8) marked cognitive function decline that makes communication difficult; and (9) refusal to consent to participate in this study or the presence of missing data.
We excluded 38 participants, and a total of 165 participants were ultimately enrolled in this cross-sectional study. All the participants provided written informed consent for participation in the study. The study protocol was approved by the Research Ethics Committee of Osaka University (Approval No. 18126; October 18, 2018) and was conducted in accordance with the Declaration of Helsinki and its later amendments.
Muscle Mass Measurement
ASMI was measured using BIA, a multifrequency body composition indicator for professional use (MC-190; Tanita, Tokyo, Japan). Participants were asked to stand barefoot with their toes and heels on the electrodes, to hold the handgrips, and to let their arms hang down a few centimeters away from their hips. With the participants standing, an eight‐electrode device was used to measure the bioelectrical impedance (Z) at frequencies of 5, 50, 250, and 500kHz (Z5, Z50, Z250, and Z500).8 The ASMI was calculated by summing the muscle masses of the four limbs, assuming that all the non-fat and non-bone masses were skeletal muscles, using the following equation: appendicular skeletal muscle in kilograms/(height in meters squared).
Hand Grip Strength Measurement
HGS was measured using a hand dynamometer (ST100T‐1780; Toei Light Corp., Saitama, Japan), which the participants held along the side of their body while standing. The grip part was adjusted to each participant’s hand size. They were asked to quickly and maximally squeeze the handgrip instrument three times with a 1min rest between measurements. The greatest value of a maximum of three grips on the left and right sides was used.
Leg Muscle Strength Measurement
LMS was assessed using a handheld dynamometer (μ-Tas F‐1; Anima, Tokyo, Japan). For the knee extensor assessment, participants were seated on an elevated hard chair with their hip and knee joints flexed at approximately 90°, their feet above the floor, and their arms crossed in front of their chest. The dynamometer pad was placed perpendicular to the leg and attached to the shin, and a strap was positioned 10cm above the lateral malleolus, which was fixed to the leg of the chair. Participants were instructed to push against the strap by extending the lower leg from the knee joint until the maximum contraction force was achieved. They were asked to increase the force gradually to a maximum voluntary effort and to then maintain the maximum effort for an additional 5 sec. Throughout the session, each participant was given consistent verbal encouragement and praise as reinforcement. During all of the tests, the dynamometer was stabilized by the belt and the examiner’s hands. The greatest force of four attempts was recorded.
Gait Speed Measurements
GS was measured using a stopwatch. To record participants’ gait speed during 10-m tests, we used a 10-m course with additional 2-m acceleration and deceleration areas at the beginning and end of the course. The watch was started and stopped when the individual’s trunk passed over the lines marking the beginning and end of the 10-meter course, respectively. Gait speed (m/s) was calculated by dividing the distance covered (10-m) by the 10-m walk time(s). Two trials were performed for each 10-m test, and the average was used.
Ultrasonography Measurements
MT and EI of the TA muscle were measured in B-mode using 8-MHz linear probe diagnostic ultrasonography equipment (LOGIQ Book XP, GE Yokogawa Medical Systems Ltd, Tokyo, Japan) with the same picture quality and a 50% gain in the depth of the TA: 4.0 cm. During the examination, the same standardized position of the participants and the exact location of the probe were maintained. To improve acoustic coupling, a water-soluble transmission gel was placed over the transducer. The probe was held perpendicular to the skin surface but was not pressed against the skin. Transverse muscle images were recorded in the supine position for the TA. The MT was measured twice at the proximal 30% point between the knee joint space or lateral femoral epicondyle and the lateral malleolus of the fibula. EI was defined as the mean pixel intensity of the muscle and was determined by grayscale analysis using the standard histogram function of the ImageJ image analysis software (version 1.48; National Institutes of Health, Bethesda, MD, USA).
A region of interest (ROI) was drawn to include as much muscle as possible without any bone or surrounding fascia. The EI value in the ROI was expressed as a value between 0 (black) and 255 (white). The mean MT and EI values were calculated using measurements from the two images. Measurements were performed twice by a single investigator, a research expert trained in the technical aspects of using the ultrasound machine, who was blinded to the results of the BIA and muscle evaluations or physical functions. This method was verified to have a high degree of reliability in our previous study.31
Classification of the Groups by Muscle Mass and Overweight Index
Lower muscle mass was defined as less than 7.0 kg/m2 in men and less than 5.7 kg/m2 in women when using the ASMI according to the Asian Working Group for Sarcopenia (AWGS) criteria for 2019, or less than the lower quartile points when using the MT as previously reported (men: 10.49 mm, women: 8.60 mm in this study).31 The higher overweight index was defined as 25 kg/m2 and over when using BMI according to the Japan Society for the Study of Obesity criteria,33 or as more than 27.0% in men and more than 38.0% in women when using BFP.34 Participants were sorted into the following four groups: high muscle mass/lower overweight index, high muscle mass/higher overweight index, low muscle mass/higher overweight index, and low muscle mass/lower overweight index.
Statistical Analysis
We analyzed all the variables visually using histograms and probability distributions and determined the presence or absence of normal distributions. All the variables were presented as mean values, standard deviations, or numbers and percentages. The relationships between ASMI and MT and muscle strength, gait speed, and EI were analyzed using linear correlations. The distribution of the four groups (muscle mass/BMI or BFP: high/lower, high/higher, low/higher, and low/lower), which were classified using the defined values of ASMI or MT and BMI or BFP, were analyzed using the chi-square test.
The relationship between muscle strength or physical function and ASMI or MT was analyzed using an unpaired t-test (ie, comparisons between the groups of high and low ASMI in lower BMI participants, between the groups of high and low MT in lower BMI participants, between the groups of high and low ASMI in higher BMI participants, and between the groups of high and low MT in higher BMI participants, respectively, in two groups). BFP was also performed similarly.
Statistical analyses were performed using the JMP Pro 16 software (SAS Institute Inc., Cary, NC, USA). Statistical significance was set at a two-tailed p < 0.05.
Results
Table 1 shows the basic characteristics of the participants. The relationship of ASMI and MT to muscle strength, gait speed, and EI is shown in Figures 1 and 2. MT was related to muscle strength, gait speed, and EI, while ASMI was related only to muscle strength. Figures 3 and 4 show the distribution of the groups classified by ASMI or MT and BMI or BFP. We found a significant difference in the distribution of these four groups as classified by BMI and BFP (BMI: χ2= 14.01, p <0.05; BFP: χ2= 7.93, p <0.05). The comparison of the HGS, LMS, GS, and EI as classified by high/low ASMI or MT and higher/lower BMI or BFP are shown in Figure 5 and Supplementary Figure 1.
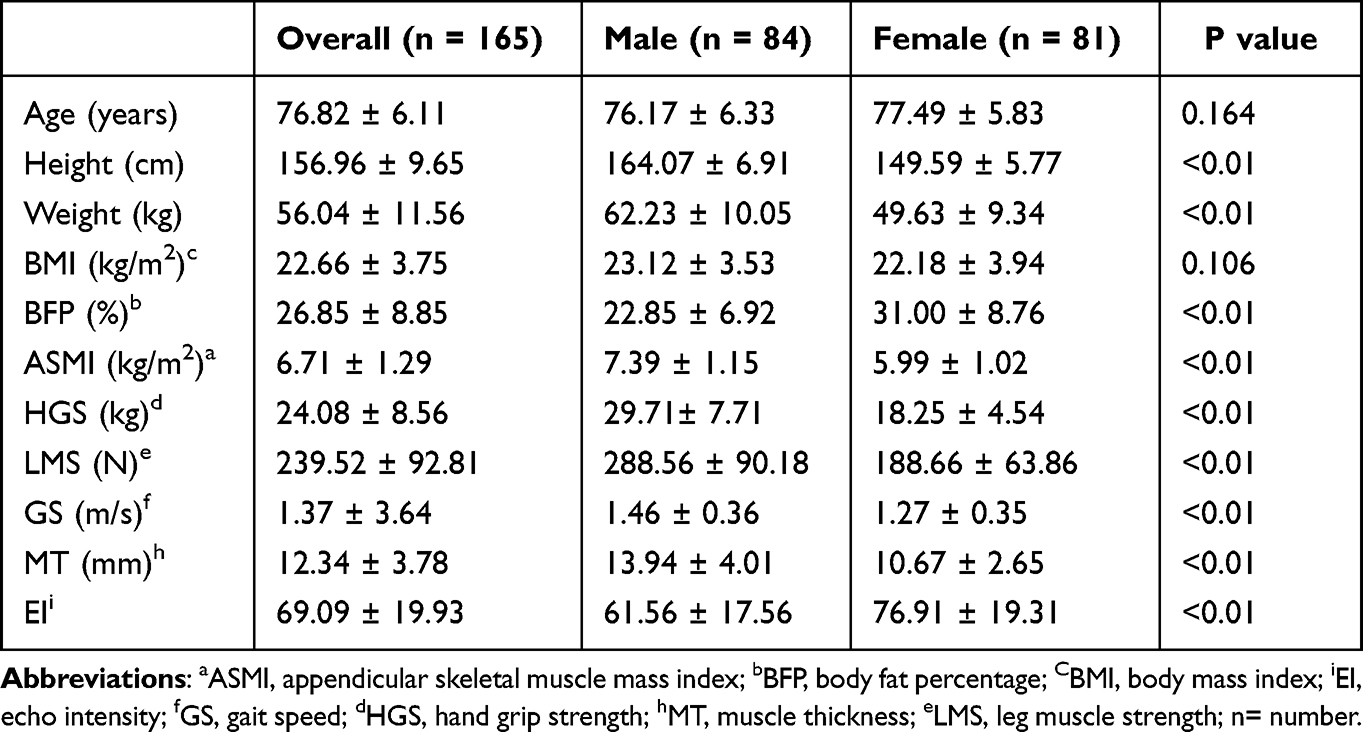 |
Table 1 Characteristics of the Study Participants |
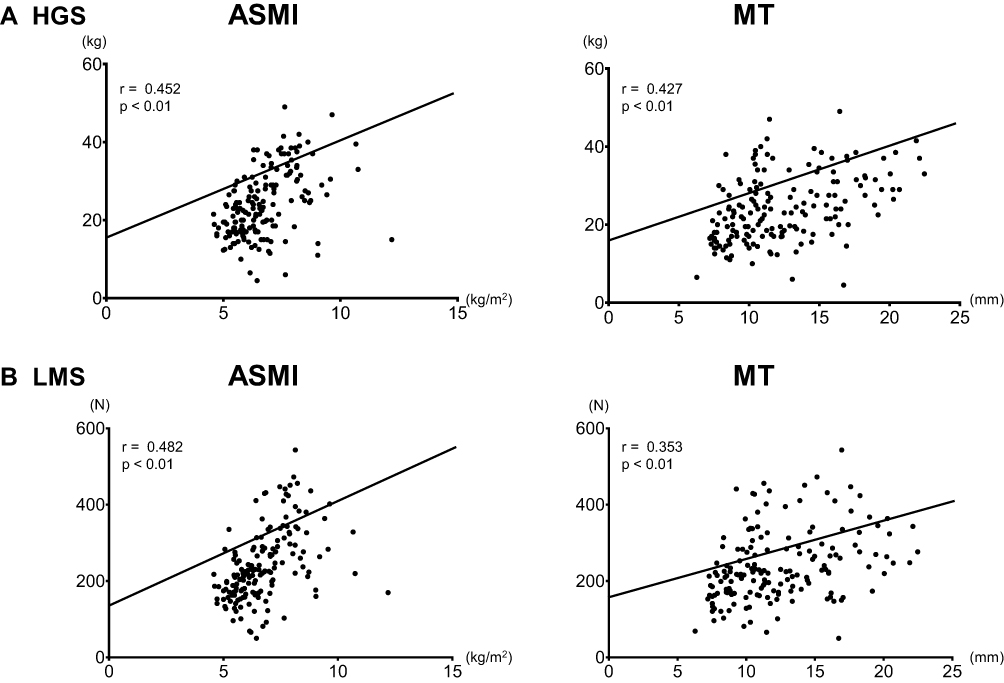 |
Figure 1 The relationship between BIA-assessed ASMI or US-assessed MT and HGS and LMS. Abbreviations: ASMI, appendicular skeletal muscle mass index; BIA, bioelectrical impedance analysis; HGS, hand grip strength; LMS, leg muscle strength; MT, muscle thickness; US, ultrasonography. Notes: (A) Hand grip strength, (B) leg muscle strength. The relationships between ASMI and HGS or LMS were analyzed in linear correlations. The relationships between MT and HGS or LMS were analyzed in linear correlations. |
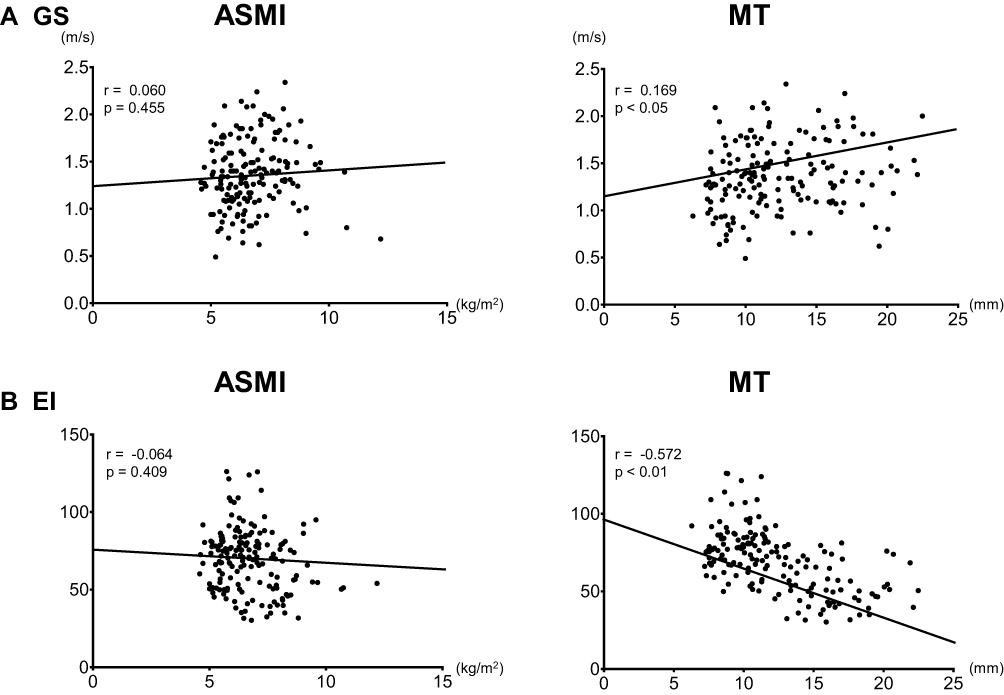 |
Figure 2 The relationship between BIA-assessed ASMI or US-assessed MT and GS and US-assessed EI. Abbreviations: ASMI, appendicular skeletal muscle mass index; BIA, bioelectrical impedance analysis; EI, echo intensity; GS, gait speed; MT, muscle thickness; US, ultrasonography. Notes: (A) Gait speed, (B) echo intensity. The relationships between ASMI and GS or EI were analyzed in linear correlations. The relationships between MT and GS or EI were analyzed in linear correlations. |
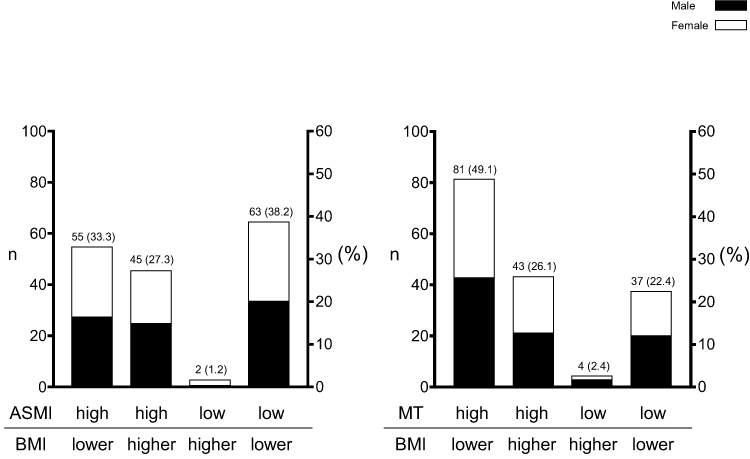 |
Figure 3 The distribution of four groups classified by BIA-assessed ASMI or US-assessed MT and BMI. Abbreviations: ASMI, appendicular skeletal muscle mass index; BIA, bioelectrical impedance analysis; BMI, body mass index; MT, muscle thickness; US, ultrasonography; n, number; %, percentile. Notes: The distribution of the four groups (muscle mass/BMI: high/lower, high/higher, low/higher, and low/lower), which were classified using the defined values of ASMI or MT and BMI, were analyzed in the chi-square test. For the two Y-axes: the right Y-axis shows the percentage of each group to the total (100%). The left Y-axis shows the number of each group to the total (participants). They are indicated above each bar graph; the left side is the number of people, and the right side is the percentage, separated by parentheses. Each bar color represents “black” for males and “white” for females. The distribution of the four groups was classified using BIA-assessed ASMI or US-assessed MT-defined and BMI-defined values. From the left bar, the muscle mass/body type groups are high/lower, high/higher, low/higher, and low/lower. |
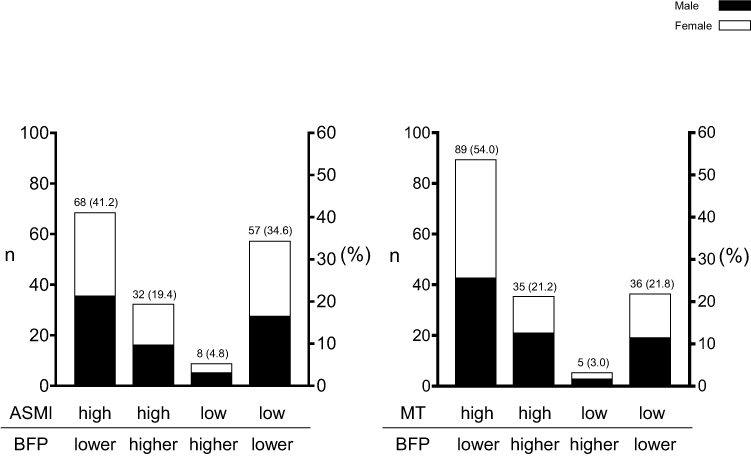 |
Figure 4 The distribution of four groups classified by BIA-assessed ASMI or US-assessed MT and BFP. Abbreviations: ASMI, appendicular skeletal muscle mass index; BIA, bioelectrical impedance analysis; BFP, body fat percentage; MT, muscle thickness; US, ultrasonography; n, number; %, percentile. Notes: The distribution of the four groups (muscle mass/BFP: high/lower, high/higher, low/higher, and low/lower), which were classified using the defined values of ASMI or MT and BFP, were analyzed in the chi-square test. For the two Y-axes: the right Y-axis shows the percentage of each group to the total (100%). The left Y-axis shows the number of each group to the total (participants). They are indicated above each bar graph; the left side is the number of people, and the right side is the percentage, separated by parentheses. Each bar is represented in “black” for males and “white” for females. Distribution of the four groups classified using BIA-assessed ASMI or US-assessed MT-defined values and BFP-defined values. From the left bar, the muscle mass/body type groups are high/lower, high/higher, low/higher, and low/lower. |
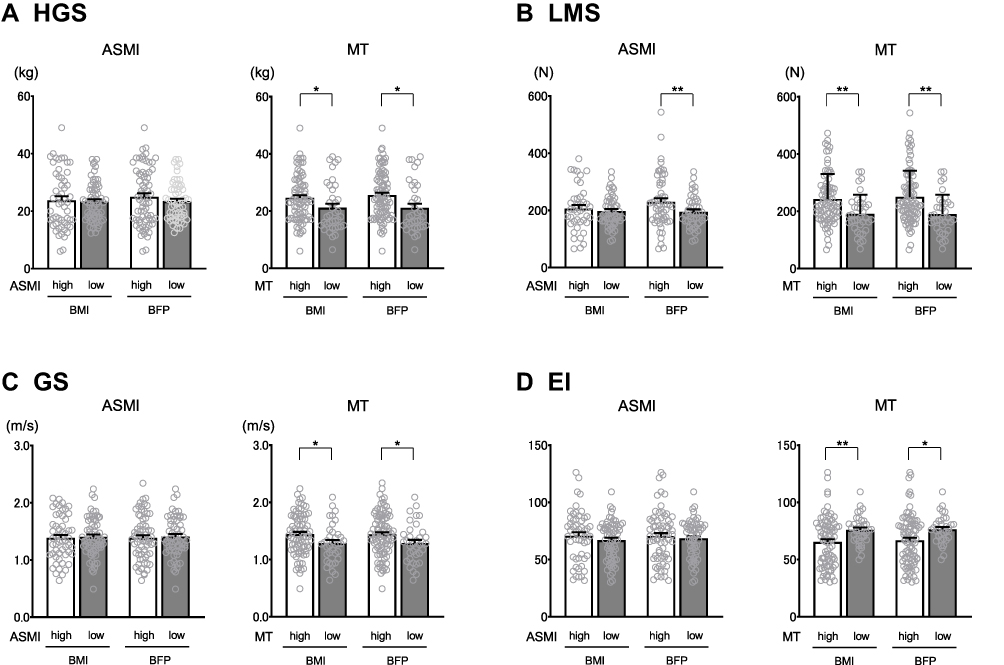 |
Figure 5 Comparison of HGS, LMS, GS, and US-assessed EI among the BIA/US-assessed high or low ASMI/MT classified by lower BMI or BFP. Abbreviations: ASMI, appendicular skeletal muscle mass index; BIA, bioelectrical impedance analysis; BFP, body fat percentage; BMI, body mass index; EI, echo intensity; GS, gait speed; HGS, hand grip strength; LMS, leg muscle strength; MT, muscle thickness; US, ultrasonography. Notes: (A) Hand grip strength, (B) leg muscle strength, (C) gait speed, (D) echo intensity. The bar graph represents the mean value, and the error bar represents the standard error of the mean. The comparison of muscle strength or physical function with high or low muscle mass (ie, ASMI or MT) was analyzed in non-overweight participants, as determined by body index (ie, lower BMI or BFP), with an unpaired t-test. White bars are the group with high skeletal muscle mass (ASMI or MT) and lower body mass index (BMI or BFP). Dark-gray bars are the group with low skeletal muscle mass (ASMI or MT) and lower body mass index (BMI or BFP). **p < 0.01 and *p < 0.05 were as a statistical significance. *Is “less than or equal to 0.05 (5%) probability of significance (p < 0.05)”.**Is “less than or equal to 0.01 (1%) probability of significance (p < 0.01)”. |
In participants with lower BMI or BFP, there were no significant differences in the HGS and GS among the groups classified by high or low ASMI, but HGS and GS were significantly higher in the high MT group than in the low MT group. LMS was significantly higher in the high ASMI/lower BFP group than in the low ASMI/lower BFP group and in the high MT group than in the low MT group. EI was significantly lower in the high MT group than in the low MT group; however, there was no significant difference in the EI among the groups as classified by ASMI (Figure 5).
In the participants with higher BMI or BFP, there were no significant differences in the HGS, LMS, GS, and EI among the groups classified by high or low MT, and there were no significant differences in the LMS and GS among the groups classified by high or low ASMI. HGS was significantly higher in the high ASMI/higher BMI group than in the low ASMI/higher BMI group. EI was significantly higher in the high ASMI/higher BFP group than in the low ASMI/higher BFP group (Supplementary Figure 1).
Discussion
In the present study, we hypothesized that evaluating the muscle thickness (MT) of the tibialis anterior muscle (TA) using ultrasonography (US) would allow a better analysis of the skeletal muscle mass than evaluating the appendicular skeletal muscle mass index (ASMI) using the bioelectrical impedance analysis (BIA) method, regardless of a person’s body type. Therefore, we investigated the clinical significance of this novel method. Our results indicated that when body mass index (BMI) and body fat percentage (BFP) were used as indicators of the degree of overweight, hand grip strength (HGS), leg muscle strength (LMS), and gait speed (GS) were related to MT, but HGS and LMS were only associated with ASMI. At present, ASMI is being used to assess muscle mass in the sarcopenia diagnostic criteria advocated by the working groups in Asia (AWGS) or Europe (EWGSOP).7,35 Numerous studies have verified the reliability of this method. Computed tomography (CT) and magnetic resonance imaging (MRI) are considered the gold standard for measuring human body composition and, thus, quantifying muscle mass.36 Both BIA and DXA are significantly associated with the gold standard measures in older adults and report the utility of skeletal muscle mass measurements.37–40 Furthermore, when skeletal muscle mass was measured using DXA as a reference and compared to BIA for the prevalence of sarcopenia according to the AWGS definition, it was reported that BIA was nominated as valid as DXA and that BIA is suitable for body composition assessment.41 In a previous report, we examined the relationship between skeletal muscle mass or sarcopenia discrimination ability using skeletal muscle mass measured by DXA or BIA and muscle thickness of the rectus femoris or gastrocnemius muscle in the US. The results showed a moderate relationship. It was reported that ultrasonography evaluation validated the quantitative assessment of appendicular skeletal muscle mass in older adults.42 To the best of our knowledge, this is the first study to demonstrate that MT can determine skeletal muscle mass better and conveniently than ASMI.
The distribution of the groups as classified by ASMI or MT and BMI showed significant differences. In particular, the prevalence of the group with high ASMI and lower BMI was lower than that of the group with high MT and lower BMI. In addition, the prevalence of the group with low ASMI and lower BMI was higher than that of the group with low MT and lower BMI (Figure 3). Similar results were found when using BFP as an index of overweight (Figure 4). Considering that the prevalence of sarcopenia in older adults was approximately 20% in previous reports,43 our findings indicated that ASMI is more influenced by body type than MT and may not be able to measure muscle mass better. Based on the findings above, the decline in muscle mass might be overestimated when ASMI is used but not when MT is used, particularly for non-overweight individuals.
In this study, MT was associated with HGS, LMS, GS, and echo intensity (EI), especially in the non-overweight participants, while ASMI was not (Figure 5). These results suggest that MT is more strongly related to muscle strength and physical function than ASMI. Similarly, there were no significant differences in HGS, LMS, GS, and EI between the two groups in the higher BMI or BFP group and ASMI by BIA and MT by US in the high and low groups (Supplementary Figure 1). The number of cases with low skeletal muscle mass and overweight is small and needs to be examined with more participants. Our previous studies reported that MT was found to have the same or higher ability to identify sarcopenia than ASMI.31,32 Fukumoto et al44 reported that the MT of the lower extremities’ muscles may enable a better detection of decreased physical function than ASMI. Ata et al45 found that MT was more important for predicting GS than ASMI and that it was useful even when used for individuals whose HGS assessment was not available. Another report showed that MT is an essential factor for determining balanced function.46 These findings support our results, and it shows that MT assessment is clinically important when used as an alternative to ASMI.
Muscle quality is an essential factor for determining skeletal muscle function.47 Several reports have shown that EI evaluated using US is a useful tool for assessing muscle quality when targeting sarcopenia or other pathological conditions.26,27,30–32,48–52 Moreover, a recent review showed that EI is an effective and practical method for identifying a decline in muscle function associated with aging and sarcopenia.22 Our results suggested that the measurements of skeletal muscle mass were not overestimated when MT was used, especially in non-overweight participants. Consequently, MT was related to muscle strength, physical function, and EI, which is considered an index of muscle quality. Given the muscle mass or quality contributing to muscle function, it is expected that EI would be associated with a variety of functional performances. Numerous studies have reported the significant association of EI with muscle strength; EI may offer novel insights as a useful and simple marker for muscle quality. We have previously reported that MT and EI have the same or even higher ability to identify sarcopenia than ASMI does.31 Moreover, several longitudinal studies revealed that the changes in EI predict functional recovery or affect physical activity and clinical outcomes in community-dwelling older adults or patients with neuromuscular diseases.28,53–55
In consideration of the above-mentioned findings, muscle US was able to assess the quantitative and qualitative changes in skeletal muscle efficiently and better and could be an alternative to ASMI.
Although this study presents significant findings, it has several limitations. First, this was a cross-sectional study. The sample size of this study was relatively small, with a total of 165 individuals; however, it was not far below the sample sizes used in previous studies. Nevertheless, to confirm the superiority of MT over ASMI, longitudinal studies with large sample sizes should be conducted. Additionally, our study participants included individuals who were slightly undernourished because they were hospitalized at the department of geriatrics; thus, we did not include many individuals who met the operational definition of overweight (the average BMI of the participants in this study was: men: 23.1±3.5 kg/m2; women: 22.2±3.9 kg/m2). Further studies on a population including overweight older individuals are required. Moreover, previous reports stated that correcting the EI of US with subcutaneous fat enhanced the relationship between EI and lower extremity strength.56,57 This study did not address these issues and is a topic for future exploration. In addition, this study’s location is limited to body composition and US measurements in acute care hospitals. Therefore, care should be taken when measuring in different environments (eg, gym), as the environment at the measurement time may affect the results.
Conclusion
MT evaluation by US showed a stronger relationship with muscle strength and quality than ASMI. Our results suggest that TA muscle thickness assessment using US is a useful alternative to BIA-assessed ASMI, especially in non-overweight participants.
Ethical and Consent Statements
Each participant provided written informed consent before participation. This study was conducted in accordance with the guidelines proposed by the Declaration of Helsinki, and the study protocol was approved by the Ethics Committee (Approval No.18126-3).
Acknowledgments
We would like to thank Mari Shirai, Yukari Sugahara, Minoru Tanaka, and all the staff at Osaka University Hospital for their kind help in recruiting the participants. We would like to thank the medical staff of our department for their assistance.
Funding
This work was supported by the Japan Society for the Promotion of Science (JSPS) KAKENHI (Grant Number JP22K11355). The authors certify that they comply with the ethical guidelines for authorship and publishing in Clinical Interventions in Aging.
Disclosure
Masaaki Isaka, Ken Sugimoto, Hiroshi Akasaka, Yukiko Yasunobe, Toshimasa Takahashi, Keyu Xie, Yuri Onishi, Shino Yoshida, Tomohiro Minami, Koichi Yamamoto, Kei Kamide, and Hiromi Rakugi declare no conflicts of interest in this work.
References
1. Beaudart C, Zaaria M, Pasleau F, Reginster JY, Bruyère O. Health outcomes of sarcopenia: a systematic review and meta-analysis. PLoS One. 2017;12(1):e0169548. doi:10.1371/journal.pone.0169548
2. Uemura K, Doi T, Lee S, Shimada H. Sarcopenia and low serum albumin level synergistically increase the risk of incident disability in older adults. J Am Med Dir Assoc. 2019;20(1):90–93. doi:10.1016/j.jamda.2018.06.011
3. Zhang X, Huang P, Dou Q, et al. Falls among older adults with sarcopenia dwelling in nursing home or community: a meta-analysis. Clin Nutr. 2020;39(1):33–39. doi:10.1016/j.clnu.2019.01.002
4. Kohara K. Sarcopenic obesity in aging population: cur- rent status and future direction for research. Endocrine. 2014;45(1):15–25. doi:10.1007/s12020-013-9992-0
5. Vincent HK, Raiser SN, Vincent KR. The aging musculoskeletal system and obesity-related considerations with exercise. Ageing Res Rev. 2012;11(3):361–373. doi:10.1016/j.arr.2012.03.002
6. Sakuma K, Yamaguchi A. Sarcopenic obesity and endocrinal adaptation with age. Int J Endocrinol. 2013;2013:204164. doi:10.1155/2013/204164
7. Chen LK, Woo J, Assantachai P, et al. Asian working group for sarcopenia: 2019 consensus update on sarcopenia diagnosis and treatment. J Am Med Dir Assoc. 2020;21(3):300–307.e2. doi:10.1016/j.jamda.2019.12.012
8. Yamada Y, Nishizawa M, Uchiyama T, et al. Developing and validating an age-independent equation using multi-frequency bioelectrical impedance analysis for estimation of appendicular skeletal muscle mass and establishing a cutoff for sarcopenia. Int J Environ Res Public Health. 2017;14(7):809. doi:10.3390/ijerph14070809
9. Huo YR, Suriyaarachchi P, Gomez F, et al. Phenotype of sarcopenic obesity in older individuals with a history of falling. Arch Gerontol Geriatr. 2016;65:255–259. doi:10.1016/j.archger.2016.04.003
10. Ishii S, Chang C, Tanaka T, et al. The association between Sarcopenic obesity and depressive symptoms in older Japanese adults. PLoS One. 2016;11(9):e0162898. doi:10.1371/journal.pone.0162898
11. Kim JH, Cho JJ, Park YS. Relationship between sarcopenic obesity and cardiovascular disease risk as estimated by the Framingham risk score. J Korean Med Sci. 2015;30(3):264–271. doi:10.3346/jkms.2015.30.3.264
12. Kim H, Kim M, Kojima N, et al. Exercise and nutritional supplementation on community-dwelling elderly Japanese women with Sarcopenic obesity: a randomized controlled trial. J Am Med Dir Assoc. 2016;17(11):1011–1019. doi:10.1016/j.jamda.2016.06.016
13. Nijholt W, Scafoglieri A, Jager-Wittenaar H, Hobbelen JSM, van der Schans CP. The reliability and validity of ultrasound to quantify muscles in older adults: a systematic review. J Cachexia Sarcopenia Muscle. 2017;8(5):702–712. doi:10.1002/jcsm.12210
14. Ticinesi A, Meschi T, Narici MV, Lauretani F, Maggio M. Muscle ultrasound and sarcopenia in older individuals: a clinical perspective. J Am Med Dir Assoc. 2017;18(4):290–300. doi:10.1016/j.jamda.2016.11.013
15. Heckmatt JZ, Leeman S, Dubowitz V. Ultrasound imaging in the diagnosis of muscle disease. J Pediatr. 1982;101(5):656–660. doi:10.1016/s0022-3476(82)80286-2
16. Dupont AC, Sauerbrei EE, Fenton PV, Shragge PC, Loeb GE, Richmond FJ. Real-time sonography to estimate muscle thickness: comparison with MRI and CT. J Clin Ultrasound. 2001;29(4):230–236. doi:10.1002/jcu.1025
17. Pillen S, van Keimpema M, Nievelstein RA, Verrips A, van Kruijsbergen-Raijmann W, Zwarts MJ. Skeletal muscle ultrasonography: visual versus quantitative evaluation. Ultrasound Med Biol. 2006;32(9):1315–1321. doi:10.1016/j.ultrasmedbio.2006.05.028
18. Trip J, Pillen S, Faber CG, van Engelen BG, Zwarts MJ, Drost G. Muscle ultrasound measurements and functional muscle parameters in non-dystrophic myotonias suggest structural muscle changes. Neuromuscul Disord. 2009;19(7):462–467. doi:10.1016/j.nmd.2009.06.369
19. Ikezoe T, Asakawa Y, Fukumoto Y, Tsukagoshi R, Ichihashi N. Associations of muscle stiffness and thickness with muscle strength and muscle power in elderly women. Geriatr Gerontol Int. 2012;12(1):86–92. doi:10.1111/j.1447-0594.2011.00735.x
20. Galindo Martín CA, Monares Zepeda E, Lescas Méndez OA. Bedside ultrasound measurement of rectus femoris: a tutorial for the nutrition support clinician. J Nutr Metab. 2017;2017:2767232. doi:10.1155/2017/2767232
21. Ticinesi A, Narici MV, Lauretani F, et al. Assessing sarcopenia with vastus lateralis muscle ultrasound: an operative protocol. Aging Clin Exp Res. 2018;30(12):1437–1443. doi:10.1007/s40520-018-0958-1
22. Stock MS, Thompson BJ. Echo intensity as an indicator of skeletal muscle quality: applications, methodology, and future directions. Eur J Appl Physiol. 2021;121(2):369–380. doi:10.1007/s00421-020-04556-6
23. Rollins KE, Tewari N, Ackner A, et al. The impact of sarcopenia and myosteatosis on outcomes of unresectable pancreatic cancer or distal cholangiocarcinoma. Clin Nutr. 2016;35(5):1103–1109. doi:10.1016/j.clnu.2015.08.005
24. West MA, van Dijk DPJ, Gleadowe F, et al. Myosteatosis is associated with poor physical fitness in patients undergoing hepatopancreatobiliary surgery. J Cachexia Sarcopenia Muscle. 2019;10(4):860–871. doi:10.1002/jcsm.12433
25. Ahn H, Kim DW, Ko Y, et al. Updated systematic review and meta-analysis on diagnostic issues and the prognostic impact of myosteatosis: a new paradigm beyond sarcopenia. Ageing Res Rev. 2021;70:101398. doi:10.1016/j.arr.2021.101398
26. Watanabe Y, Yamada Y, Fukumoto Y, et al. Echo intensity obtained from ultrasonography images reflecting muscle strength in elderly men. Clin Interv Aging. 2013;8:993–998. doi:10.2147/CIA.S47263
27. Fukumoto Y, Ikezoe T, Yamada Y, et al. Age-related ultrasound changes in muscle quantity and quality in women. Ultrasound Med Biol. 2015;41(11):3013–3017. doi:10.1016/j.ultrasmedbio.2015.06.017
28. Fukumoto Y, Yamada Y, Ikezoe T, et al. Association of physical activity with age-related changes in muscle echo intensity in older adults: a 4-year longitudinal study. J Appl Physiol. 2018;125(5):1468–1474. doi:10.1152/japplphysiol.00317.2018
29. Reimers K, Reimers CD, Wagner S, et al. Skeletal muscle sonography: a correlative study of echogenicity and morphology. J Ultrasound Med. 1993;12(2):73–77. doi:10.7863/jum.1993.12.2.73
30. Pillen S, Tak RO, Zwarts MJ, et al. Skeletal muscle ultrasound: correlation between fibrous tissue and echo intensity. Ultrasound Med Biol. 2009;35(3):443–446. doi:10.1016/j.ultrasmedbio.2008.09.016
31. Isaka M, Sugimoto K, Yasunobe Y, et al. The usefulness of an alternative diagnostic method for sarcopenia using thickness and echo intensity of lower leg muscles in older males. J Am Med Dir Assoc. 2019;20(9):1185.e1–1185.e8. doi:10.1016/j.jamda.2019.01.152
32. Isaka M, Sugimoto K, Fujimoto T, et al. The utility of the ultrasonographic assessment of the lower leg muscles to evaluate sarcopenia and muscle quality in older adults. JCSM Clin Rep. 2021;6:53–61. doi:10.1002/crt2.30
33. Yuji M. Examination committee of criteria for ‘obesity disease’ in Japan; Japan society for the study of obesity. new criteria for ‘obesity disease’ in Japan. Circ J. 2002;66(11):987–992. doi:10.1253/circj.66.987
34. Baumgartner RN. Body composition in healthy aging. Ann N Y Acad Sci. 2000;904:437–448. doi:10.1111/j.1749-6632.2000.tb06498.x
35. Cruz-Jentoft G, Jürgen B, Bauer J, et al. Sarcopenia: revised European consensus on definition and diagnosis. Age Ageing. 2019;48:16–31. doi:10.1093/ageing/afy169
36. Heymsfield SB, Adamek M, Gonzalez MC, et al. Assessing skeletal muscle mass: historical overview and state of the art. J Cachexia Sarcopenia Muscle. 2014;5(1):9–18. doi:10.1007/s13539-014-0130-5
37. Roubenoff R, Baumgartner RN, Harris TB, et al. Application of bioelectrical impedance analysis to elderly populations. J Gerontol a Biol Sci Med Sci. 1997;52(3):M129–36. doi:10.1093/gerona/52a.3.m129
38. Janssen I, Heymsfield SB, Baumgartner RN, et al. Estimation of skeletal muscle mass by bioelectrical impedance analysis. J Appl Physiol. 2000;89(2):465–471. doi:10.1152/jappl.2000.89.2.465
39. Chen Z, Wang Z, Lohman T, et al. Dual-energy X-ray absorptiometry is a valid tool for assessing skeletal muscle mass in older women. J Nutr. 2007;137(12):2775–2780. doi:10.1093/jn/137.12.2775
40. Cruz-Jentoft AJ, Baeyens JP, Bauer JM, et al. Sarcopenia: European consensus on definition and diagnosis: report of the European working group on sarcopenia in older people. Age Ageing. 2010;39(4):412–423. doi:10.1093/ageing/afq034
41. Wang H, Hai S, Cao L, et al. Estimation of prevalence of sarcopenia by using a new bioelectrical impedance analysis in Chinese community-dwelling elderly people. BMC Geriatr. 2016;16(1):216. doi:10.1186/s12877-016-0386-z
42. Zhao R, Li X, Jiang Y, et al. Evaluation of appendicular muscle mass in sarcopenia in older adults using ultrasonography: a systematic review and meta-analysis. Gerontology. 2022;68(10):1174–1198. doi:10.1159/000525758
43. Cruz-Jentoft AJ, Landi F, Schneider SM, et al. Prevalence of and interventions for sarcopenia in ageing adults: a systematic review. Report of the international sarcopenia Initiative (EWGSOP and IWGS). Age Ageing. 2014;43(6):748–759. doi:10.1093/ageing/afu115
44. Fukumoto Y, Ikezoe T, Taniguchi M, et al. Cut-off values for lower limb muscle thickness to detect low muscle mass for sarcopenia in older adults. Clin Interv Aging. 2021;16:1215–1222. doi:10.2147/CIA.S304972
45. Ata AM, Kara M, Kaymak B, et al. Regional and total muscle mass, muscle strength and physical performance: the potential use of ultrasound imaging for sarcopenia. Arch Gerontol Geriatr. 2019;83:55–60. doi:10.1016/j.archger.2019.03.014
46. Ö Ö, Kara M, Topuz S, Kaymak B, Bakı A, Özçakar L. Assessment of core and lower limb muscles for static/dynamic balance in the older people: an ultrasonographic study. Age Ageing. 2019;48(6):881–887. doi:10.1093/ageing/afz079
47. Fragala MS, Kenny AM, Kuchel GA. Muscle quality in aging: a multi-dimensional approach to muscle functioning with applications for treatment. Sports Med. 2015;45(5):641–658. doi:10.1007/s40279-015-0305-z
48. Young HJ, Jenkins NT, Zhao Q, McCully KK. Measurement of intramuscular fat by muscle echo intensity. Muscle Nerve. 2015;52(6):963–971. doi:10.1002/mus.24656
49. Yamada M, Kimura Y, Ishiyama D, et al. Differential characteristics of skeletal muscle in community-dwelling older adults. J Am Med Dir Assoc. 2017;18(9):807.e9–807.e16. doi:10.1016/j.jamda.2017.05.011
50. Taniguchi M, Yamada Y, Fukumoto Y, et al. Increase in echo intensity and extracellular-to-intracellular water ratio is independently associated with muscle weakness in elderly women. Eur J Appl Physiol. 2017;117(10):2001–2007. doi:10.1007/s00421-017-3686-x
51. Mirón Mombiela R, Facal de Castro F, Moreno P, Borras C. Ultrasonic echo intensity as a new noninvasive in vivo biomarker of frailty. J Am Geriatr Soc. 2017;65(12):2685–2690. doi:10.1111/jgs.15002
52. Kawai H, Kera T, Hirayama R, et al. Morphological and qualitative characteristics of the quadriceps muscle of community-dwelling older adults based on ultrasound imaging: classification using latent class analysis. Aging Clin Exp Res. 2018;30(4):283–291. doi:10.1007/s40520-017-0781-0
53. Akazawa N, Harada K, Okawa N, et al. Changes in quadriceps thickness and echo intensity in chronic stroke survivors: a 3-year longitudinal study. J Stroke Cerebrovasc Dis. 2021;30(3):105543. doi:10.1016/j.jstrokecerebrovasdis.2020.105543
54. Tanaka S, Ito D, Kimura Y, et al. Relationship between longitudinal changes in skeletal muscle characteristics over time and functional recovery during intensive rehabilitation of patients with subacute stroke. Top Stroke Rehabil. 2021;28:1–10. doi:10.1080/10749357.2021.1940724
55. Monjo H, Fukumoto Y, Asai T, et al. Changes in muscle thickness and echo intensity in chronic stroke survivors: a 2-year longitudinal study. J Clin Neurol. 2022;18(3):308–314. doi:10.3988/jcn.2022.18.3.308
56. Ryan ED, Shea NW, Gerstner GR, et al. The influence of subcutaneous fat on the relationship between body composition and ultrasound-derived muscle quality. Appl Physiol Nutr Metab. 2016;41(10):1104–1107. doi:10.1139/apnm-2016-0238
57. Stock MS, Whitson M, Burton AM, et al. Echo intensity versus muscle function correlations in older adults are influenced by subcutaneous fat thickness. Ultrasound Med Biol. 2018;44(8):1597–1605. doi:10.1016/j.ultrasmedbio.2018.04.009
 © 2022 The Author(s). This work is published and licensed by Dove Medical Press Limited. The
full terms of this license are available at https://www.dovepress.com/terms
and incorporate the Creative Commons Attribution
- Non Commercial (unported, 3.0) License.
By accessing the work you hereby accept the Terms. Non-commercial uses of the work are permitted
without any further permission from Dove Medical Press Limited, provided the work is properly
attributed. For permission for commercial use of this work, please see paragraphs 4.2 and 5 of our Terms.
© 2022 The Author(s). This work is published and licensed by Dove Medical Press Limited. The
full terms of this license are available at https://www.dovepress.com/terms
and incorporate the Creative Commons Attribution
- Non Commercial (unported, 3.0) License.
By accessing the work you hereby accept the Terms. Non-commercial uses of the work are permitted
without any further permission from Dove Medical Press Limited, provided the work is properly
attributed. For permission for commercial use of this work, please see paragraphs 4.2 and 5 of our Terms.
Recommended articles
An Indian Consensus on Sarcopenia: Epidemiology, Etiology, Clinical Impact, Screening, and Therapeutic Approaches
Kalra S, Shaikh IA, Shende S, Kapoor N, Unnikrishnan A, Sharma O, Tiwaskar MH, Vora A, Verma SK, Kantroo V, Mehta P, Lovesley D, Sivakumar N, Kukreja BB, Kulkarni K, Deora A
International Journal of General Medicine 2025, 18:1731-1745
Published Date: 26 March 2025