")
Back to Journals » International Journal of General Medicine » Volume 14
The Moderate Correlation Between 25(OH)D Serum and Saliva in Healthy People with Low Vitamin D Intake
Authors Sari DK , Sari LM, Laksmi LI, Farhat
Received 20 January 2021
Accepted for publication 26 February 2021
Published 11 March 2021 Volume 2021:14 Pages 841—850
DOI https://doi.org/10.2147/IJGM.S302912
Checked for plagiarism Yes
Review by Single anonymous peer review
Peer reviewer comments 4
Editor who approved publication: Dr Scott Fraser
Video abstract presented by Dina Keumala Sari.
Views: 503
Dina Keumala Sari,1 Liza Meutia Sari,2 Lidya Imelda Laksmi,3 Farhat4
1Nutrition Department, Faculty of Medicine, Universitas Sumatera Utara, Medan, Indonesia; 2Oral Medicine Department, Faculty of Dentistry, Universitas Syah Kuala, Banda Aceh, Indonesia; 3Anatomy Pathology Department, Faculty of Medicine, Universitas Sumatera Utara, Medan, Indonesia; 4Ear, Nose, Throat, Head and Neck Department, Faculty of Medicine, Universitas Sumatera Utara, Medan, Indonesia
Correspondence: Dina Keumala Sari
Nutrition Department, Faculty of Medicine, Universitas Sumatera Utara, Jl. Ring Road, Komp. Tasbih 2, Blok 5, No. 126, Medan, North Sumatra, 20128, Indonesia
Tel +62 81397177693
Email [email protected]
Purpose: The routine examination of vitamin D levels is carried out by checking serum 25(OH)D levels, while serum 1.25(OH)D levels are less frequently utilized. The proposition that testing for salivary vitamin D can show a correlation with serum levels in healthy people is questionable, especially with low vitamin D intake. This study aimed to find the correlation between vitamin D levels, which were assessed as 25(OH)D and 1.25(OH)D in saliva, and serum 25(OH)D and 1.25(OH)D levels in people with low vitamin D intake.
Patients and Methods: This study is a cross-sectional study involving healthy men and women, aged 18– 60 years, carried out from August to November, 2020, in North Sumatra Province, Indonesia. The parameters studied were the 25(OH)D and 1.25(OH)D levels in saliva and serum, and vitamin D intake. The statistical analysis used was the Spearman correlation test, performed to determine the correlation between each parameter.
Results: This study involved 56 study subjects, who were rural adults (male or female) with a 78.6% deficiency in 25(OH)D found by examining saliva, and a 76.8% deficiency found by examining the serum. All of the subjects were categorized as having low vitamin D intake (less than 15 micrograms per day). The analysis showed a moderate correlation between levels of saliva 25(OH)D and serum 25(OH)D (p = 0.424), and a weak correlation between levels of saliva 1.25(OH)D and serum 25(OH)D (p = 0.339).
Conclusion: In people with low vitamin D intake, there was a moderate correlation between serum 25(OH)D and saliva, but a weak correlation was found in the 1.25(OH)D assay. The use of saliva 25(OH)D levels to detect 25(OH)D in the circulation is a possible non-invasive alternative to serum testing.
Keywords: cross-sectional study, deficiency, food sources, non-invasive, rural, vitamin D
Introduction
Vitamin D deficiency occurs in various parts of the world, including in the tropics, and it occurs in both healthy and sick people.1,2 Vitamin D deficiency is often found in people with a low intake of food sources of vitamin D.3,4 Vitamin D is found at higher levels in fish oil and sun exposure, but not all people can consume fish oil easily, or are exposed to sunlight, considering lifestyle factors.5,6 The difficulty involved in getting fish oil or vitamin D supplements is a challenge in preventing vitamin D deficiency.5,7,8
The examination of serum 25(OH)D levels is necessary for determining the level of vitamin D in circulation and in its active form, namely, serum 1.25(OH)D.9 However, this examination often causes discomfort in the patient, so an easier examination is needed that does not cause pain. Saliva contains various types of biological compounds, including vitamins and enzymes, so it is hoped that saliva can become a biological specimen that describes health status.10,11 Saliva screening is considered a non-invasive test, and little encouragement and direction is required to produce a suitable specimen.10 Several of the vitamins and enzymes that describe health status and that are contained in saliva include vitamin D, vitamin A, vitamin C, vitamin B6, vitamin B12, and enzymes that describe oxidative stress, such as malondialdehyde, amylase and proteomes.10,12–14
This examination of vitamin D is necessary due to the role of vitamin D, which can increase body immunity through its role as an endocrine.15–18 It also acts as an anti-inflammatory and has a regulatory effect on the immune system. The effects of vitamin D therapy can be felt in various metabolic diseases, and in cancer.18,19 The examination of vitamin D levels in the form of 25(OH)D and 1.25(OH)D in saliva has not been used often for diagnostic purposes, because these levels may not show the actual levels in the body, or reflect specific conditions such as low vitamin D level or chronic diseases.11,20
Saliva examination is more applicable in hormonal, immunological, and infection tests, but it is rarely used.11,21,22 In addition, saliva examination may reveal many other contamination factors, so its use in diagnostic tests is often neglected.22 However, if done according to the correct procedure, the risk of contamination can be removed, but whether there is a correlation between saliva and serum vitamin D levels in adults with low vitamin D intake remains questionable. Adults in rural areas offer an example of homogeneity in food intake, compared to those in urban areas with heterogeneity in their food intake.
Previous studies have shown a correlation between saliva and serum; however, these studies only examined the correlation between serum 25(OH)D levels and the saliva levels in healthy controls. The studies did not examine serum 1.25(OH)D levels, which represent the active form of vitamin D.11 Research on vitamin D, especially on those with vitamin D deficiency due to insufficient intake of food sources of vitamin D, has not been reported. Moreover, vitamin D deficiency, or subclinical symptoms, are likely to be important etiological factors in the pathogenesis of many chronic disease, but this deficiency condition is often ignored.23
Based on the results of the above research, we conducted a study on the correlation between levels of 25(OH)D and 1.25(OH)D in the saliva and serum. The goal was to find the correlation between these two parameters in rural adults with low vitamin D intake; besides this, another intention was to find an alternative to serum testing, which is invasive and causes discomfort to the patient. It is hoped that with the findings of this research, saliva examination could replace serum testing.
Patients and Methods
Participants
This study was conducted according to the guidelines laid down in the Declaration of Helsinki, and all procedures involving research study participants were approved by Clinical Trials.gov (number: NCT04655664; date of document: November 18th, 2020). This research was also approved by the Universitas Sumatera Utara Ethical Committee, No. 63/KEP/USU/2020. All participants knowingly consented to participate in this study. The subjects of this study gave signed informed consent prior to being included. Written and verbal informed consent was obtained from all subjects. Verbal consent was witnessed and formally recorded in a statement sheet after explanation. During the study, no therapy or intervention was carried out, and the research subjects were not charged any fees for the laboratory examination.
This study was conducted in Batubara District, Simalungun Regency, North Sumatra, Sumatra Island, Indonesia, from August to November 2020. During the data collection period, strict health protocols were also observed because of the COVID-19 pandemic. This area is about 153 kilometers from the city center of Medan City, near rubber and oil palm plantations, and the hope was that the research subjects would be healthier because of their high activity levels. Adults in rural areas have homogeneity in their food intake compared to those in cities, whose intakes are more heterogeneous, so food intake in rural areas can offer a more detailed representation of vitamin D intake.
This study included 56 study subjects. The inclusion criteria were men and women aged 18–60 years, not currently experiencing chronic pain, kidney problems, liver problems or other hormone disorders. The exclusion criteria were study subjects who consumed vitamin D supplements regularly, or were pregnant or breastfeeding.
Nutrient Intake Assessment
The assessment of food intake was carried out using interview techniques. The questions in the nutritional intake interview related to the diversity of food consumed, the quantity consumed, and the choice of food to be consumed, using a 24-hour food recall approach for two days. The questions included concerned such issues as time of eating, type of food, types of basic food ingredients, and the quantity of food ingredients in the household consumed by the subject at one time. Calculations were conducted using the Nutrisurvey application (2005), which included Indonesian foods.24
The assessment of nutrient intake was based on food recall over two days (one weekday and one weekend day), including energy, protein intake, fat intake, carbohydrate intake, and percentage of fulfilment, according to the Indonesian recommended dietary allowances (RDA), 2019.
The following categorizations were determined: for calorie intake, <2500 calories per day was low and ≥2500 calories per day was normal; for protein intake, <60 g per day was low and ≥60 g per day was normal; for carbohydrate intake, <400 g per day was low and ≥400 g per day was normal; for fat intake, <65 g per day was low and ≥65 gr per day was normal; for fiber intake, <25 g per day was low and ≥25 g per day was normal.25
Laboratory Analysis
The tests carried out examined 25(OH)D and 1.25(OH)D levels in serum and saliva, in relation to demographic data and other anthropometries. The examination was carried out by taking 5 mL of blood and 2 mL of saliva, and then checking the serum and saliva levels of 25(OH)D and 1.25(OH)D.
In the collection of serum, after blood was drawn by taking 2 mL of blood into a clean and dry tube without coagulant, let it stand for 15 minutes. Centrifugation is carried out at 3000 rpm for 10 minutes and the specimen is immediately stored at –20 oC for further determination of the levels of serum 25(OH)D and 1.25(OH). The transport time to the laboratory is two hours along with saliva specimen.
The collection of saliva was carried out in the morning (09.00–11.00 AM) using the spitting method, and was unstimulated. The research subjects were asked not to consume food or drink for at least 90 minutes before being examined. This method includes several stages: The subject is asked not to eat or drink for approximately one hour before saliva is taken. The subject is asked to sit comfortably for five minutes, then clean their mouth with a distilled water solution. Then, the subject is asked to swallow the saliva in their oral cavity so measuring can commence. After that, their head is lowered and moved as little as possible (talking is restricted). The subject is not allowed to swallow their saliva during the measurement process. The subject is asked to collect saliva in their oral cavity with lips closed and eyes open for one minute, then spit it into a container. The collection is undertaken over five minutes, and then the data are entered into the data table. Centrifugation is carried out (2500 rpm for 10 minutes), and the specimen is immediately stored at –20 oC. The transport time to the laboratory is two hours.
The serum and salivary 25(OH)D levels are defined as deficient if below 10 ng/mL, insufficient if between 11 and 20 ng/mL, and optimal if ≥20 ng/mL. The 1.25(OH)D serum and saliva levels are deemed deficient if ≤48 pmol/L and normal if >48 pmol/L.26,27 The examination of 25(OH)D and 1.25(OH)D serum and saliva levels was carried out using the Bio-Rad Enzyme-Linked Immunosorbent Assay (ELISA) technology tool, California, United States of America, with the ELISA kit, Brand Bioassay, Bioassay Technology Laboratory, Shanghai, China.
Sample Size and Power Calculation
The study sample sizes were chosen with the aim of demonstrating a correlation between 1.25(OH)D saliva and 1.25(OH)D serum levels, and the correlation between 25(OH)D saliva and 25(OH)D serum levels. To determine the minimum sample size in the two-tailed hypothesis test, this study had a significance level of 0.05 (α-value) and 80% power (β-value). This study calculates both hypotheses and takes the largest sample size.
Statistical Analysis
Descriptive statistics for continuous variables were summarized as means ± standard deviations (SD), and the categorical variables were summarized by proportions. Statistical analysis was performed by presenting the data in the form of standard deviations if the data were normally distributed, but if the data were not normally distributed, then they were presented in the form of minimum, maximum and median. The normally distributed data included levels of 25(OH)D and 1.25(OH)D in saliva, body mass index and abdominal circumference, while the data that were not normally distributed included age, and 25(OH)D and 1.25(OH)D serum levels.
The data were not normally distributed, so the Spearman correlation test was used. A weak correlation was determined as 0.2 to <0.4, a moderate correlation was 0.4 to <0.6, and a strong correlation was 0.6 to <0.8.
Results
Based on the demographic data, in the research location, there are more people in their mid-30s to 40s, and women are more likely to work as housewives, while men are the most likely to be self-employed as entrepreneurs (Table 1). In rural areas, the majority of the population are usually categorized as farmers, but this study shows that most of them are entrepreneurs. This work is likely to facilitate a sedentary lifestyle and limited sun exposure. These jobs are presumably taken because they provide a better income than those of farmers, who are very affected by the climate. This is similar to the lifestyles of housewives who spend most of their time performing activities inside the house, which results in less exposure to sunlight as a source of vitamin D. Education related to knowledge about the importance of vitamin D is assessed via the education level of the research subject, whereby the highest percentage were seniors in high school.
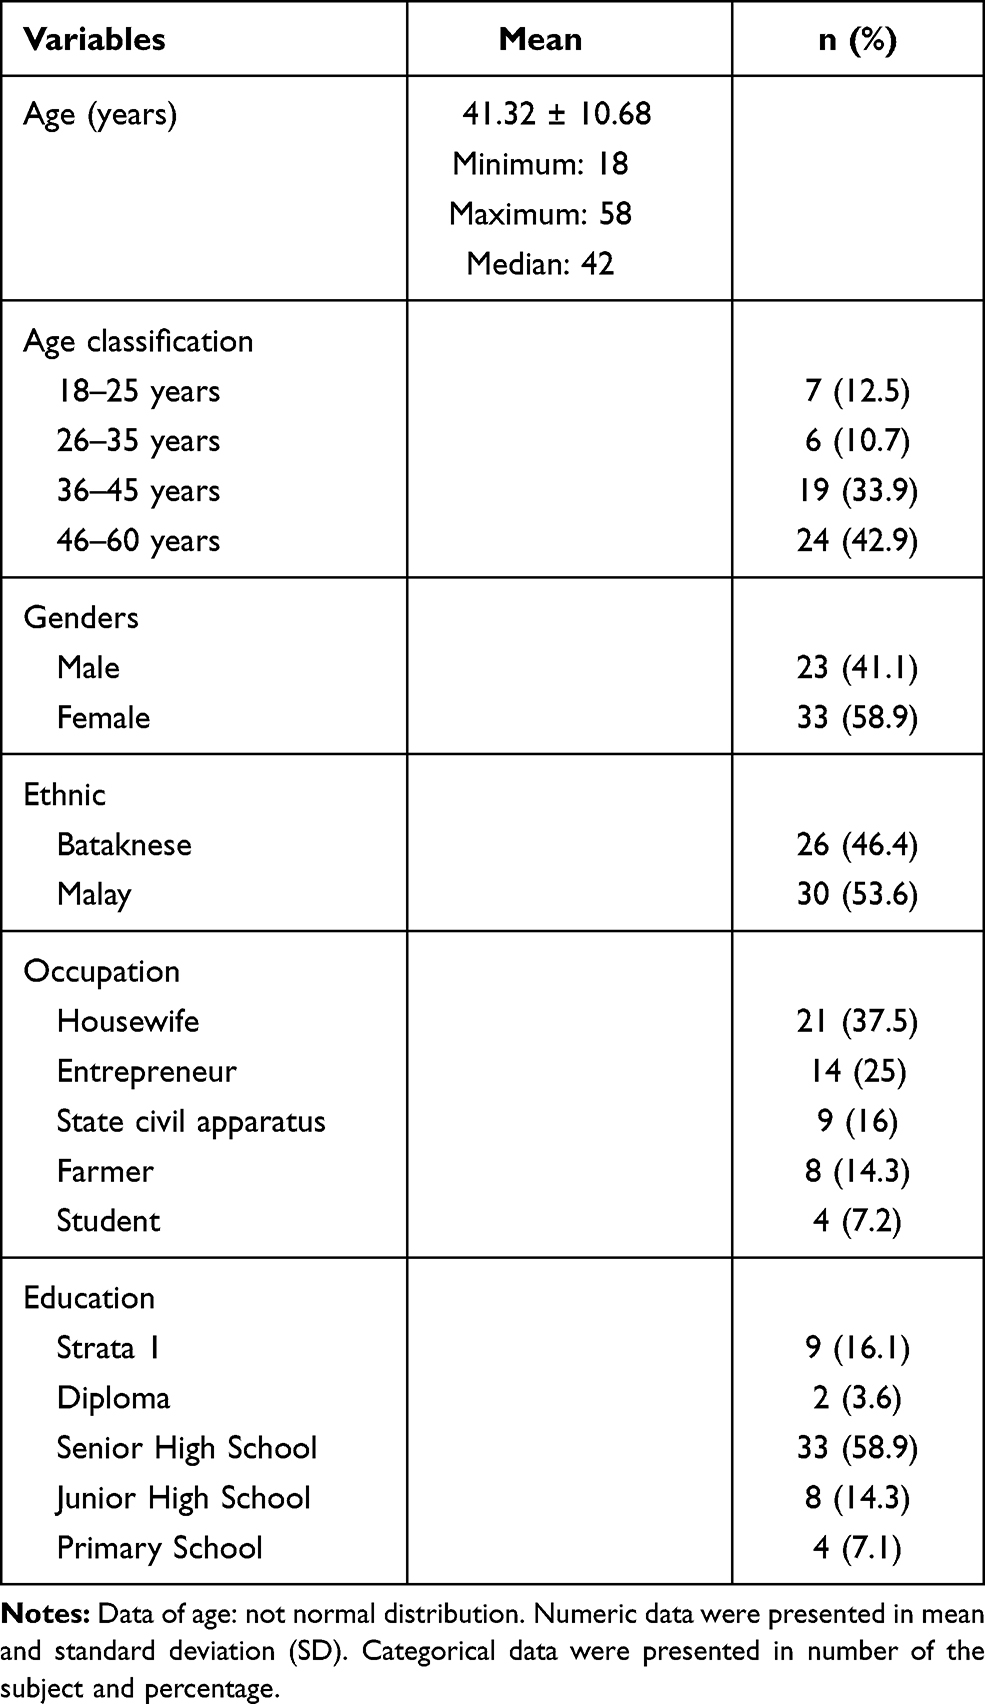 |
Table 1 Demographic Characteristics of the Subjects |
Based on the anthropometric examination, most of the study subjects were categorized as obese; however, based on the criteria for abdominal circumference, a greater percentage of women exhibited central obesity (Table 2). Table 3 shows that the research subjects had a very low intake of energy, carbohydrates and vitamin D; however, from the whole nutritional intake, macro- and micronutrient deficiencies can be seen. Vitamin D can be produced by the body with the help of sun exposure, and it can also be obtained from food and supplements. People who live in rural areas have difficulty obtaining food sources of vitamin D, which can be seen from the nutritional data survey that shows a low intake of food sources of vitamin D. When a person rarely eats these foods or is not exposed to sunlight, they are at risk of developing a vitamin D deficiency.
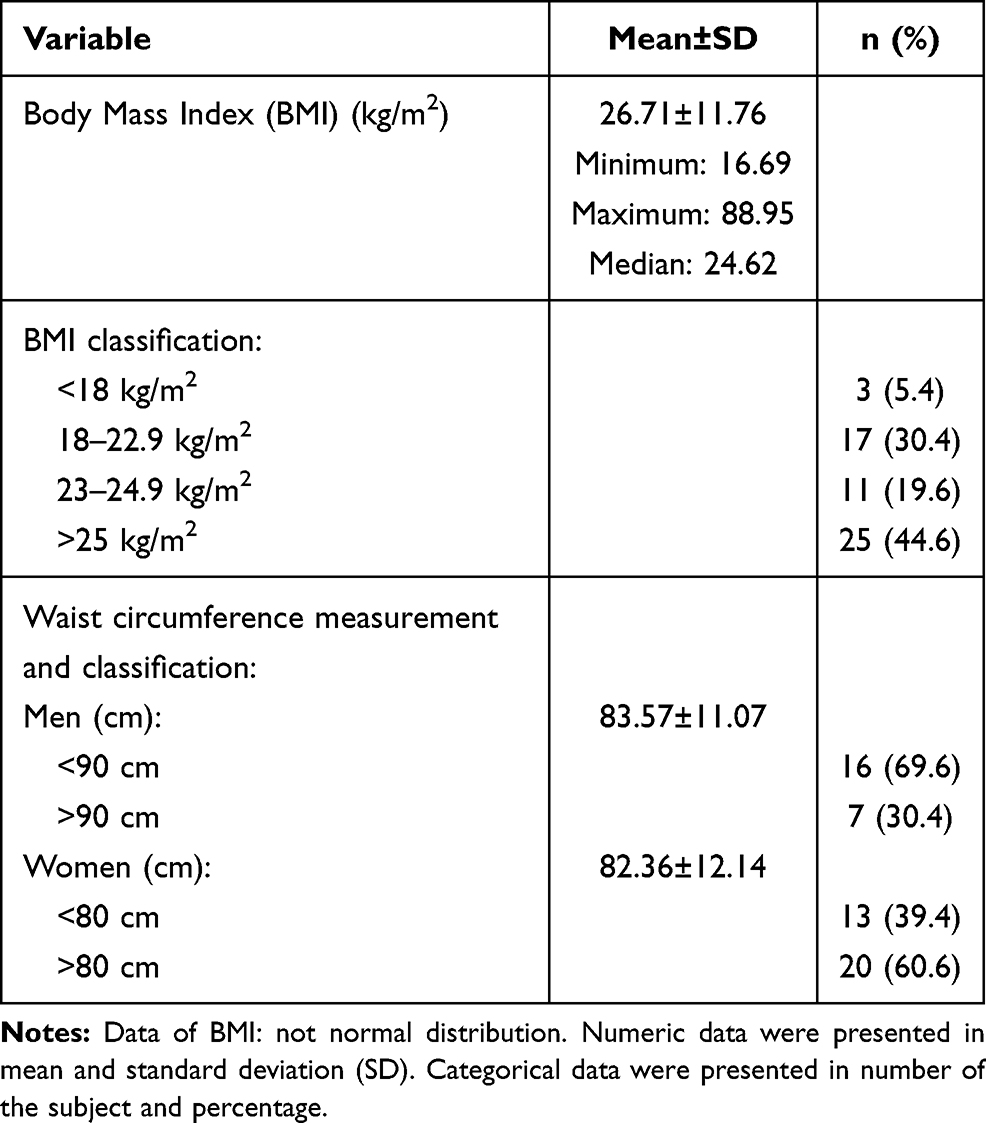 |
Table 2 Anthropometry Parameters of the Subjects |
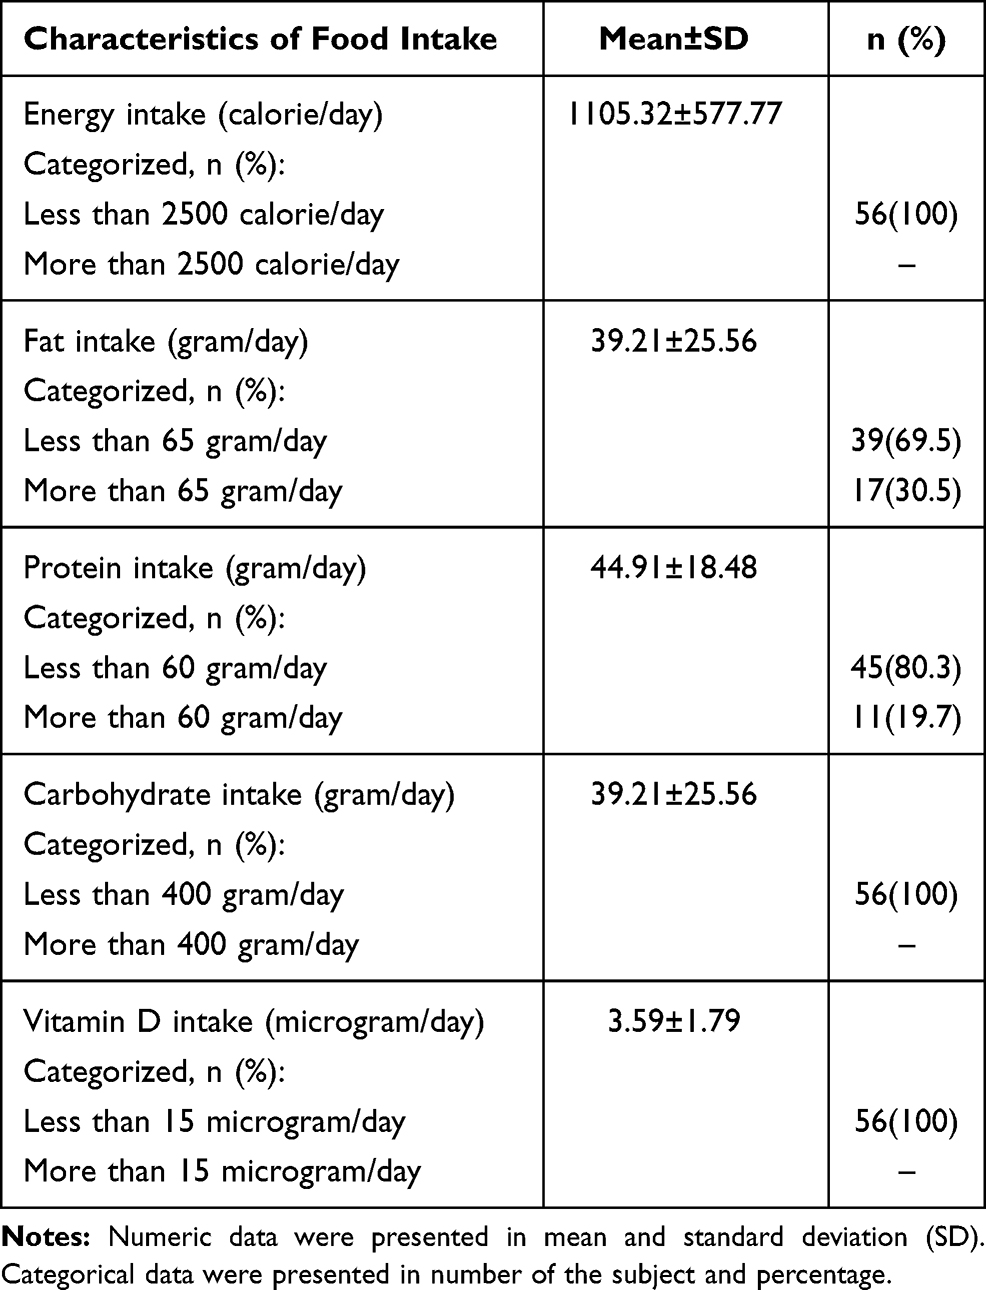 |
Table 3 Characteristic Data of the Subjects Based on Food Intake |
Table 4 shows that the percentage of deficiency was 78.6% when testing with salivary 25(OH)D, and 76.8% when testing with serum 25(OH)D. As for the 1.25(OH)D examination in saliva and serum, 100% of the study subjects were within the normal limits. The results of the study, shown in Table 5, suggest a moderate correlation between 25(OH)D saliva levels and 25(OH)D serum levels (p = 0.424), and a weak correlation between 1.25(OH)D saliva levels and 25(OH)D serum levels (p = 0.339), determined using the Spearman test.
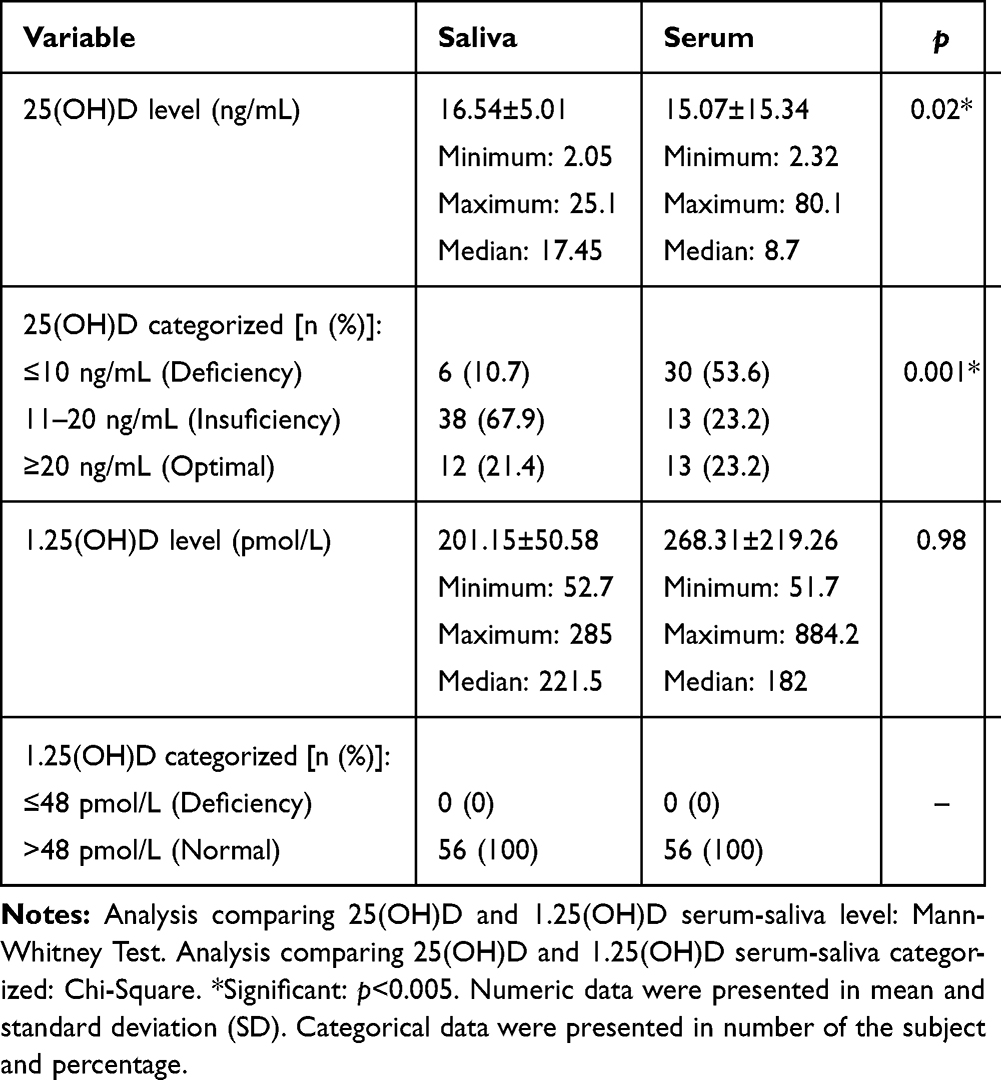 |
Table 4 Vitamin D Saliva and Serum Level |
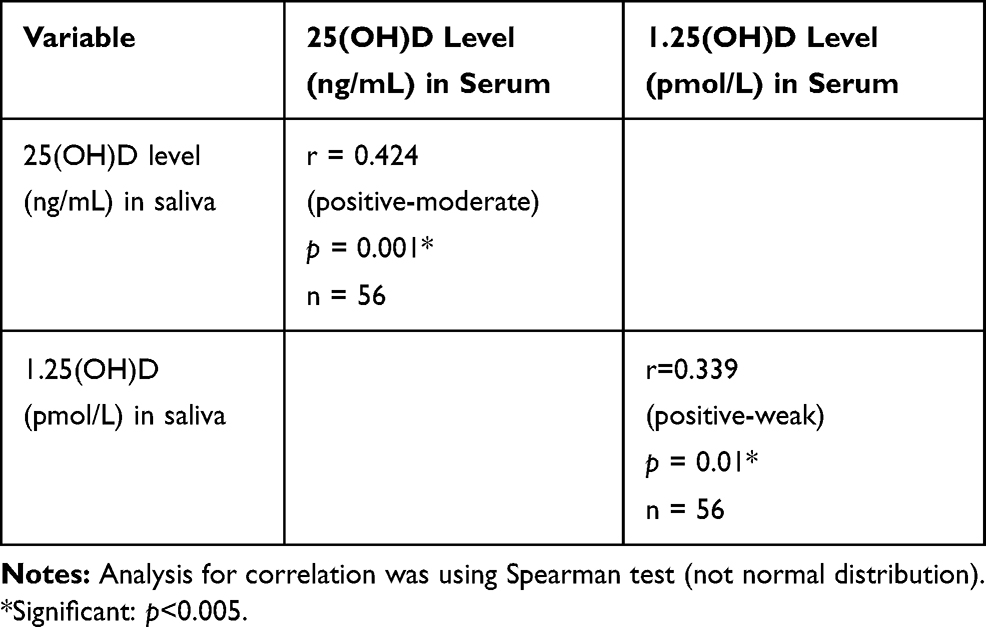 |
Table 5 Correlation Between Vitamin D Saliva and Serum Level |
The scatter-plot graph outputs from Figures 1 and 2 show that the data plot points form a straight line pattern from the bottom left up to the top right. It can be concluded that there is a linear and positive relationship between levels of 25(OH)D in saliva and serum 25(OH)D levels. This positive relationship means that if the salivary 25(OH)D level increases, so will the serum level. Likewise, the levels of 1.25(OH)D in saliva and serum showed a positive relationship.
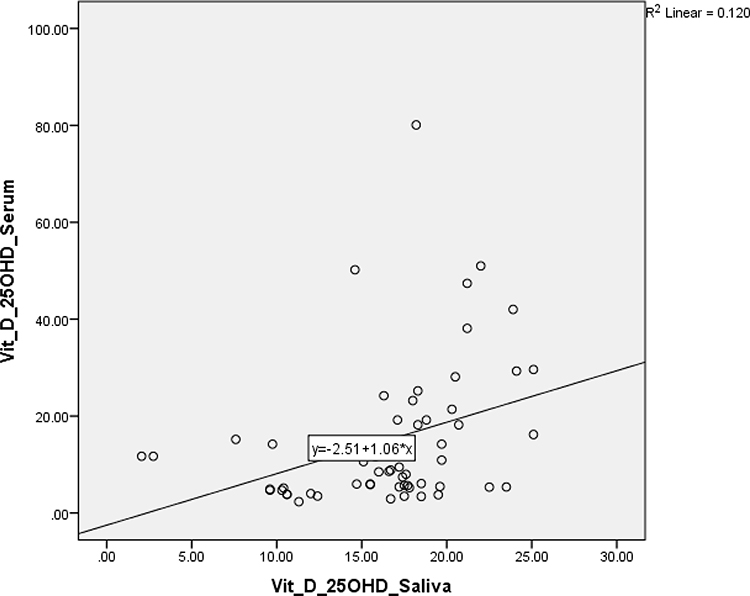 |
Figure 1 Scatter-plot showed correlation between 25(OH)D saliva and serum. |
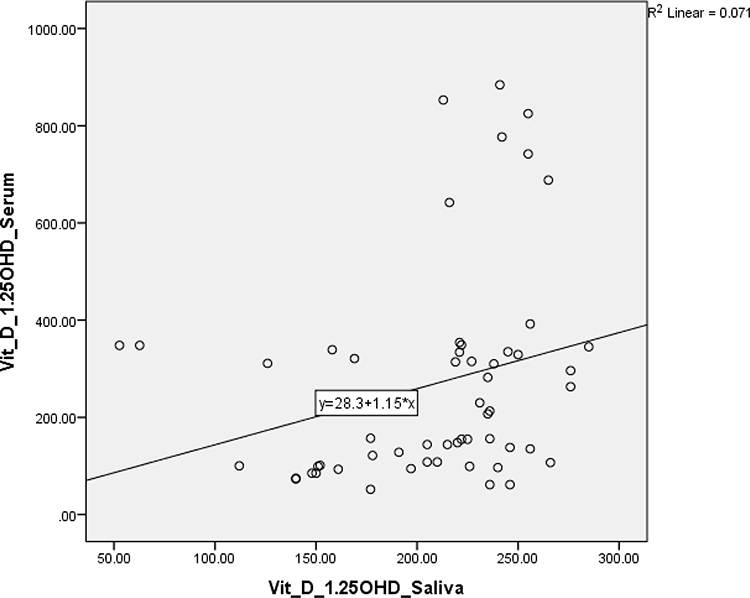 |
Figure 2 Scatter-plot showed correlation between 1.25(OH)D saliva and serum. |
Discussion
This study shows that vitamin D deficiencies occur in groups of healthy research subjects, although they do not tend to be accompanied by diseases caused by vitamin D deficiency.1,3 Vitamin D deficiency symptoms often go unnoticed. In fact, if left untreated, this condition can increase the risk of certain diseases, ranging from bone disorders to infections.3,6,23,28–30 Vitamin D can be produced by the body with the help of sun exposure, and can also be obtained from foods, such as fish, fish oil, beef liver, cheese, eggs, mushrooms, and fortified milk with vitamin D.31–34 However, a lack of vitamin D intake may affect vitamin D levels. This study reported that most of the study subjects did not consume adequate amounts of food sources of vitamin D. The low intake of vitamin D caused most of the study subjects to experience vitamin D deficiency and/or insufficiency.
However, a low intake of vitamin D is not the main cause of vitamin D deficiency, as there are several other factors that can affect it, including obesity.35–39 Vitamin D deficiency is an independent risk factor for obesity and abdominal obesity in women.40,41 Previous studies have reported that there is a link between obesity and low levels of vitamin D in the body.42–44 It is not yet known what the cause of vitamin D deficiency is, that is, whether it is due to insufficient sunlight exposure, low vitamin D intake, or vitamin D receptor gene polymorphism.45–48 One probable mechanism of vitamin D deficiency associated with obesity is the decreased bioavailability of vitamin D (cholecalciferol/vitamin D3) from skin and food as it accumulates in adipocytes, and people who are obese will thus be less able to convert vitamin D into the active form.41,43,49,50
The examination of vitamin D has become routine, and most often uses 25(OH)D serum, which reflects the circulating vitamin D levels, whereas the examination of serum 1.25(OH)D levels represents the active form of vitamin D.6,9,30 Both these examination are often uncomfortable and invasive. Various studies have also been conducted to compare this examination with the examination of other body fluids.10,14 In addition to serum examinations, some studies have discussed the diagnosis of vitamin D status using a questionnaire.4 This suggests that an invasive examination is not required to establish vitamin status, but this study focused only on the elderly.4 Other studies have shown that serum levels offer more precise results compared to other body fluids.8,51,52
The saliva examination in this study resulted in a higher measured level than the serum examination, which was probably due to the different sensitivities involved detecting 25(OH)D in serum vs. saliva. Saliva examination results are also considered to be heavily influenced by contaminants, so these results cannot be adjusted to the levels in serum. However, this study showed that there was a moderate correlation between saliva and serum levels, especially in terms of 25(OH)D levels, but the correlation was weak in terms of 1.25(OH)D levels. This was probably due to the condition of low vitamin D intake, which is reflected in the high percentage of vitamin D deficiency and insufficiency.
The examination of 1.25(OH)D in saliva exhibited a higher limit compared to in serum, so with a cutoff point of 48 pmol/L, it showed that no study subject had a vitamin D deficiency. All study subjects belonged to the normal group. This result is certainly different from those of other studies, which showed a deficiency via both serum and saliva.2,10,12,16,52,53 This study showed a moderate correlation between saliva and serum as regards 25(OH)D levels, and this moderate correlation shows that saliva assessment can be in place of serum testing, especially in people with a low intake of vitamin D. The examination of 1.25(OH)D showed a weak correlation between the two approaches; this needs further analysis, and indicates that salivary examination cannot reveal the correlation between saliva and serum. The fulfillment of nutritional needs is intrinsic to improving vitamin D status in the body.
The results of this study differ from those of previous studies, which reported significantly lower serum vitamin D levels in patients with recurrent aphthous stomatitis than in healthy people.11 However, the average levels of vitamin D in all those study subjects were higher than in this study. The very low levels of vitamin D in this study were probably due to an insufficient intake of food sources of vitamin D, instead of chronic disease conditions or an inflammatory reaction, as in previous studies.11,54
This study offers different results from those of previous research, especially as regards the results from healthy and sick people who have levels of 25(OH)D in their saliva and serum.11 In this study examining the group’s intake of food sources of vitamin D, this intake was low, and the group also showed moderate levels of 25(OH)D in serum and saliva, and weak levels of 1.25(OH)D in serum and saliva.
This study also has limitations, particularly as regards the interview bias related to the use of the 24-hour food recall method. This can arise in subjects or respondents who did not report the exact food consumed. This interview bias occurs due to respondents’ honesty, respondent’s memory, and the under-/overestimation of food intake.
This study also does not assess the levels of calcium and parathyroid hormone, which would have allowed a discussion of the relationship between the three nutrients, and this study did not compare vitamin D levels in people experiencing chronic disease or other diseases, which would have shown a more pronounced difference.
Conclusions
The assessment of 25(OH)D saliva levels to detect the 25(OH)D levels in circulation could be a non-invasive alternative to serum testing, especially in people with low vitamin D intake. There was a moderate correlation between serum 25(OH)D and saliva, but a weak correlation was found in the 1.25(OH)D assay. The examination using saliva as a substitute for serum testing is expected to facilitate the examination of 25(OH)D levels, but is less applicable for testing 1.25(OH)D levels. This study also emphasizes the importance of adequate vitamin D intake in order to keep vitamin levels within the normal limits in the body.
Data Sharing Statement
The authors confirm that the data supporting the findings of this study are available within the article.
Acknowledgments
The authors would like to thank Dr. Muhammad Nizar and Kepala UPT Puskesmas Lima Puluh for assisting in participant recruitment in Village III, Desa Simpang Dolok, Kecamatan Datuk Lima Puluh, Kabupaten Batubara, North Sumatera, Sumatra Island, Indonesia. We also would like to thank the research volunteers who participated in this study.
Author Contributions
All authors made substantial contributions to conception and design, acquisition of data, or analysis and interpretation of data; took part in drafting the article or revising it critically for important intellectual content; agreed to submit to the current journal; gave final approval of the version to be published; and agree to be accountable for all aspects of the work.
Funding
Funded by the Department for Strengthening Research and Development, Ministry of Research and Technology/National Research and Innovation Agency for the 2020 Fiscal Year in accordance with the Research Contract Amendment Number: 11/AMD/E1/KP.PTNBH/2020, dated 11 May 2020.
Disclosure
The authors declare that they have no conflicts of interests for this work.
References
1. Sari DK, Mega JY, Harahap J. Nutrition status related to clinical improvement in AFB-positive pulmonary tuberculosis patients in primary health centres in Medan, Indonesia. Open Access Maced J Med Sci. 2019;7(10):1621–1627. doi:10.3889/oamjms.2019.338
2. Chaiprasongsuk A, Janjetovic Z, Kim TK, et al. Protective effects of novel derivatives of vitamin D3 and lumisterol against UVB-induced damage in human keratinocytes involve activation of Nrf2 and p53 defense mechanisms. Redox Biol. 2019;24:101206. doi:10.1016/j.redox.2019.101206
3. Baggerly CA, Cuomo RE, French CB, et al. Sunlight and Vitamin D: necessary for public health. J Am Coll Nutr. 2015;34(4):359–365. doi:10.1080/07315724.2015.1039866
4. Annweiler C, Kabeshova A, Callens A, Paty ML, Duval GT, Holick MF. Self-administered Vitamin D status predictor: older adults are able to use a self-questionnaire for evaluating their vitamin D status. PLoS One. 2017;12(11):e0186578. doi:10.1371/journal.pone.0186578
5. Byrdwell WC, Devries J, Exler J, et al. Analyzing vitamin D in foods and supplements: methodologic challenges. Am J Clin Nutr. 2008;88(2):554S–557S. doi:10.1093/ajcn/88.2.554S
6. Cannell JJ, Vieth R, Umhau JC, et al. Epidemic influenza and vitamin D. Epidemiol Infect. 2006;134(6):1129–1140. doi:10.1017/S0950268806007175
7. Chen TC, Chimeh F, Lu Z, et al. Factors that influence the cutaneous synthesis and dietary sources of vitamin D. Arch Biochem Biophys. 2007;460(2):213–217. doi:10.1016/j.abb.2006.12.017
8. Biancuzzo RM, Clarke N, Reitz RE, Travison TG, Holick MF. Serum concentrations of 1,25-dihydroxyvitamin D2 and 1,25-dihydroxyvitamin D3 in response to vitamin D2 and vitamin D3 supplementation. J Clin Endocrinol Metab. 2013;98(3):973–979. doi:10.1210/jc.2012-2114
9. Alshahrani FM, Almalki MH, Aljohani N, Alzahrani A, Alsaleh Y, Holick MF. Vitamin D: light side and best time of sunshine in Riyadh, Saudi Arabia. Dermatoendocrinol. 2013;5(1):177–180. doi:10.4161/derm.23351
10. Evans LW, Omaye ST. Use of saliva biomarkers to monitor efficacy of Vitamin C in exercise-induced oxidative stress. Antioxidants (Basel. 2017;6(1). doi:10.3390/antiox6010005
11. Bahramian A, Falsafi P, Abbasi T, et al. Comparing serum and salivary levels of Vitamin D in patients with recurrent aphthous stomatitis and healthy individuals. J Dent Shiraz Univ Med Sci. 2018;19(4):6.
12. Isola G, Polizzi A, Muraglie S, Leonardi R, Lo Giudice A. Assessment of Vitamin C and antioxidant profiles in saliva and serum in patients with periodontitis and ischemic heart disease. Nutrients. 2019;11(12):2956. doi:10.3390/nu11122956
13. Johansson I, Ericson T, Lumikari M. The effect of vitamin A deficiency on the secretion of saliva and two salivary glycoproteins in the adult rat. Int J Vitam Nutr Res. 1989;59(2):234–235.
14. Rakshasbhuvankar AA, Clarke MW, Simmer K, Patole SK, Pillow JJ. Saliva for assessing vitamin a status in extremely preterm infants: a diagnostic study. Neonatology. 2020;1–4.
15. Ganmaa D, Munkhzul B, Fawzi W, et al. High-dose Vitamin D3 during tuberculosis treatment in mongolia. a randomized controlled trial. Am J Respir Crit Care Med. 2017;196(5):628–637. doi:10.1164/rccm.201705-0936OC
16. McCullough PJ, Lehrer DS, Vitamin D. cod liver oil, sunshine, and phototherapy: safe, effective and forgotten tools for treating and curing tuberculosis infections - A comprehensive review. J Steroid Biochem Mol Biol. 2018;177:21–29. doi:10.1016/j.jsbmb.2017.07.027
17. Wahyunitisari MR, Mertaniasih NM, Amin M, Artama WT, Koendhori EB, Vitamin D. cell death pathways, and tuberculosis. Int J Mycobacteriol. 2017;6(4):349–355. doi:10.4103/ijmy.ijmy_120_17
18. Bochen F, Balensiefer B, Korner S, et al. Vitamin D deficiency in head and neck cancer patients - prevalence, prognostic value and impact on immune function. Oncoimmunology. 2018;7(9):e1476817. doi:10.1080/2162402X.2018.1476817
19. Fanidi A, Muller DC, Midttun O, et al. Circulating vitamin D in relation to cancer incidence and survival of the head and neck and oesophagus in the EPIC cohort. Sci Rep. 2016;6:36017. doi:10.1038/srep36017
20. Fairney A, Saphier PW. Studies on the measurement of 25-hydroxy vitamin D in human saliva. Br J Nutr. 1987;57(1):13–25. doi:10.1079/BJN19870005
21. Gottlieb CW, Retief FP, Herbert V. Blockade of vitamin B12-binding sites in gastric juice, serum and saliva by analogues and derivatives of vitamin B12 and by antibody to intrinsic factor. Biochim Biophys Acta. 1967;141(3):560–572. doi:10.1016/0304-4165(67)90185-7
22. Flusser J, Chvojkova V, Kozicka V. [Relationship between saliva and vitamin B12. (Contribution to the problem of the intrinsic factor)]. Cas Lek Cesk. 1961;100:199–205.
23. Grober U, Spitz J, Reichrath J, Kisters K, Holick MF. Vitamin D: update 2013: from rickets prophylaxis to general preventive healthcare. Dermatoendocrinol. 2013;5(3):331–347. doi:10.4161/derm.26738
24. Nutrition surveys and calculation [computer program]. Gross, Dr. Rainer; 2010.
25. Ri PMK. Angka Kecukupan Gizi Bagi Bangsa Indonesia. Indonesia KKR eds. Vol. 28. Tahun 2019. Jakarta:Kementerian Kesehatan RI; 2019:33
26. Heaney RP, Holick MF. Why the IOM recommendations for vitamin D are deficient. J Bone Miner Res. 2011;26(3):455–457. doi:10.1002/jbmr.328
27. Grant WB, Holick MF. Benefits and requirements of vitamin D for optimal health: a review. Altern Med Rev. 2005;10(2):94–111.
28. Harinarayan CV, Holick MF, Prasad UV, Vani PS, Himabindu G. Vitamin D status and sun exposure in India. Dermatoendocrinol. 2013;5(1):130–141. doi:10.4161/derm.23873
29. Ganmaa D, Stuart JJ, Sumberzul N, et al. Vitamin D supplementation and growth in urban Mongol school children: results from two randomized clinical trials. PLoS One. 2017;12(5):e0175237. doi:10.1371/journal.pone.0175237
30. Cannell JJ, Grant WB, Holick MF. Vitamin D and inflammation. Dermatoendocrinol. 2014;6(1):e983401. doi:10.4161/19381980.2014.983401
31. Holick MF. Sunlight and vitamin D: both good for cardiovascular health. J Gen Intern Med. 2002;17(9):733–735. doi:10.1046/j.1525-1497.2002.20731.x
32. Holick MF. Vitamin D deficiency: what a pain it is. Mayo Clin Proc. 2003;78(12):1457–1459. doi:10.4065/78.12.1457
33. Holick MF. Evolution and function of vitamin D. Recent Results Cancer Res. 2003;164:3–28.
34. Holick MF. Vitamin D: a millenium perspective. J Cell Biochem. 2003;88(2):296–307. doi:10.1002/jcb.10338
35. Al-Sumaih I, Johnston B, Donnelly M, O’Neill C. The relationship between obesity, diabetes, hypertension and vitamin D deficiency among Saudi Arabians aged 15 and over: results from the Saudi health interview survey. BMC Endocr Disord. 2020;20(1):81. doi:10.1186/s12902-020-00562-z
36. Alloubani A, Akhu-Zaheya L, Samara R, Abdulhafiz I, Saleh A, Altowijri A. Relationship between Vitamin D deficiency, diabetes, and obesity. Diabetes Metab Syndr. 2019;13(2):1457–1461. doi:10.1016/j.dsx.2019.02.021
37. Pereira-Santos M, Costa PR, Assis AM, Santos CA, Santos DB. Obesity and vitamin D deficiency: a systematic review and meta-analysis. Obes Rev. 2015;16(4):341–349. doi:10.1111/obr.12239
38. Pereira-Santos M, Costa PR, Santos CA, Santos DB, Assis AM. Obesity and vitamin D deficiency: is there an association?. Obes Rev. 2016;17(5):484. doi:10.1111/obr.12393
39. Peterson CA, Belenchia AM. Vitamin D deficiency & childhood obesity: a tale of two epidemics. Mo Med. 2014;111(1):49–53.
40. Almesri N, Das NS, Ali ME, Gumaa K, Giha HA. Gender-dependent association of vitamin d deficiency with obesity and hypercholesterolemia (LDLC) in adults. Endocr Metab Immune Disord Drug Targets. 2020;20(3):425–436. doi:10.2174/1871530319666191009154528
41. Grineva EN, Karonova T, Micheeva E, Belyaeva O, Nikitina IL. Vitamin D deficiency is a risk factor for obesity and diabetes type 2 in women at late reproductive age. Aging. 2013;5(7):575–581. doi:10.18632/aging.100582
42. Fiamenghi VI, Mello ED. Vitamin D deficiency in children and adolescents with obesity: a meta-analysis. J Pediatr (Rio J). 2020. doi:10.1016/j.jped.2020.08.006
43. Foss YJ. Vitamin D deficiency is the cause of common obesity. Med Hypotheses. 2009;72(3):314–321. doi:10.1016/j.mehy.2008.10.005
44. Furtado MM. Comment on: severe obesity and vitamin D deficiency treatment options before the bariatric surgery: a randomized clinical trial. Surg Obes Relat Dis. 2020;16(8):e45–e46. doi:10.1016/j.soard.2020.04.004
45. Rahmadhani R, Zaharan NL, Mohamed Z, Moy FM, Jalaludin MY. The associations between VDR BsmI polymorphisms and risk of vitamin D deficiency, obesity and insulin resistance in adolescents residing in a tropical country. PLoS One. 2017;12(6):e0178695. doi:10.1371/journal.pone.0178695
46. Walker GE, Ricotti R, Roccio M, et al. Pediatric obesity and vitamin D deficiency: a proteomic approach identifies multimeric adiponectin as a key link between these conditions. PLoS One. 2014;9(1):e83685. doi:10.1371/journal.pone.0083685
47. Vranic L, Mikolasevic I, Milic S. Vitamin D deficiency: consequence or cause of obesity?. Medicina. 2019;55(9). doi:10.3390/medicina55090541
48. Wakayo T, Whiting SJ, Belachew T. Vitamin D deficiency is associated with overweight and/or obesity among schoolchildren in central ethiopia: a cross-sectional study. Nutrients. 2016;8(4):190. doi:10.3390/nu8040190
49. Grant WB. Overweight/obesity and vitamin D deficiency contribute to the global burden of low back pain. Ann Rheum Dis. 2014;73(8):e48. doi:10.1136/annrheumdis-2014-205632
50. Tamer G, Mesci B, Tamer I, Kilic D, Arik S. Is vitamin D deficiency an independent risk factor for obesity and abdominal obesity in women?. Endokrynol Pol. 2012;63(3):196–201.
51. Cocate PG, Kac G, Heitmann BL, et al. Calcium and vitamin D supplementation and/or periodontal therapy in the treatment of periodontitis among Brazilian pregnant women: protocol of a feasibility randomised controlled trial (the IMPROVE trial). Pilot Feasibility Stud. 2019;5:38. doi:10.1186/s40814-019-0417-6
52. Cunha Figueiredo AC, Trujillo J, Freitas-Vilela AA, et al. Association between plasma concentrations of vitamin D metabolites and depressive symptoms throughout pregnancy in a prospective cohort of Brazilian women. J Psychiatr Res. 2017;95:1–8. doi:10.1016/j.jpsychires.2017.07.009
53. Balcells ME, Garcia P, Tiznado C, et al. Association of vitamin D deficiency, season of the year, and latent tuberculosis infection among household contacts. PLoS One. 2017;12(4):e0175400. doi:10.1371/journal.pone.0175400
54. Sari DK, Tala ZZ, Lestari S, Hutagalung SV, Ganie RA. Lifestyle differences in rural and urban areas affected the level of Vitamin D in women with single nucleotide polymorphism in north sumatera. Asian J Clin Nutr. 2017;9:57–63. doi:10.3923/ajcn.2017.57.63
 © 2021 The Author(s). This work is published and licensed by Dove Medical Press Limited. The
full terms of this license are available at https://www.dovepress.com/terms.php
and incorporate the Creative Commons Attribution
- Non Commercial (unported, v3.0) License.
By accessing the work you hereby accept the Terms. Non-commercial uses of the work are permitted
without any further permission from Dove Medical Press Limited, provided the work is properly
attributed. For permission for commercial use of this work, please see paragraphs 4.2 and 5 of our Terms.
© 2021 The Author(s). This work is published and licensed by Dove Medical Press Limited. The
full terms of this license are available at https://www.dovepress.com/terms.php
and incorporate the Creative Commons Attribution
- Non Commercial (unported, v3.0) License.
By accessing the work you hereby accept the Terms. Non-commercial uses of the work are permitted
without any further permission from Dove Medical Press Limited, provided the work is properly
attributed. For permission for commercial use of this work, please see paragraphs 4.2 and 5 of our Terms.