Back to Journals » Journal of Pain Research » Volume 18
The Minimum Clinically Important Difference of the Brief Pain Inventory During the Perioperative Period of Unicompartmental Knee Arthroplasty: A Prospective Observational Study
Authors Tang R, Wan D, Wang Q, Ye J, Tan Y, Yao S, Ma J, Xu C
Received 18 September 2025
Accepted for publication 18 December 2025
Published 25 December 2025 Volume 2025:18 Pages 7127—7138
DOI https://doi.org/10.2147/JPR.S563987
Checked for plagiarism Yes
Review by Single anonymous peer review
Peer reviewer comments 3
Editor who approved publication: Dr Alaa Abd-Elsayed
Rui Tang,1,2,* Dongping Wan,3,* Qingzhen Wang,4,5,* Jiahui Ye,3 Yanchen Tan,6 Shuxin Yao,1 Jianbing Ma,1 Chao Xu1
1Department of Knee Joint Surgery, Honghui Hospital, Xi’an Jiaotong University, Xi’an, Shaanxi, People’s Republic of China; 2The Clinical Medical College, Chengdu University of Traditional Chinese Medicine, Chengdu, Sichuan, People’s Republic of China; 3The First Clinical Medical College, Guangxi University of Chinese Medicine, Nanning, Guangxi Zhuang Autonomous Region, People’s Republic of China; 4School of Basic Medicine, Dali University, Dali, Yunnan, People’s Republic of China; 5School of Basic Medicine, Air Force Medical University, Xi’an, Shaanxi, People’s Republic of China; 6Student Brigade of Basic Medical College, Air Force Military Medical University, Xi’an, Shaanxi, People’s Republic of China
*These authors contributed equally to this work
Correspondence: Chao Xu, Department of Knee Joint Surgery, Honghui Hospital, Xi’an Jiaotong University, Xi’an, Shaanxi, People’s Republic of China, Email [email protected]
Purpose: To define the Minimal Clinically Important Difference (MCID) for the Brief Pain Inventory (BPI) during the perioperative period of Unicompartmental Knee Arthroplasty (UKA).
Methods: A total of 394 UKA patients were recruited from January 2022 to October 2024, following the inclusion and exclusion criteria. During hospitalization, each patient completed the Likert scale and BPI scale to record pain and functional changes pre- and postoperatively during the perioperative period. Based on the Likert scale responses, patients were divided into the “Improvement Group” and “Non-Improvement Group”. The MCID of the BPI scale in UKA patients during the perioperative period was analyzed and calculated using three methods: the anchor-based method, the distribution-based method, and ROC curve analysis. The ROC curve method determined the cut-off value for MCID based on the area under the curve (AUC) and the optimal Youden index.
Results: Based on the Likert scale responses, 154 patients were classified into the “Improvement Group” and 79 patients into the “Non-Improvement Group”. The MCID values of the BPI scale calculated by the three methods were as follows: for BPI-PI, the MCID values were 1.66 (anchor-based method), 1.02 (distribution-based method), and 1.63 (ROC curve analysis, AUC = 0.907, P < 0.001); for BPI-GII, the MCID values were 2.02 (anchor-based method), 1.04 (distribution-based method), and 1.90 (ROC curve analysis, AUC = 0.934, P < 0.001).
Conclusion: Given the potential discrepancies in MCID values calculated by different methods, the values derived from the anchor-based method and ROC curve analysis were closer to each other and demonstrated higher reliability compared to those obtained using the distribution-based method. Furthermore, this study provides valuable reference data for assessing perioperative pain in UKA patients, which can assist in optimizing pain management strategies and improving postoperative recovery experiences.
Keywords: minimal clinically important difference, brief pain inventory, unicompartmental knee arthroplasty, perioperative period
Introduction
Unicompartmental knee arthroplasty (UKA) has become a key component in the stepwise treatment of knee osteoarthritis and is now the preferred surgical option for treating unicompartmental joint disease.1 While UKA offers advantages such as minimal invasiveness and rapid recovery, many patients still experience acute postoperative pain, which significantly hinders early knee flexion exercises and the assessment of prosthesis fitting.2 The growing adoption of Enhanced Recovery after Surgery (ERAS) principles has demonstrated that multimodal analgesia strategies can significantly improve postoperative pain management in UKA. Effective pain management not only reduces the use of Nonsteroidal Anti-inflammatory Drugs (NSAIDs) and lowers the risk of gastrointestinal complications, but also enhances the likelihood of achieving a straight leg raise within 6 hours post-surgery, accelerates the time to the first mobilization, and supports the achievement of ERAS goals.3 Therefore, in the perioperative management of UKA, a dynamic pain trajectory monitoring system plays a critical evidence-based role in the development of personalized analgesia plans.
Pain is a complex and multifaceted experience, and its quantification must be done indirectly. The International Association for the Study of Pain (IASP) defines pain as: “An unpleasant sensory and emotional experience associated with or resembling that associated with actual or potential tissue damage”4 This concept is based on a biopsychosocial framework, which emphasizes the need for healthcare professionals to apply this model in the recognition and treatment of pain in musculoskeletal disorders. Numerous Patient-Reported Outcome Measures (PROMs) have been developed to assess pain and to capture changes in patients’ pain perception in real-time, providing valuable decision support for optimizing pain management. Examples include the Visual Analog Scale (VAS), Numeric Rating Scale (NRS), and Verbal Rating Scale (VRS).5 However, traditional pain scales are typically unidimensional in nature. While many pain studies utilize the VAS, which often ranges from 0 to 100 mm, the BPI employs a validated 11-point NRS ranging from 0 to 10 for both intensity and interference. Initiative on Methods, Measurement, and Pain Assessment in Clinical Trials (IMMPACT) recommends using average pain and worst pain to describe pain severity, which helps assess pain in clinical trials. The Brief Pain Inventory (BPI) is a multidimensional scale used to assess pain intensity, including the most severe, least severe, average, and current pain levels.6
The BPI is a commonly employed tool in clinical and epidemiological research, primarily used for assessing both acute and chronic pain.7 This multidimensional scale measures not only the location, intensity, and treatment effects of pain but also evaluates how pain interferes with the patient’s daily functioning. The BPI provides two primary scores: the BPI Pain Intensity (BPI-PI), which is an average of the four intensity items, and the BPI General Interference Items (BPI-GII), which measures how pain impacts daily activities, mood, and quality of life. Originally developed in English, the BPI has since been translated and validated into Italian, Japanese, Greek, Spanish, Chinese, Russian, Portuguese, and Amharic (Ethiopia), demonstrating strong psychometric properties.6,8–14
In clinical research, efficacy is often determined by statistical significance, but statistical significance does not necessarily equate to clinical relevance. The minimum clinically important difference (MCID) of a scale, however, provides a more accurate reflection of clinical outcomes.15,16 Previous BPI MCID studies have shown that for fibromyalgia patients, the MCID for average pain and pain severity scores in the BPI are 2.1 and 2.2, respectively.17 In evaluating pain and facial function in fibromyalgia patients, the MCID for worst pain intensity and average pain in trigeminal neuralgia (TN) patients improved by 57% and 28%, respectively, with the MCID for daily function improving by 75%. These findings offer meaningful guidance for assessing and designing interventions in the field of trigeminal neuralgia.18 To our knowledge, previous studies have reported the MCID of the VAS during the perioperative period of total knee arthroplasty (TKA). In addition, our group has investigated the MCID of the BPI in TKA patients and established reference values for long-term postoperative outcomes. However, no study has yet explored the MCID of the BPI during the perioperative period of UKA.19,20 This gap is particularly important because the absence of clear quantitative benchmarks in perioperative pain management for UKA patients often leads to ambiguous assessments of treatment effectiveness. Research suggests that using the MCID standard to evaluate pain intervention outcomes improves the accuracy of pain management goal setting, thereby enhancing clinical results.21 Therefore, this study aims to establish the MCID value for the BPI scale in the perioperative period of UKA, enabling healthcare professionals to more accurately assess postoperative pain management outcomes, ultimately improving perioperative care for patients. If a patient’s BPI score change reaches or exceeds the MCID, it indicates sufficient pain improvement, justifying the continuation or adjustment of the current treatment plan to ensure an enhanced quality of life for the patient.
Materials and Methods
Patients
After receiving approval from the Ethics Committee of our hospital (Ethics No. 202201005), this study was conducted as a prospective cohort study in the Department of Orthopedics at Honghui Hospital, Xi’an, Shaanxi, China, from January 2022 to October 2024, with all participants providing written informed consent. The inclusion criteria were:22,23 a) clinically diagnosed primary unilateral knee osteoarthritis (KOA), confirmed by imaging (Kellgren-Lawrence grade ≥2); b) undergoing primary unilateral UKA surgery without cognitive impairment; c) preoperative American Society of Anesthesiologists (ASA) classification of 1–3, with the surgeon assessing the patient as eligible for UKA based on evaluation criteria; d) participants aged 18 years or older, regardless of sex; e) capable of providing informed consent and signing a written informed consent form, with the ability to understand the study requirements and willingness to comply with the research instructions. Exclusion criteria included: a) patients diagnosed with conditions other than osteoarthritis (eg, rheumatoid arthritis, traumatic arthritis, purulent arthritis, hemophilic arthritis); b) patients who have previously undergone contralateral knee arthroplasty; c) patients requiring revision arthroplasty; d) patients with prosthetic joint infection during hospitalization; e) patients allergic to the study medications; f) patients dependent on anesthetic drugs (defined as using more than 100 milligrams of morphine equivalent per week or local anesthetics to control preoperative pain for more than three months); g) patients participating in other clinical trials outside this study. The sample size was determined according to the Consensus-Based Standards for the Selection of Health Measurement Instruments (COSMIN),24 with a recommended minimum sample size of 100 participants, deemed sufficient to meet the study requirements. We excluded 38 patients because their scores on the Pain Catastrophizing Scale (PCS) exceeded 30.
In this study, all surgeries were performed by the same surgical team under general anesthesia, following a standardized multimodal perioperative pain management protocol. The analgesic regimen included preoperative administration of 200 mg celecoxib 2 hours before surgery, followed by a repetition of this dose every 12 hours for the first 3 postoperative days, in combination with 37.5 mg tramadol and 650 mg acetaminophen. Afterward, patients continued the regimen of celecoxib and acetaminophen every 12 hours for a duration of 14 days. Intraoperatively, patients received a “cocktail” injection containing 100 mg ropivacaine, 14 mg betamethasone, 10 mg morphine, and 60 mL of 0.9% sodium chloride solution for local analgesia. Postoperatively, patients wore a Patient-Controlled Analgesia (PCA) pump (sufentanil 0.2 μg/kg + dezocine 0.3 mg/kg) and received antibiotic and thromboprophylaxis treatment, along with compression stockings to prevent lower limb deep vein thrombosis. On postoperative day 1, patients were encouraged to use a walker for ambulation and to perform range-of-motion exercises in bed. On day 3, patients were allowed to engage in active movement and full weight-bearing under the guidance of a therapist.
Clinical Evaluation
During their hospitalization, patients were followed up and evaluated using a standardized procedure for PROMs. Data points were assessed and recorded in a stable condition. The participants first responded to the questions on the BPI scale. Subsequently, participants used a Likert scale to compare their current pain level with their previous pain level, with five response options (1 = Much improved, 2 = Slightly improved, 3 = No change, 4 = Slightly worse, 5 = Much worse), without knowledge of their previous responses. During their hospital stay, each patient’s pain level was recorded twice: once preoperatively and again on the third postoperative day. The assessments were performed by two independent, experienced surgeons who were not involved in the surgical procedure.
Defining and Calculating the MCID
In this study, we employed three methods to determine the MCID of acute postoperative pain, as measured by the BPI scale, during the perioperative period of UKA:
The first method is based on the anchoring method. “Anchoring” refers to the level of improvement determined by the patient’s subjective assessment of postoperative pain changes.25 Scores were categorized as binary outcomes (1 or 2 points indicating “improvement” and 3, 4, or 5 points indicating “no improvement”). Patients who rated 1 or 5 on the Likert-type scale were excluded, as such extreme responses could significantly affect the results.26 If a patient reported a Likert score of 2, it was defined as a clinically significant pain change and included in the improvement group; scores of 3 or 4 were classified into the no improvement group. We calculated the mean difference in BPI scores before and after surgery, and the average difference between the two groups was taken as the MCID.27
The second method estimates the MCID using the distribution-based method, Distribution-based MCID estimation typically relies on the statistical standardized effect size, with the primary aim of quantifying the magnitude of change that patients perceive as important on a specific scale.28 According to established MCID calculation standards, it is a widely accepted and reasonable practice to determine the MCID by multiplying the standard deviation (SD) of the average BPI score change before and after UKA surgery by 0.5.29,30
The third method utilizes the Receiver Operating Characteristic (ROC) curve,31 which is a statistical tool used to determine the optimal threshold for distinguishing between different patient groups. In the BPI score analysis, the ROC curve helped identify a cutoff point that maximized the model’s specificity and sensitivity, effectively distinguishing between the improvement and non-improvement groups.32 The Area Under the ROC Curve (AUC) is an important metric for assessing the accuracy of a classification model, as it reflects the model’s overall performance at various thresholds, with values ranging from 0.5 to 1.33 It is commonly accepted that when AUC is between 0.5 and 0.7, the accuracy is low,34 between 0.7 and 0.9, accuracy is moderate,35 and when AUC ≥ 0.9, the model exhibits high discriminative accuracy.36 The optimal cutoff of the ROC curve is determined by the optimal Youden index37 and a minimum equal specificity/sensitivity of 0.65.38
Instrument
BPI-Pain Intensity (BPI-I)
The four items used to assess pain intensity are: 1) the most intense pain, 2) the mildest pain, 3) the average pain, and 4) the current pain. These items are assessed using the NRS’s 11-point Likert scale, with scores ranging from 0 (“no pain”) to 10 (“unbearable pain”).
BPI-General Interference Items (BPI-GII)
The seven items used to assess pain interference are: 5) daily activities, 6) mood, 7) walking ability, 8) normal work (including external work and housework), 9) relationships with others, 10) sleep, and 11) enjoyment of life. These items are measured using an 11-point Likert scale, with scores ranging from 0 (“no interference”) to 10 (“complete interference”). Items 5 and 8 were excluded, as during the perioperative period, patients were unable to perform most daily activities and routine tasks. Therefore, a composite general interference score was calculated based on the scores from the remaining five items on the scale.39
Statistical Analysis
All statistical analyses were conducted using SPSS 27.0 for Windows (IBM Corp, Armonk, NY), with the Kolmogorov–Smirnov test used to assess normality. Descriptive statistics were used to evaluate and summarize the demographic and clinical characteristics of the participants. Continuous variables with normal distribution are presented as mean ± standard deviation, those with non-normal distribution as median (interquartile range), and categorical variables as frequency (percentage). Multivariate logistic regression analysis was performed to explore the impact of patient-related factors on the MCID, with a P-value of <0.05 considered statistically significant.
Result
Demographic Characteristics
In this study, a total of 394 patients met the inclusion criteria. The baseline characteristics of the patients are shown in Table 1. Of these, 106 were male (26.9%) and 288 were female (73.1%). The mean age of the patients was 67.47 years (SD 7.91), and the average Body Mass Index (BMI) was 25.79 (SD 1.98) kg/m2. The majority of surgeries were performed on the left knee (218 cases, 55.3%), while 176 cases (44.7%) involved the right knee. According to the ASA classification, there were 50 patients (12.7%) in class 1, 298 patients (75.6%) in class 2, and 46 patients (11.7%) in class 3. The average length of hospital stay was 4.00 days (SD 1.05), and the average duration of illness was 4.11 years (SD 2.83). Regarding pain intensity, the preoperative BPI score was 5.19 (SD 1.04), which decreased to 2.91 postoperatively (SD 1.48, P < 0.001), showing significant improvement. Similarly, the preoperative BPI-General Interference Items (BPI-GII) score was 6.81 (SD 1.00), which improved to 4.05 postoperatively (SD 1.70, P < 0.001).
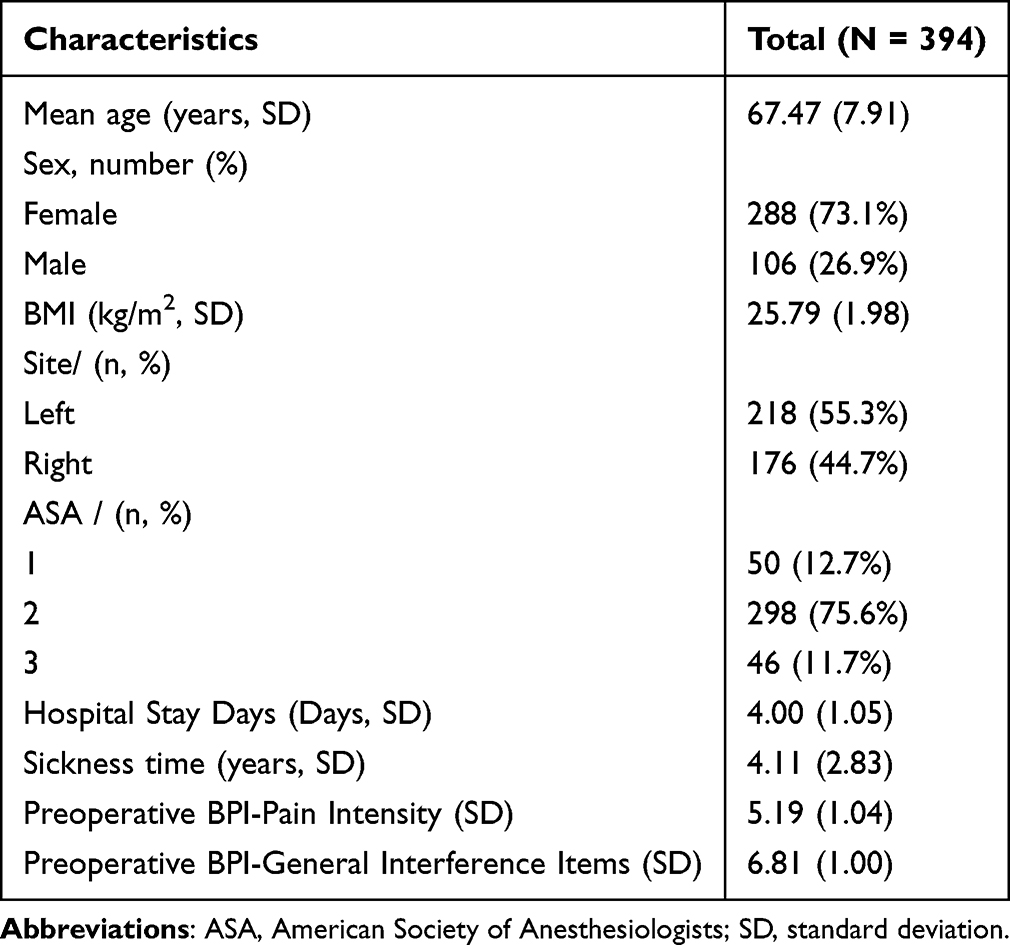 |
Table 1 Demographic Information of Participants |
Patient Grouping and Changes in Pain Scores
Among the 394 patients, 147 (37.3%) responded “very good” and 14 (3.6%) responded “very poor” on the Likert scale, leading to their exclusion. Therefore, the remaining 233 patients were assigned to the “improvement group” (154 patients) and the “non-improvement group” (79 patients), with the changes in BPI-PI and BPI-GII scores for both groups shown in Table 2. No significant differences were observed between the two groups in preoperative baseline BPI-PI (improvement group 4.87±0.65 vs non-improvement group 4.76±0.79, P = 0.365) and BPI-GII (improvement group 6.66±0.80 vs non-improvement group 6.51±0.94, P = 0.251). Regarding BPI-PI, the postoperative score for the “improvement group” was 2.95±0.64, significantly better than the “non-improvement group” at 4.49±1.12 (P < 0.001). The average change in the “improvement group” was 1.92±0.72, compared to 0.26±1.08 in the “non-improvement group”. Thus, there was a significant difference in the average change in BPI-PI, with the “improvement group” showing a clear advantage over the “non-improvement group” (P < 0.001). In terms of BPI-GII, the postoperative score for the “improvement group” was 4.10±0.75, significantly better than the “non-improvement group” at 5.97±1.23 (P < 0.001). The average change in the “improvement group” was 2.56±0.77, while the average change in the “non-improvement group” was 0.54±1.07, with a significant difference between the two groups (P < 0.001).
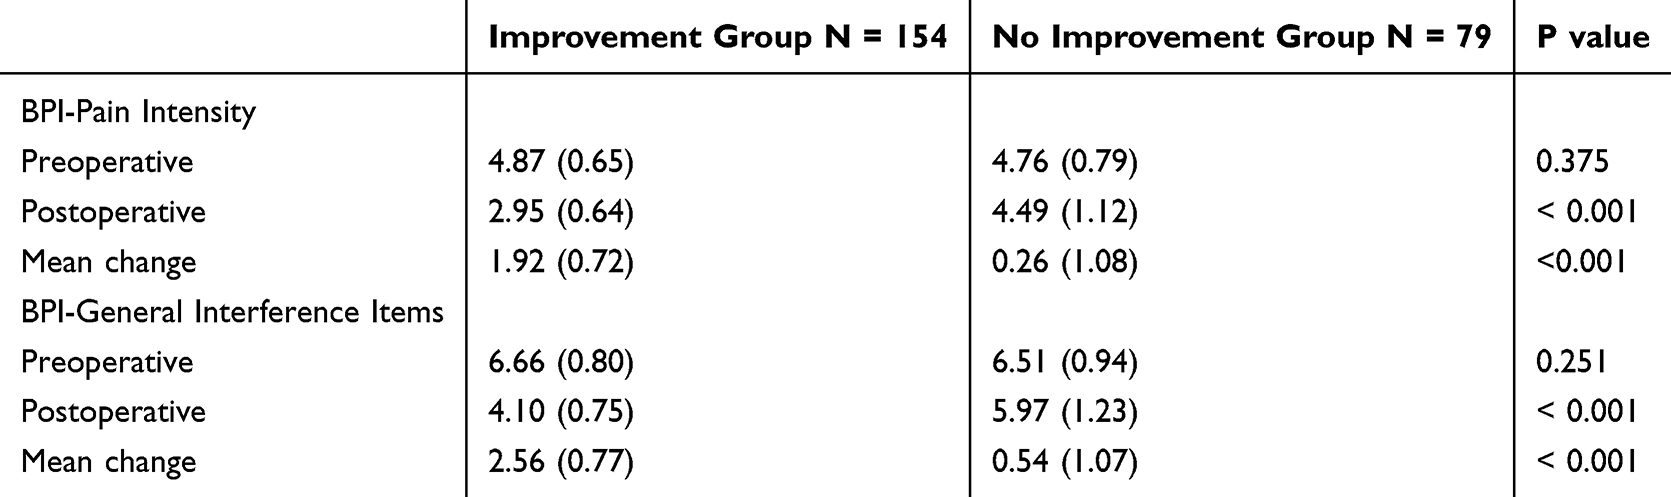 |
Table 2 Changes From Preoperative to Postoperative Follow-up in the BPI |
Analysis of Independent Factors Differences
Table 3 shows the differences in independent factors, such as demographic characteristics, between the two groups. Specifically, the BMI of the “non-improvement group” (26.15±2.17) was higher than that of the “improvement group” (25.59±1.86), with statistical significance (P = 0.043). The average length of stay in the “non-improvement group” was 5.47±1.20, significantly higher than that in the “improvement group” at 3.97±1.07, with a clear statistical significance (P < 0.001). Additionally, the two groups differed significantly in disease duration. The “non-improvement group” had an average disease duration of 4.66±3.83 years, which was significantly longer than the “improvement group” at 3.78±1.86 years (P = 0.026). However, there were no significant differences between the two groups in terms of age (“improvement group” 65.57±7.79 years, “non-improvement group” 67.22±8.10 years), gender (“improvement group” 72.7% female, “non-improvement group” 70.9% female), and disease location (“improvement group” left knee 57.1%, “non-improvement group” left knee 54.4%).
 |
Table 3 Independent Predictors of Change in BPI |
The Value of MCID
Figure 1 and Table 4 illustrate the results of the ROC curve analysis. The AUC values for BPI-PI and BPI-GII were 0.907 and 0.934, respectively, with P < 0.001, demonstrating excellent discriminatory power of the model. The Cut-off values were determined based on the Youden index and a minimum specificity/sensitivity of 0.65. The Cut-off value for BPI-PI was 1.63, and for BPI-GII, it was 1.90. Ultimately, we calculated and analyzed the MCID of the BPI scale during the acute postoperative pain phase following UKA using three methods. The first method, based on the anchor-based approach, calculated the mean difference in preoperative and postoperative BPI scores between the two groups, using this difference as the MCID. Therefore, the MCID for BPI-PI was 1.66, and for BPI-GII, it was 2.02. The second method, the distribution-based approach, determined the MCID by multiplying the Standard Deviation (SD) of the average BPI score change between the preoperative and postoperative time points by 0.5. Therefore, the MCID for BPI-PI was 1.02, and for BPI-GII, it was 1.04. The third method, based on ROC analysis, determined the MCID using the Cut-off values, with the MCID for BPI-PI being 1.63, and for BPI-GII, it was 1.90.
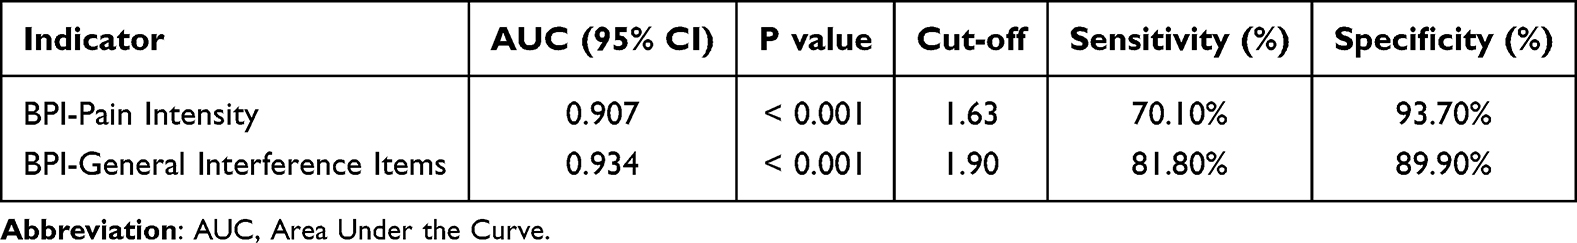 |
Table 4 AUC and Sensitivity-Specificity Analysis of BPI |
 |
Figure 1 Area under ROC curve for MCID. |
Discussion
UKA has become widely used in recent years as an effective treatment for severe KOA. Nevertheless, the success of the procedure is not solely determined by the surgical success rate but also by the effectiveness of postoperative pain management and functional rehabilitation of the patients.40,41
MCID refers to small but clinically meaningful changes in PROMs, which are crucial for studying the impact of such changes on postoperative pain and function in the UKA population. In simple terms, a statistically significant difference between PROMs results does not necessarily imply a change that is both important and clinically meaningful.26 Furthermore, in recent years, research on postoperative pain management after UKA has increasingly focused on the MCID during the acute pain phase.19 Acute pain is one of the most common complications after UKA and substantially affects patients’ recovery process and quality of life. Research has shown that adequate pain management not only improves postoperative patient satisfaction but also facilitates functional rehabilitation.42 Therefore, determining the MCID for acute postoperative pain after UKA is essential for evaluating the effectiveness of pain management interventions.
In this study, the BPI scale was compared with the five-point Likert scale, anchoring the clinically meaningful changes with BPI-PI and BPI-GII, and three methods were used to calculate the MCID for perioperative BPI scores in UKA. We found that the MCID values calculated by the anchor method (BPI-PI, MCID 1.66; BPI-GII, MCID 2.02) and the ROC curve analysis method (BPI-PI, MCID 1.63; BPI-GII, MCID 1.90) were closely aligned, with the anchor method yielding slightly higher MCID values for both BPI-PI and BPI-GII compared to the ROC curve. However, the MCID calculated by the distribution-based method (BPI-PI, MCID 1.02; BPI-GII, MCID 1.04) showed significant discrepancies and was lower than the values obtained from the first two methods. Furthermore, the lack of consensus on methods for estimating MCID has led to varying MCID values and different interpretations of these values.43 Therefore, by comparing the three methods, we concluded that the MCID values calculated using the anchor method reflect the patients’ self-reported changes based on their subjective perceptions of knee pain and functional changes at both pre- and postoperative time points in UKA.25 Additionally, in other PROMs’ MCID calculations, the anchor method is the most commonly chosen approach in many studies,30 with the most common anchors being non-clinical, assessing patients’ perceptions of their current health status over time from the patients’ perspective.44 The ROC analysis method utilizes the ROC curve to define the MCID, which, compared to traditional methods, visualizes sensitivity and specificity while providing better stability. Numerous studies have combined the anchor and ROC methods to calculate the MCID, aiming to achieve a more accurate result.45–47 In this study, the MCID values calculated by the ROC method and anchor method were similar, allowing them to be referenced interchangeably. However, the MCID calculated by the distribution method is obtained by multiplying the SD of the average BPI score change at two time points (pre- and post-UKA) by 0.5. A limitation of this method is that it relies purely on statistical calculation and does not account for the patients’ subjective experiences. Revicki et al48 recommend using the anchor-based method to provide primary evidence for the MCID of any tool, while the distribution-based method serves as secondary or supportive evidence. Therefore, we believe the MCID values calculated using the anchor and ROC analysis methods in this study are more reliable, with the distribution-based method’s MCID serving as a reference.
Although research on the MCID of PROMs for knee joint, including Western Ontario and McMaster Universities Osteoarthritis Index (WOMAC),49,50 Oxford Knee Score (OKS),51 Knee Society Score (KSS),26 Short Form 12 Health Survey (SF-12),52 Short Form 16 Health Survey (SF-16),53 has been conducted, the results may still vary due to differences in analysis methods, study populations, baseline conditions, and follow-up durations. To our knowledge, few studies have focused on the MCID of PROMs during the perioperative period of UKA so far. Jonathan et al19 calculated the MCID of the VAS score during the perioperative period of TKA using the anchor method, which was 22.6 with a change of 22.6%, higher than our BPI-PI MCID of 1.66 with a change of 16.6%. However, the VAS-P score is unidimensional, considering only perioperative pain factors and not assessing postoperative knee function. Furthermore, while some studies have focused on the MCID of knee function after TKA, most research has been conducted one to two years post-TKA and has not addressed the MCID during the perioperative period of UKA.26,54,55 Extensive research has demonstrated that early attention to knee joint function after UKA is crucial for pain management, functional recovery, rehabilitation, improving quality of life, and reducing complications in patients.56–58 Therefore, this study uses the BPI scale to assess the MCID during the UKA perioperative period, focusing both on pain and knee function.
By analyzing the differences in independent demographic factors between the two groups, we found that the BMI of the “non-improvement group” (26.15±2.17) was significantly higher than that of the “improvement group” (25.59±1.86) (P = 0.043). Previous studies have shown that increased BMI is positively correlated with the incidence of UKA, as obesity increases joint load, accelerates cartilage wear, and leads to more severe osteoarthritis.59,60 Moreover, several studies have indicated that a high BMI exacerbates postoperative pain, thus affecting recovery speed and quality of life, which aligns with previous research findings.61,62 The average length of hospital stay in the “non-improvement group” was significantly longer than in the “improvement group”. We found that most individuals in the “non-improvement group” required longer medication support and guidance on functional exercises, leading to an extended hospital stay. There was a notable difference between the two groups in disease duration, with the “non-improvement group” having a longer disease history than the “improvement group”. Studies have shown that patients undergoing UKA often have a history of long-term joint disease, and those with a longer disease duration are more likely to experience substantial damage to joint function and structure. Long-term osteoarthritis-related changes, such as cartilage degeneration, bone spur formation, and joint space narrowing, can slow the postoperative recovery process.63 Furthermore, a patient’s psychological state is often influenced by the length of the disease. Patients with prolonged pain and functional limitations frequently experience mental health issues, such as anxiety and depression, which can affect their motivation and cooperation in postoperative rehabilitation.64 However, there were no significant differences between the two groups regarding age, gender, or affected limb after UKA surgery, and these differences were not statistically significant.
This study has limitations in calculating the MCID for BPI during the acute postoperative pain phase of UKA, which should be clarified. First, all participants were from the same hospital and primarily represent patients from the northwest region of China. The homogeneous study population and potential differences in postoperative expectations across ethnic groups may limit the generalizability of the results. Furthermore, MCID is a critical concept in contemporary medical research and clinical practice, used to evaluate the clinical significance of treatment effects. However, determining MCID poses challenges and uncertainties due to the lack of a unified calculation method and consensus. Various studies may use different approaches to estimate MCID, such as distribution methods, anchor methods, and clinical judgment. The choice and application of these methods may result in variations in MCID estimates, affecting the interpretation and evaluation of treatment outcomes. Therefore, when interpreting MCID results, caution is necessary, and we must be aware that differences in calculation methods may introduce errors. These errors may influence clinical decisions, patient counseling, and the design and interpretation of future studies. To improve the accuracy and reliability of MCID estimation, further research is needed to establish best practices and reach a broader consensus in this field.
Conclusion
This study calculates the MCID of BPI during the perioperative period of UKA patients using three methods. The MCID values calculated by the anchor method were BPI-PI 1.66 and BPI-GII 2.02, by the distribution method were BPI-PI 1.02 and BPI-GII 1.04, and by ROC curve analysis were BPI-PI 1.63 and BPI-GII 1.90. Therefore, this study provides important reference data for pain assessment during the perioperative period of UKA, helping to optimize pain management strategies and enhance postoperative recovery experiences. We believe that future research should focus on further optimizing pain assessment tools and developing individualized pain management plans to improve the success rate of UKA surgery and patient satisfaction.
Abbreviations
UKA, Unicompartmental Knee Arthroplasty; MCID, Minimal Clinically Important Difference; BPI, Brief Pain Inventory; ERAS, Enhanced Recovery after Surgery; TKA, Knee Arthroplasty; PROMs, Patient-Reported Outcome Measures; VAS, Visual Analog Scale; KOA, Knee Osteoarthritis; ASA, American Society of Anesthesiologists; BPI-PI, BPI-Pain Intensity; BPI-GII, BPI-General Interference Items; AUC, Area Under the Curve; ROC, Receiver Operating Characteristic; SD, Standard Deviation; BMI, Body Mass Index.
Data Sharing Statement
The data supporting the results and analyses in this paper are available upon reasonable request from the corresponding author.
Ethics Approval and Consent to Participate
This study adheres to the guidelines of the Helsinki Declaration and has received ethical approval from the Medical Ethics Committee at Honghui Hospital, Xi’an Jiaotong University (approval number: 202201005). In addition, all participants have given their written informed consent.
Acknowledgments
Rui Tang, Dongping Wan and Qingzhen Wang are co-first authors for this study. We sincerely thank all the volunteers for their invaluable contributions to our study.
Author Contributions
All authors made a significant contribution to the work reported, whether that is in the conception, study design, execution, acquisition of data, analysis and interpretation, or in all these areas; took part in drafting, revising or critically reviewing the article; gave final approval of the version to be published; have agreed on the journal to which the article has been submitted; and agree to be accountable for all aspects of the work.
Funding
CX has received funding from Key Research and Development Program of Shaanxi Province (2023-YBSF-464), Cultivation Project for General Project of Xi’an Health Commission (2024ms10) and 2024 ministry of Education Humanities and Social Sciences Project (24YJAZH032). JBM has received funding from the Program for Innovation Team of Shaanxi Province (2023-CX-TD-73).
Disclosure
The authors declare that there are no conflicts of interest related to their contributions to this study.
References
1. Rodríguez-Merchán EC, Gómez-Cardero P. Unicompartmental knee arthroplasty: current indications, technical issues and results. EFORT Open Rev. 2018;3(6):363–373. doi:10.1302/2058-5241.3.170048
2. Zhu Y, Shen S, Cui L, Wu L, Zhang B. Magnesium sulphate and sodium bicarbonate as additives for periarticular local infiltration analgesia improve pain management after unicompartmental knee arthroplasty: a prospective, double-blind, randomized controlled trial. J Orthop Surg Res. 2024;19(1):764. doi:10.1186/s13018-024-05233-6
3. Li J, Zhao F, Gao J, et al. Enhanced recovery after surgery (ERAS) protocol in geriatric patients underwent unicompartmental knee arthroplasty: a retrospective cohort study. Medicine. 2023;102(6):e32941. doi:10.1097/md.0000000000032941
4. Raja SN, Carr DB, Cohen M, et al. The revised international association for the study of pain definition of pain: concepts, challenges, and compromises. Pain. 2020;161(9):1976–1982. doi:10.1097/j.pain.0000000000001939
5. Ferreira-Valente MA, Pais-Ribeiro JL, Jensen MP. Validity of four pain intensity rating scales. Pain. 2011;152(10):2399–2404. doi:10.1016/j.pain.2011.07.005
6. Cleeland CS, Ryan KM. Pain assessment: global use of the Brief Pain Inventory. Ann Acad Med Singap. 1994;23(2):129–138.
7. Bonafé FSS, de Campos LA, Marôco J, Campos J. Brief pain inventory: a proposal to extend its clinical application. Eur J Pain. 2019;23(3):565–576. doi:10.1002/ejp.1330
8. Caraceni A, Mendoza TR, Mencaglia E, et al. A validation study of an Italian version of the brief pain inventory (Breve Questionario per la Valutazione del Dolore). Pain. 1996;65(1):87–92. doi:10.1016/0304-3959(95)00156-5
9. Uki J, Mendoza T, Cleeland CS, Nakamura Y, Takeda F. A brief cancer pain assessment tool in Japanese: the utility of the Japanese Brief Pain Inventory--BPI-J. J Pain Symptom Manage. 1998;16(6):364–373. doi:10.1016/s0885-3924(98)00098-0
10. Mystakidou K, Mendoza T, Tsilika E, et al. Greek brief pain inventory: validation and utility in cancer pain. Oncology. 2001;60(1):35–42. doi:10.1159/000055294
11. Badia X, Muriel C, Gracia A, et al. Validación española del cuestionario Brief Pain Inventory en pacientes con dolor de causa neoplásica. [Validation of the Spanish version of the Brief Pain Inventory in patients with oncological pain]. Med Clin. 2003;120(2):52–59. doi:10.1016/s0025-7753(03)73601-x
12. Wang XS, Hao XS, Wang Y, et al. Validation study of the Chinese version of the Brief Fatigue Inventory (BFI-C). J Pain Symptom Manage. 2004;27(4):322–332. doi:10.1016/j.jpainsymman.2003.09.008
13. Kalyadina SA, Ionova TI, Ivanova MO, et al. Russian brief pain inventory: validation and application in cancer pain. J Pain Symptom Manage. 2008;35(1):95–102. doi:10.1016/j.jpainsymman.2007.02.042
14. Ferreira KA, Teixeira MJ, Mendonza TR, Cleeland CS. Validation of brief pain inventory to Brazilian patients with pain. Support Care Cancer. 2011;19(4):505–511. doi:10.1007/s00520-010-0844-7
15. King MT. A point of minimal important difference (MID): a critique of terminology and methods. Expert Rev Pharmacoecon Outcomes Res. 2011;11(2):171–184. doi:10.1586/erp.11.9
16. Jaeschke R, Singer J, Guyatt GH. Measurement of health status. Ascertaining the minimal clinically important difference. Control Clin Trials. 1989;10(4):407–415. doi:10.1016/0197-2456(89)90005-6
17. Mease PJ, Spaeth M, Clauw DJ, et al. Estimation of minimum clinically important difference for pain in fibromyalgia. Arthritis Care Res. 2011;63(6):821–826. doi:10.1002/acr.20449
18. Sandhu SK, Halpern CH, Vakhshori V, et al. Brief pain inventory--facial minimum clinically important difference. J Neurosurg. 2015;122(1):180–190. doi:10.3171/2014.8.Jns132547
19. Danoff JR, Goel R, Sutton R, Maltenfort MG, Austin MS. How much pain is significant? Defining the minimal clinically important difference for the visual analog scale for pain after total joint arthroplasty. J Arthroplasty. 2018;33(7s):S71–S75.e2. doi:10.1016/j.arth.2018.02.029
20. Wang S, Yao S, Xiao P, et al. Quantitative analysis of the minimum clinically important difference in the brief pain inventory after total knee arthroplasty. J Pain Res. 2025;18:803–813. doi:10.2147/jpr.S501219
21. Sonawane K, Balavenkatasubramanian J. Current concepts in pain management of total knee replacement surgeries: a narrative review. Int J Reg Anesth. 2022;3(2):56–75. doi:10.13107/ijra.2022.v03i02.057
22. Baburkina O, Bludova M, Ovchynnikov O. A review of 2021 and 2022 AAOS guidelines for meniscal arthroscopic procedures in osteoarthritis. Orthop Traumatol Prosthet. 2024;56–62. doi:10.15674/0030-59872023456-62
23. Kohn MD, Sassoon AA, Fernando ND. Classifications in brief: kellgren-lawrence classification of osteoarthritis. Clin Orthop Relat Res. 2016;474(8):1886–1893. doi:10.1007/s11999-016-4732-4
24. Anderson KO. Role of cutpoints: why grade pain intensity? Pain. 2005;113(1–2):5–6. doi:10.1016/j.pain.2004.10.024
25. Rai SK, Yazdany J, Fortin PR, Aviña-Zubieta JA. Approaches for estimating minimal clinically important differences in systemic lupus erythematosus. Arthritis Res Ther. 2015;17(1):143. doi:10.1186/s13075-015-0658-6
26. Lizaur-Utrilla A, Gonzalez-Parreño S, Martinez-Mendez D, Miralles-Muñoz FA, Lopez-Prats FA. Minimal clinically important differences and substantial clinical benefits for knee society scores. Knee Surg Sports Traumatol Arthrosc. 2020;28(5):1473–1478. doi:10.1007/s00167-019-05543-x
27. Kim SK, Kim SH, Jo MW, Lee SI. Estimation of minimally important differences in the EQ-5D and SF-6D indices and their utility in stroke. Health Qual Life Outcomes. 2015;13:32. doi:10.1186/s12955-015-0227-3
28. Kvam AK, Fayers PM, Wisloff F. Responsiveness and minimal important score differences in quality-of-life questionnaires: a comparison of the EORTC QLQ-C30 cancer-specific questionnaire to the generic utility questionnaires EQ-5D and 15D in patients with multiple myeloma. Eur J Haematol. 2011;87(4):330–337. doi:10.1111/j.1600-0609.2011.01665.x
29. Khow YZ, Liow MHL, Goh GS, et al. Defining the minimal clinically important difference for the knee society score following revision total knee arthroplasty. Knee Surg Sports Traumatol Arthrosc. 2022;30(8):2744–2752. doi:10.1007/s00167-021-06628-2
30. Mouelhi Y, Jouve E, Castelli C, Gentile S. How is the minimal clinically important difference established in health-related quality of life instruments? Review of anchors and methods. Health Qual Life Outcomes. 2020;18(1):136. doi:10.1186/s12955-020-01344-w
31. Quinten C, Kenis C, Decoster L, et al. Determining clinically important differences in health-related quality of life in older patients with cancer undergoing chemotherapy or surgery. Qual Life Res. 2019;28(3):663–676. doi:10.1007/s11136-018-2062-6
32. Gao C, Huang T, Wu K, et al. Multimodal analgesia for accelerated rehabilitation after total knee arthroplasty: a randomized, double-blind, controlled trial on the effect of the co-application of local infiltration analgesia and femoral nerve block combined with dexmedetomidine. Brain Sci. 2022;12(12):1652. doi:10.3390/brainsci12121652
33. Lavanya A, Alexander TL. Confidence Intervals Estimation for ROC Curve, AUC and Brier Score under the Constant Shape Bi-Weibull Distribution. Int J Sci Res. 2016;5:371–8.
34. Golicher DJ, Ford A, Cayuela L, Newton AC. Pseudo-absences, pseudo-models and pseudo-niches: pitfalls of model selection based on the area under the curve. Int J Geog Inf Sci. 2012;26(2049):
35. Lobo JM, Jiménez‐Valverde A, Real R. AUC: a misleading measure of the performance of predictive distribution models. Glob Ecol Biogeogr. 2008;17:145–151. doi:10.1111/j.1466-8238.2007.00358.x
36. Pundir S, Amala R. Evaluation of area under the constant shape Bi- Weibull roc curve evaluation of area under the constant shape Bi-Weibull roc curve. J Mod Appl Stat Methods. 2014;13:20.
37. Le QA, Doctor JN, Zoellner LA, Feeny NC. Minimal clinically important differences for the EQ-5D and QWB-SA in Post-traumatic Stress Disorder (PTSD): results from a Doubly Randomized Preference Trial (DRPT). Health Qual Life Outcomes. 2013;11:59. doi:10.1186/1477-7525-11-59
38. Benhissen Z, Konzelmann M, Vuistiner P, et al. Determining the minimal clinically important difference of the hand function sort questionnaire in vocational rehabilitation. Ann Phys Rehabil Med. 2019;62(3):155–160. doi:10.1016/j.rehab.2018.11.003
39. Tittle MB, McMillan SC, Hagan S. Validating the brief pain inventory for use with surgical patients with cancer. Oncol Nurs Forum. 2003;30(2):325–330. doi:10.1188/03.Onf.325-330
40. Jennings JM, Kleeman-Forsthuber LT, Bolognesi MP. Medial unicompartmental arthroplasty of the knee. J Am Acad Orthop Surg. 2019;27(5):166–176. doi:10.5435/jaaos-d-17-00690
41. Lovich-Sapola J, Smith CE, Brandt CP. Postoperative pain control. Surg Clin North Am. 2015;95(2):301–318. doi:10.1016/j.suc.2014.10.002
42. Chaturvedi R, Tram J, Chakravarthy K. Reducing opioid usage in total knee arthroplasty postoperative pain management: a literature review and future directions. Pain Manag. 2022;12(1):105–116. doi:10.2217/pmt-2020-0107
43. Wells G, Beaton D, Shea B, et al. Minimal clinically important differences: review of methods. J Rheumatol. 2001;28(2):406–412.
44. Kamper SJ, Maher CG, Mackay G. Global rating of change scales: a review of strengths and weaknesses and considerations for design. J Man Manip Ther. 2009;17(3):163–170. doi:10.1179/jmt.2009.17.3.163
45. Parker SL, Adogwa O, Mendenhall SK, et al. Determination of minimum clinically important difference (MCID) in pain, disability, and quality of life after revision fusion for symptomatic pseudoarthrosis. Spine J. 2012;12(12):1122–1128. doi:10.1016/j.spinee.2012.10.006
46. Parker SL, Mendenhall SK, Shau DN, et al. Minimum clinically important difference in pain, disability, and quality of life after neural decompression and fusion for same-level recurrent lumbar stenosis: understanding clinical versus statistical significance. J Neurosurg Spine. 2012;16(5):471–478. doi:10.3171/2012.1.Spine11842
47. Díaz-Arribas MJ, Fernández-Serrano M, Royuela A, et al. Minimal clinically important difference in quality of life for patients with low back pain. Spine. 2017;42(24):1908–1916. doi:10.1097/brs.0000000000002298
48. Revicki D, Hays RD, Cella D, Sloan J. Recommended methods for determining responsiveness and minimally important differences for patient-reported outcomes. J Clin Epidemiol. 2008;61(2):102–109. doi:10.1016/j.jclinepi.2007.03.012
49. Copay AG, Eyberg B, Chung AS, et al. Minimum clinically important difference: current trends in the orthopaedic literature, part II: lower extremity: a systematic review. JBJS Rev. 2018;6(9):e2. doi:10.2106/jbjs.Rvw.17.00160
50. Angst F, Aeschlimann A, Angst J. The minimal clinically important difference raised the significance of outcome effects above the statistical level, with methodological implications for future studies. J Clin Epidemiol. 2017;82:128–136. doi:10.1016/j.jclinepi.2016.11.016
51. Beard DJ, Harris K, Dawson J, et al. Meaningful changes for the Oxford Hip and knee scores after joint replacement surgery. J Clin Epidemiol. 2015;68(1):73–79. doi:10.1016/j.jclinepi.2014.08.009
52. Clement ND, MacDonald D, Simpson AH. The minimal clinically important difference in the Oxford knee score and Short Form 12 score after total knee arthroplasty. Knee Surg Sports Traumatol Arthrosc. 2014;22(8):1933–1939. doi:10.1007/s00167-013-2776-5
53. Tubach F, Ravaud P, Baron G, et al. Evaluation of clinically relevant changes in patient reported outcomes in knee and hip osteoarthritis: the minimal clinically important improvement. Ann Rheum Dis. 2005;64(1):29–33. doi:10.1136/ard.2004.022905
54. de Filippis R, Mercurio M, Segura-Garcia C, et al. Defining the minimum clinically important difference (MCID) in the Hospital Anxiety and Depression Scale (HADS) in patients undergoing total Hip and knee arthroplasty. Orthop Traumatol Surg Res. 2024;110(2):103689. doi:10.1016/j.otsr.2023.103689
55. Clement ND, Bardgett M, Weir D, et al. What is the minimum clinically important difference for the WOMAC index after TKA? Clin Orthop Relat Res. 2018;476(10):2005–2014. doi:10.1097/corr.0000000000000444
56. Zhao C, Liao Q, Yang D, Yang M, Xu P. Advances in perioperative pain management for total knee arthroplasty: a review of multimodal analgesic approaches. J Orthop Surg Res. 2024;19(1):843. doi:10.1186/s13018-024-05324-4
57. Sharma S, D’Souza PJJ, Badagabettu S, Vijayan S. Functional outcome and patients’ perceived benefits after total knee arthroplasty: a cross-sectional study. Int J Orthop Trauma Nurs. 2020;39:100791. doi:10.1016/j.ijotn.2020.100791
58. Lisi C, Caspani P, Bruggi M, et al. Early rehabilitation after elective total knee arthroplasty. Acta Biomed. 2017;88(4s):56–61. doi:10.23750/abm.v88i4-S.5154
59. Patil J, Ghorpade K, Khambalkar S, Naik NP, Patil T. Functional outcome of patients with moderate-to-severe osteoarthritis treated by total knee arthroplasty at a tertiary care center. Asian J Pharm Clin Res. 2023;74–77. doi:10.22159/ajpcr.2023.v16i6.48291
60. Dagneaux L, Limberg AK, Osmon DR, et al. Acute kidney injury when treating periprosthetic joint infections after total knee arthroplasties with antibiotic-loaded spacers. J Bone Joint Surg. 2021;103(754):
61. Tidd JL, Huffman N, Oyem PC, et al. Preoperative and postoperative weight change has minimal influence on health care utilization and patient-reported outcomes following total knee arthroplasty. J Knee Surg. 2023;37(7):545–554. doi:10.1055/a-2232-7657
62. Barahona M, Barahona M, Navarro T, et al. Increase in postoperative body mass index in patients after total knee arthroplasty. Cureus. 2023;15.
63. Zhu Z, Tang T, Pan S, et al. Effect of knee joint weight change on knee function recovery and gait after total knee arthroplasty. BMC Musculoskelet Disord. 2022;23(1):694. doi:10.1186/s12891-022-05647-5
64. Backe IF, Patil GG, Nes RB, Clench-Aas J. The relationship between physical functional limitations, and psychological distress: considering a possible mediating role of pain, social support and sense of mastery. SSM Popul Health. 2018;4:153–163. doi:10.1016/j.ssmph.2017.12.005
 © 2025 The Author(s). This work is published and licensed by Dove Medical Press Limited. The
full terms of this license are available at https://www.dovepress.com/terms
and incorporate the Creative Commons Attribution
- Non Commercial (unported, 4.0) License.
By accessing the work you hereby accept the Terms. Non-commercial uses of the work are permitted
without any further permission from Dove Medical Press Limited, provided the work is properly
attributed. For permission for commercial use of this work, please see paragraphs 4.2 and 5 of our Terms.
© 2025 The Author(s). This work is published and licensed by Dove Medical Press Limited. The
full terms of this license are available at https://www.dovepress.com/terms
and incorporate the Creative Commons Attribution
- Non Commercial (unported, 4.0) License.
By accessing the work you hereby accept the Terms. Non-commercial uses of the work are permitted
without any further permission from Dove Medical Press Limited, provided the work is properly
attributed. For permission for commercial use of this work, please see paragraphs 4.2 and 5 of our Terms.