Back to Journals » Journal of Inflammation Research » Volume 16
The m6A/m1A/m5C-Related Methylation Modification Patterns and Immune Landscapes in Rheumatoid Arthritis and Osteoarthritis Revealed by Microarray and Single-Cell Transcriptome
Authors Zheng H ![]() , Aihaiti Y, Cai Y, Yuan Q
, Aihaiti Y, Cai Y, Yuan Q ![]() , Yang M
, Yang M ![]() , Li Z, Xu K, Xu P
, Li Z, Xu K, Xu P
Received 10 August 2023
Accepted for publication 13 October 2023
Published 1 November 2023 Volume 2023:16 Pages 5001—5025
DOI https://doi.org/10.2147/JIR.S431076
Checked for plagiarism Yes
Review by Single anonymous peer review
Peer reviewer comments 3
Editor who approved publication: Professor Ning Quan
Haishi Zheng,1,2 Yirixiati Aihaiti,2 Yongsong Cai,2 Qiling Yuan,2 Mingyi Yang,2 Zheng Li,2 Ke Xu,2 Peng Xu1,2
1Department of Orthopedics, The First Affiliated Hospital of Xi’an Jiaotong University, Xi’an, People’s Republic of China; 2Department of Joint Surgery, HongHui Hospital, Xi’an Jiaotong University, Xi’an, People’s Republic of China
Correspondence: Peng Xu, Department of Orthopedics, The First Affiliated Hospital of Xi’an Jiaotong University, Xi’an, People’s Republic of China, Tel +86 13772090019, Email [email protected]
Purpose: The goal of this study was to explore the expression characteristics of RNA modification-related genes, reveal immune landscapes and identify novel potential diagnostic biomarkers in osteoarthritis (OA) and rheumatoid arthritis (RA) patients.
Patients and Methods: RNA microarray and single-cell sequencing (scRNA-seq) data were downloaded from gene expression omnibus (GEO) database. Differentially expressed RNA modification-related genes were identified and then functionally annotated. Univariate logistic regression and lasso regression analysis were used to identify primary disease genes for OA and RA. Validation was done using scRNA-seq analysis and immunohistochemistry (IHC) in human knee synovial tissues and a murine destabilization of the medial meniscus (DMM) model. Through WGCNA analysis, genes associated with cell pyroptosis or autophagy in OA and RA were identified, which were then combined with differentially expressed RNA modification-related genes to construct a PPI interaction network. Furthermore, hub genes were selected for ceRNA interaction network analysis, correlation analysis with OA and RA molecular subtypes, as well as correlation analysis with 22 immune cells.
Results: Six RNA modification-related genes (ADAMDEC1, IGHM, OGN, TNFRSF11B, SCARA3 and PTN) were identified as potential OA and RA pathogenesis biomarkers. Their expression was validated in human knee synovial tissues and a murine DMM model. Functional enrichment of differentially expressed RNA modification-related genes between RA and OA was analyzed using GO, KEGG, GSEA, and GSVA. Based on WGCNA and PPI analysis, the six hub genes related to pyroptosis and RNA modification (CXCL10, CXCL9, CCR7, CCL5, CXCL1, and CCR2) were identified as central nodes for ceRNA interaction, correlation with OA and RA molecular subtypes, and association with 22 immune cells.
Conclusion: Our research revealed the significance of RNA modification-related genes in the development of OA and RA pathogenesis, thereby providing a novel research direction for understanding the mechanisms, diagnosis, and treatment of OA and RA.
Keywords: m6A, m5C, m1A, osteoarthritis, rheumatoid arthritis, single-cell sequencing
Introduction
Osteoarthritis (OA) and rheumatoid arthritis (RA) are two of the most common forms of arthritis that affect millions of people worldwide.1,2 While both conditions share some similarities in symptoms, epidemiology, and treatment options, they differ significantly in their underlying molecular mechanisms and pathogenesis.3
OA is a multifaceted degenerative joint disorder, not limited to cartilage erosion but encompassing the entire joint. It involves cartilage and meniscal degeneration, inflammation and fibrosis of the infrapatellar fat pad and synovial membrane, and subchondral bone remodeling.4–6 Predominantly seen in older adults, OA’s onset is influenced by factors like obesity, joint trauma, and genetic predispositions.7,8 OA is a leading cause of disability worldwide, and its prevalence is expected to increase as the population ages. In contrast, RA is an autoimmune disease that affects the synovial tissue lining the joints, leading to chronic inflammation and joint damage. RA is characterized by symmetrical joint involvement, joint pain, stiffness, and swelling, and is associated with systemic manifestations such as fatigue, fever, and weight loss.9 The exact etiology of RA is unknown, but it is thought to result from a complex interplay between genetic, environmental, and immunological factors.2 Both OA and RA are more prevalent in women. While OA’s prevalence increases with age, RA typically manifests between the ages of 30 and 50.10
OA and RA, prevalent joint disorders, have witnessed significant advancements in their therapeutic strategies. For OA, beyond the conventional pain management and physical therapy, the forefront of treatment now includes cell therapies such as chondrocyte and MSC transplantation,11 drug delivery mediated by exosomes,12 the application of bioactive materials,13–15 and innovative approaches like senolytic drugs16 or RNA therapies.17 On the other hand, RA, driven by autoimmune inflammation, is managed not only with traditional disease-modifying antirheumatic drugs (DMARDs) but also with cutting-edge targeted therapies, notably biologics that pinpoint and inhibit specific inflammatory pathways.18 Thus, identifying characteristic targets based on the molecular mechanisms of OA and RA is crucial for the development of novel clinical therapeutic approaches.
The synovial molecular mechanisms in OA and RA exhibit distinct differences. In OA, synovial inflammation correlates with radiographic and pain progression.6 Multiple contributors to OA, such as ageing, obesity, trauma and mechanical loading, influence its development, potentially by altering the synovial environment.19 Furthermore, other factors like specific cytokines, crystals and metabolites in the synovium, damage-associated molecular patterns, participation of the NLRP3 inflammasome and mitochondrial dysfunction, instigate synovial cell activation, intensifying the inflammatory response.20 In RA, the synovial tissue becomes densely infiltrated with immune cells, leading to chronic inflammation. The acellular synovium, transformed into an invasive tumour-like “pannus” due to synovial proliferation, neovascularization and leukocyte extravasation, creates a hypoxic environment due to its aberrant microvasculature.21 Such oxygen scarcity perturbs cellular metabolism and mitochondrial function, leading to an increased generation of reactive oxygen species, further exacerbating inflammation. Under various cellular stress conditions, such as hypoxia, ROS, endoplasmic reticulum (ER) stress, and microbial infections, the NLRP3 inflammasome and autophagy are activated.22–24 This activation endows macrophages and RA fibroblast-like synoviocytes (RA-FLS) with critical pro-inflammatory and anti-apoptotic functions respectively.25 Nakahira et al26 suggest that autophagic proteins play a pivotal role in modulating inflammasome-dependent inflammation. A deficiency in these proteins fosters the accumulation of malfunctioning mitochondria, leading to the cytosolic translocation of mtDNA, caspase-1 activation, and the subsequent secretion of IL-1β and IL-18.27 In summary, while synovial inflammation is crucial in the progression of both OA and RA, their distinct pathogenic mechanisms and immune microenvironments result in divergent molecular pathways. Further exploration of potential epigenetic modifications may provide insights into their molecular underpinnings.
RNA modification is a post-transcriptional process that involves the addition or removal of various chemical groups to RNA molecules, leading to alterations in their structure and function.28 Several RNA modification-related genes have been identified, each encoding enzymes that catalyze specific RNA modifications. RNA modification-related genes, including those involved in N6-methyladenosine (m6A), N1-methyladenosine (m1A), and cytosine-5 methylation (m5C) modifications, have been shown to be associated with the pathogenesis of OA and RA, two common forms of arthritis characterized by joint inflammation and cartilage damage.29
In OA, increased m6A modification has been observed in the cartilage of patients, and this modification has been associated with increased inflammation and cartilage degradation.30 The m6A modification is regulated by several RNA modification-related genes, including METTL3, METTL14, and FTO. Dysregulation of these genes and the m6A modification they regulate may contribute to the development and progression of OA.31 Similarly, in RA, decreased m5C modification has been observed in the synovial tissue of patients, and this modification is associated with increased inflammation and disease severity. DNMT2, NSUN2, and TRDMT1 are RNA modification-related genes that regulate m5C modification. Dysregulation of these genes and the m5C modification they regulate may contribute to the pathogenesis of RA.32 Furthermore, decreased m1A modification has been observed in the cartilage of OA patients.32,33 Dysregulation of these genes and the m1A modification they regulate may lead to altered gene expression and chondrocyte dysfunction in OA.
Overall, these findings suggest that dysregulation of RNA modification-related genes and their associated modifications may contribute to the development and progression of OA and RA. Our study aims to elucidate the underlying mechanisms associated with RNA modification-related genes and to identify potential therapeutic targets for OA and RA.
Materials and Methods
Data Collection
We obtained a single cell sequencing (scRNA-seq) dataset, GSE152805,34 from the official GEO database (https://www.ncbi.nlm.nih.gov/geo/) for the species Homo sapiens. The dataset was generated on the platform GPL20301 Illumina HiSeq 4000 and consisted of 14,318 normal cartilage cells from the lateral aspect of the tibia and 10,927 cells from the damaged cartilage on the medial side of the tibia. These samples were obtained from patients with OA during joint replacement surgery. More information about the dataset can be found in Supplementary Table 1. Furthermore, we acquired the expression and clinical data of three RNA microarray datasets, GSE55235,35 GSE55457,35 and GSE5558435 from the GEO database. These datasets also corresponded to the species Homo sapiens and were generated on the platform GPL96 [HG-U133A] Affymetrix Human Genome U133A Array. We integrated these datasets, resulting in a total of 79 synovial tissue samples, including 20 normal samples, 26 OA samples, and 33 RA samples, as described in Supplementary Table 2.
Differential Expression of RNA Modification-Related Genes Between OA and RA
We obtained human RNA modification-related gene data from two databases, RMBase v2.0 (RNA Modification Database) database36 for m1A, m6A, and the m5C-Atlas database37 for m5C. These data sets were integrated into an RNA modification-related gene set consisting of 11,280 genes. The genes were extracted from RNA microarray expression data for further analysis. To remove any batch effects, we used the ComBat38 function of the sva (version 3.42.0) R package on the three RNA microarray datasets. We then used the limma (version 3.50.0)39 R package to perform differential expression analysis of RNA modification-related genes in the OA and RA samples in the data set. The significance threshold for gene screening was set at a P-value < 0.05 and | logFC | > 1. We created volcano and heat maps to display the results of differential analysis of RNA modification-related genes, and a box plot for the top 5 genes.
PPI Network of Differentially Expressed RNA Modification-related Genes between OA and RA.
We downloaded human protein interaction network data from the STRING database,40 filtered it using a threshold of combined score > 700, and imported it into Cytoscape.41 We then mapped the differentially expressed RNA modification-related genes between OA and RA to the filtered human PPI network for display.
Univariate Regression Analysis and LASSO Regression Analysis
We conducted univariate regression analysis and LASSO (Least Absolute Shrinkage and Selection Operator) regression analysis on the differentially expressed RNA modification-related genes between OA and RA using the glmnet (version 4.1) R package.42 We performed separate analysis for the OA and normal group, as well as the RA and normal group, to identify genes significantly associated with OA and RA, respectively. Subsequently, we applied LASSO regression to identify genes with non-zero coefficients as the primary disease genes for OA or RA.
GO and KEGG Enrichment Analysis
We conducted Gene Ontology (GO)43 and Kyoto Encyclopedia of Genes and Genomes (KEGG)44 enrichment analysis to identify the biological processes and pathways that were most related to differentially expressed RNA modification-related genes between OA and RA, using a cutoff value of P < 0.05.
GSEA and GSVA Enrichment Analysis
To investigate the variations in biological processes between the disease group and the control group, we downloaded c2.cp.kegg.v7.5.1.symbols.gmt from the Molecular Signatures Database (MSigDB, https://www.gsea-msigdb.org/gsea/msigdb/)45 as the gene set and conducted enrichment analysis and visualization on the gene expression dataset using the Gene Set Enrichment Analysis (GSEA)45 and Gene Set Variation Analysis (GSVA)46 methods with R package clusterProfiler (version 4.2.2)47 and GSVA (version 1.42.0) respectively. Then, using the R package limma (version 3.50.0),39 we analyzed the pathways with significant differences (P-value < 0.05), evaluated the pathway activity scores for OA and RA, conducted differential analysis, and finally, plotted the top 5 pathways for both diseases in a heatmap.
WGCNA Analysis
The Weighted Correlation Network Analysis (WGCNA)48 was used to construct a co-expression network, explore the correlation of genes, and identify important interacting gene modules. The co-expression network was built using the comparison of the OA and RA expression datasets. The “PickSoftThreshold” function in the R package WGCNA (version 1.70-3)48 was used to calculate the soft threshold β value, which was determined to be 8. Hierarchical clustering analysis was then performed based on weighted correlation, and the clustering results were divided according to the set criteria to obtain different gene modules, represented by the branches of the clustering tree and different colors. Subsequently, the correlation of the gene modules with cell pyroptosis and autophagy was calculated to identify phenotype-related modules and perform correlation analysis.
PPI Network of RNA Modification-Pyroptosis-Related Genes
We extracted the gene module most significantly correlated with pyroptosis from the WGCNA analysis and intersected it with the differentially expressed RNA modification-related genes between OA and RA. Then, we mapped these intersected genes to the differentially expressed RNA modification-related genes PPI network between OA and RA and performed network topology analysis using the cytoHubba49 plugin in Cytoscape.41 The MCC algorithm was used to select the top 6 genes as hub genes.
ceRNA Network
We obtained the miRNA-mRNA and miRNA-lncRNA interaction data from the starBase database.50 With the help of hub genes, we identified miRNAs related to the genes and then searched for lncRNAs associated with those miRNAs. Finally we filtered out lncRNAs with less than 10 miRNA-lncRNA relationship pairs, constructed a ceRNA interaction network, and visualized it with Cytoscape.41
Molecular Subtypes of OA and RA
According to univariate logistic regression analysis and LASSO regression analysis, the primary disease genes in OA and RA were obtained. ConsensusClusterPlus51 was used in R to perform consistency clustering, and molecular subtypes were differentiated between the two diseases based on the clustering results. The correlation between the hub genes and the molecular subtypes of the two diseases was calculated using the “corrr” package in R, the results of which were visualized in a heat map.
Immune Infiltration Analysis
The CIBERSORT (https://cibersortx.stanford.edu/)52 analysis tool is a bioinformatics algorithm that accurately calculates the infiltration of immune cells. The assumed immune cell abundance is estimated using a reference set consisting of 22 immune cell subtypes. The correlation between the hub genes and the 22 immune cell subtypes was calculated with the R package corrr, and the results were visualized in a heatmap.
Seurat Quality Control
We used R (version 4.1) and Seurat package (version 4.0.5)53 to analyze the GSE152805 dataset. The proportion of mitochondrial genes to all genetic material was generally evaluated as an indicator of cellular stress. After filtering out cells with high mitochondrial gene content (> 10%), low-quality cells or empty droplets (< 200 features), doublets (> 6000 features), and cells with the sum of gene expression > 60,000, we obtained 25,245 cells. We then standardized the sequencing depth of the dataset and identified 1000 variable features. Principal Component Analysis (PCA)54 was applied to identify significant PCs and the cells were grouped into clusters using Seurat’s “FindNeighbors” and “FindClusters” functions. Finally, we used the “RunUMAP” function for dimensionality reduction to visualize and explore the dataset.
Cell Type Annotation
After using UMAP for visualization, we identified 15 clusters and manually annotated 7 distinct subtypes of chondrocytes using cell type marker genes. The marker genes for each subtype were as follows: MMP3, FOSB, and JUN for homeostatic chondrocytes (HomC); COL10A1, IBSP, and JUN for hypertrophic chondrocytes (HTC); COL10A1, IBSP, COL2A1, and TGFBI for prehypertrophic chondrocytes (preHTC); CHI3L1 and CHI3L2 for regulatory chondrocytes (RegC); COL1A1, COL1A2, S100A4, PRG4, and TMSB4X for fibrochondrocytes (FC); COL2A1, CILP, COL3A1, and COMP for reparative chondrocytes (RepC); and IL11, COL2A1, CILP, and OGN for prefibrochondrocytes (preFC).34,55 Finally, we used the “FindAllMarkers” function with default parameters to determine the differentiating genes between cell types.
Surgically Induced Osteoarthritis
C57BL/6 mice were purchased from Xi’an Jiaotong University and used for all experiments. Mice were housed in accredited facilities and received standard diets and tap water. The study was approved by the Animal Care and Use Committee of Xi’an Jiaotong University. Male C57BL/6 mice, aged 12 weeks and weighting 28.5±1.7g, were acclimatized for one week before being randomly allocated to either a sham group (n = 6) or a destabilization of the medial meniscus (DMM) group (n = 6). Anesthesia was induced via intraperitoneal injection of pentobarbital sodium, and the DMM surgical technique was based on previous studies.56 After anesthesia, the hair around the knee joint was removed, and the skin was disinfected with 1% iodophor before performing the medial parapatellar arthrotomy. Under a surgical microscope, the medial meniscotibial ligament was identified and transected after dissecting the anterior fat pad. The complete detachment of the ligament was confirmed by pushing the meniscus. Following patella relocation, the surgical area was disinfected with iodophor and the joint capsule was closed using sutures. The sham group underwent only the medial capsulotomy. After a 12-week postsurgical period, the mice were euthanized, and their right knee joints were dissected. All applicable guidelines for mouse experiments were strictly followed in this study.
Histology and Immunohistochemistry Analysis
Following euthanasia, the right knee joints of the mice were harvested and fixed in 4% paraformaldehyde for 48 hours. Subsequently, the samples underwent decalcification in a solution containing 25% EDTA at room temperature for a duration of two weeks. Once decalcified, the tissues were embedded in paraffin. Paraffin-embedded blocks were sectioned at a thickness of 5μm. These sections were then processed for deparaffinization and dehydration. Histological evaluations were performed using hematoxylin-eosin (HE), safranin O-fast green, and toluidine blue staining, as well as immunohistochemistry (IHC) to assess tissue morphology and discern any differences between experimental groups. The Osteoarthritis Research Society International (OARSI) scoring system was used by two independent observers who were blinded to the experimental groups.57 IHC was performed according to the protocol of the SABC (rabbit IgG) kit (Boster, Wuhan, China; cat. nos. SA2001 and SA2002). Deparaffinization was carried out using xylene, dehydration using ethanol, and antigen retrieval was performed by heating the sections in 0.01 M citrate buffer (pH 6.0). After treatment with 3% hydrogen peroxide for 10 minutes at room temperature to inactivate endogenous peroxidase, the sections were incubated with 5% BSA blocking solution at room temperature for 1 hour. The sections were incubated overnight at 4°C with the following primary antibodies: rabbit anti-COL2A1 (Servicebio, Wuhan, China; cat. no. GB11021-100, 1:500), rabbit anti-COL1A1 (Servicebio, Wuhan, China; cat. no. GB11022-100, 1:500), rabbit anti-MMP13 (Servicebio, Wuhan, China; cat. no. GB11247-100, 1:200), rabbit anti-ADAMTS4 (Servicebio, Wuhan, China; cat. no. GB11807-100, 1:1000), rabbit anti-TNFRSF11B (ZEN-BIOSCIENCE, Chengdu, China; cat. no. 821075, 1:100), rabbit anti-OGN (Proteintech, Wuhan, China; cat. no. 12755-1-AP, 1:200), rabbit anti-SCARA3 (Abmart, Shanghai, China; cat. no. PH1489, 1:200), and rabbit anti-PTN (Abmart, Shanghai, China; cat. no. PK30936, 1:100). The slides were then incubated with biotinylated secondary antibodies (Boster, Wuhan, China; cat. nos. SA2001 and SA2002) and stained with a diaminobenzidine (DAB) substrate and counterstained with hematoxylin.
Immunohistochemistry for RA and OA Synovial Tissues
Samples of synovial tissue were collected from patients with RA (n = 10) and OA (n = 10) at the Joint Surgery Department of HongHui Hospital affiliated with Xi’an Jiaotong University (Supplementary Table 3). All participants met the 2010 American College of Rheumatology diagnostic criteria for RA and OA, including radiographic evidence and clinical history. Prior to the study, all patients signed informed consent forms and the hospital ethics committee approved the study. The aforementioned protocol was followed for conducting immunohistochemistry and HE staining. For immunostaining of ADAMDEC1 and IGHM, the following primary antibodies were utilized: rabbit anti-ADAMDEC1 (Proteintech, Wuhan, China; cat. no. 17899-1-AP, 1:200) and mouse anti-IGHM (Proteintech, Wuhan, China; cat. no. 66484-1-Ig, 1:3000).
Statistical Analysis
All data computations and statistical analysis were performed using the R programming language. Student’s t-tests were employed to compare OA and RA samples, as well as sham and DMM samples. Unless otherwise stated, statistical significance was set at P < 0.05.
Results
Differential Expression of RNA Modification-Related Genes in OA and RA
As shown in the flowchart (Figure 1), we analyzed a total of 79 samples, including 20 normal, 26 OA, and 33 RA human Knee joint synovial tissue samples. After extracting and comparing the expression data of OA and RA samples, we integrated m1A, m6A, and m5C data to identify RNA modification-related genes. Using the R package limma, we found 140 differentially expressed RNA modification-related genes, with 72 highly expressed in OA and 68 in RA. The volcano plot (Figure 2A) and heatmap (Figure 2B) were used to visualize the differentially expressed genes. Boxplots were created to show the top five differentially expressed genes in OA and RA, with MAB21L2, ZIC1, RBP4, CRLF1, and ADIPOQ highly expressed in OA and MMP1, ADAMDEC1, CXCL9, IGHM, and CXCL13 highly expressed in RA (Figure 2C). Finally, we mapped the differentially expressed genes to a PPI interaction network using Cytoscape (Figure 2D).
 |
Figure 1 Flowchart of bioinformatic analysis process of the study. |
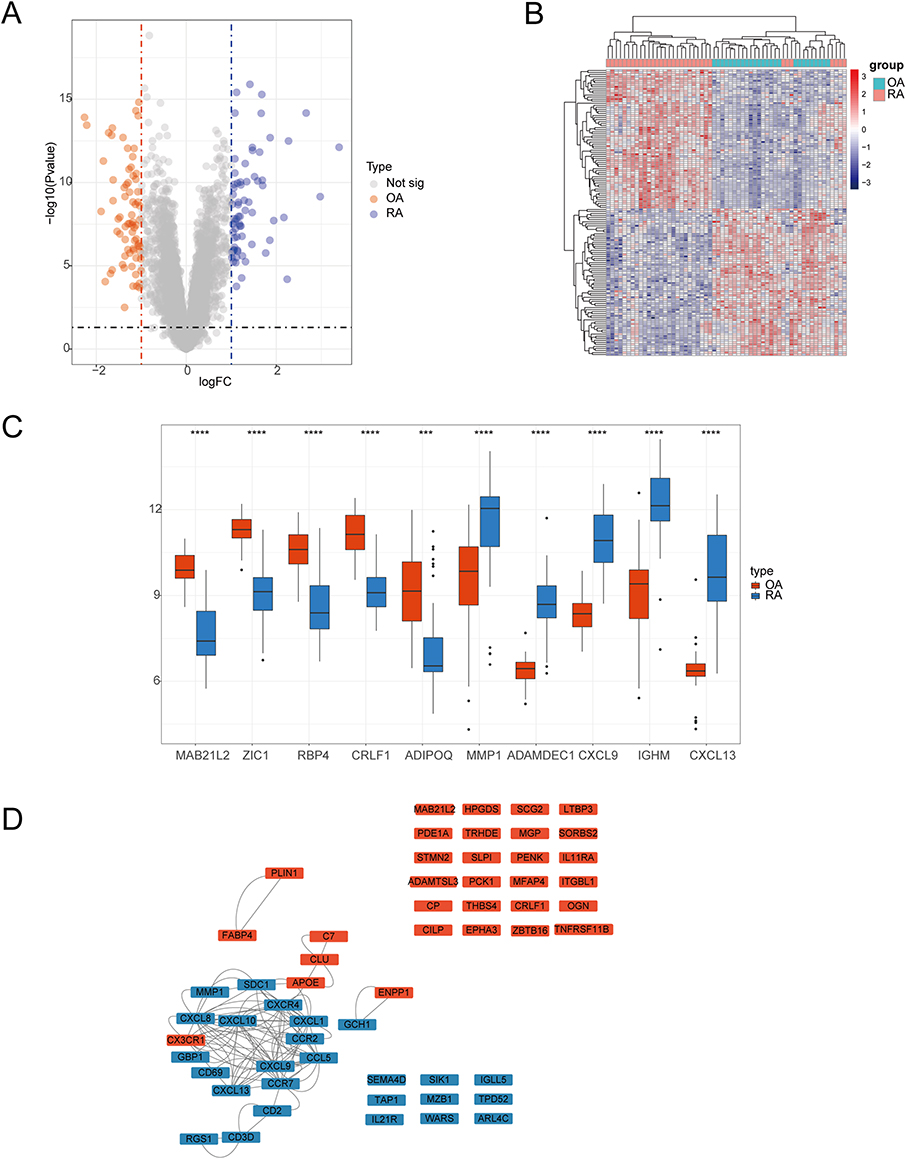 |
Figure 2 Comparison of expression of RNA modification-related genes in osteoarthritis and rheumatoid arthritis. (A) Volcano plot of differentially expressed RNA modification-related genes between osteoarthritis and rheumatoid arthritis, with logFC values on the x-axis and -log10 (P-value) on the y-axis, larger values indicating more significant differences. Orange represents higher expression in osteoarthritis and blue represents higher expression in rheumatoid arthritis. (B) Heat map of differentially expressed RNA modification-related genes between osteoarthritis and rheumatoid arthritis, with genes on the rows and samples on the columns. The more red the color, the higher the expression value, and the more blue, the lower the expression value. (C) Box plot of the top 5 genes with logFC values of differentially expressed RNA modification-related genes between osteoarthritis and rheumatoid arthritis, with gene names on the x-axis and gene expression values on the y-axis. Orange represents gene expression in osteoarthritis and blue represents gene expression in rheumatoid arthritis. (D) Protein interaction network graph of differentially expressed RNA modification-related genes between osteoarthritis and rheumatoid arthritis, with orange representing higher expression in osteoarthritis and blue representing higher expression in rheumatoid arthritis. ***P < 0.001 and ****P < 0.0001. |
Univariate Regression Analysis and LASSO Regression Analysis
To conduct the analysis, data was extracted separately from OA samples and normal samples, and also from RA samples and normal samples. In a univariate logistic regression analysis, the disease status (OA, RA) or normal status was the dependent variable, and the differentially expressed RNA modification-related genes between OA and RA were the independent variables. This analysis aimed to identify RNA modification-related genes significantly associated with the disease, and then LASSO regression was used to select the primary disease genes. Following our LASSO regression analysis, we pinpointed 13 primary disease-associated genes that were specific to the OA group, as delineated in Figure 3A. These genes encompass TNFAIP3, SCARA3, PDZRN4, NAP1L3, TNFRSF11B, SIK1, ARL4C, MEST, PTN, EPHA3, CX3CR1, OGN, and SCG2. Simultaneously, for the RA group, we identified 12 distinct primary disease genes, highlighted in Figure 3B. These genes include CSF2RB, SLAMF8, SFRP1, CXCL13, CYTIP, CXCL10, IGHM, ADAMDEC1, PENK, APOE, IGKC, and NAMPT. To validate our findings, we performed ROC analysis on the selected primary disease genes. In the OA group, the primary disease genes yielded an AUC value of 0.9231 (Figure 3C), while in the RA group, the AUC value was 0.6788 (Figure 3D).
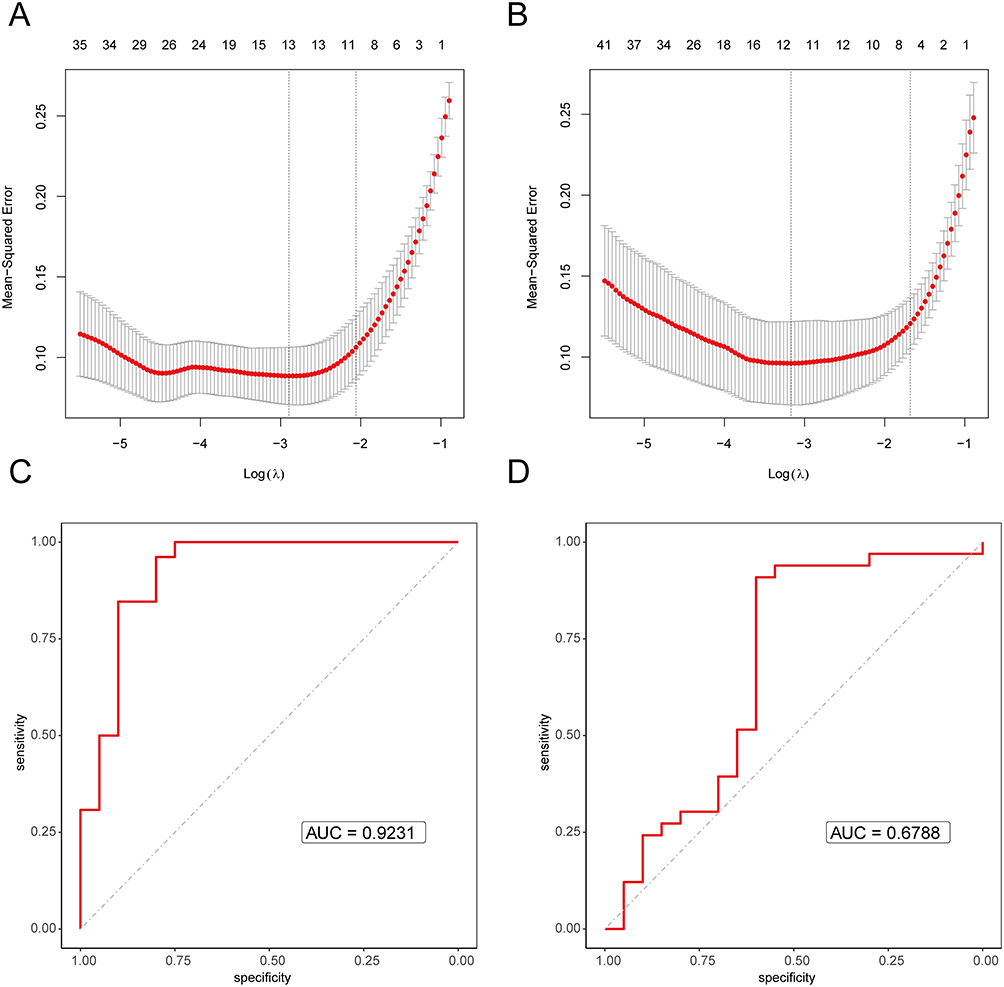 |
Figure 3 The LASSO regression and ROC assessment of disease genes. (A) The LASSO regression cross-validation using disease and normal as dependent variables and disease genes as independent variables in osteoarthritis, with the log (λ) on the bottom x-axis, mean squared error on the y-axis, and the number of genes in the model on the top x-axis. (B) The LASSO regression cross-validation using disease and normal as dependent variables and disease genes as independent variables in rheumatoid arthritis, with the log (λ) on the bottom x-axis, mean squared error on the y-axis, and the number of genes in the model on the top x-axis. (C) ROC curve of the primary disease genes in osteoarthritis, with AUC value as the area under the curve, with a higher value indicating better performance. (D) ROC curve of the primary disease genes in rheumatoid arthritis, with AUC value as the area under the curve, with a higher value indicating better performance. |
GO and KEGG Enrichment Analysis
GO and KEGG enrichment analysis revealed that the differentially expressed RNA modification genes between OA and RA were primarily enriched in biological processes such as leukocyte chemotaxis, cell chemotaxis, and cytokine-mediated signaling pathways, as well as molecular functions such as chemokine receptor binding and receptor ligand activity. They were also enriched in cell components such as the external side of the plasma membrane, collagen-containing extracellular matrix, and blood microparticle (Figure 4A). Furthermore, these genes were mainly enriched in biological pathways such as Cytokine-cytokine receptor interaction, Viral protein interaction with cytokine and cytokine receptor, Chemokine signaling pathway, Malaria, Primary immunodeficiency, IL-17 signaling pathway, NF-kappa B signaling pathway, PPAR signaling pathway, TNF signaling pathway, and Hematopoietic cell lineage (Figure 4B). Notably, a larger number of genes were enriched in the cell component external side of plasma membrane (Figure 4C) and the biological pathway Cytokine-cytokine receptor interaction (Figure 4D).
 |
Figure 4 GO and KEGG enrichment analysis was performed on the differentially expressed RNA modification-related genes between osteoarthritis and rheumatoid arthritis. (A) Bar plot of GO enrichment of differentially expressed RNA modification-related genes between osteoarthritis and rheumatoid arthritis, with the x-axis representing -log10 (P-value) with higher values being more significant and different colors representing different levels. (B) Bar plot of KEGG enrichment of differentially expressed RNA modification-related genes between osteoarthritis and rheumatoid arthritis, with the x-axis representing -log10 (P-value) with higher values being more significant and different colors representing different biological pathways. (C) Bar graph of GO enriched pathways of differentially expressed RNA modification-related genes between osteoarthritis and rheumatoid arthritis, with the x-axis representing the number of genes enriched in the pathway and the color representing -log10 (P-value), with red being more significant. (D) Bar graph of KEGG enriched pathways of differentially expressed RNA modification-related genes between osteoarthritis and rheumatoid arthritis, with the x-axis representing the number of genes enriched in the pathway and the color representing -log10 (P-value), with red being more significant. |
GSEA and GSVA Enrichment Analysis
For GSVA analysis, we generated heat maps based on the logFC value to visualize the top 5 pathways in each group (Figure 5A). In OA, the significantly enriched pathways were LIMONENE_AND_PINENE_DEGRADATION, HISTIDINE_METABOLISM, PROPANOATE_METABOLISM, etc. In RA, the significantly enriched pathways were CHEMOKINE_SIGNALING_PATHWAY, PRIMARY_IMMUNODEFICIENCY, B_CELL_RECEPTOR_SIGNALING_PATHWAY, etc. We also used the GSEA method to perform enrichment analysis of the differentially expressed RNA modification genes between OA and RA. The pathways were sorted based on NES and the top three and bottom three pathways were selected for visualization (Figure 5B–G). The three pathways with the highest NES values were CHEMOKINE SIGNALING PATHWAY, PRIMARY IMMUNODEFICIENCY, and NATURAL KILLER CELL MEDIATED CYTOTOXICITY. Conversely, the three pathways with the lowest NES values were TYROSINE METABOLISM, METABOLISM OF XENOBIOTICS BY CYTOCHROME P450, and DRUG METABOLISM CYTOCHROME P450.
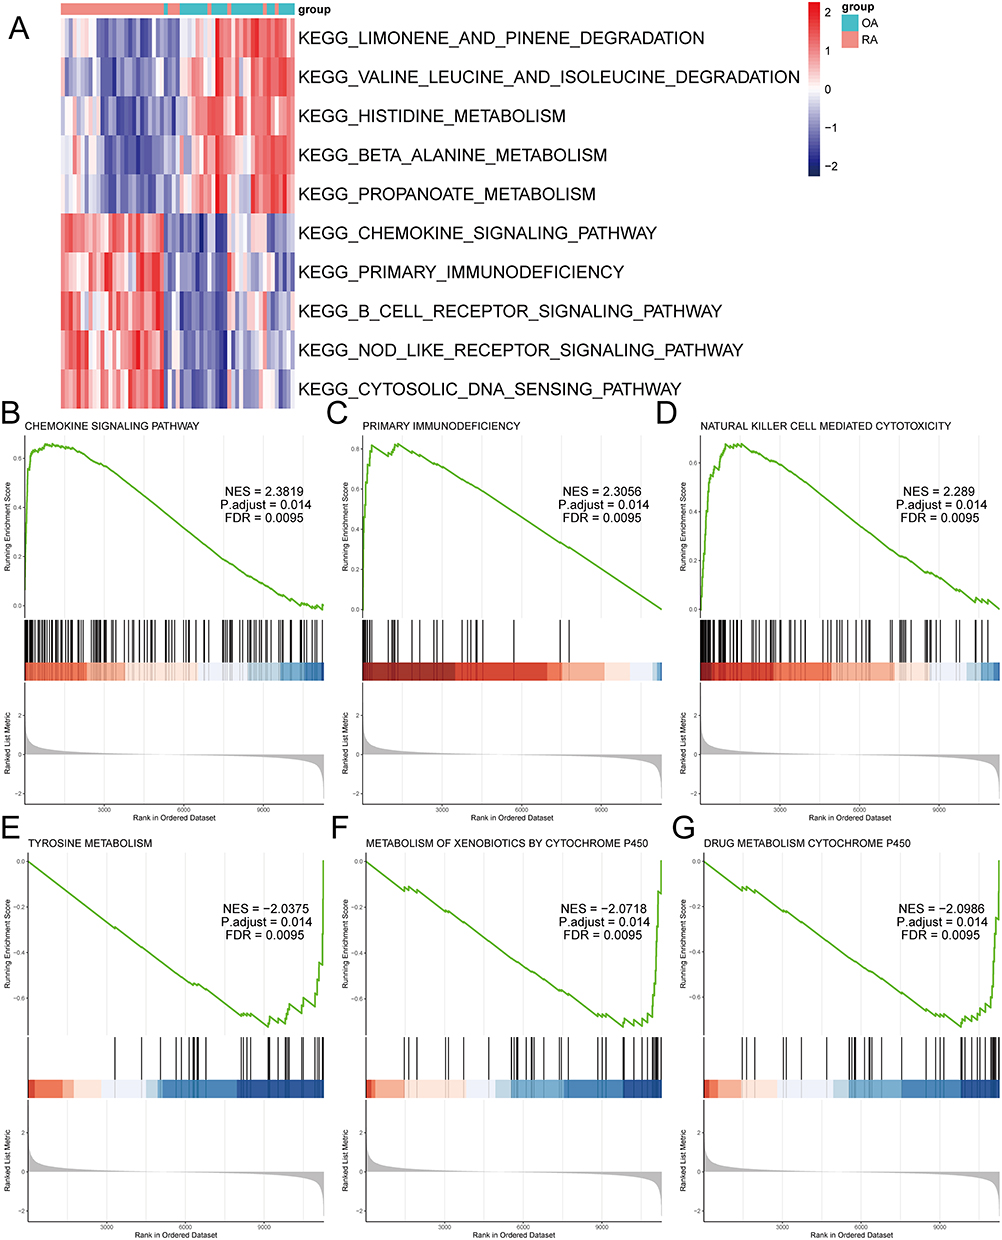 |
Figure 5 The GSEA and GSVA enrichment analysis of differentially expressed RNA modification-related genes between osteoarthritis and rheumatoid arthritis. (A) Heat map of GSVA pathway activity of differentially expressed RNA modification-related genes between osteoarthritis and rheumatoid arthritis, with pathways as rows and samples as columns. (B) GSEA enrichment plot of the CHEMOKINE SIGNALING PATHWAY. (C) GSEA enrichment plot of the PRIMARY IMMUNODEFICIENCY. (D) GSEA enrichment plot of the NATURAL KILLER CELL MEDIATED CYTOTOXICITY. (E) GSEA enrichment plot of TYROSINE METABOLISM. (F) GSEA enrichment plot of METABOLISM OF XENOBIOTICS BY CYTOCHROME P450. (G) GSEA enrichment plot of DRUG METABOLISM CYTOCHROME P450. |
Analysis of Pyroptosis and Autophagy by WGCNA
We used comparative expression data of OA and RA to construct a co-expression network. The soft threshold β value was determined as 8 using the “PickSoftThreshold” function from the R package WGCNA (version 1.70–3) (Figure 6A–D). Based on the weighted correlation, hierarchical clustering analysis was performed, resulting in different gene modules identified by dendrogram branches and colors (Figure 6E). We evaluated the correlation between gene modules and pyroptosis, as well as autophagy. We extracted the genes from the turquoise module and performed a Pearson correlation analysis between their expression and pyroptosis as well as the turquoise module itself, showing a strong correlation (r = 0.88, P < 0.001) in a scatter plot (Figure 6F). Our analysis revealed that the turquoise module showed the highest correlation with pyroptosis (r = 0.86, P <0.001), as depicted in Figure 6G.
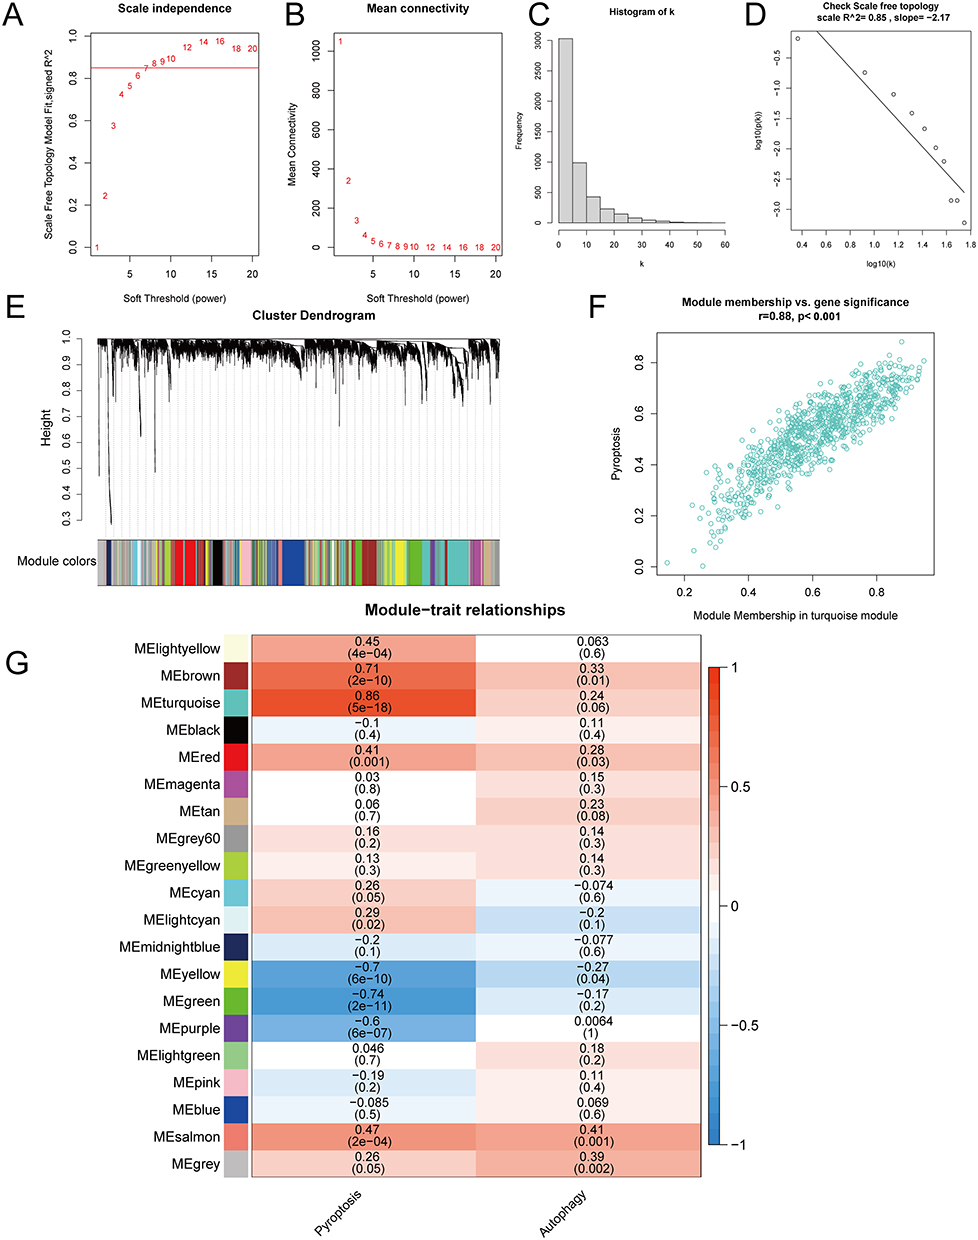 |
Figure 6 WGCNA analysis of pyroptosis and autophagy between osteoarthritis and rheumatoid arthritis. (A) Soft threshold selection with R-squared plotted against the soft threshold. (B) Soft threshold selection with the mean connectivity plotted against the soft threshold. (C) Connectivity histogram at soft threshold of 8. (D) Soft threshold validation with log10 (k) plotted against log10 (p(k)), with a network considered scale-free if the R-squared is greater than or equal to 0.85. (E) Gene clustering into modules. (F) Scatter plot of the correlation between the turquoise module genes, the module, and pyroptosis. (G) Heatmap of the correlation between modules and cell pyroptosis and autophagy. |
PPI Network of RNA Modification-Pyroptosis-Related Genes
We identified the intersection genes between the turquoise module and the differentially expressed RNA modification-related genes distinguishing OA from RA (Figure 7A), and further filtered for genes with an interaction score greater than 700 in the PPI network (Figure 7B). The resulting genes were visualized using Cytoscape (Figure 7C), and the cytoHubba plugin was used to perform a topological analysis of the network. The MCC algorithm identified the top 6 genes as hub genes: CXCL10, CXCL9, CCR7, CCL5, CXCL1, CCR2 (Figure 7D).
 |
Figure 7 PPI network of the intersection between module genes and differentially expressed RNA modification-related genes. (A) Venn diagram of the intersection between module genes and differentially expressed RNA modification-related genes. (B) Venn diagram of the intersection between the intersection genes and genes interacting with a score greater than 700 in the human PPI network. (C) The PPI network graph of the intersection genes, with different colors representing the high expression of genes in different diseases, orange representing high expression in osteoarthritis, and blue representing high expression in rheumatoid arthritis. (D) Top 6 hub genes selected by the cytoHubba plugin. |
Analysis of ceRNA Interaction Network
We obtained the miRNA-mRNA and miRNA-lncRNA interaction data from the starBase database and used the hub genes to search for related miRNAs and lncRNAs. LncRNAs were screened with a threshold of greater than 10 in the number of miRNA-lncRNA relationship pairs, and the ceRNA interaction network was constructed and displayed in Cytoscape (Figure 8). Among the hub genes, genes CXCL1, CXCL10, and CCR7 were able to find interacting relationships with miRNAs. The mRNA CCR7 and the lncRNA XIST were found to have the most interacting relationships in the ceRNA network. Several miRNA genes, including hsa-let-7a-5p, hsa-let-7b-5p, hsa-let-7c-5p, hsa-let-7d-5p, hsa-let-7e-5p, hsa-let-7f-5p, hsa-let-7g-5p, hsa-let-7i-5p, hsa-miR-4458, hsa-miR-4500, and hsa-miR-98-5p, were found to have more interacting relationships. Some miRNA genes, such as hsa-let-7a-5p, hsa-let-7b-5p, hsa-let-7c-5p, hsa-let-7d-5p, hsa-let-7e-5p, hsa-let-7f-5p, hsa-let-7g-5p, hsa-let-7i-5p, hsa-miR-4458, hsa-miR-4500, and hsa-miR-98-5p, showed a greater number of interacting relationships.
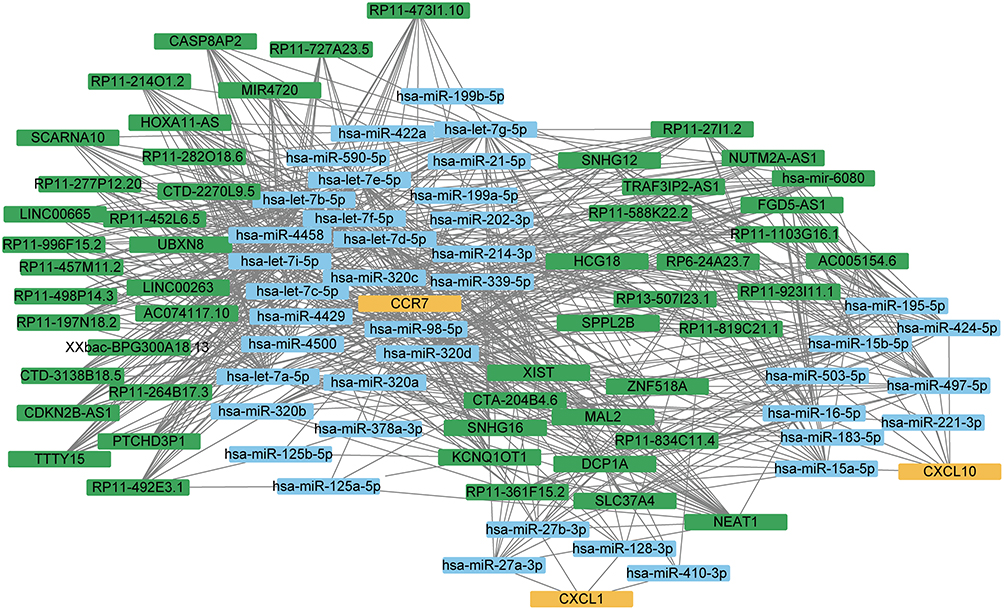 |
Figure 8 The ceRNA network graph constructed by hub genes. Different colors represent different molecular types, yellow represents mRNA, blue represents miRNA, and green represents lncRNA. |
Molecular Subtypes of OA and RA
The primary disease genes obtained from univariate logistic regression analysis and LASSO regression analysis were analyzed using the R package ConsensusClusterPlus to distinguish molecular subtypes of the two diseases. Two subtypes were identified for each disease: Cluster 1 and Cluster 2 (Figure 9A and B). The correlation between hub genes and the molecular subtypes of the two diseases was calculated using the R package corrr and visualized in a heatmap. In OA, CXCL1, CCR2, and CCR7 exhibited a negative correlation in cluster 1, while showing a positive correlation in cluster 2 (Figure 9C). Conversely, in RA, the correlation of these three hub genes with the two clusters displayed a trend opposite to that observed in OA (Figure 9D).
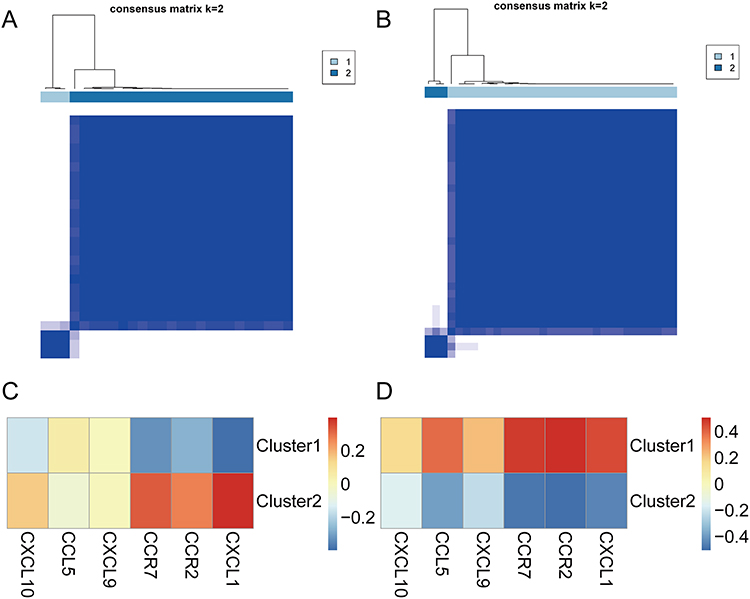 |
Figure 9 Molecular subtypes of osteoarthritis and rheumatoid arthritis. (A) Consensus clustering results in osteoarthritis. (B) Consensus clustering results in rheumatoid arthritis. (C) Heatmap of the correlation between the two molecular subtypes and the hub genes in osteoarthritis, with red indicating a strong positive correlation and blue indicating a strong negative correlation. (D) Heatmap of the correlation between the two molecular subtypes and the hub genes in rheumatoid arthritis, with red indicating a strong positive correlation and blue indicating a strong negative correlation. |
Correlation Analysis and Immune Infiltration Analysis
The correlation between the differentially expressed RNA modification-related genes between OA and RA was calculated using the R package “corrr” and a correlation network graph was generated (Figure 10A), showing only lines with a Pearson correlation coefficient greater than 0.7. The correlation was commonly observed between differentially expressed RNA modification-related genes, such as OGN, SCG2, PTN, COMP, CD69, SIK1, DDIT4, ADORA3, CX3CR1, PTGDS, MS4A1, CXCL8, APOE, DNASE1L3, CILP, FAH, C7, ADAMTSL3, ZBTB16, NOVA1, SLPI, TMEM100, MAOA, RBP4, HBEGF, ADIRF, CLIC5, GHR, CHRDL1, LPL, FABP4, PCK1, PLIN1, ADIPOQ, and ADH1B. The CIBERSORT algorithm was applied to calculate the cell abundance of 22 immune cell types based on differentially expressed RNA modification-related genes between OA and RA. The correlation between hub genes and 22 immune cell types was calculated using the R package “corrr” and displayed as a heatmap (Figure 10B). In the comparison data, M1 macrophage showed a strong positive correlation with genes CXCL10 and CXCL9 (r = 0.91 and 0.87, respectively) while M2 macrophage showed a strong negative correlation with gene CCR7 (r = −0.66). Mast cells resting showed a strong negative correlation with gene CXCL9 (r = −0.65).
 |
Figure 10 Immune infiltration and correlation analysis. (A) Correlation network graph between differentially expressed RNA modification-related genes in osteoarthritis and rheumatoid arthritis, where the stronger the positive correlation, the more blue the color, and the stronger the negative correlation, the more red the color. (B) Correlation heat map between the immune cells and hub genes in osteoarthritis and rheumatoid arthritis, where the stronger the positive correlation, the more red the color, and the stronger the negative correlation, the more blue the color. |
Single-Cell Analysis of OA
After analyzing samples from OA patients, this study obtained a total of 25,245 cells by filtering and meeting quality control standards (Figure 11A–C). A strong correlation of 0.93 between nCount_RNA and nFeature_RNA was calculated (Figure 11D), as expected. The top 1000 highly variable genes were extracted (Figure 11E) and PCA dimensionality reduction was performed on the normalized data. Using Seurat’s “FindNeighbors” and “FindClusters” functions, the cells were grouped into 15 clusters for cell type identification. Finally, UMAP dimensionality reduction was applied to visualize the 15 distinct clusters (Figure 11F).
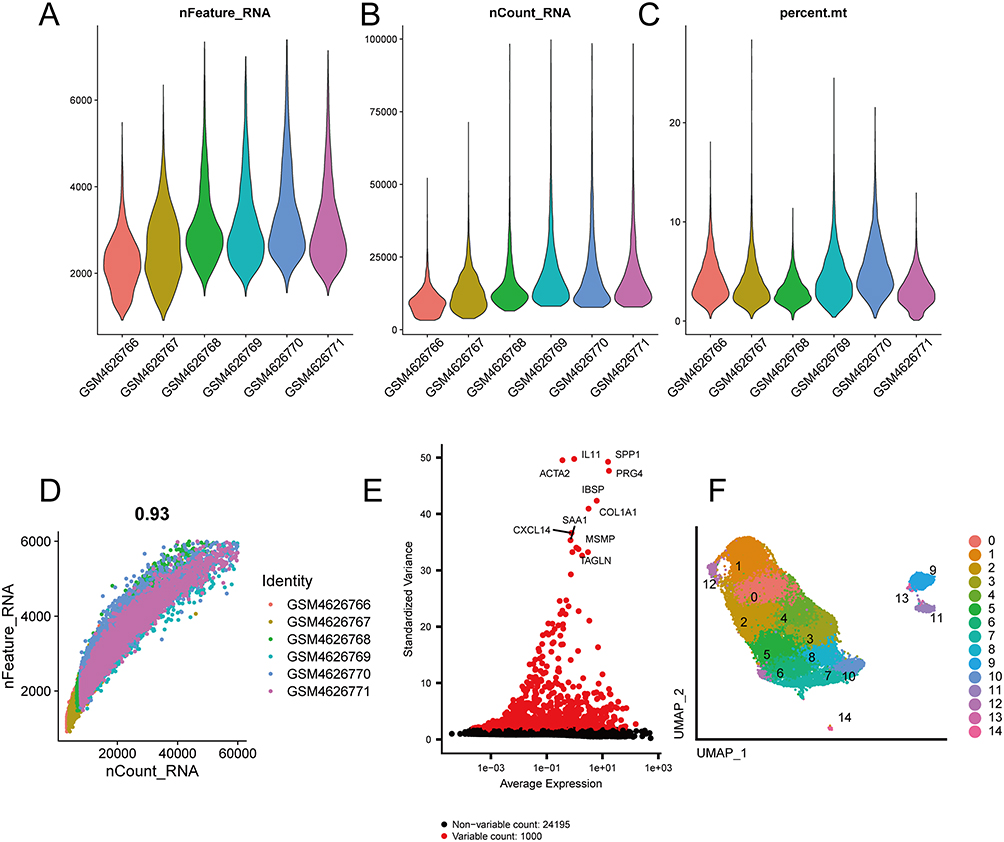 |
Figure 11 Data quality control. (A) Gene number violin plot in samples. (B) Sequencing read counts violin plot in samples. (C) Mitochondrial proportion violin plot in samples. (D) Correlation scatter plot between gene numbers and read counts. (E) High variance gene scatter plot. (F) UMAP graph of 15 cell clusters. |
The identification of 15 cell clusters was determined as 7 subtypes of chondrocyte cell types based on gene markers (Figure 12H). The subtypes were HomC (7659, 30.34%) for clusters 0, 4, 9, 11, 13, and 14, HTC (3458, 13.70%) for cluster 1, RepC (3342, 13.24%) for cluster 2, RegC (2444, 9.68%) for cluster 3, preHTC (3719, 14.73%) for clusters 5 and 8, FC (4184, 16.57%) for clusters 6, 7, and 10, and preFC (439, 1.74%) for cluster 12. We visualized the gene expression patterns of these cell types through UMAP using specific markers, such as IBSP for HTC (Figure 12A), COL1A2 for FC (Figure 12B), COL2A1 for RepC (Figure 12C), IL11 for preFC (Figure 12D), JUN for HomC (Figure 12E), CHI3L1 for RegC (Figure 12F), and TGFBI for preHTC (Figure 12G). Furthermore, we also examined the distribution of OA cells and normal cells using UMAP (Figure 12I) and found that the distribution of the two cell types was relatively even. The proportion of each cell type in OA cells was presented in a pie chart (Figure 12J), with HomC (2684, 24.56%), HTC (1306, 11.95%), RepC (1617, 14.80%), RegC (983, 9.00%), preHTC (1851, 16.94%), FC (2250, 20.59%), and preFC (236, 2.16%). Additionally, we presented the number of each cell type in OA cells and normal cells in a bar graph (Figure 12K). We observed that the proportion of HomC cells in normal cells (4975, 34.75%) was higher than the proportion in OA cells (2684, 24.56%), whereas the proportion of FC cells in OA cells (2250, 20.59%) was higher than the proportion in normal cells (1953, 13.51%).
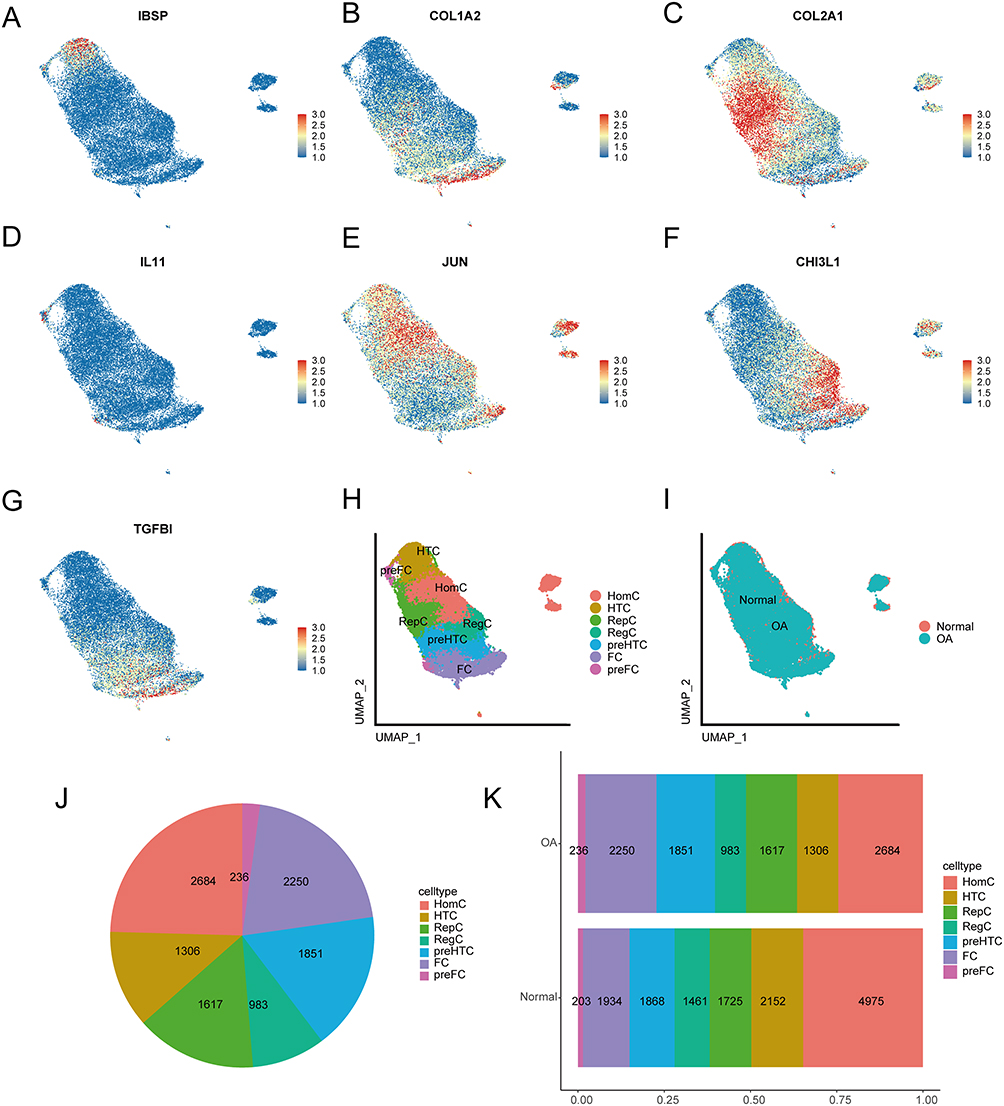 |
Figure 12 Cell annotations. (A) UMAP plot of IBSP gene expression. (B) UMAP plot of COL1A2 gene expression. (C) UMAP plot of COL2A1 gene expression. (D) UMAP plot of IL11 gene expression. (E) UMAP plot of JUN gene expression. (F) UMAP plot of CHI3L1 gene expression. (G) UMAP plot of TGFBI gene expression. (H) UMAP plot of the 7 manually annotated cell types. (I) UMAP plot of the distribution of osteoarthritis and normal cells. (J) Pie chart of the proportion of cell types in osteoarthritis and normal cells. (K) Bar graph of the proportion of cell types in osteoarthritis cells. |
Expression and Correlation of Intersected Genes Between Differentially Expressed Genes of Cell Populations and OA Primary Disease Genes
We analyzed the 7 cell types and identified differentially expressed genes using the default parameters of “FindAllMarkers” (Supplementary Table 4). We randomly selected 200 cells for each cell type and created heat maps of the top 2 differentially expressed genes for each (Figure 13A). Four genes were found that intersected between the differentially expressed genes and the primary disease genes in OA: OGN, TNFRSF11B, SCARA3, and PTN. A violin plot displayed their expression in each cell type (Figure 13B). OGN showed high expression in all cell groups except for HTC, TNFRSF11B was highest in preFC cells, SCARA3 had low expression in all cell groups, and PTN had little expression in most groups except for HomC, RepC, and FC. We calculated the correlation of gene expression values with OA and normal cells using the R package “corrr”, and visualized the results as a bubble plot (Figure 13C). OGN had the strongest correlation with OA (r = 0.54), while TNFRSF11B also showed a significant correlation with OA (r = 0.39).
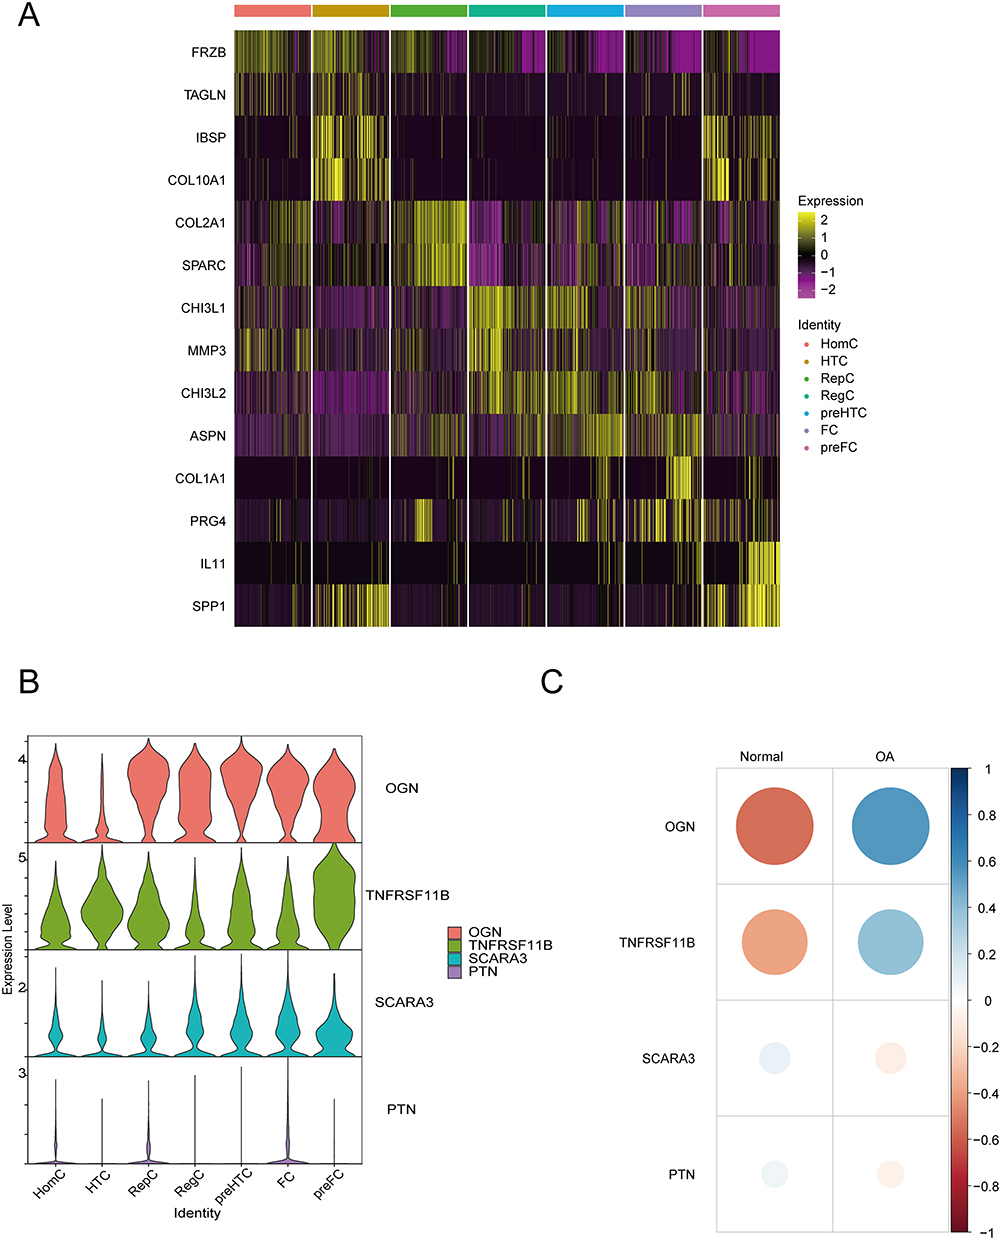 |
Figure 13 Differentially expressed genes and primary genes associated with the disease. (A) Heat map of top 2 differentially expressed genes between cell groups. (B) Violin plot showing the expression pattern of the intersection of differentially expressed genes and primary disease genes in different cell types. (C) Bubble plot analyzing the correlation of the intersection of differentially expressed genes and primary disease genes with osteoarthritis and normal cells. |
Validation of the Primary RNA Modification-Related Genes in OA and RA
After examining the HE-stained synovial tissues of knee joints from RA and OA patients, we observed more severe synovial inflammation in RA tissues, including synovial hyperplasia, lymphocyte infiltration, and neovascularization. We evaluated the HE staining results of OA and synovial tissues based on the Krenn synovitis Score.58 The scoring outcomes between OA and RA showed significant differences. The IHC results showed a significant upregulation in the expression of ADAMDEC1 and IGHM proteins in the synovial tissue of RA compared to OA (Figure 14A). We established a mouse model of osteoarthritis using DMM surgery to investigate the impact of OA primary RNA modification-related genes on the disease’s progression in vivo. After 12 weeks, we collected mouse specimens and performed various staining and IHC tests to evaluate morphological differences between the groups. Our results showed that mice in the DMM group exhibited significant cartilage damage compared to the sham group, including thinner cartilage, surface irregularities, increased collagen fibers, and elevated OARSI scores (Figure 14B–D). We also found that the expression of four OA primary RNA modification-related genes (OGN, TNFRSF11B, SCARA3, and PTN) was significantly higher in the DMM group than in the sham group, suggesting their potential involvement in OA progression (Figure 14E). Our findings provide insights into the role of RNA modification-related genes in the development of OA and RA.
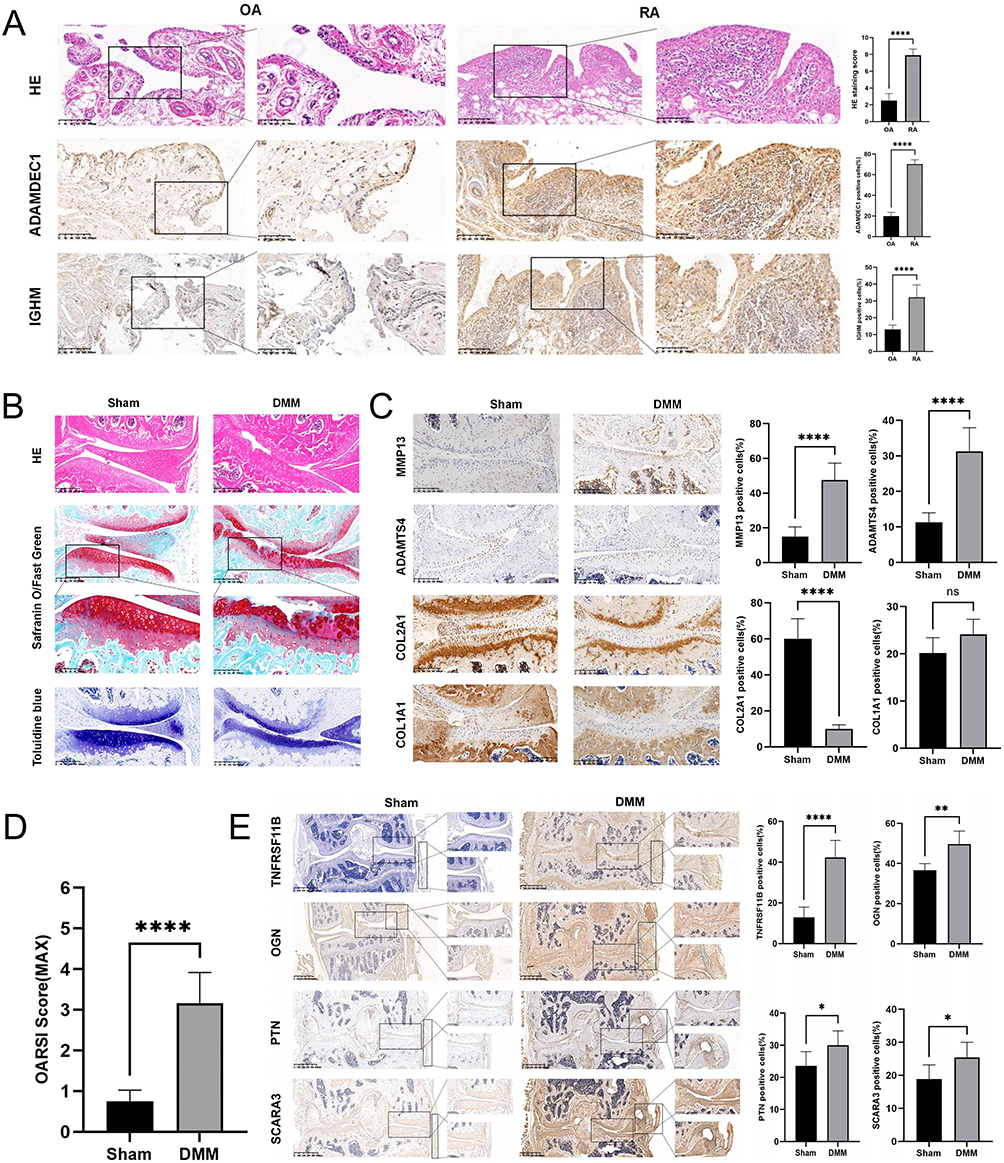 |
Figure 14 Validation of biomarkers. (A) IHC for ADAMDEC1 and IGHM, as well as HE staining and its scoring on RA and OA synovial tissues (n = 10 per group). (B) HE staining, Safranin-O/Fast Green staining, and Toluidine Blue staining of the sham group and DMM group. (C) IHC of cartilage metabolic biomarkers. (D) OARSI score of knee joints in each group of mice. (E) IHC of OGN, TNFRSF11B, SCARA3, and PTN in the sham group and DMM group (n = 6 per group). Scale bar = 200μm, *P < 0.05, **P < 0.01, and ****P < 0.0001. |
Discussion
RNA modification refers to the chemical modifications that occur on RNA molecules, which can affect various aspects of RNA function such as stability, localization, translation, and splicing. Among the different types of RNA modifications, m1A, m6A and m5C have been shown to play a role in the pathogenesis of OA and RA. Changing the RNA methylation level of target genes may affect the expression of these genes, thus reversing the pathogenesis of the disease. RNA methylation-related enzymes and their targets may become new diagnostic markers and therapeutic targets, and may open up new avenues for the treatment of human degenerative disease.
In this study, we combined RNA microarray and scRNA-seq data to identify 6 RNA modification-related genes (ADAMDEC1, IGHM, OGN, TNFRSF11B, SCARA3, and PTN) that may be potential biomarkers involved in the pathogenesis of OA and RA using differential analysis, univariate logistic regression, lasso regression analysis and single-cell analysis. The expression levels of these genes were validated in human knee synovial tissue from OA and RA patients, as well as in a mouse DMM model. Functional enrichment analysis was performed using GO, KEGG, GSEA, and GSVA to analyze the functional enrichment of differentially expressed RNA modification-related genes between RA and OA, revealing changes in the distribution of signalling pathways. Pyroptosis-related genes were selected through WGCNA analysis, and a PPI network was constructed by intersecting differentially expressed RNA modification-related genes. The top six genes (CXCL10, CXCL9, CCR7, CCL5, CXCL1 and CCR2) were identified as hub genes for ceRNA interaction network analysis, correlation analysis with OA and RA molecular subtypes, as well as correlation analysis with 22 immune cells. Our research revealed the significance of RNA modification-related genes in the development of OA and RA pathogenesis.
Our study provides a comprehensive analysis of the differential expression of RNA modification-related genes in OA and RA. As our results demonstrate, there is a pronounced difference in the expression of these genes between the two conditions. Delving deeper into the molecular functions and pathways associated with these genes, we found significant enrichment in pathways such as Cytokine−cytokine receptor interaction, Chemokine signaling pathway, IL−17 signaling pathway, NF−kappa B signaling pathway, and TNF signaling pathway. These pathways are intricately linked to immune responses and cellular growth alterations, underscoring the complex interplay of molecular mechanisms in OA and RA.
GSVA and GSEA further highlighted the distinct molecular landscapes of OA and RA. While OA predominantly exhibited enrichment in metabolic pathways, reflecting its degenerative nature, RA was characterized by a robust enrichment in immune-related pathways. This distinction aligns with the fundamental pathophysiological differences between the two diseases. In OA, the observed metabolic changes might be attributed to alterations in the biomechanical environment of the joint or intrinsic cellular changes within chondrocytes.59 Disruptions in these metabolic processes can lead to the accumulation of harmful by-products, further exacerbating cartilage degradation.60 On the other hand, RA, being an autoimmune disorder, showcases the pivotal role of immune dysregulation, with the body’s immune system erroneously targeting joint tissues.61
Considering the distinct molecular mechanism of two diseases, we postulate that autophagy and pyroptosis, as downstream phenotypes of cellular stress, can reflect the differences in RNA modifications between OA and RA to some extent. Our gene screening identified six hub genes, all of which are chemokines, chemokine receptors, or their ligands. The differential RNA methylation patterns of these genes might be pivotal in driving the disparities observed between OA and RA. To further elucidate the interactions of these hub genes, we constructed PPI and ceRNA networks, offering potential insights into the regulatory patterns of RNA methylation in the future.
Our subsequent consistency clustering of OA and RA samples revealed an intriguing observation: genes such as CXCL1, CCR2, and CCR7 exhibited completely opposite correlations in different clusters of the two diseases. Such differential clustering might be indicative of varying disease progression stages between OA and RA. However, the limited sample size and the absence of comprehensive patient information restrict our ability to correlate sample clusters with disease severity or other etiological factors. Future research, with a more extensive dataset and detailed patient profiles, can potentially shed light on the molecular subtypes of OA and RA, reflecting disease progression and the dynamic changes in RNA methylation patterns across different disease stages.
ADAMDEC1 is a gene that has been implicated in the pathogenesis of various diseases. It encodes a protein belonging to the ADAM (a disintegrin and metalloproteinase) family, which plays important roles in cell signaling, adhesion, and proteolysis.62 ADAMDEC1 is known to promote inflammation and tissue destruction in several conditions, such as rosacea, colitis, and cancer.63–65 In RA, ADAMDEC1 has been confirmed to have high expression in the synovial fluid, contributing to the disease pathology by inducing the production of pro-inflammatory cytokines, chemokines, and matrix metalloproteinases, leading to cartilage and bone destruction.66 Understanding ADAMDEC1’s functions and mechanisms in disease pathogenesis may provide valuable insights into developing targeted therapies for these conditions.
IGHM produces the immunoglobulin M (IgM) heavy chain, and acts as a vital component of antibodies made by B cells in the immune system. IgM plays a vital role in identifying and removing foreign substances, such as viruses and bacteria, from the body.67 However, IGHM is also involved in the development of autoimmune diseases like RA.68 In the case of RA, IGHM is involved in the production of autoantibodies that target self-antigens, activating B cells to produce them. While the exact role of IGHM in OA remains to be elucidated, its presence or altered levels might serve as a potential biomarker for distinguishing inflammatory components in OA from those in RA.69
Recently, OGN has been linked to the development of diseases like OA and cancer. In OA, OGN contributes to cartilage degradation by increasing the production of matrix metalloproteinases (MMPs), enzymes that break down extracellular matrix components.70,71 OGN also stimulates immune cells and leads to inflammation by producing pro-inflammatory cytokines.70 In cancer, OGN has tumor-promoting or tumor-suppressive effects depending on the type of cancer and cellular context.72
TNFRSF11B, also known as osteoprotegerin (OPG), is a gene that produces a protein critical in regulating bone metabolism. OPG is a soluble receptor that binds to and neutralizes the activity of RANKL, a protein that stimulates bone resorption.73 OPG is thus a key regulator of bone homeostasis, and its dysregulation has been implicated in various bone-related diseases such as osteoporosis,74 RA,75 and bone metastasis of cancer.76 Alejandro’s research revealed consistent upregulation of TNFRSF11B in lesioned OA cartilage, which may directly drive the chondrocyte to osteoblast transition observed in OA pathophysiology.77
SCARA3 is a scavenger receptor that plays a role in recognizing and removing various extracellular substances, such as oxidative molecules or harmful products of oxidation.78 Recent research has linked SCARA3 to several diseases, including cancer and neurodegenerative disorders.79,80 In cancer, SCARA3 acts as a tumor suppressor by inhibiting the growth and spread of cancer cells, while promoting cell death.81 Low levels of SCARA3 in tumors are associated with a poor prognosis. In neurodegenerative disorders such as Alzheimer’s disease, SCARA3 helps clear beta-amyloid protein, a key pathological feature of the disease.82 The tumor-like proliferation of RA synovium, coupled with the degenerative characteristics shared by OA and Alzheimer’s disease, suggests that the mechanistic role of SCARA3 in these conditions could provide pivotal insights for future research into OA and RA.
PTN is involved in various cellular processes like cell proliferation, differentiation, and migration, and has recently been linked to OA and RA.83 In OA, PTN’s expression is increased in cartilage and synovial fluid and linked to disease severity.84 PTN is believed to contribute to OA pathogenesis by promoting inflammation, chondrocyte death, and breakdown of extracellular matrix.85 In RA, PTN has been implicated in promoting synovial inflammation and hyperplasia. RA patients show elevated PTN levels in their synovium, which are associated with disease activity.86
Although this study provides valuable insights, it is important to acknowledge its limitations. The number of samples verified in the study is relatively small and was obtained from a single center. Consequently, this may have introduced bias in the experimental results. In order to confirm our findings, we intend to continue collecting cases for a multicenter study with a larger sample size. Moreover, to establish the clinical relevance of the potential biomarkers and pathways identified in this study, it is necessary to validate their biological function through in vitro and in vivo experiments. This will provide practical evidence for targeted therapy in a clinical setting.
Conclusion
By utilizing single-cell analysis, WGCNA, differential expression analysis, and various machine learning techniques, we have identified ADAMDEC1 and IGHM as potential biomarkers related to RNA modification for RA, and OGN, TNFRSF11B, SCARA3, and PTN as potential RNA modification-related biomarkers for OA. We have confirmed these results through immunohistochemistry performed on tissue samples. We plan to further investigate their potential value in RNA modification mechanisms, diagnosis, and treatment.
Data Sharing Statement
The data supporting the results of the study is available from the GEO database (https://www.ncbi.nlm.nih.gov/geo/) and and the name of the database and accession number(s) can be found in the article. The code used for our analysis was uploaded to GitHub (https://github.com/JEASTYJJ/Code.git).
Ethics Approval Statement
The study adhered to the guidelines set forth by the Declaration of Helsinki. Ethical approval for research involving human participants was granted by the Biomedical Research Ethics Committee at HongHui Hospital, affiliated with Xi'an Jiaotong University (No. 202211012, November 28, 2022). The participants provided their written informed consent to participate in this study. All animal experiments were conducted in strict accordance with the ARRIVE guidelines and adhered to the “3Rs” principles of animal welfare, emphasizing Replacement, Reduction, and Refinement. The study protocols were duly approved by the Animal Care and Use Committee of Xi’an Jiaotong University (No. 2022-1634, December 1, 2022).
Acknowledgments
We are grateful to the patients for their contributions to this study.
Funding
This work was supported by funding from the National Natural Science Foundation of China (No. 82072432).
Disclosure
The authors report no conflicts of interest in this work.
References
1. Arden N, Nevitt MC. Osteoarthritis: epidemiology. Best Pract Res Clin Rheumatol. 2006;20(1):3–25. doi:10.1016/j.berh.2005.09.007
2. Scherer HU, Häupl T, Burmester GR. The etiology of rheumatoid arthritis. J Autoimmun. 2020;110:102400. doi:10.1016/j.jaut.2019.102400
3. Beasley J. Osteoarthritis and rheumatoid arthritis: conservative therapeutic management. J Hand Ther. 2012;25(2):163–71; quiz 172. doi:10.1016/j.jht.2011.11.001
4. Battistelli M, Favero M, Burini D, et al. Morphological and ultrastructural analysis of normal, injured and osteoarthritic human knee menisci. Eur J Histochem. 2019;63(1). doi:10.4081/ejh.2019.2998
5. Belluzzi E, Macchi V, Fontanella CG, et al. Infrapatellar fat pad gene expression and protein production in patients with and without osteoarthritis. Int J Mol Sci. 2020;21(17):6016. doi:10.3390/ijms21176016
6. Donell S. Subchondral bone remodelling in osteoarthritis. EFORT Open Rev. 2019;4(6):221–229. doi:10.1302/2058-5241.4.180102
7. Smith MH, Berman JR. What is rheumatoid arthritis? JAMA. 2022;327(12):1194. doi:10.1001/jama.2022.0786
8. Warner SC, Valdes AM. The genetics of osteoarthritis: a review. J Funct Morphol Kinesiol. 2016;1(1):140–153. doi:10.3390/jfmk1010140
9. smolen JS, Aletaha D, McInnes IB. Rheumatoid arthritis. Lancet. 2016;388(10055):2023–2038. doi:10.1016/s0140-6736(16)30173-8
10. Lin YJ, Anzaghe M, Schülke S. Update on the pathomechanism, diagnosis, and treatment options for rheumatoid arthritis. Cells. 2020;9(4):880.
11. Zeng ZL, Xie H. Mesenchymal stem cell-derived extracellular vesicles: a possible therapeutic strategy for orthopaedic diseases: a narrative review. Biomater Transl. 2022;3(3):175–187. doi:10.12336/biomatertransl.2022.03.002
12. Liu H, Zhang H, Wang S, et al. Bone-targeted bioengineered bacterial extracellular vesicles delivering siRNA to ameliorate osteoporosis. Compos Part B Eng. 2023;255:110610. doi:10.1016/j.compositesb.2023.110610
13. Li J, Zhang H, Han Y, Hu Y, Geng Z, Su J. Targeted and responsive biomaterials in osteoarthritis. Theranostics. 2023;13(3):931–954. doi:10.7150/thno.78639
14. Manjula-Basavanna A, Duraj-Thatte AM, Joshi NS. Robust self-regeneratable stiff living materials fabricated from microbial cells. Adv Funct Mater. 2021;31(19):2010784.
15. Wang Y, Chen Y, Wei Y. Osteoarthritis animal models for biomaterial-assisted osteochondral regeneration. Biomater Transl. 2022;3(4):264–279. doi:10.12336/biomatertransl.2022.04.006
16. Kirkland JL, Tchkonia T. Senolytic drugs: from discovery to translation. J Intern Med. 2020;288(5):518–536. doi:10.1111/joim.13141
17. Evans CH, Ghivizzani SC, Robbins PD. Osteoarthritis gene therapy in 2022. Curr Opin Rheumatol. 2023;35(1):37–43. doi:10.1097/bor.0000000000000918
18. Abbasi M, Mousavi MJ, Jamalzehi S, et al. Strategies toward rheumatoid arthritis therapy; the old and the new. J Cell Physiol. 2019;234(7):10018–10031. doi:10.1002/jcp.27860
19. Sanchez-Lopez E, Coras R, Torres A, Lane NE, Guma M. Synovial inflammation in osteoarthritis progression. Nat Rev Rheumatol. 2022;18(5):258–275. doi:10.1038/s41584-022-00749-9
20. Abramoff B, Caldera FE. Osteoarthritis: pathology, Diagnosis, and Treatment Options. Med Clin North Am. 2020;104(2):293–311. doi:10.1016/j.mcna.2019.10.007
21. McInnes IB, Schett G. The pathogenesis of rheumatoid arthritis. N Engl J Med. 2011;365(23):2205–2219. doi:10.1056/NEJMra1004965
22. Fearon U, Canavan M, Biniecka M, Veale DJ. Hypoxia, mitochondrial dysfunction and synovial invasiveness in rheumatoid arthritis. Nat Rev Rheumatol. 2016;12(7):385–397. doi:10.1038/nrrheum.2016.69
23. Shin JI, Lee KH, Joo YH, et al. Inflammasomes and autoimmune and rheumatic diseases: a comprehensive review. J Autoimmun. 2019;103:102299. doi:10.1016/j.jaut.2019.06.010
24. Rockel JS, Kapoor M. Autophagy: controlling cell fate in rheumatic diseases. Nat Rev Rheumatol. 2016;12(9):517–531. doi:10.1038/nrrheum.2016.92
25. Karami J, Masoumi M, Khorramdelazad H, et al. Role of autophagy in the pathogenesis of rheumatoid arthritis: latest evidence and therapeutic approaches. Life Sci. 2020;254:117734. doi:10.1016/j.lfs.2020.117734
26. Nakahira K, Haspel JA, Rathinam VA, et al. Autophagy proteins regulate innate immune responses by inhibiting the release of mitochondrial DNA mediated by the NALP3 inflammasome. Nat Immunol. 2011;12(3):222–230. doi:10.1038/ni.1980
27. England BR, Thiele GM, Anderson DR, Mikuls TR. Increased cardiovascular risk in rheumatoid arthritis: mechanisms and implications. BMJ. 2018;361:k1036. doi:10.1136/bmj.k1036
28. Barbieri I, Kouzarides T. Role of RNA modifications in cancer. Nat Rev Cancer. 2020;20(6):303–322. doi:10.1038/s41568-020-0253-2
29. Zhao BS, Roundtree IA, He C. Post-transcriptional gene regulation by mRNA modifications. Nat Rev Mol Cell Biol. 2017;18(1):31–42. doi:10.1038/nrm.2016.132
30. Zhai G, Xiao L, Jiang C, et al. Regulatory Role of N6-Methyladenosine (m6A) Modification in Osteoarthritis. Front Cell Dev Biol. 2022;10:946219. doi:10.3389/fcell.2022.946219
31. Han J, Kong H, Wang X, Zhang XA. Novel insights into the interaction between N6-methyladenosine methylation and noncoding RNAs in musculoskeletal disorders. Cell Prolif. 2022;55(10):e13294. doi:10.1111/cpr.13294
32. Zhou W, Wang X, Chang J, Cheng C, Miao C. The molecular structure and biological functions of RNA methylation, with special emphasis on the roles of RNA methylation in autoimmune diseases. Crit Rev Clin Lab Sci. 2022;59(3):203–218. doi:10.1080/10408363.2021.2002256
33. Cui L, Ma R, Cai J, et al. RNA modifications: importance in immune cell biology and related diseases. Signal Transduct Target Ther. 2022;7(1):334. doi:10.1038/s41392-022-01175-9
34. Chou CH, Jain V, Gibson J, et al. Synovial cell cross-talk with cartilage plays a major role in the pathogenesis of osteoarthritis. Sci Rep. 2020;10(1):10868. doi:10.1038/s41598-020-67730-y
35. Woetzel D, Huber R, Kupfer P, et al. Identification of rheumatoid arthritis and osteoarthritis patients by transcriptome-based rule set generation. Arthritis Res Ther. 2014;16(2):R84. doi:10.1186/ar4526
36. Xuan JJ, Sun WJ, Lin PH, et al. RMBase v2.0: deciphering the map of RNA modifications from epitranscriptome sequencing data. Nucleic Acids Res. 2018;46(D1):D327–d334. doi:10.1093/nar/gkx934
37. Ma J, Song B, Wei Z, et al. m5C-Atlas: a comprehensive database for decoding and annotating the 5-methylcytosine (m5C) epitranscriptome. Nucleic Acids Res. 2022;50(D1):D196–d203. doi:10.1093/nar/gkab1075
38. Zhang Y, Parmigiani G, Johnson WE. ComBat-seq: batch effect adjustment for RNA-seq count data. NAR Genom Bioinform. 2020;2(3):lqaa078. doi:10.1093/nargab/lqaa078
39. Ritchie ME, Phipson B, Wu D, et al. limma powers differential expression analyses for RNA-sequencing and microarray studies. Nucleic Acids Res. 2015;43(7):e47. doi:10.1093/nar/gkv007
40. Szklarczyk D, Gable AL, Nastou KC, et al. The STRING database in 2021: customizable protein-protein networks, and functional characterization of user-uploaded gene/measurement sets. Nucleic Acids Res. 2021;49(D1):D605–d612. doi:10.1093/nar/gkaa1074
41. Shannon P, Markiel A, Ozier O, et al. Cytoscape: a software environment for integrated models of biomolecular interaction networks. Genome Res. 2003;13(11):2498–2504. doi:10.1101/gr.1239303
42. Friedman J, Hastie T, Tibshirani R. Regularization paths for generalized linear models via coordinate descent. J Stat Softw. 2010;33(1):1–22. doi:10.18637/jss.v033.i01
43. Gaudet P, Logie C, Lovering RC, Kuiper M, Lægreid A, Thomas PD. Gene Ontology representation for transcription factor functions. Biochim Biophys Acta Gene Regul Mech. 2021;1864(11–12):194752. doi:10.1016/j.bbagrm.2021.194752
44. Kanehisa M, Goto S. KEGG: kyoto encyclopedia of genes and genomes. Nucleic Acids Res. 2000;28(1):27–30. doi:10.1093/nar/28.1.27
45. Subramanian A, Tamayo P, Mootha VK, et al. Gene set enrichment analysis: a knowledge-based approach for interpreting genome-wide expression profiles. Proc Natl Acad Sci U S A. 2005;102(43):15545–15550. doi:10.1073/pnas.0506580102
46. Hänzelmann S, Castelo R, Guinney J. GSVA: gene set variation analysis for microarray and RNA-seq data. BMC Bioinform. 2013;14(1):7. doi:10.1186/1471-2105-14-7
47. Yu G, Wang LG, Han Y, He QY. clusterProfiler: an R package for comparing biological themes among gene clusters. Omics. 2012;16(5):284–287. doi:10.1089/omi.2011.0118
48. Langfelder P, Horvath S. WGCNA: an R package for weighted correlation network analysis. BMC Bioinform. 2008;9(1):559. doi:10.1186/1471-2105-9-559
49. Chin CH, Chen SH, Wu HH, Ho CW, Ko MT, Lin CY. cytoHubba: identifying hub objects and sub-networks from complex interactome. BMC Syst Biol. 2014;8(Suppl4):S11. doi:10.1186/1752-0509-8-s4-s11
50. Li JH, Liu S, Zhou H, Qu LH, Yang JH. starBase v2.0: decoding miRNA-ceRNA, miRNA-ncRNA and protein-RNA interaction networks from large-scale CLIP-Seq data. Nucleic Acids Res. 2014;42(Databaseissue):D92–7. doi:10.1093/nar/gkt1248
51. Wilkerson MD, Hayes DN. ConsensusClusterPlus: a class discovery tool with confidence assessments and item tracking. Bioinformatics. 2010;26(12):1572–1573. doi:10.1093/bioinformatics/btq170
52. Chen B, Khodadoust MS, Liu CL, Newman AM, Alizadeh AA. Profiling Tumor Infiltrating Immune Cells with CIBERSORT. Methods Mol Biol. 2018;1711:243–259. doi:10.1007/978-1-4939-7493-1_12
53. Satija R, Farrell JA, Gennert D, Schier AF, Regev A. Spatial reconstruction of single-cell gene expression data. Nat Biotechnol. 2015;33(5):495–502. doi:10.1038/nbt.3192
54. Ringnér M. What is principal component analysis? Nat Biotechnol. 2008;26(3):303–304. doi:10.1038/nbt0308-303
55. Ji Q, Zheng Y, Zhang G, et al. Single-cell RNA-seq analysis reveals the progression of human osteoarthritis. Ann Rheum Dis. 2019;78(1):100–110. doi:10.1136/annrheumdis-2017-212863
56. Thysen S, Luyten FP, Lories RJ. Targets, models and challenges in osteoarthritis research. Dis Model Mech. 2015;8(1):17–30. doi:10.1242/dmm.016881
57. Bannuru RR, Osani MC, Vaysbrot EE, et al. OARSI guidelines for the non-surgical management of knee, Hip, and polyarticular osteoarthritis. Osteoarthritis Cartilage. 2019;27(11):1578–1589. doi:10.1016/j.joca.2019.06.011
58. Krenn V, Morawietz L, Burmester GR, et al. Synovitis score: discrimination between chronic low-grade and high-grade synovitis. Histopathology. 2006;49(4):358–364. doi:10.1111/j.1365-2559.2006.02508.x
59. Zheng L, Zhang Z, Sheng P, Mobasheri A. The role of metabolism in chondrocyte dysfunction and the progression of osteoarthritis. Ageing Res Rev. 2021;66:101249. doi:10.1016/j.arr.2020.101249
60. Mobasheri A, Rayman MP, Gualillo O, Sellam J, van der Kraan P, Fearon U. The role of metabolism in the pathogenesis of osteoarthritis. Nat Rev Rheumatol. 2017;13(5):302–311. doi:10.1038/nrrheum.2017.50
61. Catrina AI, Deane KD, Scher JU. Gene, environment, microbiome and mucosal immune tolerance in rheumatoid arthritis. Rheumatology. 2016;55(3):391–402. doi:10.1093/rheumatology/keu469
62. Qi H, Wang P, Sun H, et al. ADAMDEC1 accelerates GBM progression via activation of the MMP2-related pathway. Front Oncol. 2022;12:945025. doi:10.3389/fonc.2022.945025
63. Jimenez-Pascual A, Hale JS, Kordowski A, et al. ADAMDEC1 maintains a growth factor signaling loop in cancer stem cells. Cancer Discov. 2019;9(11):1574–1589. doi:10.1158/2159-8290.Cd-18-1308
64. Liu T, Deng Z, Xie H, et al. ADAMDEC1 promotes skin inflammation in rosacea via modulating the polarization of M1 macrophages. Biochem Biophys Res Commun. 2020;521(1):64–71. doi:10.1016/j.bbrc.2019.10.073
65. Jasso GJ, Jaiswal A, Varma M, et al. Colon stroma mediates an inflammation-driven fibroblastic response controlling matrix remodeling and healing. PLoS Biol. 2022;20(1):e3001532. doi:10.1371/journal.pbio.3001532
66. Kang L, Dai C, Wang L, Pan X. Potential biomarkers that discriminate rheumatoid arthritis and osteoarthritis based on the analysis and validation of datasets. BMC Musculoskelet Disord. 2022;23(1):319. doi:10.1186/s12891-022-05277-x
67. Ferjeni Z, Raouia F, Abida O, Penha-Gonçalves C, Masmoudi H. Association of IGHM polymorphisms with susceptibility to type 1 diabetes. Immunol Res. 2022;70(3):325–330. doi:10.1007/s12026-021-09252-x
68. Yin L, Hou W, Liu L, et al. IgM Repertoire Biodiversity is Reduced in HIV-1 Infection and Systemic Lupus Erythematosus. Front Immunol. 2013;4:373. doi:10.3389/fimmu.2013.00373
69. Frezza D, DiCarlo E, Hale C, et al. Computer Vision Analysis of Rheumatoid Arthritis Synovium Reveals Lymphocytic Inflammation is Associated with Immunoglobulin Skewing in Blood. Arthritis Rheumatol. 2023. doi:10.1002/art.42653
70. Balakrishnan L, Nirujogi RS, Ahmad S, et al. Proteomic analysis of human osteoarthritis synovial fluid. Clin Proteomics. 2014;11(1):6. doi:10.1186/1559-0275-11-6
71. Heppner JM, Zaucke F, Clarke LA. Extracellular matrix disruption is an early event in the pathogenesis of skeletal disease in mucopolysaccharidosis I. Mol Genet Metab. 2015;114(2):146–155. doi:10.1016/j.ymgme.2014.09.012
72. Yang M, Hu H, Wu S, et al. EIF4A3-regulated circ_0087429 can reverse EMT and inhibit the progression of cervical cancer via miR-5003-3p-dependent upregulation of OGN expression. J Exp Clin Cancer Res. 2022;41(1):165. doi:10.1186/s13046-022-02368-4
73. Tobeiha M, Moghadasian MH, Amin N, Jafarnejad S. RANKL/RANK/OPG pathway: a mechanism involved in exercise-induced bone remodeling. Biomed Res Int. 2020;2020:6910312. doi:10.1155/2020/6910312
74. Tella SH, Gallagher JC. Prevention and treatment of postmenopausal osteoporosis. J Steroid Biochem Mol Biol. 2014;142:155–170. doi:10.1016/j.jsbmb.2013.09.008
75. Hu L, Liu R, Zhang L. Advance in bone destruction participated by JAK/STAT in rheumatoid arthritis and therapeutic effect of JAK/STAT inhibitors. Int Immunopharmacol. 2022;111:109095. doi:10.1016/j.intimp.2022.109095
76. Infante M, Fabi A, Cognetti F, Gorini S, Caprio M, Fabbri A. RANKL/RANK/OPG system beyond bone remodeling: involvement in breast cancer and clinical perspectives. J Exp Clin Cancer Res. 2019;38(1):12. doi:10.1186/s13046-018-1001-2
77. Rodríguez Ruiz A, Tuerlings M, Das A, et al. The role of TNFRSF11B in development of osteoarthritic cartilage. Rheumatology. 2022;61(2):856–864. doi:10.1093/rheumatology/keab440
78. Peng H, Guo Q, Su T, et al. Identification of SCARA3 with potential roles in metabolic disorders. Aging. 2020;13(2):2149–2167. doi:10.18632/aging.202228
79. Brown CO, Schibler J, Fitzgerald MP, et al. Scavenger receptor class A member 3 (SCARA3) in disease progression and therapy resistance in multiple myeloma. Leuk Res. 2013;37(8):963–969. doi:10.1016/j.leukres.2013.03.004
80. Guadagno NA, Moriconi C, Licursi V, et al. Neuroserpin polymers cause oxidative stress in a neuronal model of the dementia FENIB. Neurobiol Dis. 2017;103:32–44. doi:10.1016/j.nbd.2017.03.010
81. Kim J, You HJ, Youn C. SCARA3 inhibits cell proliferation and EMT through AKT signaling pathway in lung cancer. BMC Cancer. 2022;22(1):552. doi:10.1186/s12885-022-09631-z
82. Adewuyi EO, O’Brien EK, Nyholt DR, Porter T, Laws SM. A large-scale genome-wide cross-trait analysis reveals shared genetic architecture between Alzheimer’s disease and gastrointestinal tract disorders. Commun Biol. 2022;5(1):691. doi:10.1038/s42003-022-03607-2
83. Wang J, Liu C, Wang T, et al. Single-cell communication patterns and their intracellular information flow in synovial fibroblastic osteoarthritis and rheumatoid arthritis. Immunol Lett. 2023;263:1–13. doi:10.1016/j.imlet.2023.09.005
84. Pufe T, Bartscher M, Petersen W, Tillmann B, Mentlein R. Pleiotrophin, an embryonic differentiation and growth factor, is expressed in osteoarthritis. Osteoarthritis Cartilage. 2003;11(4):260–264. doi:10.1016/s1063-4584(02)00385-0
85. Mentlein R. Targeting pleiotropin to treat osteoarthritis. Expert Opin Ther Targets. 2007;11(7):861–867. doi:10.1517/14728222.11.7.861
86. Pufe T, Bartscher M, Petersen W, Tillmann B, Mentlein R. Expression of pleiotrophin, an embryonic growth and differentiation factor, in rheumatoid arthritis. Arthritis Rheum. 2003;48(3):660–667. doi:10.1002/art.10839
 © 2023 The Author(s). This work is published and licensed by Dove Medical Press Limited. The
full terms of this license are available at https://www.dovepress.com/terms
and incorporate the Creative Commons Attribution
- Non Commercial (unported, 3.0) License.
By accessing the work you hereby accept the Terms. Non-commercial uses of the work are permitted
without any further permission from Dove Medical Press Limited, provided the work is properly
attributed. For permission for commercial use of this work, please see paragraphs 4.2 and 5 of our Terms.
© 2023 The Author(s). This work is published and licensed by Dove Medical Press Limited. The
full terms of this license are available at https://www.dovepress.com/terms
and incorporate the Creative Commons Attribution
- Non Commercial (unported, 3.0) License.
By accessing the work you hereby accept the Terms. Non-commercial uses of the work are permitted
without any further permission from Dove Medical Press Limited, provided the work is properly
attributed. For permission for commercial use of this work, please see paragraphs 4.2 and 5 of our Terms.
Recommended articles
Serum Collagen Triple Helix Repeat Containing-1 Levels are Related to Radiological Affection and Disease Activity in Rheumatoid Arthritis
Nassef EM, Elabd HA, Elzomor HM, El Nagger BMMA, Ibrahim AS, Ibrahim AH, Kotb HG, Hassan DA, Abd ElAziz REM, Mohamed EES
Open Access Rheumatology: Research and Reviews 2022, 14:291-299
Published Date: 9 December 2022
Immune Cell-Derived Exosomes in Inflammatory Disease and Inflammatory Tumor Microenvironment: A Review

Zhang R, Li M, Li H, Ran X, Jin F, Tan Q, Chen Z
Journal of Inflammation Research 2024, 17:301-312
Published Date: 17 January 2024
The Hippo-YAP Signaling Pathway in Osteoarthritis and Rheumatoid Arthritis
Li M, Zhang FJ, Bai RJ
Journal of Inflammation Research 2024, 17:1105-1120
Published Date: 19 February 2024
Network Analysis of Osteoarthritis Progression Using a Steiner Minimal Tree Algorithm
Xie Y, Shao F, Ji Y, Feng D, Wang L, Huang Z, Wu S, Sun F, Jiang H, Miyamoto A, Wang H, Zhang C
Journal of Inflammation Research 2024, 17:3201-3209
Published Date: 18 May 2024
Nanotechnology in Orthopedic Care: Advances in Drug Delivery, Implants, and Biocompatibility Considerations
Xia L, Zhou C, Li Q, Liu L, Jiang C, Dai H, Zhang H, Zhao J, Liang W
International Journal of Nanomedicine 2025, 20:9251-9274
Published Date: 21 July 2025