
Back to Journals » Clinical Epidemiology » Volume 17
The Impact of Low EHR-Continuity on Effect Estimates: Evidence from Two EHR-Medicare Linked Databases
Authors Jin Y  , Tong AY, Wyss R , Yang J, Lin KJ
Received 26 June 2025
Accepted for publication 20 November 2025
Published 25 December 2025 Volume 2025:17 Pages 1131—1145
DOI https://doi.org/10.2147/CLEP.S549772
Checked for plagiarism Yes
Review by Single anonymous peer review
Peer reviewer comments 2
Editor who approved publication: Professor H Sorensen
Yinzhu Jin,1 Angela Y Tong,1 Richard Wyss,1 Jie Yang,1 Kueiyu Joshua Lin1,2
1Division of Pharmacoepidemiology and Pharmacoeconomics, Department of Medicine, Brigham and Women’s Hospital and Harvard Medical School, Boston, MA, USA; 2Department of Medicine, Massachusetts General Hospital and Harvard Medical School, Boston, MA, USA
Correspondence: Kueiyu Joshua Lin, Division of Pharmacoepidemiology and Pharmacoeconomics, Department of Medicine, Brigham and Women’s Hospital, Harvard Medical School, 1620 Tremont St. Suite 3030, Boston, MA, 02120, USA, Tel +1 617 278 0930, Fax +1 617 232 8602, Email [email protected]
Purpose: To compare the effect estimates obtained from patients with different levels of electronic health record (EHR)-continuity in four empirical studies: risk of pneumonia among 1) new users of proton pump inhibitors (PPI) vs H2 receptor antagonists, or 2) new users of PPI vs non-PPI users; risk of major bleeding among 3) new users of warfarin vs direct-acting oral anticoagulants, or 4) new users of oral anti-coagulants (OAC) vs non-OAC users.
Patients and Methods: Patients were identified in 2 US EHR systems (MA system, NC system) linked with Medicare claims data (2007/1/1 – 2014/12/31) separately. We calculated incidence rates (IR), incidence rate differences (IRD), and hazard ratios (HR) in the total linked study population and after excluding patients with the lowest 25%, 50%, or 75% of EHR-continuity scores. We quantified bias in IRD and propensity score (PS) decile-adjusted HR.
Results: In the MA system, IRs based on EHR-only data underestimated true rates by 44.1% to 76.2%, reduced to 12.9% to 46.5%. After excluding the lowest 75% of EHR-continuity patients, underestimation was more pronounced in non-user comparator designs. Absolute IRD bias was small for PPI vs H2RA (0.4%) and warfarin vs DOAC (0.7%), but larger for PPI vs non-PPI (19.1%) and OAC vs non-OAC (7.8%). Relative HR bias was 13.3% (PPI vs H2RA), 18.9% (PPI vs non-PPI), 3.0% (warfarin vs DOAC), and 31.5% (OAC vs non-OAC). Excluding lower-continuity patients and PS adjustment reduced IRD bias, while restricting to higher-continuity patients modestly improved HR bias.
Conclusion: Limiting analyses to patients with higher EHR-continuity can reduce IR underestimation and bias in effect estimates, particularly on the IRD scale. While PS adjustment mitigates some bias, EHR-discontinuity remains a source of bias, especially in studies using non-user comparators. These findings underscore the importance of balancing EHR-continuity with sample size considerations in pharmacoepidemiologic research.
Keywords: data leakage, care continuum, patient connectedness, data completeness, bias, effect estimates, electronic health records
Introduction
Over the past decade, the utilization of electronic health records (EHR) data in clinical research has expanded rapidly.1 EHRs capture rich clinical information essential for observational studies, such as medical diagnoses, prescribed medications, ordered procedures, vital signs, laboratory results, lifestyle factors, and clinical documents.
However, several inherent limitations of typical US EHR data can threaten the validity of the study findings. A key limitation is EHR-discontinuity (also referred to as lack of EHR-continuity), defined as clinical encounters occurring outside the study network and therefore unobserved in the data (eg, medication prescription from one hospital, but later had a hospitalization for pneumonia at an unaffiliated hospital). We use EHR-continuity as the standard term (synonym: data completeness) throughout this article, and its inverse EHR-discontinuity to denote care occurring outside the study network (previously also described as out-of-network care or data leakage).
Low EHR-continuity may result in missing or misclassified health events, leading to biased risk estimates. This could affect treatment safety evaluations and potentially misinform clinical decision-making or public health policy. To address this challenge, we previously developed and validated a prediction model to quantify the level of EHR-continuity and identify patients with high EHR-continuity.2,3 In subsequent work,4 we demonstrated that patients in the lowest quartile of EHR-continuity introduced substantial bias in relative effect estimates: 6–99% for short-term outcomes and 62–112% for long-term outcomes when using hazard ratios.4
However, little is known about how EHR continuity affects the underestimation of incidence rate (IR) and incidence rate differences (IRD) between treatment groups, that is, effect estimates on the absolute scale. Furthermore, while previous studies have compared effect estimates across four mutually exclusive sub-cohorts, which maybe infeasible in smaller EHR systems with limited sample sizes. A more practical alternative is to sequentially exclude patients with lower EHR-continuity—for example, by removing those in the lowest 25% of predicted EHR-continuity. By excluding patients with the lowest level of EHR-continuity, we may retain more patients than when dividing the population into mutually exclusive sub-cohorts. In light of this, the study aimed to evaluate the bias introduced by low EHR-continuity on both relative and absolute scale of effect estimates, by sequentially excluding patients with the lowest 25%, 50%, and 75% of EHR-continuity.
Materials and Methods
Data Source
We linked EHR-Medicare data from Massachusetts (MA) and North Carolina (NC) EHR systems. Specifically, the longitudinal claims data from fee-for-service Medicare Parts A, B, and D databases was linked with MA EHR system (2007/1/1 – 2014/12/31) and NC EHR system (2007/1/1 – 2014/12/31) separately. Detailed descriptions of each EHR system are provided elsewhere.5 Both EHR systems provide structured data on demographics, medical diagnoses, procedures, medication prescriptions, and rich clinical information such as laboratory test results and lifestyle measures. The Medicare claims data provide longitudinal information on demographics, claims records for inpatient and outpatient medical diagnoses, procedures, dispensed medications. All data were accessed and analyzed in accordance with applicable data protection and privacy regulations. The study protocol was reviewed and approved by the Mass General Brigham Institutional Review Board.
Base Study Population
The base study population included individuals who: 1) were aged ≥65 years, 2) had ≥365 days of continuous Medicare enrollment in Parts A, B, and D, and 3) had ≥1 study EHR encounter that is overlapping with the Medicare continuous enrollment period.
From the base population, we derived four empirical study cohorts. Two of them employed an active comparator, new-user design, while the other two used a non-user comparator design. The first two study examples compared the risk of pneumonia among 1) new users of proton pump inhibitors (PPI) vs H2 receptor antagonists (H2RA), and 2) new users of PPI vs non-PPI users. The other two study examples compared the major bleeding risk among 3) new users of warfarin vs direct-acting oral anticoagulants (DOAC, dabigatran, rivaroxaban, and apixaban), or 4) new users of oral anti-coagulants (OAC: warfarin, dabigatran, rivaroxaban, and apixaban) vs non-OAC users. For studies 3 and 4, we additionally required individuals to have ≥1 diagnosis of non-valvular atrial fibrillation (AF) 180 days prior to the index date (defined in the following section).
Exposure Measurement
Exposures were measured using EHR data alone to ensure that the comparisons between EHR-based vs. EHR-claims-based estimates were conducted within the same population. Since the cohorts were fixed for each study, any observed could be attributed solely to outcome misclassification or confounder measurement error resulting from low EHR-continuity.
New users of PPI and H2RA were defined as individuals without use of the study medication in the 365 days prior to the index date, which was defined as the first prescription record in the EHR. For non-PPI users, index dates were randomly assigned within their Medicare enrollment eligibility period, excluding individuals with any PPI use in the preceding 365 days. Non-users who later initiated PPI treatment remained eligible for the non-PPI group. Non-PPI users were randomly selected from the base population and 1:1 matched to PPI users.
For the warfarin and DOAC comparisons, a 180-day washout period was applied to define new use. For the OAC vs non-OAC cohort, each new OAC user was matched to five non-OAC users based on the number of days elapsed since their most recent AF diagnosis prior to the OAC prescription date. The index date for each non-OAC user was defined as their last AF diagnosis date plus the corresponding interval between AF diagnosis and OAC initiation observed in the matched OAC user. Additional details on the OAC vs non-OAC user cohort definition are provided in the Supplementary Data (Figure S1).
Follow-up and Outcome Ascertainment
The follow-up started one day after the index date until the earliest of 1) death, 2) 365 days after the index date (maximum follow-up), 3) end of data availability, and 4) loss of Medicare enrollment (for EHR-claims linked data only). Outcomes were measured separately based on EHR data alone and EHR-claims linked data. We used International Classification of Diseases, Ninth Revision (ICD-9) diagnostic codes to define pneumonia and major bleeding. The specific codes used to define the outcome are listed in the Supplementary Data (Table S1). To evaluate whether the impact of EHR continuity varies for more acute outcome events, we performed sensitivity analyses restricting the follow-up period to 180 days.
Covariates Ascertainment and Algorithm Predicted EHR Continuity
Potential confounders were assessed during the 365-day pre-index period. Similar to outcome assessment, covariates were measured separately using EHR data alone and using the linked EHR–claims data. A total of 70 baseline covariates were measured, including demographics, comorbidities, prior medication use, and healthcare utilization. A full list of pre-index covariates is listed in the Supplementary Data (Tables S2 and S3).
We applied the previously validated algorithm to calculate predicted EHR-continuity.2,4 A full list of predictors their corresponding coefficients is provided in the Supplementary Data (Table S4). Briefly, the model predictors of the EHR-continuity were measured based on EHR data alone during a 365-day pre-index period. The model predictors are mainly indicators related to primary care follow-up in the study EHR, demographics (age, sex, and race), as well as healthcare utilization factors. The predicted EHR-continuity has been compared to the observed EHR-continuity (mean proportion of encounters captured) in our previous work, and the area under the curve for predicting the measured EHR-continuity of ≥60% was 0.86 in the training and 0.88 in the testing set. Furthermore, the predicted EHR-continuity value was highly correlated with the measured EHR-continuity with a Spearman coefficient = 0.78.2
The full list of ICD codes and matching algorithm (for non-user cohorts) for cohort formation and the covariates definition are available in the supplementary materials (Table S1 and Figure S1) and can be provided upon reasonable request.
Estimation of Treatment Effects
For each of the four empirical study examples described above, we calculated the incidence rate (IR) stratified by exposure status, incidence rate difference (IRD), hazard ratio (HR), and 95% confidence interval (CI) of each estimate. For hazard ratio, we checked Kaplan–Meier plots to visually check the proportional hazards assumption, and we used robust standard errors to estimate the variance. Confounding was addressed by propensity score (PS) deciles, and both IRD and HR adjusted by PS deciles were reported. Since Medicare claims capture encounters that occur outside of the study EHR systems, estimates derived from EHR-claims linked data were treated as the “reference-standard” for evaluating the impact of EHR-continuity on effect estimates. As sensitivity analysis, we also applied inverse probability weights (IPW) as an alternative confounding adjustment strategy, using the same propensity score model.
Quantifying the Bias Due to Misclassification of Outcomes and Covariates
We quantified discrepancies between IR estimates between EHR alone and EHR-claims linked data using the “underestimation proportion”, defined as the relative difference in IR between two data sources:  .
.
The underestimation proportion is expected to be higher among non-user comparator groups, as these individuals are more likely to experience discontinuity of care within the study EHR system. To assess whether IR underestimation differed between non-user and active comparator designs, we calculated the relative difference in IR underestimation within each cohort as: , where %IR underestimationexp and %IR underestimationref are % IR underestimation in the exposure and reference group, respectively.
Bias in the IRD were assessed as the standardized difference between IRDEHR+claims and IRDEHR. Bias in HR was calculated on the logarithmic scale as follows:

To evaluate the impact of predicted EHR-continuity on bias in IR, IRD, and HR, we compared bias measured in the overall cohort and cohorts excluding the lowest 25%, 50%, or 75% of predicted EHR-continuity values.
Furthermore, we assessed the proportion of overlap in the 95% CIs for IRD and HR derived from EHR data alone and EHR+claims linked data. For example, the overlap in the 95% CIs for the crude IRD from the EHR and EHR+claims data was calculated by dividing length of overlapping segment by the total range spanned by both 95% CIs:

U and L are upper and lower limits of 95% CI, respectively.
Evaluation of Bias–Variance Trade-off via Mean Squared Error
To select a practical exclusion threshold for low EHR-continuity, we quantified the bias–variance trade-off using mean squared error (MSE) at each threshold (total, excluding the lowest 25%, 50%, 75% of EHR-continuity). MSE combines systematic error (bias) and statistical imprecision (variance), with lower values indicating better overall accuracy.
For IRD, the MSE was obtained using the following formula, where Var (IRDEHR) is the variance of IRD from EHR data only:

For HR, we computed MSE on log scale, where Var (ln(HREHR)) is the variance of log form of HR from EHR data only:

Results
Study Population
From the MA EHR system, we identified a total of 51,099 PPI users, 14,447 H2RA users, and 51,330 non-PPI users. There were 10,590 warfarin, 1,562 DOAC, 12,152 OAC, and 44,252 non-OAC users who had non-valvular AF (Tables 1 and S2). In the NC system, we identified 5,620 PPI, 1,421 H2RA, 5,694 non-PPI, 859 warfarin, 266 DOAC, 1,125 OAC, and 5,103 non-OAC users (Table S3).
 |
Table 1 Patients’ Characteristics and Absolute Standardized Mean Difference (%) at Baseline, MA System |
The mean age across cohorts ranged from 75.4 to 78.5 years in the MA system, and from 74.9 to 77.8 years in the NC system. The proportion of female ranged from 42.5% to 62.9% in the MA system cohorts and from 45.5% to 60.7% in the NC system cohorts. Full characteristics of the study populations are presented in Tables S2 and S3.
Underestimated Incidence Rates
In the MA EHR system, IR underestimation was highest in the total cohort and progressively decreased with the exclusion of the lowest 25%, 50%, 75% of predicted EHR-continuity patients (Figure 1). The decreasing trend in IR underestimation was consistently observed across all study examples in both EHR systems (Figure 2). The number of events and follow-up time are listed in Table S5.
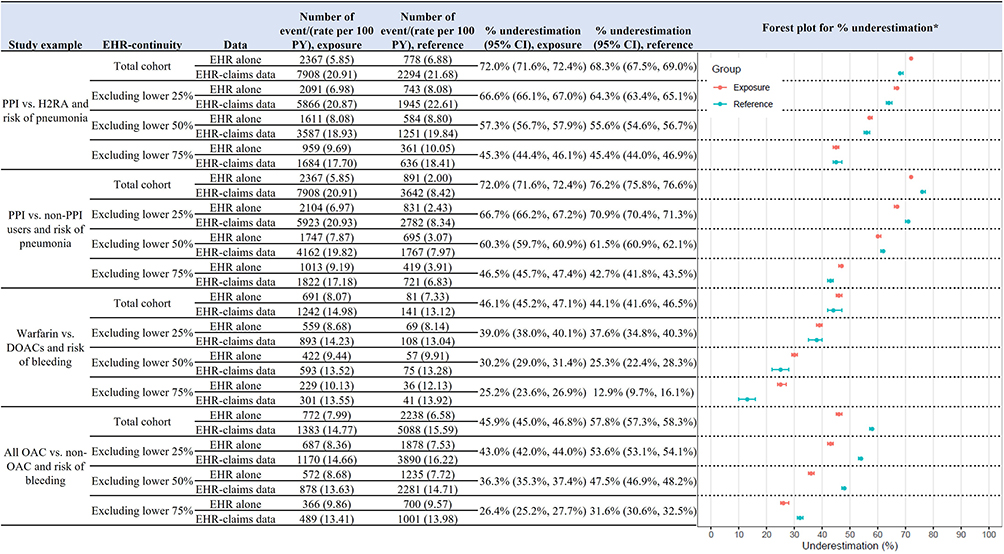 |
Figure 1 Incidence rates and percentage of underestimated incidence rates by exposure group: MA EHR system. *Underestimation of incidence rates was calculated as difference in the incidence rate from EHR+claims data and EHR only, divided by the incidence rate from EHR+claims data: ((IREHR+claims – IREHR)/IREHR+claims). Abbreviations: CI, confidence interval; DOAC, direct-acting oral anticoagulant; EHR, electronic health records; H2RA, H2 receptor antagonists; OAC, oral anticoagulant; PPI, proton pump inhibitors; PY, person-years. |
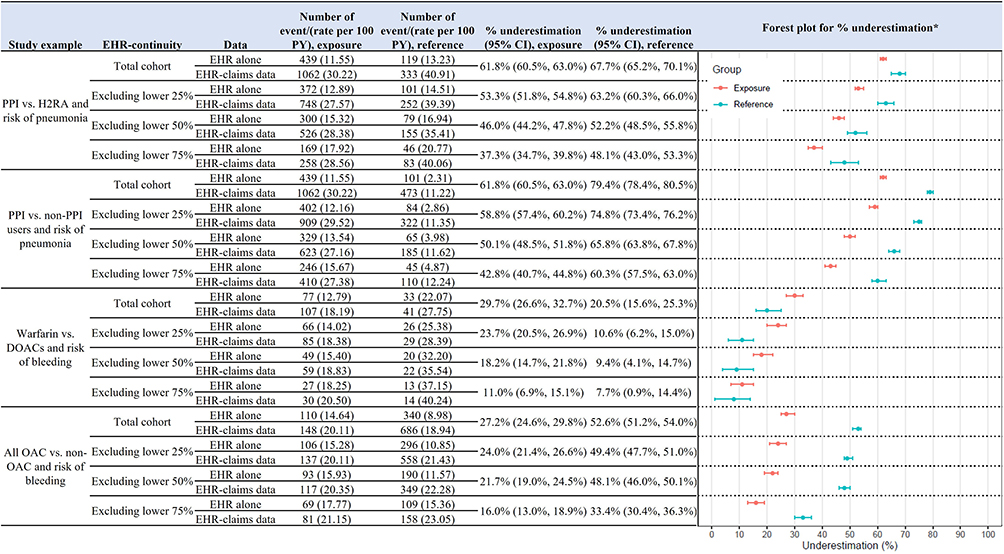 |
Figure 2 Incidence rates and percentage of underestimated incidence rates* by exposure group: NC EHR system. *Underestimation of incidence rates was calculated as difference in the incidence rate from EHR+claims data and EHR only, divided by the incidence rate from EHR+claims data: ((IREHR+claims – IREHR)/IREHR+claims). Abbreviations: CI, confidence interval; DOAC, direct-acting oral anticoagulant; EHR, electronic health records; H2RA, H2 receptor antagonists; OAC, oral anticoagulant; PPI, proton pump inhibitors; PY, person-years. |
In MA total cohort, the IR underestimation among PPI users was 72.0%. Non-PPI users had higher underestimation compared to the active comparator H2RA users (76.2% vs 68.3%). However, after excluding the lowest 75% EHR continuity, the level of IR underestimation became comparable across the PPI, non-PPI, and H2RA users (45.3%, 45.4%, and 42.7%, respectively). Similarly, in the NC EHR system, we observed that the non-PPI comparator group exhibited greater IR underestimation than both the PPI exposure and H2RA comparator groups (Figure 2). The relative difference in IR underestimation in MA total cohort was 9.5% for PPI vs H2RA and 28.6% for PPI vs non-PPI cohort.
The difference in IR underestimation between the exposure and non-user comparator group was more pronounced in study examples 3 and 4 (Figure 1). While active comparators groups showed similar levels of underestimation (46.1% for warfarin and 44.1% for DOACs in MA cohort), the non-user comparator group consistently showed higher underestimation compared to the exposure groups (45.9% for OAC and 57.8% for non-OAC users in total cohorts). The relative difference in IR underestimation in MA total cohort was 4.4% for warfarin vs DOACs cohort and 25.9% for OAC vs non-OAC cohort. The difference was greater in the NC EHR system (27.2% for OAC vs 52.6% for non-OAC with a relative difference of 93.5%; Figure 2).
Comparing Bias and CI Overlap in IRD Estimates
Overall, we observed relatively greater bias in IRDs among the non-user comparator cohorts compared to the active comparator cohorts. For example, the crude IRD bias was 0.4% among PPI vs H2RA %, 19.1% among PPI vs non-PPI cohort (Table 2). Similarly, the bias was 0.7% in the warfarin vs DOAC cohort, whereas it reached 7.8% in the OAC vs non-OAC cohort. After adjusting for PS deciles, we observed a reduction in bias among non-user comparator cohorts – for example, in the PPI vs non-PPI cohort, the bias decreased from 19.1% to 8.4%. Excluding patients with lower EHR-continuity also reduced bias, for example, bias decreased from 19.1% to 11.5% after excluding the lowest 75% of EHR-continuity patients. The overlap in the 95% CI for crude IRD was 59% in the PPI vs H2RA and 54% warfarin vs DOACs cohorts. We did not observe any overlap in the 95% CI for the non-user comparator cohorts. There was an improvement in the overlap in the OAC vs non-OAC cohort after excluding the lowest 75% of EHR-continuity and following confounding adjustment (Table 2 and Figure S2). We observed similar trend in IRD bias and 95% CI overlap from the NC system results (Table S6).
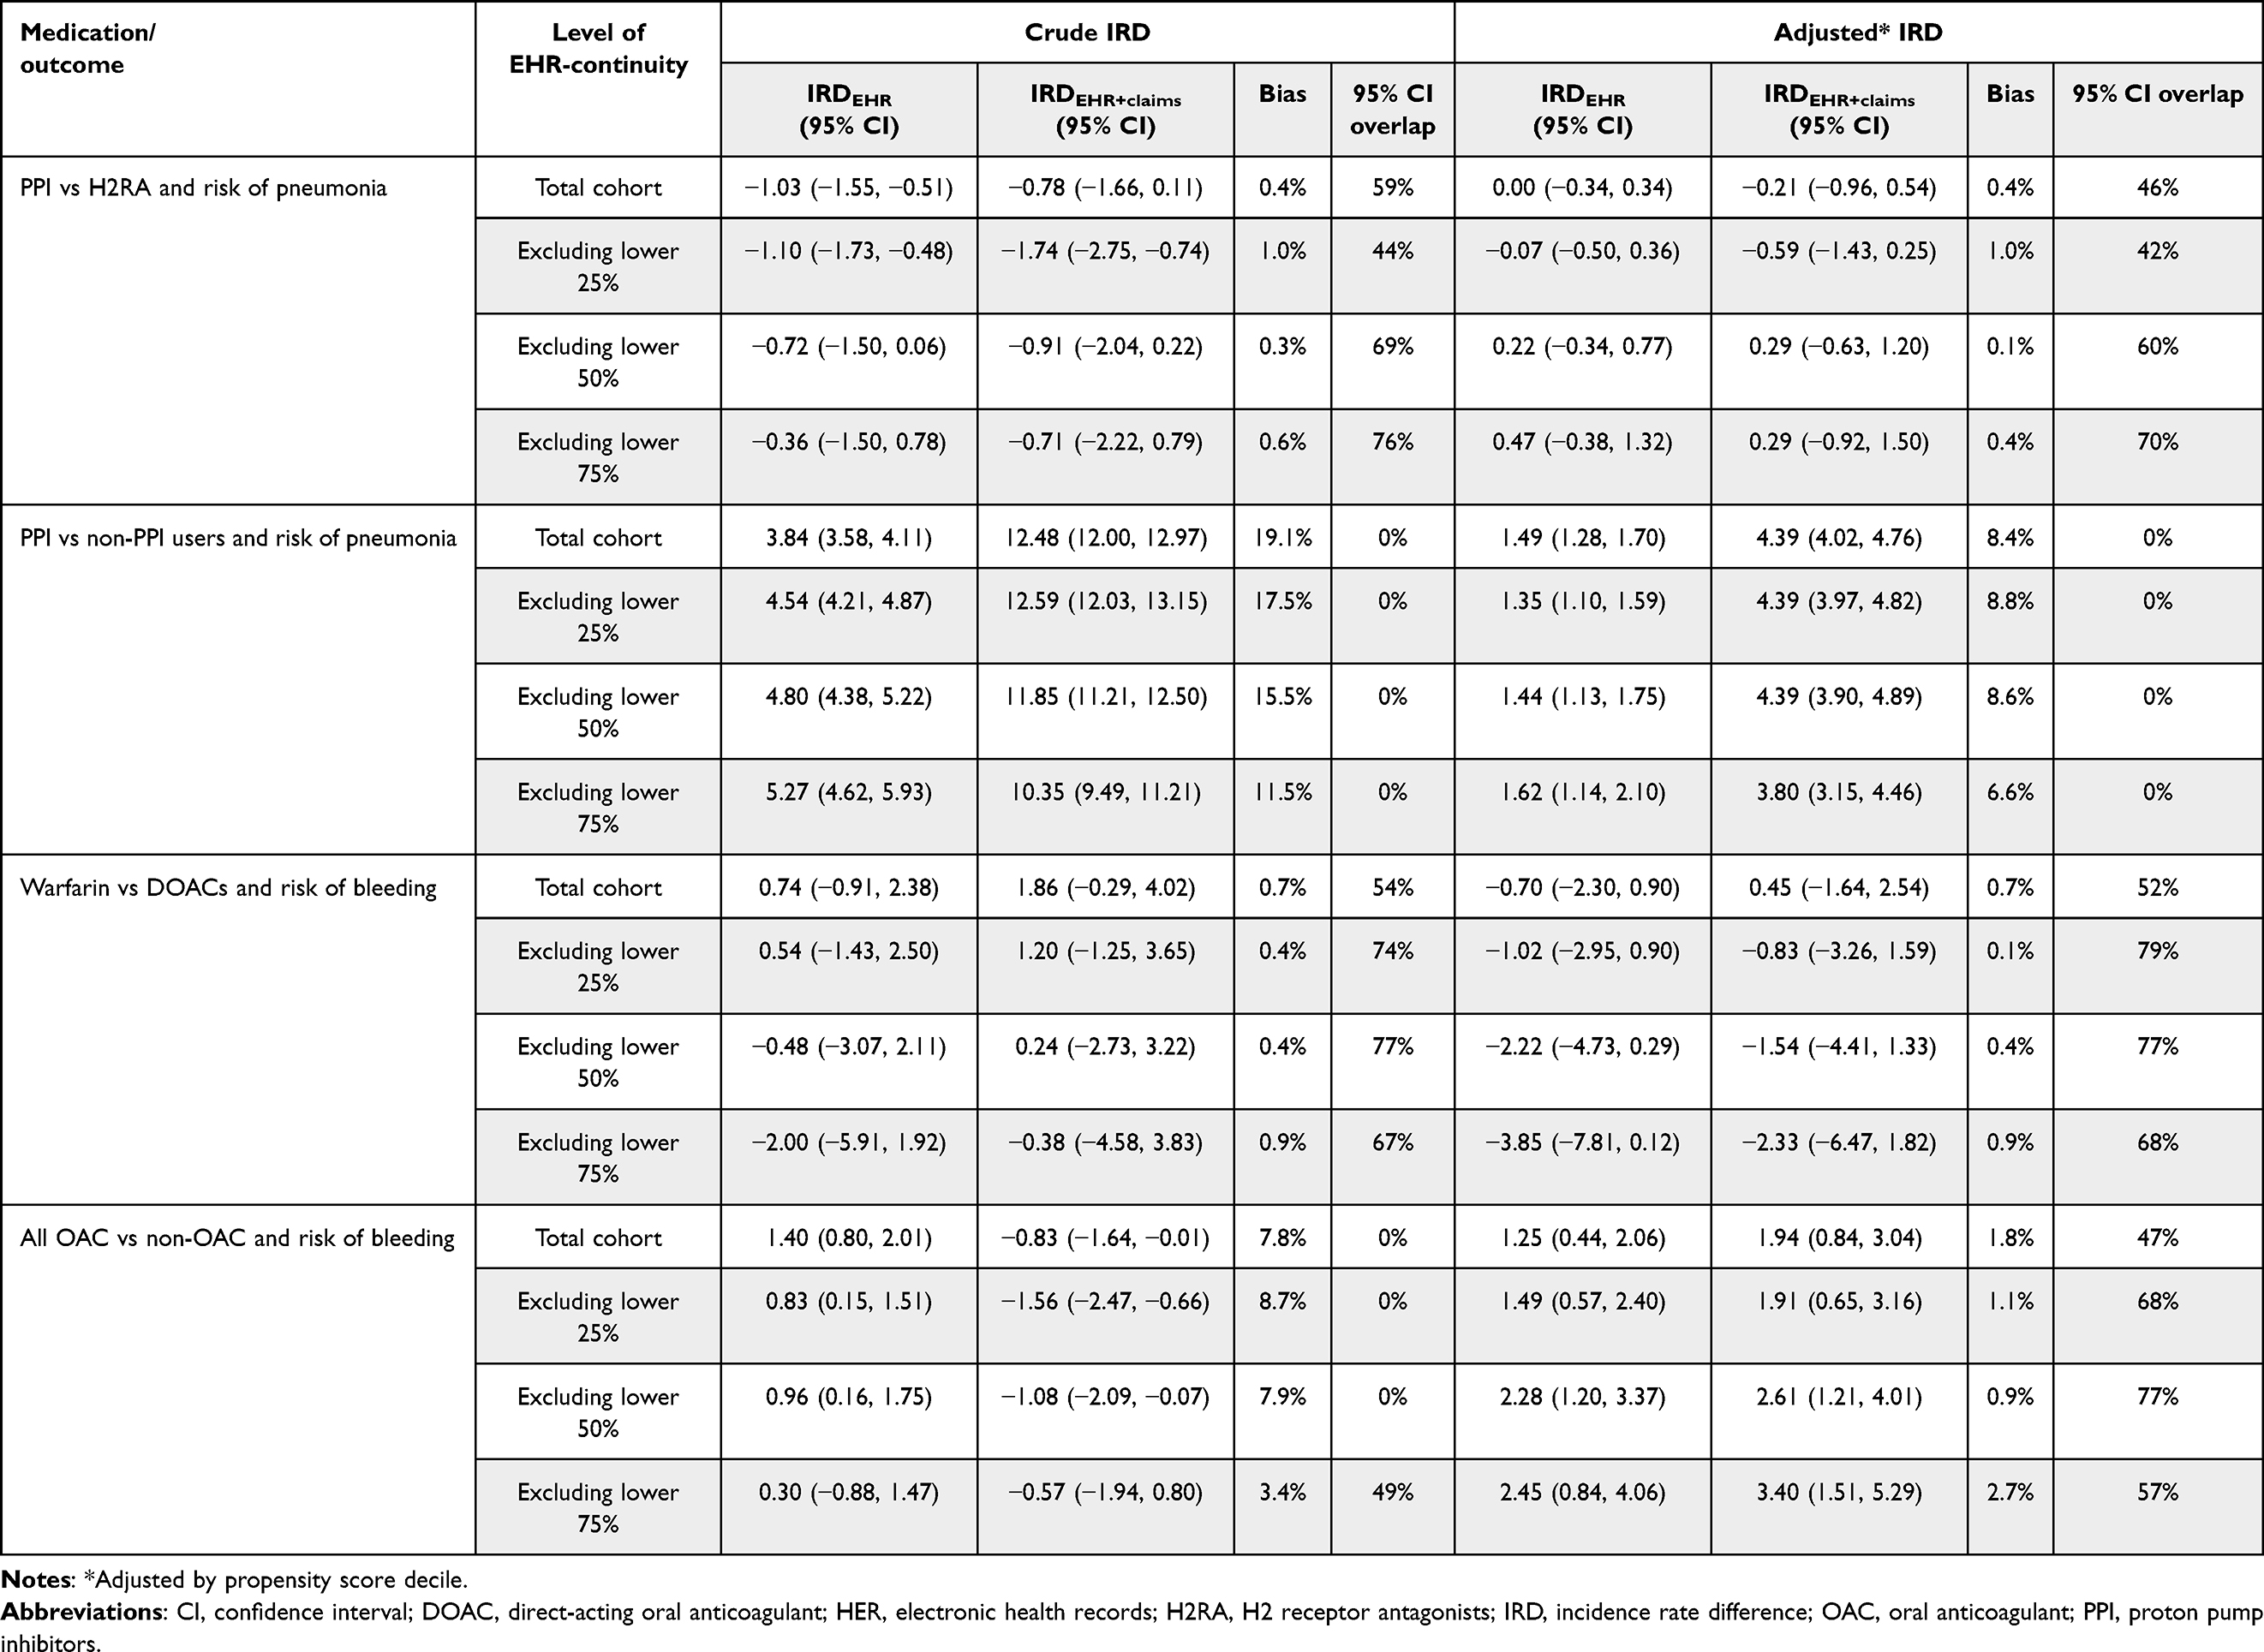 |
Table 2 Metrics for Crude and Adjusted Incidence Rate Difference per 100 PY and by Level of EHR-Continuity: MA EHR System |
Comparing Bias and CI Overlap in HR Estimates
The HR bias in the PPI vs H2RA and PPI vs non-PPI from the MA system remained relatively small, ranging from 0% to 19% for the crude HR from 1 to 11% for the PS decile-adjusted HR (Table 3). Excluding lower EHR-continuity subsets improved the bias in crude HR modestly. However, after confounding adjustment using PS deciles, the HR bias was similar in the total cohort and in the cohorts excluding patients with lower EHR-continuity, ranging from 1% to 3%. We observed similar pattern in PPI vs non-PPI study example (Table 3).
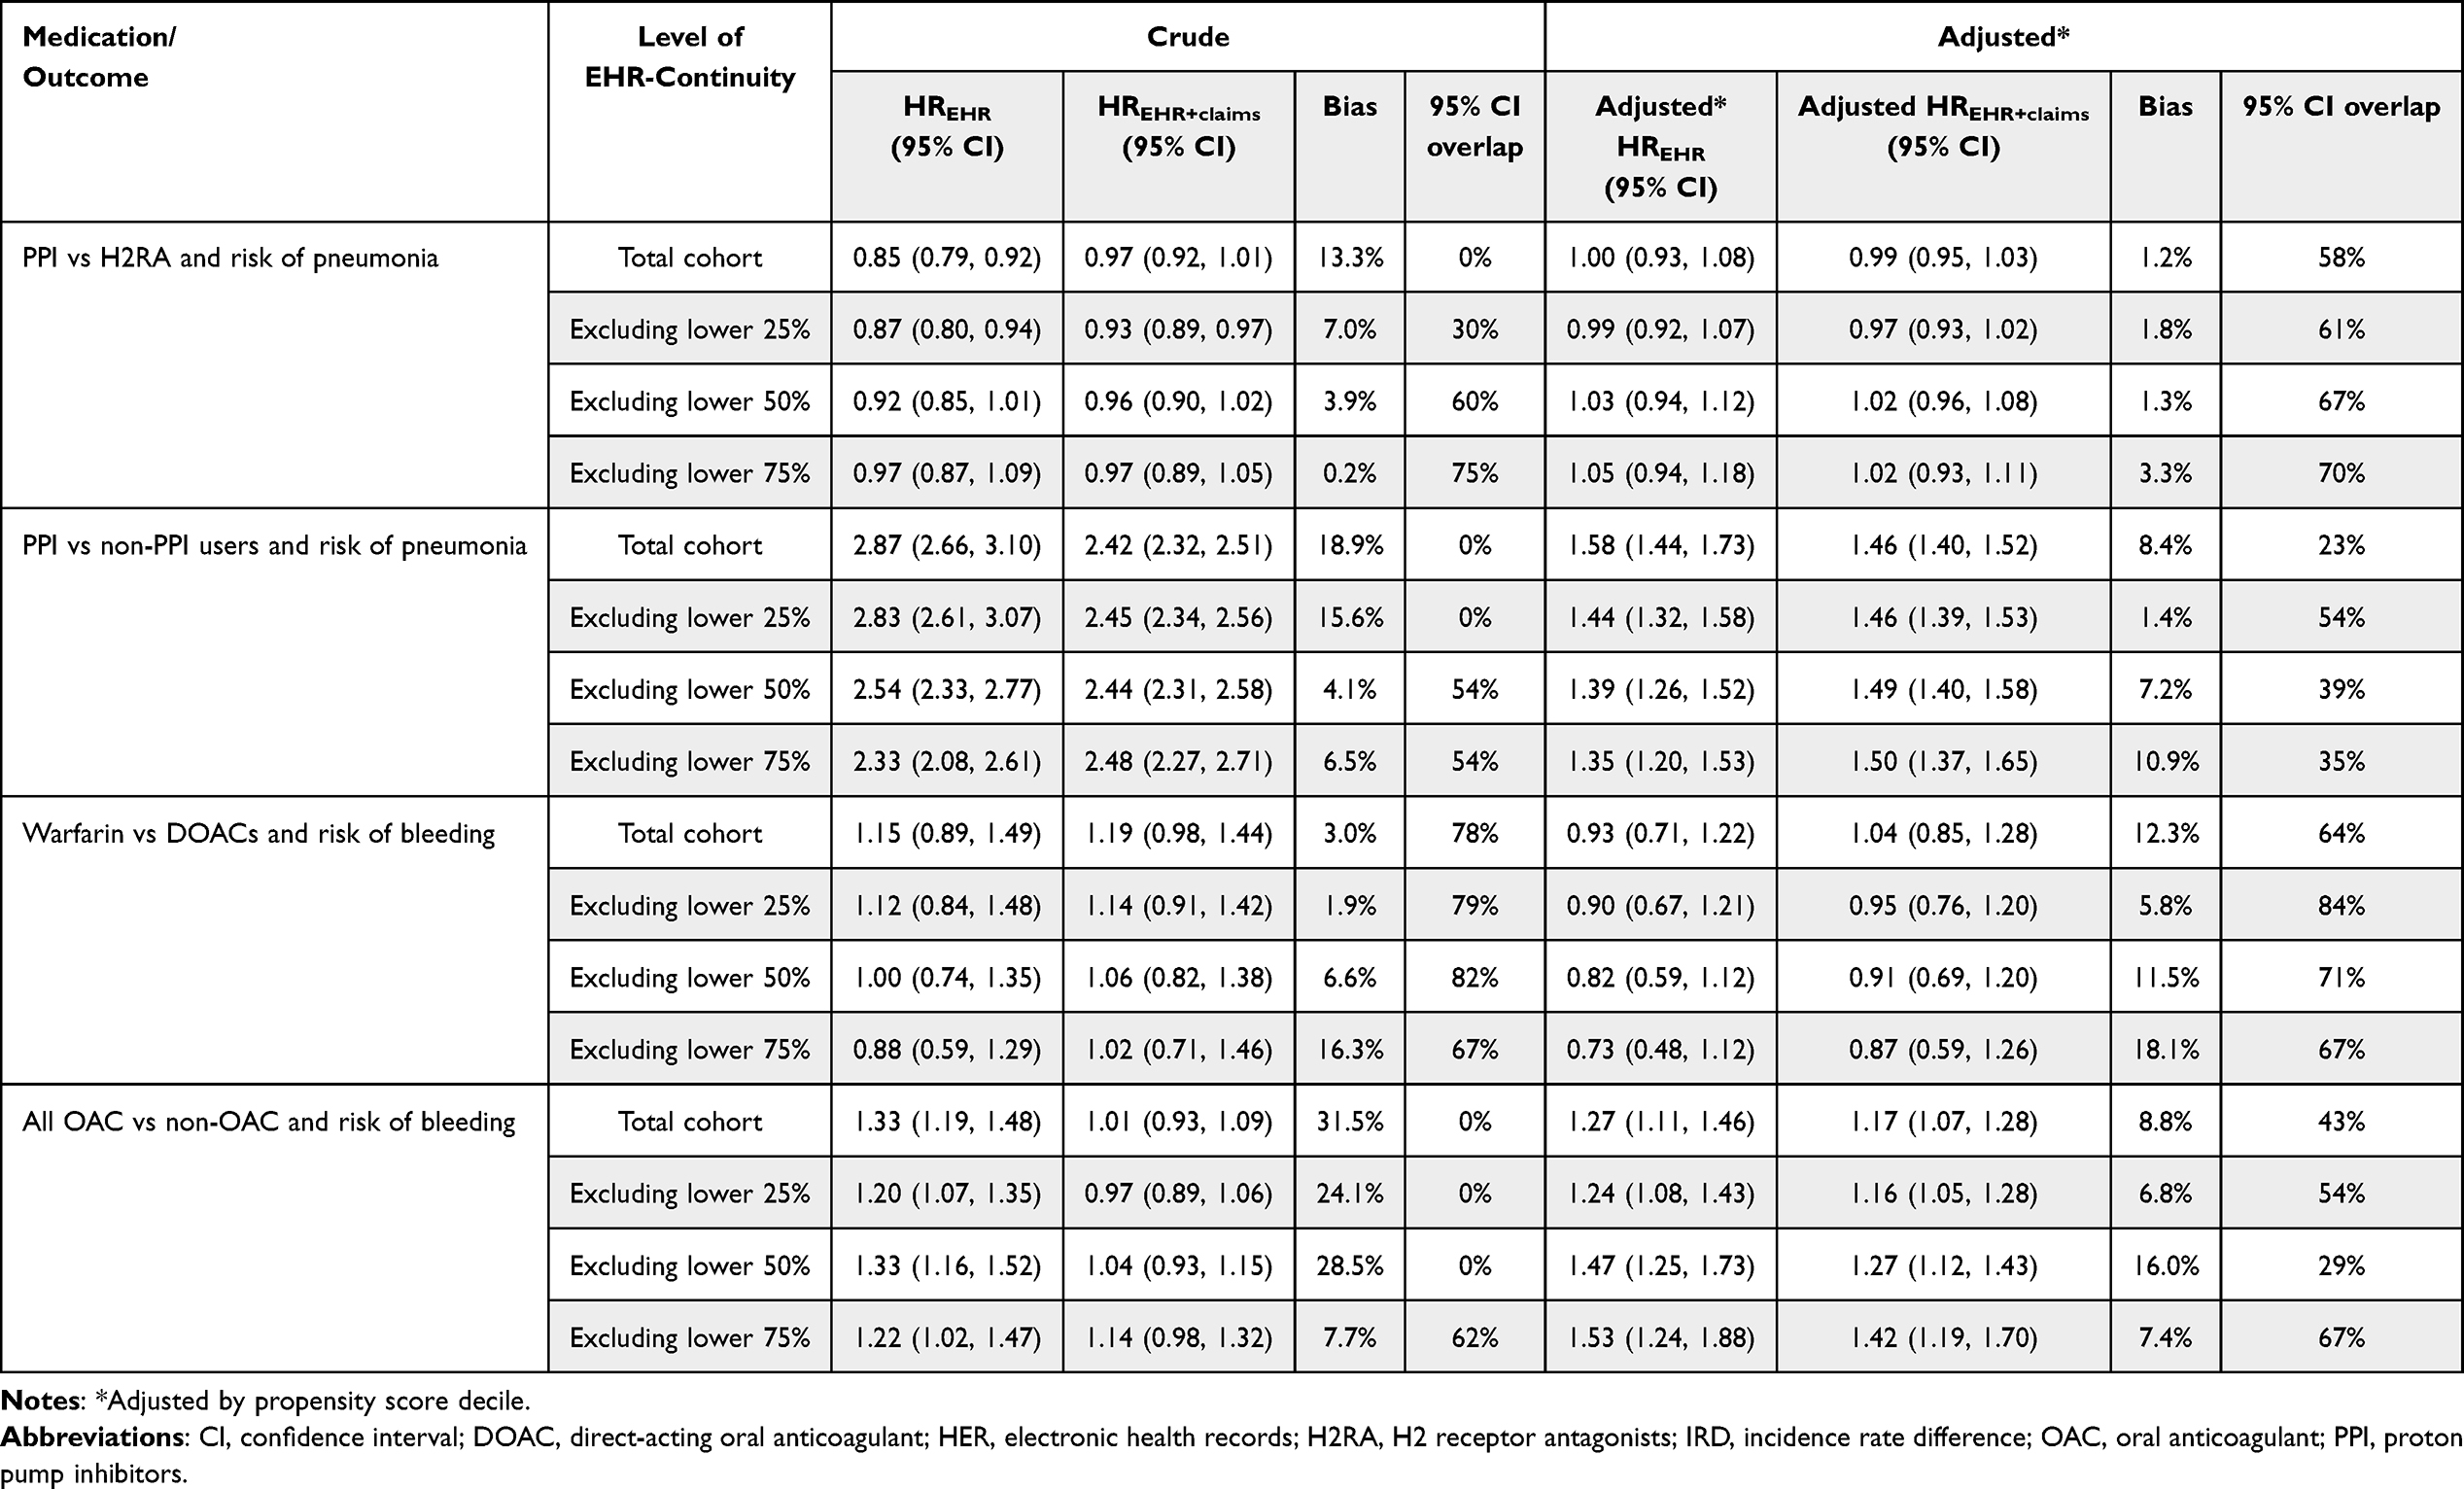 |
Table 3 Metrics for Crude and Adjusted Hazard Ratio by Level of EHR-Continuity: MA EHR System |
The OAC vs non-OAC study cohort showed smaller bias in the crude HR than the warfarin vs DOAC cohort (3% vs 31%, respectively). After adjusting for PS deciles, HR bias was similar across different EHR-continuity levels in both cohorts. Consistent with the 95% CI overlaps observed in the IRD estimates, we found that CI overlap was poor in the cohorts with non-user comparators. Excluding patients with lower EHR-continuity or adjusting for PS deciles improved the 95% CI overlap in these study examples (Table 3 and Figure S3). We observed similar trend in HR bias and 95% CI overlap from the NC system results (Table S7). Visual inspection of Kaplan–Meier plots indicated that the proportional hazards assumption was reasonably satisfied (Figures S4–S7).
Results for bias and CI overlap in IRD and HR were similar when we restricted the follow-up time to 180 days (Tables S8–S10) or used IPW as confounding adjustment approach (Tables S11 and S12).
MSE for IRD and HR Across EHR-Continuity Levels
PS-adjusted IRD MSE was low (0–2%) across thresholds and insensitive to exclusions (Table S13 and Figure S8). Crude IRD MSE was low (MA 4–14%, NC 8–32%) and tended to rise with 75% exclusion. Crude HR MSE was highest and generally increased with exclusion (warfarin vs DOACs: MA 36 to 47%, NC 48 to 61%), except NC PPI vs non-PPI where it declined (73 to 51–53%). PS adjustment sharply reduced HR MSE (eg, MA 36 to 13%; NC 48 to 22%) and remained stable Overall, MSEs were low; crude HR had the highest MSE but dropped substantially after PS-decile adjustment.
Discussion
The growing use of EHR data in recent epidemiologic research has enabled the identification of key study variables that are often not available in insurance claims databases.6 However, EHR-discontinuity, or incomplete capture of care across health care systems, can lead to misclassification of key variables, potentially compromising the validity of effect estimates derived from EHR data alone. Our previous work has provided solid evidence that patients with low predicted EHR-continuity had a greater magnitude of misclassification of study variables.2,3,5,7,8 In our prior work, we assessed bias only on the relative scale and across sub-cohorts defined by EHR-continuity quartiles. In this study, we build on that foundation by demonstrating the impact of EHR-continuity on both absolute and relative effect estimates. We also evaluate practical strategies to balance the trade-off between minimizing bias and preserving precision. Using four empirical CER examples drawn from two US EHR systems in MA and NC, we demonstrated that lower EHR-continuity is consistently associated with greater underestimation in IR. This effect was more pronounced in non-user comparator designs than in active user comparator designs.
Underestimation Risk and Rates in the Descriptive Epidemiology
We observed that IRs estimated using EHR data alone consistently underestimated the “true” IRs derived from EHR-claims linked data. This finding aligns with the earlier study,4 in which we reported reduced outcome event capture rates in certain empirical CER examples. These findings suggest that in EHR-based descriptive epidemiologic studies, researchers should exercise caution when reporting IRs. The risk of underestimation is especially pronounced in cohorts that include non-user comparator groups. Therefore, EHR-continuity should be considered when reporting risks or incidence rates using EHR data, and sensitivity analyses excluding patients with lower EHR-continuity subset should be conducted to assess the robustness of risk/rate estimates. This issue is not limited to CER studies, but also applies equally to descriptive and surveillance studies. Results from EHR-based analyses should be reported with a clear acknowledgement of the potential of underestimation of risk and rates due to incomplete data capture.
Differential vs Non-Differential Misclassification of Outcome
If outcome misclassification differs by exposure status, both absolute measures such as risk/rate difference and relative measures such as risk/rate/hazard ratio could be biased in unpredictable directions, either toward or away from the null. Our findings demonstrate a greater likelihood of differential outcome misclassification in the non-user comparator cohorts compared to active comparator cohorts. We observed in the PPI vs H2RA and warfarin vs DOAC examples, IR underestimation was similar between the exposure and reference groups. In contrast, the corresponding non-user comparisons – PPI vs non-PPI and OAC vs non-OAC – exhibited greater differences in IR underestimation between groups. To mitigate bias from differential misclassification, an active-comparator design is preferred. This design not only helps reduce outcome misclassification but is also widely recommended to minimize confounding and other potential sources bias.9–11 In situations where a non-user comparator is unavoidable, the study cohort could be restricted to higher EHR-continuity (eg, excluding the lowest 25%) to mitigate potential differential misclassification between the exposure and comparator groups. We recommend reporting both absolute and relative measures and presenting CI-overlap diagnostics across different EHR-continuity levels. Future research is warranted to examine the magnitude of differential misclassification by considering negative-control outcomes or exposures.
Other Factors Related to the Effect Estimation
Outcome misclassification is not the only source of bias nor the determinant of the bias direction in epidemiologic studies. The magnitude of both outcome misclassification and confounder misclassification can significantly affect the effect estimate validity. We noted that the impact of EHR-continuity on bias is more pronounced in the crude estimates than in the adjusted IRD or HR. This may be explained by partial adjustment for EHR-continuity levels when other confounders were accounted for in the PS model. In other words, adjusting for comorbidity or healthcare utilization as confounders may indirectly adjust for EHR-continuity, since certain comorbidity or healthcare utilization patterns are correlated with patients’ EHR-continuity. We also observed that the bias related to EHR-continuity appears to be greater when effect estimates were measured on the absolute scale than on the relative scale. However, given the limited number of examples investigated in our study, these findings should be interpreted as descriptive. Future studies encompassing a broader range of research questions and setting is needed to assess the generalizability of these results.12
Another factor related to bias is the study sample size and the number of observed outcome events. Smaller sample sizes are more susceptible to random variation (“chance-finding”) and are therefore associated with greater bias.13 In our study examples, the population size was smaller in the NC system, and the warfarin/DOAC/OAC/non-OAC study examples had relatively fewer outcome events. As a result, effect estimates in these cohorts became more imprecise, leading to greater fluctuation in bias.
MSE did not reveal a clear “optimal” exclusion threshold — patterns were flat or worsened with aggressive exclusions—so there is no practical MSE-based “sweet spot”. Given the consistent bias reduction with minimal impact on variance, a pragmatic threshold is to exclude the lowest 25% of EHR-continuity. This yields lower bias (and, in NC PPI vs non-PPI, lower HR MSE) while avoiding the diminishing returns and precision loss seen with ≥50–75% exclusions.
Recommendations for Future EHR-Based CER Studies
We recommend reporting both absolute and relative measures’ effect estimates, along with CI-overlap diagnostics. Furthermore, EHR-based CER should routinely quantify and report predicted EHR-continuity distributions and present sensitivity analyses by exclusion thresholds. These recommendations align with current RWE guidance emphasizing data relevance and reliability, and transparent study conduct. In particular, FDA (US Food and Drug Administration)’s 2024 guidance on using EHR/claims data calls for documentation of data provenance, linkage quality, missingness, validation of key variables, and fitness-for-use assessments.14 The recommendations also align with the ISPE-ISPOR (International Society of Pharmacoepidemiology – International Society for Pharmacoeconomics and Outcomes Research) initiatives to improve transparency and reliability of RWE.15,16
Limitations
The study results have several limitations. First, EHR systems across the US vary substantially in documentation practices and data availability. Although we observed relatively consistent findings across two US systems in different states, both are based in academic institutions; therefore, generalizability to non-academic or community-based healthcare networks may be limited. Second, we treated effect estimates derived from EHR-claims data as the “reference-standard”, though these do not represent the true causal effect. The objective of this study was to assess the relative bias resulting from data leakage in EHR-only analyses, compared with estimates from EHR-claims data. Third, we did not include all commonly used analytical methods, such as as-treated analysis or alternative confounding adjustment strategies such as propensity score matching or stratification. Lastly, while restricting study cohorts to individuals with higher EHR-continuity can reduce bias due to data leakage, it inevitably reduces sample size and lead to less precise effect estimates.
Conclusion
Using data from two US academic network in different states, we found that restricting study cohorts to individuals with higher EHR-continuity, such as by excluding patients in the lowest 25% of predicted EHR-continuity, can reduce the underestimation of IRs when relying on EHR data alone. Bias in effect estimates due to EHR-discontinuity was more pronounced in crude than in the adjusted estimates. We also demonstrated that, in EHR-based CER studies, effect estimates in relative scale are less susceptible to bias from data discontinuity than those on the absolute scale. Researchers should carefully weigh the trade-off between optimizing EHR-continuity and preserving adequate sample size to ensure both validity and precision of effect estimates. We recommend that future EHR-based CER routinely quantify and report predicted EHR-continuity distributions and present sensitivity analyses by exclusion thresholds. Our findings derived from two academic EHR networks and four exemplar pharmacoepidemiologic scenarios, and these may not fully generalize to non-academic systems or other therapeutic areas, and replication in diverse settings is warranted.
Funding
This project was funded by NIH 1R01LM013204 and 1R01LM012594.
Disclosure
All authors declared no competing interests for this work.
References
1. Gianfrancesco MA, Goldstein ND. A narrative review on the validity of electronic health record-based research in epidemiology. BMC Med Res Method. 2021;21(1):234. doi:10.1186/s12874-021-01416-5
2. Lin KJ, Singer DE, Glynn RJ, Murphy SN, Lii J, Schneeweiss S. Identifying patients with high data completeness to improve validity of comparative effectiveness research in electronic health records data. Clin Pharmacol Ther. 2018;103(5):899–905. doi:10.1002/cpt.861
3. Merola D, Schneeweiss S, Jin Y, Lii J, Lin KJ. Advancing an algorithm for the identification of patients with high data-continuity in electronic health records. Clin Epidemiol. 2022;14:1339–1349. doi:10.2147/CLEP.S370031
4. Joshua Lin K, Jin Y, Gagne J, et al. Longitudinal data discontinuity in electronic health records and consequences for medication effectiveness studies. Clin Pharmacol Ther. 2022;111(1):243–251. doi:10.1002/cpt.2400
5. Lin KJ, Rosenthal GE, Murphy SN, et al. External validation of an algorithm to identify patients with high data-completeness in electronic health records for comparative effectiveness research. Clin Epidemiol. 2020;12:133–141. doi:10.2147/clep.S232540
6. Cowie MR, Blomster JI, Curtis LH, et al. Electronic health records to facilitate clinical research. Clin Res Cardiol. 2017;106(1):1–9. doi:10.1007/s00392-016-1025-6
7. Kar S, Bessette LG, Wyss R, Kesselheim AS, Lin KJ. The impact of electronic health record discontinuity on prediction modeling. PLoS One. 2023;18(7):e0287985. doi:10.1371/journal.pone.0287985
8. Jin Y, Schneeweiss S, Merola D, Lin KJ. Impact of longitudinal data-completeness of electronic health record data on risk score misclassification. J Am Med Inform Assoc. 2022;29(7):1225–1232. doi:10.1093/jamia/ocac043
9. Yoshida K, Solomon DH, Kim SC. Active-comparator design and new-user design in observational studies. Nat Rev Rheumatol. 2015;11(7):437–441. doi:10.1038/nrrheum.2015.30
10. Wintzell V, Svanström H, Pasternak B. Selection of comparator group in observational drug safety studies: alternatives to the active comparator new user design. Epidemiology. 2022;33(5):707–714. doi:10.1097/ede.0000000000001521
11. Lund JL, Richardson DB, Stürmer T. The active comparator, new user study design in pharmacoepidemiology: historical foundations and contemporary application. Curr Epidemiol Rep. 2015;2(4):221–228. doi:10.1007/s40471-015-0053-5
12. Nab L, Groenwold RHH, van Smeden M, Keogh RH. Quantitative bias analysis for a misclassified confounder: a comparison between marginal structural models and conditional models for point treatments. Epidemiology. 2020;31(6):796–805. doi:10.1097/ede.0000000000001239
13. Springate SD. The effect of sample size and bias on the reliability of estimates of error: a comparative study of Dahlberg’s formula. Eur J Orthodont. 2011;34(2):158–163. doi:10.1093/ejo/cjr010
14. Food and Drug Administration. Real-world evidence: considerations regarding non-interventional studies for drug and biological products; 2023.
15. Wang SV, Pinheiro S, Hua W, et al. STaRT-RWE: structured template for planning and reporting on the implementation of real world evidence studies. BMJ. 2021;372:m4856. doi:10.1136/bmj.m4856
16. Wang SV, Pottegård A. Building transparency and reproducibility into the practice of pharmacoepidemiology and outcomes research. Am J Epidemiol. 2024;193(11):1625–1631. doi:10.1093/aje/kwae087
 © 2025 The Author(s). This work is published and licensed by Dove Medical Press Limited. The
full terms of this license are available at https://www.dovepress.com/terms
and incorporate the Creative Commons Attribution
- Non Commercial (unported, 4.0) License.
By accessing the work you hereby accept the Terms. Non-commercial uses of the work are permitted
without any further permission from Dove Medical Press Limited, provided the work is properly
attributed. For permission for commercial use of this work, please see paragraphs 4.2 and 5 of our Terms.
© 2025 The Author(s). This work is published and licensed by Dove Medical Press Limited. The
full terms of this license are available at https://www.dovepress.com/terms
and incorporate the Creative Commons Attribution
- Non Commercial (unported, 4.0) License.
By accessing the work you hereby accept the Terms. Non-commercial uses of the work are permitted
without any further permission from Dove Medical Press Limited, provided the work is properly
attributed. For permission for commercial use of this work, please see paragraphs 4.2 and 5 of our Terms.