")
Back to Journals » Risk Management and Healthcare Policy » Volume 16
The Impact of a Hybrid Hospital at Home Program in Reducing Subacute Rehabilitation
Authors Yadav RR , Mahyoub MA , Capriotti MW, Berio-Dorta RL, Dougherty K , Shukla A
Received 7 July 2023
Accepted for publication 2 October 2023
Published 31 October 2023 Volume 2023:16 Pages 2223—2235
DOI https://doi.org/10.2147/RMHP.S419862
Checked for plagiarism Yes
Review by Single anonymous peer review
Peer reviewer comments 3
Editor who approved publication: Dr Gulsum Kubra Kaya
Ravi R Yadav,1 Mohammed A Mahyoub,1,2 Michael W Capriotti,1 Raul L Berio-Dorta,1 Kacie Dougherty,1 Ajit Shukla1
1Virtua Health, Marlton, NJ, USA; 2Systems Science and Industrial Engineering Department, Binghamton University, Binghamton, NY, USA
Correspondence: Ajit Shukla, Virtua Health, 301 Lippincott Dr, Marlton, NJ, USA, 08053, Email [email protected]
Purpose: The purpose of this study was to compare health outcomes for patients receiving acute care in their homes through a Hospital at Home (HaH) program to outcomes for inpatients in the traditional hospital setting.
Patients and Methods: We compared outcomes for patients in a HaH program at Virtua Health in 2022 (N = 271) to traditional inpatients during the same year (N = 13,776) with the same diagnoses. We defined outcomes as recommendations for subacute rehabilitation (SAR) upon discharge as this recommendation indicates the need for additional therapy based on a physician’s assessment of the patient. Specifically, we searched notes in the electronic medical records for terms related to recommendation for SAR using text mining algorithms and a natural language processing (NLP) model to confirm these recommendations. We then compared the proportion of patients within each group that had a SAR recommendation, and controlled for differences in sample size, age, and diagnosis using bootstrapping analyses.
Results: We observed that the proportion of patients in the HaH program that were recommended for SAR (0.148) was significantly different from the proportion of patients who remained in the traditional hospital setting (0.363), with a reduced need for SAR for HaH patients. We obtained qualitatively similar results when we controlled for sample size and diagnosis. Controlling for age yielded an older control population, and the difference in the proportion of patients with SAR recommendations between the groups widened.
Conclusion: The reduced need for SAR for HaH patients in this study suggests that HaH programs are a promising alternative care model. Future work may consider how health outcomes vary for patients with different diagnoses, clinical histories and demographics, which may inform how HaH programs operate moving forward.
Keywords: managed care, NLP, text mining, short-term rehab, telemedicine
Introduction
In the United States (US), inpatient care in the home, provided through a Hospital at Home (HaH) program, began at Johns Hopkins Medical School in the mid-1990s in an effort to avoid the decline that many seniors experience when receiving treatment within the hospital walls.1,2 In the decades following, few US healthcare systems adopted or expanded HaH programs.3 The stalled growth of these programs during this period has been attributed to the lack of a broad payment structure for them in the US.3,4 However, with the COVID-19 pandemic, the US witnessed a revived interest in this alternative model of care.5 This renewed attention on HaH programs largely came about from a change in federal healthcare insurance policy. In November 2020, the Centers for Medicare & Medicaid Services (CMS) —the federal agency that administers major healthcare programs in the US—launched the Acute Hospital Care at Home program to provide hospitals expanded flexibility to care for patients in their homes.6 This unique waiver program was an expansion of the CMS Hospitals Without Walls legislation in an effort to provide health systems with avenues to handle the demand for care expected from COVID-19 surges.7 This policy led to the first example of a broad payment system for acute level of care at home in the US.8 As of August 2023, 125 healthcare systems including 296 hospitals had been approved by CMS for acute care at home,5 with numbers projected to rise following the US Congress in December 2022 extending the waiver through December 2024.9
The expansion of HaH programs across the US has raised concerns about patient safety and quality of care with these services given the limited research available on these programs.10,11 So far, studies on HaH programs have demonstrated significant improvements in quality of care including a reduction in total length of stay, reduction in 30 day readmissions, and reductions in hospital infections and hospital induced delirium12,13 (but see).14,15 In addition, some work suggests that HaH programs lower the total cost of care13,16–19 (but see)18 and greatly improve patient satisfaction.12,15,16,19 Providers in HaH programs also report positive experiences, which in turn may have implications for patient care.20,21
In this study, we aimed to contribute to the body of evidence on health outcomes of patients receiving care through a HaH program by comparing their outcomes to those of patients who received care within the hospital walls (control group). We focused specifically on patients who received services through Virtua Health, a healthcare system in southern New Jersey in the US. Virtua Health launched its HaH program in January 2022.22 Patients in Virtua Health’s HaH program receive support at home from a well-integrated care team including physicians, nurses, and paramedics.23 Every Virtua Health HaH patient receives a remote patient monitoring kit which includes a tablet for virtual care visits via video as well as devices to measure oxygen saturation in the blood, body temperature, blood pressure, and glucose levels.23 Patients are monitored and supported by Virtua Health’s 24/7 command center staffed by registered nurses.23 In addition, every patient receives two in-person nursing visits per day, a virtual physician visit from the attending hospitalists, and additional virtual rounding sessions with the registered nurses at the command center.23
We hypothesized that patients in the HaH program may witness better health outcomes compared to the control group, possibly due to increased mobility and comfort in the home. We chose to use recommendations for subacute rehabilitation (SAR) as an indicator of health outcomes because it signals that a physician suggests additional care is needed.24 Furthermore, recommendations for SAR can be tracked within the Virtua Health system (for example, it would be more difficult to track readmissions if a patient was readmitted to a hospital outside of the Virtua Health system).
We observed a significant difference in the frequency of SAR recommendations between the HaH patients and the control group, with relatively fewer SAR recommendations for HaH patients. These results support the idea that HaH programs may lead to better outcomes than traditional hospital care for patients with certain diagnoses.
The positive outcomes observed for HaH patients in this study suggest that HaH programs are a promising alternative way to deliver care, and the results highlight the need for further research to improve our understanding of patient safety and quality of care with this model.
Materials and Methods
Study Framework
In this study, we compared outcomes for patients who participated in a HaH program to traditional inpatients with the same Medicare Severity Diagnosis-Related Group codes (MS DRGs) who were not in the program through retrospective chart review. Specifically, we compared the number of patients recommended for SAR prior to discharge in each group. Here, SAR was defined as additional care below the acute level, including skilled nursing facilities.
Ethics approval was obtained from the Virtua Health Institutional Review Board (US Department of Health and Human Services Federal Wide Assurance Identifier: FWA00002656; Marlton, NJ, USA) under study ID G23023. Virtua Health Institutional Review Board (IRB) waived the requirement for consent because the research involved no more than minimal risk to subjects, could not practically be carried out without the waiver, and the waiver will not adversely affect the rights and welfare of the subjects. This requirement of consent was waived on the condition that, when appropriate, the subjects will be provided with additional pertinent information about inclusion. Because the IRB waived the requirement for consent, the IRB also waived required documentation of consent because the research presents no more than minimal risk of harm to subjects and involves no procedures for which written consent is normally required outside of the research context. We conducted this study in accordance with the Declaration of Helsinki, and maintained the confidentiality and privacy of all study subjects. All patient information was treated as confidential and used solely for research.
Patient Population
We limited the population in this study to patients who received acute care through Virtua Health in 2022. We compared patients in Virtua Health’s HaH program (N = 271) to inpatients who received care in the hospital (control, N = 13,776). The control group was further limited to patients with an MS DRG that matched an MS DRG in the HaH patient group. Control group patients received care at 5 different hospitals, including 66 departments. For the HaH group, there were 5 HaH departments, each associated with one of the five hospitals, with virtual care provided through a single command center.
Data Collection
Patient data was recorded in an electronic medical record (EMR) using Epic (Epic, Epic Systems Corporation, Verona, Wisconsin, USA). To collect data from EMRs, we first queried Epic for patients in the HaH program using SQL. We then queried the database for EMRs for patients who did not participate in the program and with an MS DRG matching one of the MS DRGs in the HaH group. The following variables were extracted from EMRs and saved for use in further analysis: clinical note contents, MS DRG, age (years) at admission, gender, and insurance payor. Information from clinical notes was extracted using natural language processing (NLP) and combined with tabular (structured) data for further analysis (Figure 1).
 |
Figure 1 Flow diagram depicting the combination of clinical notes (unstructured data) and tabular (structured) data from electronic medical records (EMRs) used for analysis in this study. Clinical notes for each patient were collected from the EMR. The free text in the notes was processed before each note was searched for keywords (see Methods). In the final stage of language processing, a clinical BERT model was used to extract the sentiment in the note eg, identify if the note asserts a subacute rehabilitation (SAR) recommendation or negates a SAR recommendation. This information was converted to structured data and combined with other structured data from the patient for further analysis and interpretation. |
NLP-Based Automatic SAR Recommendation Extractor
All analyses on the collected data were completed using Python (version 3.9). To identify whether a patient was recommended for SAR, we mined the text in each clinical note using the regular expression (re) Python library. We first standardized the text by replacing all characters that were not letters with a space. Then, we searched each clinical note with a length of at least 5 characters for the keywords “SAR” or “subacute rehabilitation”. We also searched for SAR recommendations by searching each note for “rec” (recommended) or “anticip” (anticipated). If a match was found for both the SAR and recommendation keywords, we calculated the minimum distance between their starting indices in the string. To account for negations (eg, SAR was not recommended), we implemented the Clinical Assertion/Negation Classification BERT model with the use of the transformers library.25 This model takes text as input and classifies whether medical conditions are present, absent, or possible. Specifically, we passed the text in the note between the starting index for the first recommendation or SAR keyword through 5 characters past the starting index of the other keyword. We marked each clinical note as a recommendation for SAR if a match in the note was found for both the recommendation and SAR key terms, the minimum distance between those terms was 40 characters or fewer, and the Clinical Assertion/Negation Classification BERT model indicated an assertion, or recommendation.
Statistical Analysis
The sample size in this study was determined by the number of patients who met the criteria named above (Patient population). To estimate if our sample size was sufficient to detect differences in the rate of recommendations for SAR, we conducted a power analysis. Federman et al reported that 10.4% of control group patients and only 1.7% of HaH patients were admitted to skilled nursing facilities following discharge from acute care in their study. We used these values to estimate the effect size for recommendations for SAR. We then used the stats.api submodule in the statsmodels library in Python to compute the required sample size for each group to detect a difference in proportions given the estimated effect size, a power of 0.80 and α= 0.05. This analysis indicated that each group should include 101 patients. In other words, our sample size was likely sufficient for detecting differences between the groups with the above effect size and parameters. To address the relatively large size of the control group (N = 13,776) and the imbalance in size between the groups (approximately 1 HaH patient to 50 control patients), we employed bootstrapping to control for sample size. We describe the procedure below following a description of our main analysis.
To compare outcomes for HaH patients and control group patients, we calculated the proportion of patients who were recommended for SAR by counting the number of SAR recommendations and dividing by the total number of patients in each group. We tested whether the proportion of patients recommended for SAR was significantly different between the two groups using a two-tailed two proportion Z-test. Specifically, we calculated the test statistic,
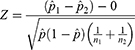
where  is the proportion of patients recommended for SAR across both groups, the proportion recommended for SAR in the control group, and the proportion recommended for SAR in the HaH group, respectively, and n1 and n2 are the total number of patients in the control group and HaH group, respectively.
We addressed the imbalanced sample size between the groups using bootstrapping. Specifically, we created a new HaH sample with size equal to the smaller of the two groups (N = 271) by sampling from the HaH patient group with replacement using the sample function in the Pandas library in Python. We repeated this for the control group, sampling with replacement to create a resample of equal size (N = 271). We computed the proportions of patients recommended for SAR for each resample as well as the difference in proportions for that resample. We repeated this procedure 10,000 times, which resulted in a distribution of estimates on the proportion of HaH patients recommended for SAR, the proportion of control patients recommended for SAR, and the difference in proportion of patients recommended for SAR. We then calculated 95% confidence intervals (CIs) on these estimates by finding the values corresponding to the 0.025 and 0.975 quantiles of the resampled distributions. These 95% CIs offered an estimate on the variability in these measures. With the resampled distributions, we also compared how the observed values (original sample) compared to this control analysis. To compare the sample size control to the observed values, we approximated the percentile of the observed value in the resampled distribution using the quantile function in the Numpy Python library.
Recommendations for SAR may vary with patient age. We tested for a significant difference in age between the groups using a two-sided two-sample t-test (α=0.05). To control for age between the groups, we performed a bootstrapping analysis in which we created resamples for both HaH and control groups that approximated the age of the HaH group. First, we assigned a bin to each patient based on their age, where each bin covered approximately a 10-year range. We then calculated the number of HaH patients in each age bin, and limited the bins used for bootstrapping to those that included at least 10 patients. This resulted in the following bins: [60, 70), [70, 80), [80, 90), [90, 100). These bins included 38, 97, 91, and 33 patients, respectively. We then performed a bootstrapping procedure similar to the sample size control analysis. In this case, when we created new resampled HaH groups, we sampled with replacement from each age bin with N equal to the number of HaH patients in each of those age bins. When we created resampled control groups, we again sampled with replacement from each age bin with N equal to the number of HaH patient in that age bin. In other words, the resampled groups were matched for size and approximately matched for age. As above, we calculated the proportion of patients recommended for SAR in each group as well as the difference in proportions for 10,000 iterations. To verify that the resamples were matched for age, we also saved the 0.25, 0.50, and 0.75 quartiles of the age of the patients in each resample on every iteration. From these distributions, we calculated 95% CIs on the estimates. We then compared the observed proportions from the original groups to the 95% CIs in this age-matched control.
Differences in recommendations for SAR may also depend on the patient’s primary diagnosis. If certain diagnoses are unevenly distributed within groups or imbalanced across groups, the main effect could be influenced by these differences in diagnoses. To investigate the distribution of diagnoses within and between groups, we calculated the proportion of patients with each MS DRG (Figure 2). We next considered how recommendations for SAR vary by MS DRG by comparing the number and proportion of patients recommended for SAR for every MS DRG for which there were at least 10 patients. We then identified the MS DRGs with the greatest and smallest differences in the proportion of recommendations for SAR. To address an uneven distribution of diagnoses within and between groups, we employed bootstrapping. We repeated a procedure very similar to the age-matched control except here we sampled 10 patients with replacement from each MS DRG bin. We then computed 95% CIs on the resampled distribution, and evaluated if there was a significant difference in recommendations for SAR between the groups when these MS DRGs were evenly represented.
 |
Figure 2 Proportion of patients within the Hospital at Home (HaH, dark gray) and control (light gray) groups with each Medicare Severity Diagnosis-Related Group code (MS DRG). Most MS DRG codes include an indication of whether the diagnosis is with or without a complication or comorbidity (CC) or major complications or comorbidities (MCC). O.R. indicates operating room; C.D.E. indicates common bile duct exploration. |
Results
We aimed to determine if health outcomes for patients receiving acute care in Virtua Health’s HaH program were different from patients in a control group, who received the same level of care in a Virtua Health hospital. Towards this goal, we extracted EMRs from patients who participated in this HaH program in 2022 (N = 271; 114 male, 157 female; age (years), mean: 78.004, std: 10.2). We found that there were 41 distinct diagnoses in this group based on the final MS DRG code for that stay (Figure 2). We limited the control group to patients in the hospital in 2022 who had an MS DRG that matched one of those 41 diagnoses in the HaH group (N = 13,776; 6313 male, 7463 female; age (years), mean: 66.1, std: 22.7). For both groups, most patients were insured by Medicare, while some were insured by Managed Medicare or another insurance payor (Table 1).
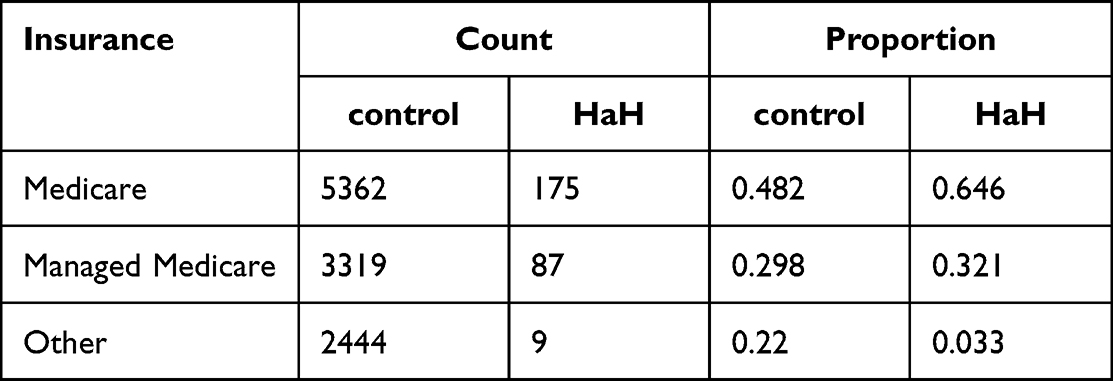 |
Table 1 Number (Count) and Proportion of Patients Insured by Medicare, Managed Medicare, or Another Payor for the control Group and HaH Group |
We first considered recommendations for SAR in clinical notes as this indicates that a physician suggests that the patient requires further care following discharge from acute care. After categorizing each clinical note as including or excluding a recommendation for SAR with text mining and a machine learning classification model,19 we calculated the proportion of patients in each group for which a SAR recommendation was mentioned (see Methods). For the control group, 4,999 of 13,776 patients (proportion: 0.363) were recommended for SAR. In contrast, only 40 of the 271 HaH patients (proportion: 0.148) were recommended for SAR. This difference in the proportion of patients recommended for SAR across the two groups (∆proportion = 0.215) was significantly different (Figure 3; two-tailed two proportion Z-test, Z = 7.32, p=2.53 x 10⁻¹³), with relatively far fewer HaH patients recommended for SAR.
 |
Figure 3 Proportion of patients in the HaH program that were recommended for SAR (0.148; N = 40 of 271) was significantly different from that of the control group (0.363; N = 4,999 of 13,776), with relatively fewer HaH patients recommended for SAR (*** indicates p < 0.001, Z = 7.32, two-tailed two proportion Z-test). |
The imbalance in sample size between the HaH and control groups in this study was large (approximately 1 HaH patient for every 50 control group patients). To address this imbalance, we employed bootstrapping (see Methods), so that we could both match the sample size across the groups and estimate the variability in the proportion measure. We created new bootstrapped samples for each group (N=271, respectively) by resampling patient data with replacement, and calculated the measures above—proportion of patients recommended for SAR in each group and their difference. After repeating this procedure 10,000 times, we found that the observed proportion of HaH patients recommended for SAR (0.148) fell near the 50.27th percentile of the resampled distribution (Figure 4). Accordingly, given an approximately normal distribution, the observed proportion of patients recommended for SAR was nearly centered on the 95% CI of the resampled distribution (95% CI: 0.107–0.192, center of interval: 0.149). Similarly, for the control group, we found that the observed proportion of SAR recommendations (0.363) was near the 50.14th percentile of the resampled distribution, and this observed value was centered on the 95% CI of the resampled distribution (95% CI: 0.306–0.421, center: 0.363). In line with the estimates on recommendations for each group, the 95% CI for the difference in recommendations between the groups was 0.144–0.284, with the observed difference in proportions (0.215) falling near the 50.73rd percentile of the resampled distribution. Taken together, even when matching sample size, there were more recommendations for SAR in the control group than in the HaH group.
 |
Figure 4 Sample size-matched control bootstrapping analysis. Top: Distribution of the proportion of patients recommended for SAR for 10,000 bootstrapped samples in which 271 patients were sampled with replacement from the HaH group. Black, vertical dashed line marks the observed proportion of HaH patients (original group) recommended for SAR (0.148). Middle: Same as top but for the control group. Each resample consisted of 271 patients. The vertical dashed line indicates the observed proportion of control patients recommended for SAR (0.363). Bottom: The difference in proportion of patients recommended for SAR (proportion of patients in control resample recommended for SAR – proportion of patients in HaH resample recommended for SAR) on each of the 10,000 bootstrap iterations. The observed difference in proportions (control – HaH, 0.215) is marked by the dashed, vertical gray line. |
We next considered the possibility that this difference in recommendations for SAR may be due to an age difference between the groups. Indeed, the age of the HaH group was significantly different from the control group (two-tailed two sample t-test, t = 8.60, p = 8.48×10⁻¹⁸), with the former older than the latter. We reassessed the comparison of recommendations for SAR by employing bootstrapping, similar to our sample size control. However, in this case, we created resamples that approximated the age of the HaH group by resampling patients within approximately 10-year wide bins (see Methods). We verified that the age of the control and HaH resamples was approximately the same (95% CI 25th percentile, control: 72–73.5 years, HaH: 72–73.5 years; 95% CI 50th percentile, control: 78–79 years, HaH: 78–79 years; 95% CI 75th percentile, control: 85–87 years, HaH: 84–86 years). With this age-matched control analysis, the control resamples were older than the original group (median: 71 years). The 95% CIs for the proportion of patients recommended for SAR was 0.100–0.185 and 0.436–0.552 for HaH group and control group, respectively (Figure 5). In other words, with a relatively older control group, the proportion of recommendations was higher than the proportion of recommendations in the original control group. The estimates for the HaH group, on which the resampling was based, were very similar to the observed proportion of recommendations. Taken together, the difference in proportion of recommendations for SAR between the HaH and control groups widened with the age-matched control (95% CI: 0.278–0.425), again with fewer SAR recommendations for the HaH group.
 |
Figure 5 Age-matched control bootstrapping analysis. Top: Distribution of the proportion of patients recommended for SAR for 10,000 bootstrapped samples, in which 271 patients were sampled stratifying for age (see Methods). Black, vertical dashed line marks the observed proportion of HaH patients (original group) recommended for SAR (0.148). Middle: Same as top but for the control group. Each of the 10,000 resamples consisted of 271 patients, and sampling was stratified for age based on the age of patients in the HaH group. The vertical dashed line indicates the observed proportion of control patients recommended for SAR (0.363). Bottom: The difference in proportion of patients recommended for SAR (proportion of patients in control resample recommended for SAR – proportion of patients in HaH resample recommended for SAR) on each of the 10,000 age-matched bootstrap iterations. The observed difference in proportions (control – HaH, 0.215) is marked by the dashed, vertical gray line. |
Our analyses thus far were based on 41 distinct MS DRGs. We next considered if differences in recommendations for SAR depended on diagnosis (using MS DRG) for those MS DRGs for which there were at least 10 patients in each group (Table 2). With this criterion, the top 10 most common MS DRGs were included, and for all of those 10 MS DRGs the proportion of patients recommended for SAR was higher in the control group than in the HaH group. We observed some variability in this difference across diagnoses, with the largest difference for those patients with respiratory infections and inflammations with complication or comorbidity (CC) and simple pneumonia and pleurisy with major complications or comorbidities (MCC) (Table 2). The MS DRGs with the smallest difference in recommendations for SAR were bronchitis and asthma with CC/MCC and cellulitis without MCC. Given that the proportion of patients within each MS DRG varied somewhat between the groups (Figure 2) and that there appeared to be some variability in recommendations for SAR (Table 2), we ran a control analysis to test whether the main effect—fewer recommendations for SAR for HaH patients—still held when matching the number of patients with each MS DRG. We again employed bootstrapping in a similar way for the age control analysis above (see Methods), and created resamples in which each MS DRG was uniformly represented in both groups. This resulted in non-overlapping 95% CIs for the control and HaH groups (control, 95% CI: 0.298–0.380; HaH, 95% CI: 0.115–0.156; Figure 6). In other words, there does not appear to be a subset of MS DRGs that drives the reduction in need for SAR for HaH patients in this study.
 |
Table 2 Number of Patients Recommended and Not Recommended for SAR by MS DRG for the HaH Group and control Group. The Proportion of Patients Recommended for SAR in Each Group and Their Difference (control Proportion – HaH Proportion) is Also Shown. Only MS DRGs for Which There are at Least 10 Patients with That MS DRG are Shown |
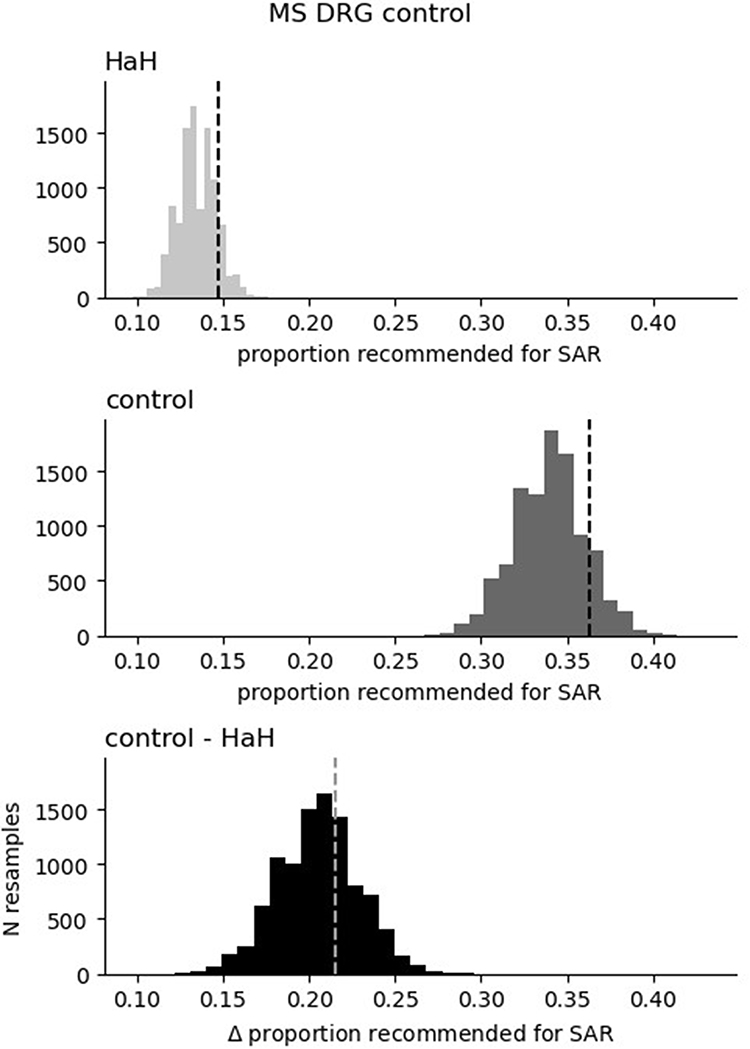 |
Figure 6 MS DRG bootstrapping analysis. Top: Distribution of the proportion of patients recommended for SAR for 10,000 bootstrapped samples. On each bootstrap iteration, for each MS DRG that included at least 10 patients, 10 patients were sampled with replacement from the HaH group (see Methods). In effect, the representation of each MS DRG was uniform in each resample Black, vertical dashed line marks the observed proportion of HaH patients (original group) recommended for SAR (0.148). Middle: Same as top but for the control group. The vertical dashed line indicates the observed proportion of control patients recommended for SAR (0.363). Bottom: The difference in proportion of patients recommended for SAR (proportion of patients in control resample recommended for SAR – proportion of patients in HaH resample recommended for SAR) on each of the 10,000 bootstrap iterations. The observed difference in proportions (control – HaH, 0.215) is marked by the dashed, vertical gray line. |
Discussion
In this study, 36.3% of patients in the traditional hospital setting were recommended for SAR while only 14.8% of patients in a HaH program received this recommendation. This main finding—fewer recommendations for SAR in the HaH group than in the control group—held when we controlled for differences in sample size, age, and diagnosis (MS DRGs).
We compared recommendations for SAR between the groups because this metric indicates the need for additional therapy upon discharge based on a physician’s assessment of the patient. This physical assessment is made prior to the patient’s discharge from acute care. Several studies investigating outcomes for HaH patients used readmission rates between 3 and 12 months from discharge14,15,26 as a point of comparison, which offers a longer-term view of the patient than the metric we used in this study. Future work may consider the implications of acute care at home on short and long time scales.
SAR is often recommended for patients following acute care when the patient requires physical therapy before returning home.24 One possibility is that HaH patients ambulate more than patients in the traditional hospital setting, contributing to the reduced need for SAR for HaH patients. Indeed, older patients in the hospital have lower activity levels and more severe comorbidities.27 However, a direct comparison of activity levels for HaH and traditional patients has yet to be systematically investigated.28 A second possible reason for the reduced need for SAR for HaH patients is lower rates of delirium. Prior work has shown lower rates of delirium in elderly patients treated at home compared to those in the hospital.29 Lastly, greater patient satisfaction with the comfort and convenience of care at home compared to in the hospital could possibly contribute to the reduced need for additional care.30
The decreased need for SAR in HaH patients in this study was based on a patient population with various diagnoses—41 distinct MS DRGs. Here, we were limited in our ability to investigate how recommendations for SAR may vary by diagnosis because of the size of the HaH patient group.
In the HaH group, there were 31 MS DRGs for which there were fewer than 10 patients. Future work may more closely consider how outcomes for HaH patients vary for the most common diagnoses of patients admitted to HaH programs.31 Furthermore, differences in outcomes between HaH patients and traditional inpatients may depend on patient age. One possibility is that the gap in outcomes is even greater among older patients than among younger patients. The results from this study hint at this possibility, as the age-matched analysis was based on an older control group than the original control and the difference in SAR recommendations was even greater than the original comparison (Figure 5). Given the sample size of the HaH patient group, we were unable to consider this possibility on a finer scale.
Conclusion
We observed that patients in Virtua Health’s HaH program were recommended for SAR (14.8%) at less than half of the rate of inpatients in the traditional brick-and-mortar hospital (36.3%). We were limited in our ability to systematically investigate how the reduced need for SAR varied by patient age and diagnosis given the sample of the HaH patient group, though results hinted at some variability with these factors considered. Future work may investigate how health outcomes for HaH patients vary with demographic and clinical factors, as well as the reasons that HaH patient outcomes may differ from traditional inpatients. The positive outcomes observed for HaH patients in this study suggest that acute care in the home may be a promising alternative for patients with certain diagnoses. Future research on health outcomes for HaH patients could not only enhance our understanding of this alternative care model but also provide insights into how best to implement this approach in practice.
Disclosure
The authors report no conflicts of interest in this work.
References
1. Leff B, Burton JR. Acute medical care in the home. J Am Geriatr Soc. 1996;44(5):603–605. doi:10.1111/j.1532-5415.1996.tb01452.x
2. Leff B, Burton JR. Future directions: alternative approaches to traditional hospital care—home hospital. Clin Geriatr Med. 1998;14(4):851–862. doi:10.1016/S0749-0690(18)30095-8
3. Leff B. Defining and disseminating the hospital-at-home model. CMAJ. 2009;180(2):156–157. doi:10.1503/cmaj.081891
4. “Hospital at home” programs improve outcomes, lower costs but face resistance from providers and payers. Available from: https://www.commonwealthfund.org/publications/newsletter-article/hospital-home-programs-improve-outcomes-lower-costs-face-resistance.
5. Acute hospital care at home resources. Available from: https://qualitynet.cms.gov/acute-hospital-care-at-home/resources.
6. AHA. Hospital-at-Home. Available from: https://www.aha.org/hospitalathome.
7. CMS. Additional background: sweeping regulatory changes to help U.S. Healthcare system address COVID-19 patient surge. Available from: https://www.cms.gov/newsroom/fact-sheets/additional-backgroundsweeping-regulatory-changes-help-us-healthcare-system-address-covid-19-patient.
8. Clarke DV, Newsam J, Olson DP, Adams D, Wolfe AJ, Fleisher LA. Acute hospital care at home: the CMS waiver experience. NEJM Catal. 2021. doi:10.1056/CAT.21.0338
9. Batt R, Appelbaum E. The new hospital-at-home movement: opportunity or threat for patient care? Public Policy Aging Rep. 2023;33(2):63–69. doi:10.1093/ppar/prad004
10. Patel HY, West DJ. Hospital at home: an evolving model for comprehensive healthcare. Glob J Qual Saf Healthc. 2021;4(4):141–146. doi:10.36401/JQSH-21-4
11. Rickert J. On patient safety: hospital-at-home care seems like a winner, but is it safe for our patients? Clin Orthop Relat Res. 2022;480(2):237. doi:10.1097/CORR.0000000000002101
12. Federman AD, Soones T, DeCherrie LV, Leff B, Siu AL. Association of a bundled hospital-at-home and 30-day postacute transitional care program with clinical outcomes and patient experiences. JAMA Intern Med. 2018;178(8):1033–1040. doi:10.1001/jamainternmed.2018.2562
13. Levine DM, Ouchi K, Blanchfield B, et al. Hospital-level care at home for acutely ill adults. Ann Intern Med. 2020;172(2):77–85. doi:10.7326/M19-0600
14. Cai S, Intrator O, Chan C, et al. Association of costs and days at home with transfer hospital in home. JAMA Netw Open. 2021;4(6):e2114920. doi:10.1001/jamanetworkopen.2021.14920
15. Shepperd S, Iliffe S, Doll HA, et al. Admission avoidance hospital at home. Cochrane Database Syst Rev. 2016;2016. doi:10.1002/14651858.CD007491.pub2
16. Cryer L, Shannon SB, Van amsterdam M, Leff B. Costs for ‘hospital at home’ patients were 19 percent lower, with equal or better outcomes compared to similar inpatients. Health Aff. 2012;31(6):1237–1243. doi:10.1377/hlthaff.2011.1132
17. Cai S, Grubbs A, Makineni R, Kinosian B, Phibbs CS, Intrator O. Evaluation of the Cincinnati veterans affairs medical center hospital-in-home program. J Am Geriatr Soc. 2018;66(7):1392–1398. doi:10.1111/jgs.15382
18. Goossens LMA, Vemer P, Rutten-van Mölken MP. The risk of overestimating cost savings from hospital-at-home schemes: a literature review. Int J Nurs Stud. 2020;109:103652. doi:10.1016/j.ijnurstu.2020.103652
19. Maniaci MJ, Torres-Guzman RA, Garcia JP, et al. Overall patient experience with a virtual hybrid hospital at home program; 2022. Available from: https://journals.sagepub.com/doi/full/10.1177/20503121221092589.
20. Bodenheimer T, Sinsky C. From triple to quadruple AIM: care of the patient requires care of the provider. Ann Fam Med. 2014;12(6):573–576. doi:10.1370/afm.1713
21. Maniaci MJ, Maita K, Torres-Guzman RA, et al. Provider evaluation of a novel virtual hybrid hospital at home model. Int J Gen Med. 2022;15:1909–1918. doi:10.2147/IJGM.S354101
22. Hospital at home program expands to all virtua health hospitals. Available from: https://www.virtua.org:443/news/hospital-at-home-program-expands-to-all-virtua-hospitals.
23. Virtua health hospital at home. Available from: https://www.virtua.org:443/services/hospital-at-home.
24. Silver KH. Nursing Home Care and Subacute Rehabilitation. In: Friedman JD, editor. Physical Medicine & Rehabilitation Pocket Companion. Demos Medical Publishing; 2011.
25. van Aken B, Trajanovska I, Siu A, Mayrdorfer M, Budde K, Loeser A. Assertion detection in clinical notes: medical language models to the rescue? In:
26. Paulson MR, Shulman EP, Dunn AN, et al. Implementation of a virtual and in-person hybrid hospital-at-home model in two geographically separate regions utilizing a single command center: a descriptive cohort study. BMC Health Serv Res. 2023;23(1):139. doi:10.1186/s12913-023-09144-w
27. Beveridge C, Knutson K, Spampinato L, et al. Daytime physical activity and sleep in hospitalized older adults: association with demographic characteristics and disease severity. J Am Geriatr Soc. 2015;63(7):1391–1400. doi:10.1111/jgs.13520
28. Scott J, Abaraogu UO, Ellis G, Giné-Garriga M, Skelton DA. A systematic review of the physical activity levels of acutely ill older adults in hospital at home settings: an under-researched field. Eur Geriatr Med. 2021;12(2):227–238. doi:10.1007/s41999-020-00414-y
29. Isaia G, Astengo MA, Tibaldi V, et al. Delirium in elderly home-treated patients: a prospective study with 6-month follow-up. Age Dordr Neth. 2009;31(2):109–117. doi:10.1007/s11357-009-9086-3
30. Leff B, Burton L, Mader S, et al. Satisfaction with hospital at home care. J Am Geriatr Soc. 2006;54(9):1355–1363. doi:10.1111/j.1532-5415.2006.00855.x
31. Maniaci MJ, Cowdell JC, Maita K, et al. Diagnosis Related Groups of Patients Admitted from an Urban Academic Medical Center to a Virtual Hybrid Hospital-at-Home Program. Risk Manag Healthc Policy. 2023;16:759–768. doi:10.2147/RMHP.S402355
 © 2023 The Author(s). This work is published and licensed by Dove Medical Press Limited. The full terms of this license are available at https://www.dovepress.com/terms.php and incorporate the Creative Commons Attribution - Non Commercial (unported, v3.0) License.
By accessing the work you hereby accept the Terms. Non-commercial uses of the work are permitted without any further permission from Dove Medical Press Limited, provided the work is properly attributed. For permission for commercial use of this work, please see paragraphs 4.2 and 5 of our Terms.
© 2023 The Author(s). This work is published and licensed by Dove Medical Press Limited. The full terms of this license are available at https://www.dovepress.com/terms.php and incorporate the Creative Commons Attribution - Non Commercial (unported, v3.0) License.
By accessing the work you hereby accept the Terms. Non-commercial uses of the work are permitted without any further permission from Dove Medical Press Limited, provided the work is properly attributed. For permission for commercial use of this work, please see paragraphs 4.2 and 5 of our Terms.