Back to Journals » Journal of Inflammation Research » Volume 16
The Flow Cytometric Analysis of Peripheral Blood Lymphocytes and Expression of HLA II Molecules in Lymphocyte During Acute Rejection After Renal Transplantation
Authors Guo J, Qin C, Li X, Zhuang X
Received 27 February 2023
Accepted for publication 2 June 2023
Published 19 June 2023 Volume 2023:16 Pages 2607—2613
DOI https://doi.org/10.2147/JIR.S410341
Checked for plagiarism Yes
Review by Single anonymous peer review
Peer reviewer comments 2
Editor who approved publication: Professor Ning Quan
Jianzhuang Guo,1 Chengwei Qin,2 Xiangdong Li,1 Xiaoxuan Zhuang3
1Department of Clinical Laboratory, The First Affiliated Hospital of Shandong First Medical University (Shandong Provincial Qianfoshan Hospital), Jinan, Shandong, People’s Republic of China; 2Department of Anesthesiology, Shandong Second Provincial General Hospital, Jinan, Shandong, People’s Republic of China; 3International Medical College of Chongqing Medical University, Chongqing, People’s Republic of China
Correspondence: Xiangdong Li; Chengwei Qin, Email [email protected]; [email protected]
Objective: To investigate the changes in the proportion of peripheral blood lymphocytes and the expression of HLA II molecules in lymphocytes during acute rejection after renal transplantation.
Methods: Thirty-five patients who had undergone renal transplantation were selected. Eighteen patients with clinical and pathological confirmed acute rejection were selected as the test group, and twelve patients without clinical acute rejection symptoms were selected as the control group. Flow cytometry analysis was used to determine the proportion of peripheral blood lymphocytes. The mRNA and protein expression of HLA II molecules on peripheral blood lymphocytes were detected using real-time fluorescence quantification and immunoblotting, respectively.
Results: The proportion of T lymphocytes, B lymphocytes, and CD4CD8 double positive T cells in the Control Group were 67.48% ± 5.35%, 10.82% ± 1.26%, and 0.88% ± 0.06%, respectively, and in the Test Group were 87.52% ± 6.28%, 3.36% ± 0.26%, and 0.34% ± 0.03%, with a significant difference respectively. The mRNA and protein expressions of HLA II molecules of peripheral blood B lymphocytes in the control group were significantly higher that these in the test group.
Conclusion: The proportion of peripheral blood T lymphocytes, B lymphocytes, CD4CD8 double positive T cells, and the expression of HLA II molecules of peripheral blood lymphocytes can all indicate the occurrence of acute renal transplantation rejection, which were exceedingly useful to clinicians in judging the acute rejection of renal transplantation in the early stages.
Keywords: acute rejection, HLA II molecules, kidney transplantation, peripheral blood lymphocytes, flow cytometric analysis
Introduction
Kidney transplantation is the best method to treat chronic renal failure presently, as it significantly improves the quality of life of patients suffering from kidney disease. Currently, kidney transplantation is widely and successfully used, and there are numerous studies on this procedure.1–4 Acute rejection is the most common transplantation failure within 3 months after kidney transplantation. It is also referred to as acute cellular rejection due to cellular immune mechanism in the early stages. The main causes of acute rejection are delayed type hypersensitive inflammation mediated by CD4+T cells and specific killing of transplantation cells mediated by CD8+T cells.
Acute rejection of kidney transplantation easily causes kidney transplantation failure, so it is very important to detect acute rejection at an early stage and take effective treatment measures. At present, clinicians estimate acute rejection of kidney transplantation based on the following indications: 1. The clinical indications are kidney swelling and tenderness, fever, fatigue, decreased urine output, weight gain, and increased blood pressure. 2. Serum creatinine and urea nitrogen levels increase in the renal function test. 3. The increase of transplanted kidney and the resistance index can be found with Color Doppler ultrasonography. 4. Renal scan reveals decreased renal blood flow. In general, the above methods have several limitations, poor sensitivity and specificity, and cannot detect acute rejection in time.5 The final diagnosis of acute rejection depends on the pathological changes caused by acute rejection, which can only be detected from a renal biopsy. However, pathological examination is traumatic and unlikely to be widely popularized. Therefore, it is imperative to find early sensitive and specific non-invasive examination indicators.6
In this study, we selected 30 patients with acute rejection of renal transplantation. Peripheral venous blood was drawn and analyzed using flow cytometry and the expression of HLA II molecules was confirmed by RT-PCR and Western blot, to evaluate their effect on the acute rejection of kidney transplantation in the early stages.
Materials and Methods
Selection of Patients in the Test Group
Thirty-five patients (aged 51.2 years on average) were selected for daily observation within 3 months after renal transplantation. If the patients had clinical indications with symptoms like renal swelling and tenderness, fever, fatigue, decreased urine output, weight gain, and increased blood pressure, and the serum creatinine and urea nitrogen levels increased in renal function tests, the patients were listed as key subjects. After screening, 23 patients with the above indications were selected as key subjects and were listed as the Test Group, and the remaining 12 patients were grouped as non-key subjects and were listed as the Control Group. This study was approved by the Ethics Committee of Shandong Province Qianfoshan Hospital. Additionally, this study was conducted in accordance with the Declaration of Istanbul, and all organs were donated voluntarily with written informed consent.
Renal Biopsy
After administering local anesthesia, 23 key subjects and 1 subject from the Control Group underwent an ultrasound B scan-guided renal biopsy in which a small piece of kidney tissue with a diameter of 2 mm and a length of 1.5–2.0 cm was taken out through a renal puncture needle. Then, the tissue blocks were dehydrated, made transparent, embedded, waxed, and sectioned using a pathological microtome, and we used the hematoxylin eosin staining method to make renal puncture pathological films. When compared with normal subjects, there were no pathological changes in renal puncture, and 18 of the 23 key subjects showed obvious edema of renal interstitium with much cell infiltration under the microscope. This included mainly monocytes and lymphocytes, and many monocytes in glomeruli and peritubular capillaries. The above pathological changes confirmed that these 18 renal transplant patients had acute renal transplant rejection, and so the Test Group was revised to only include these 18 patients.
Drawing of Peripheral Venous Blood
For the 18 patients in the Test Group, 10 mL peripheral venous blood was drawn with EDTAK2 anticoagulant tube, of which 2 mL venous blood was used for blood routine detection of lymphocyte values (using a Sysmex XN-1000 automatic blood analyzer), 2 mL venous blood was used for flow cytometry analysis of lymphocytes, and 6 mL venous blood was used for extraction of peripheral blood lymphocytes. At the same time, 10 mL of peripheral venous blood was taken from the 12 patients in the Control Group and anticoagulated with EDTAK2. Similarly, 2 mL of venous blood was used for blood routine detection of lymphocyte values, 2 mL of venous blood was used for flow cytometry analysis of lymphocytes, and 6 mL of venous blood was used for extraction of peripheral blood lymphocytes.
Flow Cytometry Analysis
Peripheral venous blood of the 12 patients in the Control Group and 18 patients in the Test Group were collected for 100 μL plus 10 μL (CD3, CD4, CD8, and CD19, etc.) monoclonal antibody reagent (Biovision, USA). After reaction in the dark at room temperature for 20 minutes, 2 mL hemolytic agent was added to the whole blood sample, and centrifuged for 5 minutes. Then, the supernatant was removed and diluted with 1.0 mL PBS, mixed well and placed on the machine (BD FACSCanto II) to detect the proportion of T lymphocytes, B lymphocytes, and CD4CD8 double positive T cells.
Real-Time Fluorescence Quantitative Detection of HLA II Molecules mRNA Expression in Peripheral Blood Lymphocytes
We used human lymphocyte isolation solution to extract peripheral blood lymphocytes. Lymphocyte RNA was extracted according to the instructions provided in the Trizol Extraction Kit (Invitrogen). The absorbance value of total RNA was detected by UV spectrophotometry. OD260/280 was 1.8–2.0, indicating high RNA purity. Then, the RNA concentration was calculated according to the OD value. The mRNA expression was amplified with a Lighter Cycler 2.0 fluorescent real-time quantitative PCR instrument, and all reactions were conducted with the SYBR Green I chimeric fluorescent real-time PCR kit of TaKaRa Company. The upstream and downstream primers of HLAII molecular genes were designed. The primer sequences covered HLA (DQA1/DQB1 and DPA1/DPB1), and the primers spanned exons 3 and 4 to ensure the non-polymorphic regions of the gene and to exclude possible DNA contamination in the RNA samples. The following primer sequences were applied for cDNA amplification: upstream primer: 5’-gctattgatgggtctcaccc-3’, downstream primer: 5’-caggacgtcaaggtacagga-3’. β-actin (as internal reference), upstream primer: 5’-cgtgcgggacatcaagga-3’, downstream primer: 5’-aggaaggagggctggaaca-3’. Reaction conditions: the PCR cycle was started after pre-denaturation at 95 °C for 30s. The cycle parameters were denaturation at 95 °C for 5s, annealing at 55 °C for 20s, extension at 72 °C for 15s, amplification for 60 cycles, and detection of fluorescence signal at the extension stage. The melting curves were analyzed at 95 °C for 10s, 65 °C for 30s, and 95 °C for 10s. The mRNA expression of HLA II molecules was measured according to 2- Δ CT value method.
Immunoblot Tests
Human lymphocyte isolation solution was used to extract peripheral blood lymphocytes and total protein, and to calculate the protein content, and 50 µg of total protein was loaded and electrophoresed on a 10% polybrene amide gel. The film was developed with electro chemiluminescence (ECL) reagent and monoclonal antibody against HLA II molecules (Abnova). The film was photographed, and the computer image was analyzed according to the band density. We used the HLA II molecules/β-Actin (Santa Cruz) ratio for relative quantitative analysis.
Statistical Treatment
All data were expressed as mean ± SD and were processed with SPSS 17.0 software package for t-test between groups. P < 0.05 indicated an obvious difference, and P < 0.01 indicated a significant difference.
Results
- There were no significant differences between group in the baseline characteristics of the enrolled patients, including the gender, age, donor age, number of previous transplants and ischemia-reperfusion time. The total number of peripheral blood lymphocytes in the Control Group was 2.36 ± 0.21x10⁹/L, and the total number of peripheral blood lymphocytes in the Test Group was 2.53 ± 0.23x10⁹/l, P > 0.05, without statistical significance, as shown in Table 1.
- The renal puncture histopathology of the Control Group did not change significantly (Figure 1). Under the microscope, the Test Group showed obvious edema of renal interstitium with sufficient cell infiltration, mainly monocytes and lymphocytes, and many monocytes in glomeruli and peritubular capillaries (Figure 2).
- Flow cytometry analysis results: relative to the total peripheral blood lymph value, the proportion of T lymphocytes in the Control Group was 67.48% ± 5.35%, and the proportion of T lymphocytes in the Test Group was 87.52% ± 6.28%; the proportion of B lymphocytes in the Control Group was 10.82% ± 1.26%, and that in the Test Group was 3.36% ± 0.26%; the proportion of CD4CD8 double positive T cells in the Control Group was 0.88% ± 0.06%, and the proportion of CD4CD8 double positive T cells in the Test Group was 0.34% ± 0.03%. There were significant differences between the Control Group and the Test Group (P = 0.025, 0.028, 0.021), as shown in Table 1 and Figure 3.
- The mRNA expression of HLA II molecules in blood B lymphocytes in the Control Group was 2.43 ± 0.28, which increased to 10.28 ± 1.14 in the Test Group, P < 0.01, with significant difference. The ROC curve analysis showed that the cutoff value of mRNA expression of HLA II molecules for the acute rejection was 9.15 (AUC: 0.98, P < 0.01). Additionally, the expression of HLA II molecular protein in peripheral blood B lymphocytes in the Control Group was 4.42 ± 0.36, which increased to 21.65 ± 2.83 in the Test Group, with significant difference (P < 0.01), as shown in Table 1 and Figure 4.
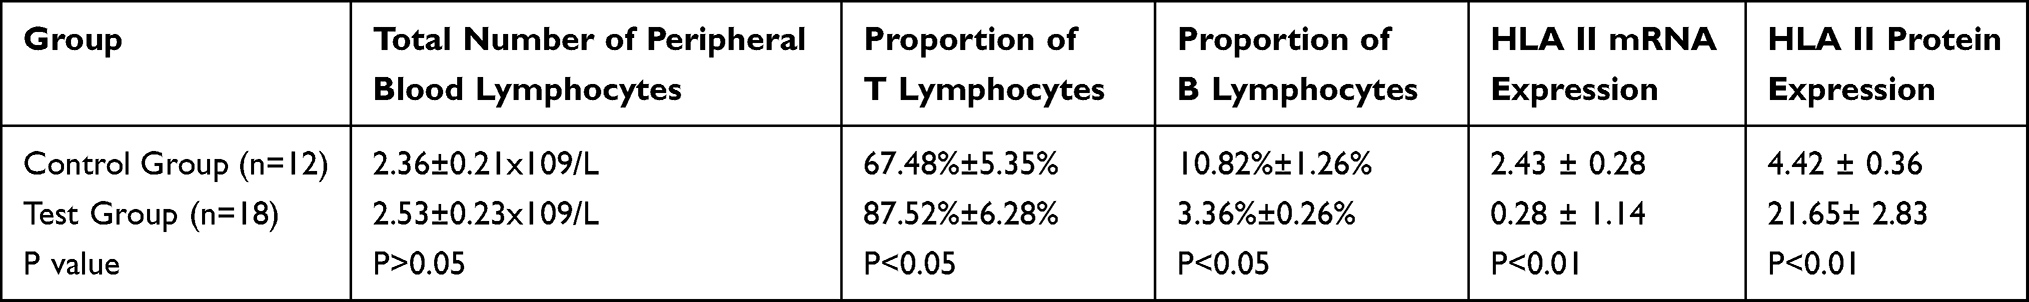 |
Table 1 Total Number of Peripheral Blood Lymphocytes, Proportion of T Lymphocytes, Proportion of B Lymphocytes, and Expression of HLA II mRNA and Protein on the Surface of Peripheral Blood B Lymphocytes in the Control Group and the Test Group |
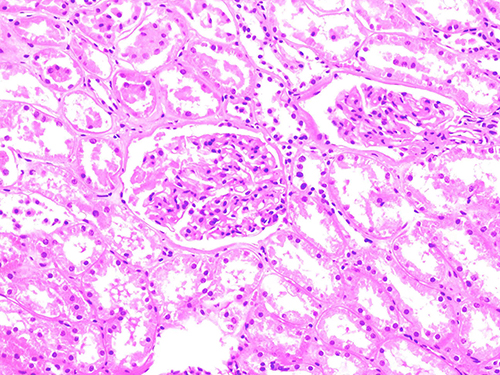 |
Figure 1 Histopathology of renal puncture in the Control Group did not change significantly (x200). |
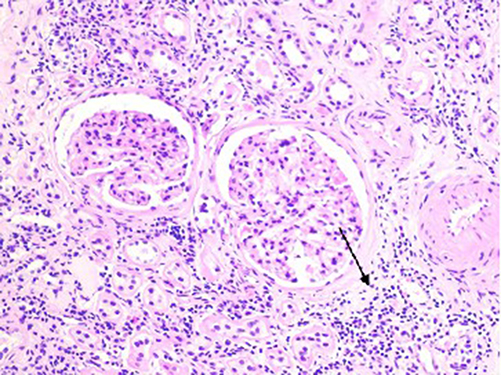 |
Figure 2 Histopathology of renal puncture in the test group showed that the renal interstitium is obviously edematous with much cell infiltration, mainly monocytes and lymphocytes (black arrow, x200). |
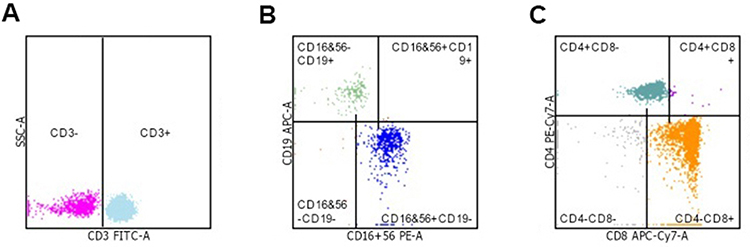 |
Figure 3 The result of flow cytometric analysis of peripheral blood lymphocytes. (A) Proportion of T lymphocytes in test group. (B) Proportion of B lymphocytes in test group. (C) Proportion of CD4CD8 double positive T cells in test group. |
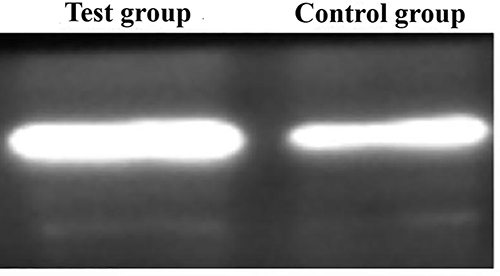 |
Figure 4 Expression of HLA II protein in peripheral blood B lymphocytes. |
Discussion
Although kidney transplantation is a very popular option to treat kidney disease, acute rejection is most likely to occur within 3 months after the transplant.7–9 Acute rejection of kidney transplantation is a serious condition, as it can easily lead to fever, blood in urine, and other systemic symptoms, but also cause abdominal distension, abdominal pain, and even necrosis of the transplanted kidney leading to much harm. Therefore, early detection of acute rejection and subsequent effective treatment are critical, which is the key to the success of the kidney transplantation.
At present, clinicians evaluate the acute rejection of renal transplantation mainly based on the patients’ clinical indications, such as kidney swelling and tenderness, fever, fatigue, decreased urine output, weight gain, and increased blood pressure, and the results of the corresponding renal function tests, such as serum creatinine and urea nitrogen levels. These evaluation methods have poor sensitivity and specificity and cannot detect acute rejection of kidney transplantation in time and accurately.10–12 In this study, 35 patients who had undergone renal transplantation were selected and it was observed that 23 patients had clinical acute rejection, but only 18 patients had true acute rejection, as confirmed pathologically. This showed that the current method for clinicians to evaluate acute rejection of kidney transplantation is not ideal.
There was no significant difference in the total number of peripheral blood lymphocytes between the 18 patients with acute rejection of renal transplantation and the Control Group, but from the flow cytometry analysis, we observed that the proportion of T lymphocytes increased, the corresponding proportion of B lymphocytes decreased, and the proportion of CD4CD8 double positive T cells decreased. T lymphocytes are multipotent stem cells derived from bone marrow. In human embryonic and neonatal stages, a part of pluripotent stem cells or pre-T cells present in the bone marrow migrate into the thymus, where they differentiate and mature under the induction of the thymic hormone and become T cells whose function is immune activity. Mature T cells are distributed to the thymus-dependent area of peripheral immune organs through blood flow and can be recycled through lymphatic vessels, peripheral blood, and tissue fluid to offer cellular immunity and immune regulation functions. CD4CD8 double positive T cells are immature T cells in the thymus—their cell membrane surface expresses both CD4 and CD8 molecules, and they are formed after the development of double negative cells.13,14
CD8+ cytotoxic T cell precursor cells were activated and proliferated into mature cytotoxic T cells after binding with donor HLA I antigen, which had an aggressive effect on the transplantation; CD4 + T helper cells recognize donor HLA II antigens and promote antigen-presenting cells to release IL-1, promoting T helper cell proliferation and releasing IL-2, which further boosts T helper cell proliferation and provides auxiliary signals for the differentiation of cytotoxic T cells. Except for IL-2, T cells can also produce IL-4 and IL-5, promote B cell differentiation, and produce anti-transplantation antibodies, which cause transplantation rejection.15–17 As several CD4+T helper cells and CD8+ cytotoxic T cells participate in acute rejection, the proportion of T cells in peripheral blood increases and the proportion of lymphocytes decreases. Several T cells participate in acute rejection, resulting in insufficient supply of T cells in the thymus, and the corresponding reduction of mature and immature T cells in the thymus. Therefore, the proportion of CD4CD8 double positive T cells in peripheral blood also decreases.
HLA II molecules are composited by the Chain α and Chain β encoded by HLA genes, and the extracellular segment includes α1, α2, β1, and β2 domains. HLA II molecules are distributed on the surface of professional antigen-presenting cells, activated T cells, and thymic epithelial cells. HLA I and HLA II antigens are expressed on the cell membrane of T cells, of which HLA I antigens are expressed on the surface of T cells at all development stages, while resting T cells have no HLA II antigens, but they can be expressed after T cell activation.18,19 When acute rejection occurs in renal transplantation, the proportion of activated T cells increases due to increased proportion of T lymphocytes, and the corresponding mRNA and protein expression of HLA II molecules also increases. Real-time fluorescent quantitative PCR was applied to detect the mRNA expression of HLA II molecules in peripheral blood B lymphocytes. As HLA II molecules are composed of DQA1/DQB1 or DPA1/DPB1, special primers with primer sequences covering DQA1/DQB1 and DPA1/DPB1 were designed, so that the mRNA expression of HLA II molecules in the peripheral blood B lymphocytes could be detected.20 As the monoclonal antibodies against HLA I molecules produced by Abnova Company contain HLA (DR, DP, and DQ), the protein expression of HLA II molecules in peripheral blood B lymphocytes was detected in the immunoblot test.
In conclusion, when acute rejection occurred after renal transplantation, the proportion of T lymphocytes increased, the corresponding proportion of B lymphocytes decreased, and the proportion of CD4CD8 double positive T cells decreased, as well as the expression of HLA II molecules in peripheral blood lymphocytes decreased. These indicators suggest the possibility of acute rejection, especially the mRNA expression of HLA II molecules in peripheral blood lymphocytes. This is relatively specific and highly operable and can be immensely helpful to clinicians in evaluating the acute rejection of kidney transplantation in the early stages.
Abbreviations
HLA II, human leukocyte antigen II; RNA, ribonucleic acid; mRNA, messenger ribonucleic acid; CD, cluster differentiation antigen; EDTAK2, dipotassium ethylenediaminetetraacetate; OD, optical density; PCR, polymerase chain reaction; IL, interleukin.
Data Sharing Statement
The datasets used and/or analysed during the current study are available from the corresponding author on reasonable request.
Ethics Approval and Consent to Participate
This study was conducted with approval from the Ethics Committee of Shandong Provincial Qianfoshan Hospital. This study was conducted in accordance with the declaration of Helsinki. Written informed consent was obtained from all participants.
Acknowledgments
We would like to acknowledge the hard and dedicated work of all the staff that implemented the intervention and evaluation components of the study.
Funding
No external funding received to conduct this study.
Disclosure
The authors declare that they have no competing interests.
References
1. Ekamol Tantisattamo MZ, Molnar BT, Ho UG, et al. Approach and management of hypertension after kidney transplantation. Front Med. 2020;7:229. doi:10.3389/fmed.2020.00229
2. Ekamol Tantisattamo RM, Hanna UG, Reddy HI, Dafoe DC, Danovitch GM, Kalantar-Zadeh K. Novel options for failing allograft in kidney transplanted patients to avoid or defer dialysis therapy. Curr Opin Nephrol Hypertens. 2020;29(1):80–91. doi:10.1097/MNH.0000000000000572
3. Uwe Heemann DA, Hesselink AL, Oberbauer R, et al. Allograft function as endpoint for clinical trials in kidney transplantation. Transpl Int. 2022;35:10139. doi:10.3389/ti.2022.10139
4. Lebraud E, Eloudzeri M, Rabant M, Lamarthée B, Anglicheau D. Microvascular inflammation of the renal allograft: a reappraisal of the underlying mechanisms. Front Immunol. 2022;13:864730. doi:10.3389/fimmu.2022.864730
5. Quaglia M, Merlotti G, Guglielmetti G, Castellano G, Cantaluppi V. Recent advances on biomarkers of early and late kidney graft dysfunction. Int J Mol Sci. 2020;21(15):5404. doi:10.3390/ijms21155404
6. Ramalhete LM, Araújo R, Aníbal Ferreira CR, Calado C. Proteomics for biomarker discovery for diagnosis and prognosis of kidney transplantation rejection. Proteomes. 2022;10(3):24. doi:10.3390/proteomes10030024
7. Varnell CD
8. Fekih RE, Hurley J, Tadigotla V, et al. Discovery and validation of a urinary exosome mRNA signature for the diagnosis of human kidney transplant rejection. J Am Soc Nephrol. 2021;32(4):994–1004. doi:10.1681/ASN.2020060850
9. Cooper JE. Evaluation and treatment of acute rejection in kidney allografts. Clin J Am Soc Nephrol. 2020;15(3):430–438. doi:10.2215/CJN.11991019
10. Hautz T, Messner F, Weissenbacher A, et al. Long‐term outcome after hand and forearm transplantation – a retrospective study. Transpl Int. 2020;33(12):1762–1778. doi:10.1111/tri.13752
11. Jeong HJ. Diagnosis of renal transplant rejection: Banff classification and beyond. Kidney Res Clin Pract. 2020;39(1):17–31. doi:10.23876/j.krcp.20.003
12. Zhang H, Wang Z, Zhang J, et al. Combined immunotherapy with belatacept and BTLA overexpression attenuates acute rejection following kidney transplantation. Front Immunol. 2021;12:618737. doi:10.3389/fimmu.2021.618737
13. Diedrich CR, Gideon HP, Rutledge T, Baranowski TM, Pauline Maiello AJ, Lin MPL. CD4CD8 double positive T cell responses during Mycobacterium tuberculosis infection in cynomolgus macaques. J Med Primatol. 2019;48(2):82–89. doi:10.1111/jmp.12399
14. Zhang H, Wang Y, Ying M, et al. Increased CD4+CD8+ double positive T cells during hantaan virus infection. Viruses. 2022;14(10):2243. doi:10.3390/v14102243
15. Chen Y, Zhang B, Liu T, Chen X, Wang Y, Zhang H. T cells with activated STAT4 drive the high-risk rejection state to renal allograft failure after kidney transplantation. Front Immunol. 2022;13:895762. doi:10.3389/fimmu.2022.895762
16. Toshihito Hirai AT, Mayer TW, Po-Yu Lin N, et al. Imaging alloreactive T cells provides early warning of organ transplant rejection. JCI Insight. 2021;6(13):e145360. doi:10.1172/jci.insight.145360
17. Borges TJ, Phammela Abarzua RB, Gassen BK, et al. T cell-attracting CCL18 chemokine is a dominant rejection signal during limb transplantation. Cell Rep Med. 2022;3(3):100559. doi:10.1016/j.xcrm.2022.100559
18. Wang J, Jelcic I, Mühlenbruch L, et al. HLA-DR15 molecules jointly shape an autoreactive T cell repertoire in multiple sclerosis. Cell. 2020;183(5):1264–1281. doi:10.1016/j.cell.2020.09.054
19. Wesley Huisman DA, Leboux T, van der Maarel LE, et al. Magnitude of Off-Target Allo-HLA reactivity by third-party donor-derived virus-specific T cells is dictated by HLA-restriction. Front Immunol. 2021;12:630440. doi:10.3389/fimmu.2021.630440
20. McKinney DM, Southwood S, Hinz D, et al. A strategy to determine HLA class II restriction broadly covering the DR, DP and DQ allelic variants most commonly expressed in the general population. Immunogenetics. 2013;65(5):357–370. doi:10.1007/s00251-013-0684-y
 © 2023 The Author(s). This work is published and licensed by Dove Medical Press Limited. The
full terms of this license are available at https://www.dovepress.com/terms
and incorporate the Creative Commons Attribution
- Non Commercial (unported, 3.0) License.
By accessing the work you hereby accept the Terms. Non-commercial uses of the work are permitted
without any further permission from Dove Medical Press Limited, provided the work is properly
attributed. For permission for commercial use of this work, please see paragraphs 4.2 and 5 of our Terms.
© 2023 The Author(s). This work is published and licensed by Dove Medical Press Limited. The
full terms of this license are available at https://www.dovepress.com/terms
and incorporate the Creative Commons Attribution
- Non Commercial (unported, 3.0) License.
By accessing the work you hereby accept the Terms. Non-commercial uses of the work are permitted
without any further permission from Dove Medical Press Limited, provided the work is properly
attributed. For permission for commercial use of this work, please see paragraphs 4.2 and 5 of our Terms.
Recommended articles
Association Between Perioperative Dexmedetomidine Exposure and Post-Transplant Renal Outcomes: A Retrospective Analysis
Hung KC, Yu TS, Ho CN, Yu CH, Lai YC, Chang YJ, Chen IW
Drug Design, Development and Therapy 2026, 20:581944
Published Date: 25 February 2026